Gå til hovedinnhold
Havforskningsinstituttet
HI
English
<- Tilbake
Søk
Søk
Søk
View page in English
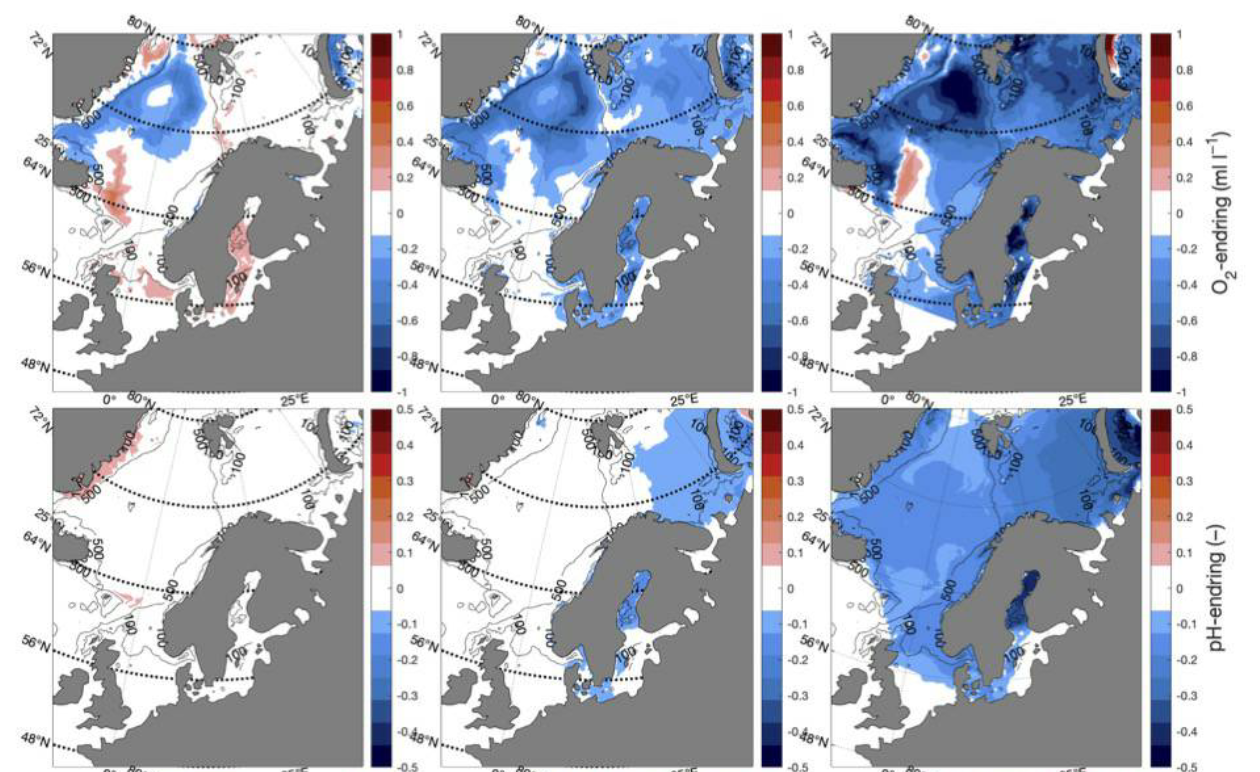
Figur
Fra rapporten:
Panel-based Assessment of Ecosystem Condition of the Norwegian Sea Pelagic Ecosystem
Figure 7.3.7. Spatial distribution of changes in oxygen (ml l-1) and pH (-) for SSP1-2.6, SSP2-4.5, and SSP5-8.5 (left-right) for the period 2015-2100