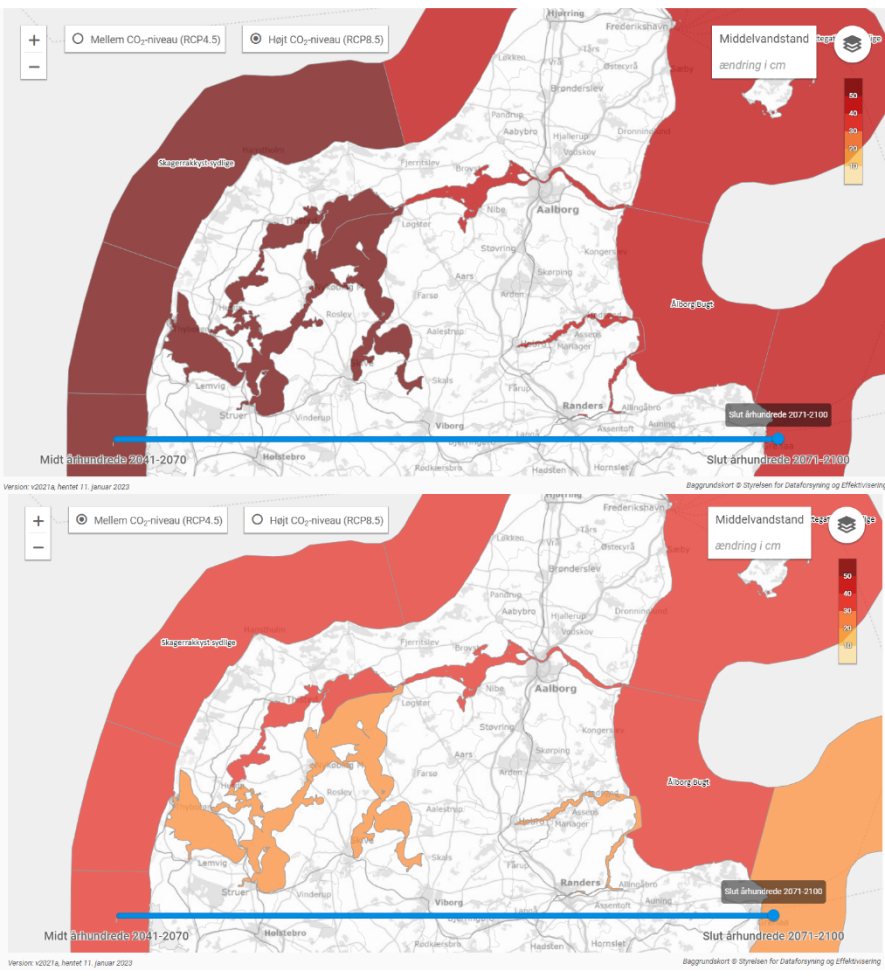
Figure 3. Projected relative changes in sea level from 1981-2010 to 2071-2100 for a moderate (lower panel) and extreme (upper panel) climate scenario with focus on Danish waters. The scale goes from 10 cm (light yellow) – 60 cm (dark red). Information from www.dmi.dk/klima-atlas