Observed and expected future impacts of climate change on marine environment and ecosystems in the Nordic region
Author(s):
Geir Ottersen
, Knut Yngve Børsheim
(IMR), Lars Arneborg (SMHI), Marie Maar (AaU), Vibe Schourup-Kristensen (AaU), Elin Almroth Rosell (SMHI) and Magnus Hieronymus (SMHI)
Observerte og forventede framtidige effekter av klimaendringer på marint miljø og økosystemer i Nordiske havområder
Rapportene til FNs klimapanel er omfattende, grundige og viktige, men de skal dekke hele verden og dette går på bekostning av omfang og presisjon på regional skala. Spesifikt er Norden ikke dekket som et eget område eller egenskaper ved de ulike havene våre trukket særlig fram. Det er særlig utilfredsstillende at de globale modellene som brukes for å simulere framtidig klima og klimaeffekter ikke har høy nok romlig oppløsning til å tjene som et godt grunnlag for beslutninger på nordisk skala. På denne bakgrunn så Nordisk Ministerråd et behov for økt kunnskap om effekter av klimaendringer på nordiske havområder. Det resulterte i prosjektet «Nordiske klimascenarioer» (NorScen), som løper fra 2022 til 2024 og er initiert og finansiert av Ministerrådet.
Denne rapporten er første leveranse i prosjektet. Her presenterer vi en tematisk ordnet kunnskapsoversikt på dagens status og forventet framtidig tilstand når klimaendringer har slått inn for fullt på fysiske egenskaper og ulike former for marint liv i havområdene rundt Norden. Vi skriver gjennomgående at framtidig forhold vil være betinget av klimascenarioet. Klimascenarier er et redskap FNs klimapanel benytter for å synliggjøre at framtidsutviklingen er svært avhengig av i hvilken grad vi, i dag og i nærmeste framtid, er i stand til å redusere utslipp av drivhusgasser.
Havnivåstigning
Det globale havnivået stiger som følge av klimaendringer. Dette skyldes foreløpig mest «termisk ekspansjon», altså at varmere vann tar mer plass enn kaldere. På sikt regner en med at smelting av is på land, særlig fra de enorme ismassene på Grønland og i Antarktis, vil gi enda større bidrag. Havet vil generelt, og også i de nordiske hav- og kystområder, stige vesentlig mer under de mest alvorlige klimascenarioene enn om vi klarer å begrense utslippene. I Norden er det dessuten en annen svært viktig faktor som gjør at økningen i havnivå vil variere mye fra område til område. Landet hever seg fortsatt etter at det var dekket av et opptil 3 km tykt islag under forrige istid, men denne hevingen er svært ujevn geografisk. Østersjøen var dekket av mer is enn Osloområdet som igjen hadde mer is enn det norske Vestlandet. Dette gjør at estimert havnivåstigning for perioden fra 1986-2005 til 2100 under et middels klimascenario er 38 cm i Stavanger, men 0 i Oslo. Tilsvarende forventer en 50 cm hevning i København, men en nedgang i vannstand på ca. 35 cm nord i Østersjøen.
Økt havtemperatur og antall ekstremepisoder
Globalt har havtemperaturen økt med 0.88 °C siden før den industrielle revolusjon. I Nord-atlanteren har økningen vært omtrent den samme. I tillegg til en relativt svak gradvis trend så er det naturlige fluktuasjoner på ulike tidsskalaer. Estimatene for framtidig utvikling avhenger av scenarioet en ser på, men også mellom de ulike modellene – noe som avspeiler ganske stor usikkerhet i estimatene. En studie, basert på mange ulike modeller, ga et estimat på en økning i overflatetemperaturen om sommeren på 0.4°C per dekade i Nordsjøen og Norskehavet, men det er under et ekstremt klimascenario. For Østersjøen finner en annen gruppe forfattere en økning fram mot slutten av århundret på 1.1 °C for et lavutslipsscenario og så mye som 3.2 °C ved fortsatt høye utslipp.
Marine hetebølger er episoder med kraftig økning i havtemperatur. Intensitet, varighet og geografisk omfang kan være svært forskjellig, men de har potensiale til å ha stor (negativ) effekt på organismer og økosystemer. En har hatt svære marine hetebølger i bl.a. Stillehavet, men også i våre farvann må en være forberedt. For eksempel har en funnet at årlig frekvens av marine hetebølger i Barentshavet økte med 62% fra perioden fram til 2004 til den etter. Halvparten av alle dager med hetebølgestatus der fra 1982-2020 kom i siste tiåret.
Saltholdighet
I åpne havområder har moderate endringer i saltholdighet stort sett lite å si for marint liv. I Østersjøen er situasjonen en annen. Østersjøen er svært ferskt til å være et hav, særlig i nord dominerer brakkvann. Dette har historisk skapt utfordringer for viktige fiskebestander, ikke minst torsk. Det er dessverre svært vanskelig å estimere framtidig utvikling presist, estimatene varierer fra klar nedgang til liten endring. For Nordsjøen og Skagerrak forventes nedgang i saltholdighet, størst nedgang ved høyutslipsscenarioer.
Havforsuring
Havet har absorbert omtrent en tredjedel av de menneskelige utslippene av CO₂ til atmosfæren. Økende konsentrasjon av CO2 i atmosfæren påvirker surheten i sjøvann, noe som generelt reduserer pH og metningstilstanden til karbonatmineraler (aragonitt og kalsitt). Slike endringer i havkjemien er potensielt en stor utfordring for flere former for marint liv, spesielt koraller og kalkdannende alger, men også sjøsnegler med «harde deler». Likevel, forskerne er uenige om følsomheten til disse artene mhp. forsuring og i hvilken grad de kan tilpasse seg de nye forholdene. I nordiske havområder har havforsuringen gått raskere enn det globale gjennomsnittet. Måleserier siden 1990-tallet viser en signifikant nedgang i pH nesten alle steder i Nordsjøen og Norskehavet der vi har tilstrekkelige data til å undersøke trender. I rapporten viser vi historiske endringer både der og i danske fjorder. Framtidig utvikling er sterkt og direkte avhengig av hvor mye CO2 vi slipper ut globalt framover. Ved de verste scenarioene vil pH i våre havområder i år 2100 bli markert lavere enn i dag.
Reduksjon i havvannets oksygeninnhold
Modellresultater og observasjoner viser at global oppvarming fører til en utvidelse av havområdene med lavt oksygen eller total oksygenmangel. Følgelig vil volumet av habitater for organismer som er avhengige av oksygen krympe. Deoksygeneringshastigheten er langsom i Nord-Atlanteren sammenlignet med andre regioner i verdenshavene. Derfor vil konsekvensene av storskala klimaendringer på oksygennivå være små i de fleste europeiske kystfarvann, lokale mekanismer vil dominerer oksygenbalansen i det 21. århundre.
Østersjøen skiller seg klart ut fra de andre nordiske havområdene ved at det her allerede er alvorlige utfordringer mhp. oksygenmangel. I dypere deler får en kun tilførsel av nytt oksygen i de sjeldne tilfellene der saltere overflatevann fra Nordsjøen kommer inn gjennom de grunne og smale danske stredene. Store mengder næringsstoffer som har samlet seg i systemet i løpet av forrige århundre har forårsaket en situasjon med store algeoppblomstringer som synker til bunnen og forbruker oksygenet med oksygenfattige bunnområder som en konsekvens. Framtidige oksygenforhold er ikke avhengig av klimaendringer alene, modellkjøringer viser at tilførsel av næringssalter fra land er vel så avgjørende. Unntatt ved det verste klimascenarioet kombinert med svært stor næringssalttilførsler forventer en at oksygennivået i Østersjøen blir høyere/bedre ved slutten av århundret enn i dag.
Primærproduksjon
Primærproduksjon, i hovedsak planteplankton, legger grunnlaget for mye av livet i havet. Hvordan klimaendringer påvirker denne produksjonen vil være viktig for alt fra dyreplankton til fisk og hval. Primærproduksjon er avhengig av at næringssalter kommer opp i de øvre lagene der det er lys. Framtidig produksjon avhenger mest av tilgangen på næringssalter, lagdeling i havet, og vindforhold. Utviklingen i nordiske havområder er ulik i nord og sør og denne forskjellen forventes å fortsette framover. Satellittdata viser så langt ingen klimadrevet endring i Norskehavet, en liten økning i Grønlandshavet og en klart økende trend i Polhavet.
I Nordsjøen forventer en at klimaendringer vil redusere primærproduksjonen, et estimat er på hele 30 %. Lenger nord, særlig i områder som hittil er dekket av is store deler av året, forventes en videre økning i planteplanktonproduksjon. Isalger står derimot i fare for å forsvinne helt eller bli sterkt redusert i store områder. Det er vanskelig å kvantifisere effekter langt fram i tid, men de beste modellestimatene gir en dobling av primærproduksjonen i de nordlige delene av Barentshavet fra 2015-2100 i scenarioet med størst klimaendring. Ved scenarioet der vi begrenser drivhusgassutslippene mest forventes derimot små eller ingen endringer i primærproduksjonen. Østersjøen skiller seg ut fra de andre områdene, her er det først og fremst mengden næringssalter tilført fra land som styrer primærproduksjonen.
Sekundærproduksjon – dyreplankton
Klimaendringer påvirker både biomasse og artssammensetning i dyreplanktonsamfunnene i nordiske havområder. Den best beskrevne utviklingen så langt er at raudåta i Nordsjøen blir utkonkurrert av en lignende, men mer varmekjær slektning som øker utbredelsen sørfra. Da denne arten er mindre næringsrik og gyter på «feil» tid på året så har dette gått ut over mattilbudet til bl.a. tidlige livsstadier av torsk. Endringer i dyreplanktonsamfunnet er relativt nylig sett også i Barentshavet, men ikke i Norskehavet. Som for planteplankton gir modellene en klar økning i dyreplanktonproduksjon i de nordligste delene av de nordiske havområdene, en svak økning i Norskehavet og kysten innenfor. I Nordsjøen og omliggende kystsone forventes ingen endring eller en svak reduksjon.
Fisk
Klimavariasjon og framtidige endringer påvirker fiskene i de nordiske havområder på mange ulike måter. De meste slående forandringene er hvordan utbredelsen til flere økologisk og kommersielt viktige fiskebestander endret seg dramatisk i løpet av få år med varmere hav, for til en viss grad å vende tilbake til det gamle mønsteret når det ble kjøligere igjen. Barentshavstorsken, som lever i de relativt varme atlantiske vannmassene, utvidet leveområdet sitt langt mot nord og øst som følge av oseanografiske endringer. Dette ga år med en svær torskebestand, men også problemer for de arktiske fiskene som fikk konkurrenter og ble spist.
Nordøstatlantisk makrell har forflyttet og utvidet sommerbeitet sitt over enorme avstander. Fra 1997 til 2016 økte det totale arealet deres fra 0,4 til 2,5 millioner km2, og tyngdepunktet i fordelingen forskjøv seg vestover med 1650 km og nordover med 400 km, langt inn i islandsk og grønlandsk farvann og til og med opp til Svalbard. Endringene var knyttet til en kombinasjon av en markant økning i bestandsstørrelse og oppvarming av havet og skapte store, fortsatt delvis uløste, utfordringer for forvaltningen. Dette gir oss en pekepinn på framtidig fordeling ved et mer permanent varmere hav. En faktor som kan legge en demper på utbredelsesendringer er at de fleste av våre fiskearter ikke er tilpasset en vinter i mørke som begrenser primærproduksjon og hindrer predasjon vha. syn. I Østersjøen er utfordringene til flere fiskearter (som torsk) først og fremst knyttet til forventet ytterligere nedgang i størrelsen på områdene med nok salt og oksygen.
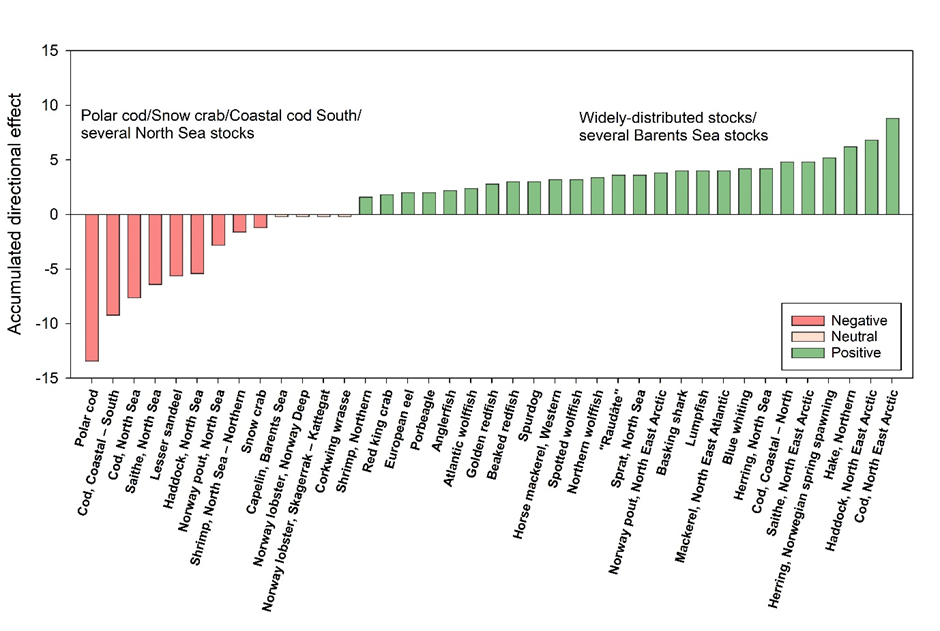
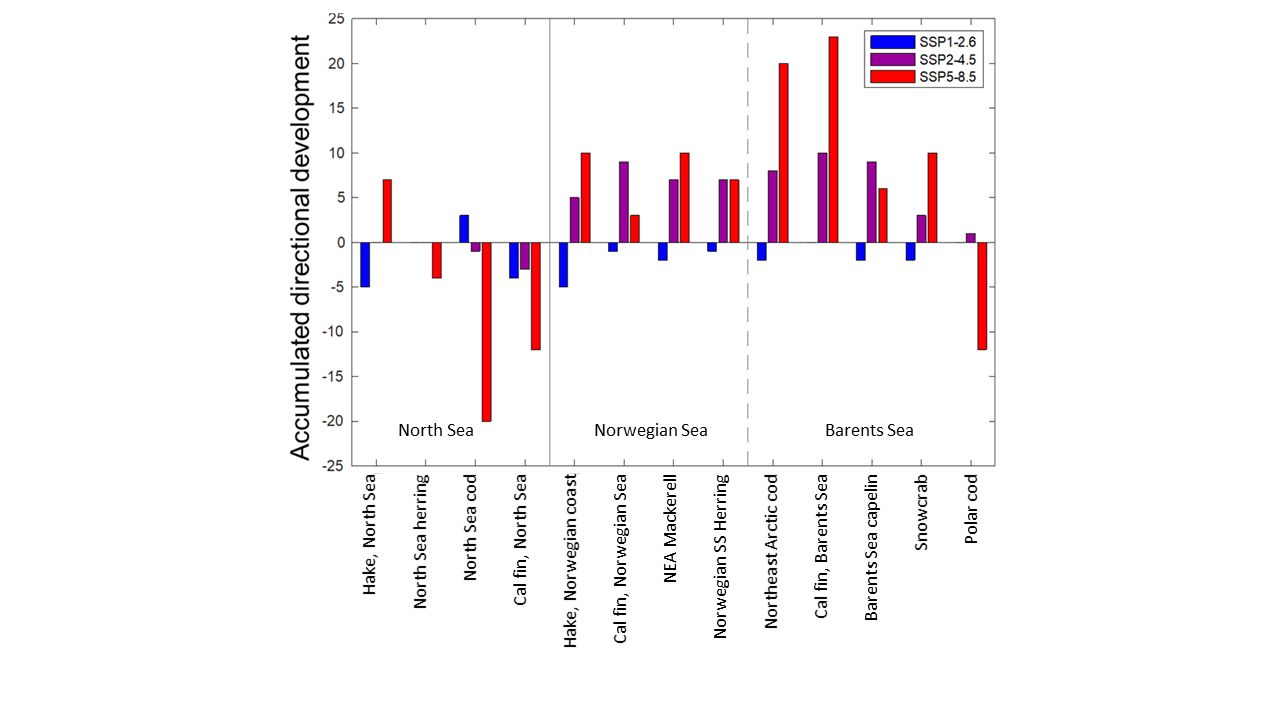
Helt nye studier ser på forventet langtidsutvikling til en rekke fiskearter i Nordøstatlanteren. Avhengig av hvor omfattende klimaendringene blir så forventer man en positiv utvikling for mange bestander, mens det blir vanskelig for særlig polartorsken i nord og torsk i Nordsjøen og kystområdene i sør.
Rapporten gir også en liten oversikt over forventet produktivitet hos ulike oppdrettsarter i europeiske land under et moderat og et ekstremt klimascenario. For norsk laks har en bare det moderate scenarioet. Totalt forventes en svakt positiv utvikling pga klimaendringer, men også at tyngdepunktet i produksjonen flytter nordover.
Sjøpattedyr
I nord har flere hvalarter store utfordringer pga de klimaendringene som allerede har skjedd. Vanskene er i stor grad knyttet til mindre isdekke, for noen arter også høyere sjøtemperaturer. Klimaendringene påvirker både beite- og fødeområder negativt. For eksempel har hvithvalene rundt Svalbard problemer med minkende isdekke, bl.a. pga. økt fare for angrep fra spekkhoggere. Narhvalene har en adferd som utfordres av endringene i miljøet. Denne pågående økningen i sjøtemperatur og reduksjon i isutbredelse kan også være alvorlig for grønlandshvaler, både på grunn av tap av habitat og mer direkte termisk stress. Trenden mot mindre is og dårligere iskvalitet kan føre til ytterligere nedgang i bestandene av grønlandssel og klappmyss.
Det er fire sjøpattedyrarter med fast opphold i Østersjøen; havert, steinkobbe, ringsel og nise. Som toppredatorer er de følsomme for endringer i økosystemet inkludert klimaendringer. Den generelle utviklingen er negativ, men det er stor forskjell mellom artene og lokale populasjoner. Bestandsstørrelsen har gått noe opp hos havert og steinkobbe, mens antall niser i det sentrale Østersjøen er svært lavt, bare rundt 500 dyr. Man antar at sel og hval i Nordsjøen og Skagerrak er noe mindre utsatt for klimaendringer da de typisk har bred temperaturtoleranse.
Sjøfugl
Sjøfugl er typisk på toppen av næringskjeden og dermed avhengige av en rekke faktorer spesielt knyttet til mattilgang. Generelt vil det ha negativ innvirkning på hekkesuksess og vinteroverlevelse dersom plankton- eller fiskebestandene svekkes eller endres fra det sjøfuglene er tilpasset å spise.Spesielt ved høye breddegrader som i Barentshavet og Norskehavet er kan klimaendringer forstyrre den nødvendige synkronien mellom fuglenes behov for mat og tilgangen. Framtidsutsiktene for de ulike sjøfuglbestandene er derfor nært knyttet til dyreplankton og gyteplasser og -tider for fisk. Allerede nå ser vi at økt sjøtemperatur vest og nord for Svalbard har gitt mindre sjøis i fjordene, noe som har ført til endringer i økosystemet. Arktiske byttedyr har i stor grad blitt erstattet av mindre energirike atlantiske arter. Dette er sannsynligvis årsaken til at flere sjøfuglarter der nå har redusert vekst og yngeloverlevelse med konsekvensen at bestandene minker.
Bunnlevende dyr
Det har vært en forskyvning nordover i mengden bunndyr og tempererte bunnsamfunn, særlig i Barentshavet, men også langs kysten av Norge. For eksempel er det registrert endringer i biologisk mangfold, i Svalbardområdet, særlig en økning hos boreale og tilbaketrekking av arktiske arter. I Nordsjøen har den nordlige utbredelsesgrensen hos en rekke arter utvidet seg med økt temperatur. Effektene av klimaendringer på bunnorganismer ser ut til å oppstå fra endringer i temperatur, næringsstoffer og hydrodynamikk som påvirker matforsyning og reproduksjon. Fremover, innenfor et middels klimascenario, var projiserte endringer i utbredelsen til 75 bunndyr i Nordsjøen til 2099 hovedsakelig utvidelse av leveområdet mot nord. Videre resulterte de forventede endringene i tap av habitat for mer enn 60% av de modellerte artene.
Preface
This report is the first output from the project NorScen - Nordiske klimaScenarioer (Nordic climate Scenarios) funded by The Nordic Council of Ministers (NCM). The project is based on NCM’s programme Marine Management and Climate's goal of achieving an increased knowledge level on the expected effects of climate change on all the Nordic seas up to the year 2100, work package 1 of the call Climate change in Nordic sea areas towards 2100. Main target groups for the project and this report are the Nordic Council of Ministers, national ministries and directorates in the Nordic countries, other researchers regionally and internationally, and the Nordic population at large.
The United Nations’ Intergovernmental Panel on Climate Change (IPCC) has over the recent years published several comprehensive reports within its 6th assessment cycle (AR6). However, although AR6 contains an enormous amount of high-quality information and has better regional resolution than earlier IPCC assessments, the Nordic seas are not treated as a unit or resolved well into individual seas. It is particularly challenging that the global climate models used to simulate future climate and climate effects under different emission scenarios (Coupled Model Intercomparison Project Phase 6, CMIP6) do not have sufficient resolution to provide a good basis for decision-making on a Nordic scale. This is additionally problematic because our sea areas have characteristics that distinguish them from many others and may make them especially vulnerable to future climate change.
The NCM sees a need to increase our understanding of the effects of future climate change specifically on the Nordic sea areas and has asked for regional analyses and assessments. NorScen aims to address the request, firstly with this report. Here we present a standalone up-to-date overview of knowledge of the present status and expected future development of climate impacts on physical ocean properties, organisms and ecosystems in the seas around the Nordic countries.
The authors, research scientists from Norway, Sweden and Denmark, wish to thank colleagues from within and outside the project for ideas and contributions.
Oslo/Bergen February 15th 2023
Geir Ottersen, Institute of Marine Research
Project leader NorScen and lead author
Summary
The UN's Intergovernmental Panel on Climate Change (IPCC) reports are comprehensive, thorough and important, but they cover the whole world and this is at the expense of scope and precision on a regional scale. Specifically, the Nordic region is not covered as a separate area or specific characteristics of our regional seas highlighted. It is particularly unsatisfactory that the global models used to simulate future climate and climate effects do not have a high enough spatial resolution to serve as a good basis for decisions on a Nordic scale. Against this background, the Nordic Council of Ministers saw a need for increased knowledge about the effects of climate change on Nordic waters. This resulted in the project "Nordic climate scenarios" (NorScen), which runs from 2022 to 2024 and is initiated and funded by the Council of Ministers.
This report is the first deliverable in the project. Here we present a thematically ordered overview of the current status and expected future conditions when climate change has had a full impact on physical properties and different forms of marine life in the waters around the Nordic countries. We throughout write that future development will be contingent on the climate scenario. Climate scenarios are a tool used by IPCC to highlight that future developments are highly dependent on the extent to which we, today and in the near future, are able to reduce greenhouse gas emissions.
Sea level rise
The global sea level is rising as a result of climate change. This is currently mostly due to "thermal expansion", i.e., that warmer water takes up more space than colder ones. In the long term, melting of ice on land, especially from the enormous ice masses in Greenland and Antarctica, is expected to make an even greater contribution. The oceans in general, also the Nordic seas and coastal areas, will rise considerably more under the most serious climate scenarios than if we manage to limit emissions. In the Nordic region there is also another very important factor that will cause the rise in sea level to vary greatly from area to area. The land is still rising after it was covered by an up to 3 km thick ice sheet during the last ice age, but this uplift is very uneven geographically. The Baltic Sea was covered by more ice than the Oslo area, which in turn had more ice than western Norway. This causes the estimated sea level rise for the period from 1986-2005 to 2100 under a medium climate scenario to be 38 cm in Stavanger, but 0 in Oslo. Similarly, a 50 cm increase is expected around Copenhagen, but a decrease in water levels of about 35 cm in the north of the Baltic Sea.
Increased sea temperature and frequency of extreme events
Globally, sea temperature has increased by 0.88°C since before the Industrial Revolution. In the North Atlantic the increase has been about the same. In addition to a relatively slow gradual trend, there are natural fluctuations on different time scales. The estimates for future developments depend on the scenario being looked at, but also on the different models; this reflects a relatively large uncertainty in the estimates. One study, based on many different models, estimated an increase in surface temperature in summer of 0.4°C per decade in the North Sea and Norwegian Sea, but that is under an extreme climate scenario. For the Baltic Sea, another group of authors find an increase towards the end of the century of 1.1 °C for a low-emission scenario and as much as 3.2 °C with continued high emissions.
Marine heat waves are episodes of sharp increases in ocean temperature. Intensity, duration and geographical scope can be very different, but they have the potential to have a large (negative) effect on organisms and ecosystems. One has already had massive marine heat waves in, e.g., the Pacific, but also in our waters one must be prepared. For example, a recent study found that the annual frequency of marine heat waves in the Barents Sea increased by 62% from the period up to 2004 to that from then on. From 1982-2020 half of the days with heat wave status there were in the most recent decade.
Salinity
In open sea areas, moderate changes in salinity generally have little impact on marine life. In the Baltic Sea the situation is different. The Baltic Sea is very fresh to be an ocean, especially in the north brackish water dominates. This has historically created challenges for important fish stocks, not least cod, and continued salinity decrease will further negatively affect the ecosystem. Unfortunately, it is very difficult to estimate the future development precisely; estimates vary from clear decline to small changes. For the North Sea and Skagerrak, a decline in salinity is expected, the largest decline in high-emission scenarios.
Ocean acidification
The ocean has absorbed about a third of human CO₂ emissions to the atmosphere. Increasing the concentration of CO₂ in the atmosphere affects the acidity of seawater, which generally reduces the pH and saturation state of carbonate minerals (aragonite and calcite). Such changes in ocean chemistry are potentially a major challenge for several forms of marine life, especially corals and calcifying algae, but also sea snails with "hard parts". Nevertheless, scientists disagree about the sensitivity of these species regarding acidification and the extent to which they can adapt to the new conditions. In the Nordic seas, ocean acidification has advanced faster than the global average. Measurement series since the 1990s show a significant decrease in pH almost everywhere in the North Sea and Norwegian Sea where we have sufficient data to investigate trends. In the report, we show historical changes both there and in the Danish fjords. Future development is strongly and directly dependent on how much CO₂ we emit globally in the coming decades. In the worst-case scenarios, the pH in the Nordic sea areas will be markedly lower in the year 2100 than today.
Reduction in ocean water oxygen content
Model results and observations show that global warming leads to an expansion of the ocean areas with low oxygen or total oxygen deprivation. Accordingly, the volume of habitats for organisms that depend on oxygen will shrink. The rate of deoxygenation is slow in the North Atlantic compared to other parts of the world's oceans. Therefore, the impacts of large-scale climate change on oxygen levels will be small in most European coastal waters; local mechanisms will dominate the oxygen balance in the 21st century.
The Baltic Sea clearly stands out from the other Nordic seas in that there already are serious challenges here related to oxygen deficiency. In deeper parts, new oxygen is only supplied in the rare cases where saltier surface water from the North Sea enters through the shallow and narrow Danish straits. Large amounts of nutrients that have accumulated in the system during the last century have caused a situation of large algal blooms that sink to the bottom and consume the oxygen, resulting in oxygen-poor bottom areas. Future oxygen conditions are not dependent on climate change alone, model analyses show that the level of nutrients supplied from land is just as crucial. Except in the worst climate scenario combined with very large inputs of nutrients, oxygen levels in the Baltic Sea are expected to be higher/better by the end of the century than today.
Primary production
Primary production, mainly phytoplankton, lays the foundation for much of marine life. How climate change affects this production will be important for everything from zooplankton to fish and whales. Primary production depends on nutrients reaching the upper layers where there is light. Future production depends mostly on the availability of nutrients, stratification of the sea, and wind conditions. Development in the Nordic sea areas differs between the north and south, and this difference is expected to continue in the future. So far, satellite data show no climate-driven change in the Norwegian Sea, a small increase in the Greenland Sea, and a clearly increasing trend in the Arctic Ocean.
In the North Sea, climate change is expected to reduce primary production, an estimate of as much as 30% has been made. Further north, particularly in areas now covered by ice for much of the year, an increase in phytoplankton production is expected. Ice algae, on the other hand, are in danger of disappearing completely or being greatly reduced in large areas. It is difficult to quantify effects far into the future, but the best model estimates show a doubling of primary production in the northern parts of the Barents Sea from 2015-2100 in the scenario with the greatest climate change. However, in the scenario where we limit greenhouse gas emissions the most, little or no changes in primary production are expected. The Baltic Sea stands out from the other areas in that it mainly is the amount of nutrients supplied from land that controls primary production.
Secondary production – zooplankton
Climate change affects both biomass and species composition of zooplankton communities in the Nordic seas. The best described development so far is that the copepod species calanus finmarchicus in the North Sea is being outcompeted by a similar, but more heat-loving relative that has expanded its distribution from the south. As this species is less nutritious and spawns at the "wrong" time of year, this has affected the food offered to, e.g., early life stages of cod. Changes in the zooplankton community have also been seen in the Barents Sea recently, but not in the Norwegian Sea. As with phytoplankton, the models show a clear future increase in zooplankton production in the northernmost parts of the Nordic sea areas, a slight increase in the Norwegian Sea and the bordering coastal areas. In the North Sea and the surrounding coastal zone, no change or slight reduction is expected.
Fish
Climate variation and future changes affect the fish in the Nordic region in many different ways. The most striking changes are how the distribution of several ecologically and commercially important fish stocks altered dramatically during a few years of warmer seas, to return, more or less, to the old pattern when it became cooler again. The Barents Sea cod, which lives in relatively warm Atlantic waters, extended its habitat far to the north and east because of oceanographic changes. This gave years of a huge cod stock, but also problems for the truly Arctic fish that were threatened by competitors and predators.
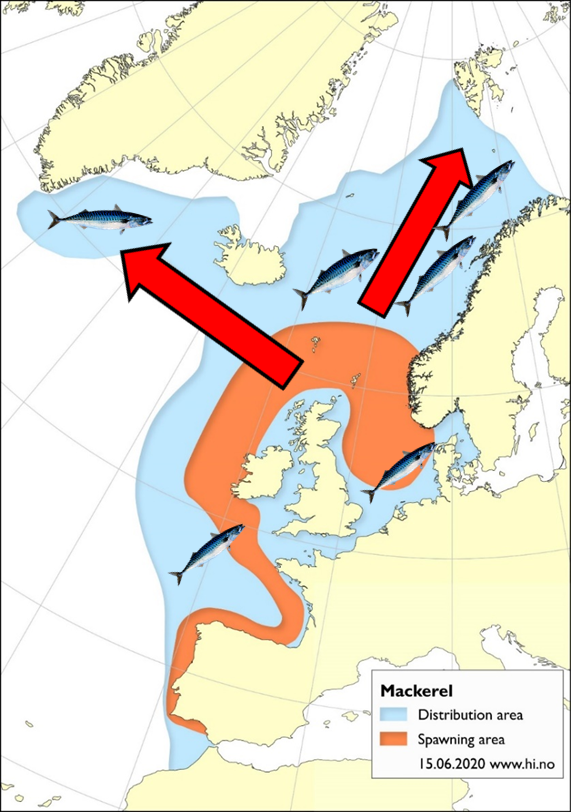
Also northeast-Atlantic mackerel expanded their summer feeding grounds over enormous distances. From 1997 to 2016, the total area covered increased from 0.4 to 2.5 million km2, and the centre of gravity of the distribution shifted westwards by 1650 km and northwards by 400 km, far into Icelandic and Greenlandic waters and even up to Svalbard. The changes were linked to a combination of a marked increase in population size and ocean warming, and created major challenges for management. This gives us an indication of future fish distributions in more permanently warmer seas. One factor that can put a damper on distribution changes is that most of our fish species are not adapted to a winter in the dark, which restricts primary production and hampers visual predation. In the Baltic Sea, the challenges facing several fish species (such as cod) are primarily related to the expected further decline in the size of the areas with enough salt and oxygen.
Very recent studies examine long-term trends of a number of fish species in the Northeast Atlantic. Depending on the extent of climate change, a positive development is expected for many stocks, while polar cod in the north and cod in the North Sea and coastal areas in the south will face severe difficulties.
The report also provides a brief overview of the expected productivity of different farmed species in European countries under, respectively, a moderate and an extreme climate scenario. For Norwegian salmon, one has only the moderate scenario. Overall, a slightly positive development is expected due to climate change, but also a northwards shift in production area.
Marine mammals
In the north, several whale species face major challenges due to the changes in climate that already have occurred. The difficulties are largely related to less ice cover, for some species also due to higher sea temperatures. Climate change negatively affects both grazing and feeding areas. For example, beluga whales around Svalbard have problems with decreasing ice cover, partly due to the increased risk of attack by killer whales. Narwhals have behavioral patterns that are challenged by changes in the environment. This ongoing increase in sea temperature and reduction in ice extent can also be serious for bowhead whales, both due to habitat loss and more direct thermal stress. The trend towards less ice and poorer ice quality may lead to a further decline in the populations of greenland and hooded seals.
There are four marine mammal species with permanent residence in the Baltic Sea; grey seal, harbour seal, ringed seal and porpoise. As top predators, they are sensitive to changes in the ecosystem, including climate change. The overall future trend is negative, but there are major differences between species and local populations. The population sizes of grey seal and harbour seal have increased somewhat, while the number of porpoises in the central Baltic Sea is very low, only about 500 animals. It is assumed that seals and whales in the North Sea and Skagerrak are somewhat less exposed to climate change as they typically have broad temperature tolerance.
Seabirds
Seabirds are typically at the top of the food chain and thus dependent on a number of factors, especially related to food availability. In general, seabird breeding success and winter survival will be negatively affected if plankton or fish stocks are weakened or change from what the birds are adapted to eat. Especially at high latitudes, such as in the Barents Sea and the Norwegian Sea, climate change can disrupt the necessary synchronicity between the birds' need for food and food availability. The future prospects for the various seabird populations are therefore closely linked to zooplankton and spawning grounds and -times for fish.
Already now we see that increased sea temperatures west and north of Svalbard have resulted in less sea ice in the fjords, which has led to changes in the ecosystem. Arctic prey has largely been replaced by less nutritious Atlantic species. This is probably the reason why several seabird species in the region now have reduced growth and fry survival with the consequence that populations are declining.
Bottom living animals
There has been a shift northwards in the amount of benthic animals and temperate benthic communities, particularly in the Barents Sea, but also along the coast of Norway. For example, changes in biodiversity have been recorded in the Svalbard area, particularly an increase in boreal and withdrawal of Arctic species. In the North Sea, the northern distribution boundary of a range of species has expanded with increased temperature. The effects of climate change on benthic organisms appear to arise from changes in temperature, nutrients and hydrodynamics, which affect food supply and reproduction. Looking forward, within a medium climate scenario, projected changes in the distribution of 75 benthic animals in the North Sea to 2099 are mainly expansion to the north. Moreover, the expected changes resulted in habitat loss for more than 60% of the modeled species.
Updated 06. March 2003: Two technical errors were detected and the text has been changed accordingly.
In the Summary, under Sea level rise “land uplift” has been changed to “sea level rise” and similar for the Norwegian Summary.
The caption for Figure 3 has been changed so it matches the placement of the two panels, “(upper panel)” and “(lower panel)” have been switched.
1 - Introduction
In its Sixth Assessment Report (AR6), the United Nations’ Intergovernmental Panel on Climate Change (IPCC) stresses that climate change is even greater and clearer than previously demonstrated, “recent changes in the climate are widespread, rapid, and intensifying, and unprecedented in thousands of years” (IPCC 2021), and that the effects on humans and nature will be very extensive (IPCC 2022). Further, IPCC (2019), states that the ocean so far has acted as a buffer against climate change, but climate change now alters the ocean and cryosphere in many ways and consequences for nature and humanity are sweeping and severe. The IPCC AR6 reports leave no doubt that marine ecosystems will be strongly affected by climate change. Climate change will in very many regions cause environmental conditions that are novel to species living in that specific area (Blenckner et al. 2021). Especially increasing sea temperature leads to a number of ecological changes, through affecting, e.g., competition between species, access to food to early life stages and migration patterns.
Although AR6 contains an enormous amount of information and has better regional resolution than earlier IPCC assessments, it is difficult to scale down to more detailed local information. Specifically, the Nordic seas are not treated as a unit or resolved well into individual seas. It is particularly challenging that the global climate models used to simulate future climate and climate effects under different emission scenarios (Coupled Model Intercomparison Project Phase 6, CMIP6) do not have sufficient resolution to provide a good basis for decision-making on a Nordic scale. This is additionally problematic because our sea areas have characteristics that distinguish them from many others and may make them especially vulnerable to future climate change. In the north (the Barents Sea and northern parts of the Greenland-Iceland-Norwegian Sea), some of the largest changes on the planet are expected, associated with increased sea temperatures and reduced ice cover. The North Sea has an extensive total burden from many other human impacts in addition to climate change. Biodiversity and productivity in the Baltic Sea already face challenges from problematically high nutrient levels (eutrophication), occasional oxygen deprivation and salinity levels that are very low for marine species (such as cod and herring). Therefore, The Nordic Council of Ministers (NCM) has asked for regional analyses and assessment for our sea areas.
Our assessment builds mainly directly on primary literature, i.e., peer reviewed scientific papers. However, we have also examined publications from several ongoing or relatively recent comprehensive activities. For Norwegian waters, from the Skagerrak to the Barents Sea, reports relating to the Norwegian integrated marine management plans have been important in our work, especially Eriksen et al. (2021). For the Arctic AMAP (2021) provides a lot of information. However, even if their southern boundary formally is set as far south the Arctic Circle at 66°32’N, the focus is further north and the overlap with our region restricted mainly to the Barents Sea, for which we use the chapter by Hausner and Trainor (2021). There exist good reviews of the knowledge of climate change and impacts for the North and Baltic Seas, for the North Sea especially the book "North Sea Region Climate Change Assessment" (NOSCCA; Quante and Colijn 2016). For the Baltic there is a lot of information in the two books “Assessment of Climate Change for the Baltic Sea Basin” (BACC Author team 2008) and “Second Assessment of Climate Change for the Baltic Sea Basin” (BACC II Author team 2015). More recently, the Baltic Earth Assessment Reports (BEAR) special issue of Earth System Dynamics includes several highly relevant review articles including Meier et al. (2022a, b) and Viitasalo and Bonsdorff (2022). These are solid sources of background knowledge, also for us, but they do not fully serve our needs. The books (despite intentions) do not really include projections for marine ecosystem impacts. Further, this is a field with rapid development and NOSCCA and BACC do not capture the most recent developments and publications.
The Convention for the Protection of the Marine Environment of the North-East Atlantic (OSPAR) and the Baltic Marine Environment Protection Commission (HELCOM) cover our geographical area. Since their focus is on environmental protection and only to a lesser degree climate change, we do not build upon them. We are aware of and follow the International Council for the Exploration of the Seas’ (ICES) ecosystem oriented working groups. Although we mainly refer to primary literature the work from all of the following have been useful for our overview: ICES Working Group on the Integrated Assessments of the Barents Sea (WGIBAR, ICES 2022a), ICES Working Group on the Integrated Assessments of the Norwegian Sea, (WGINOR, ICES 2022b), ICES Working Group on Integrated Assessments of the North Sea (WGINOSE, ICES 2022c), and ICES/HELCOM Working Group on Integrated Assessments of the Baltic Sea (WGIAB, ICES 2018), see https://www.ices.dk/advice/ESD/Pages/Ecosystem-overviews.aspx
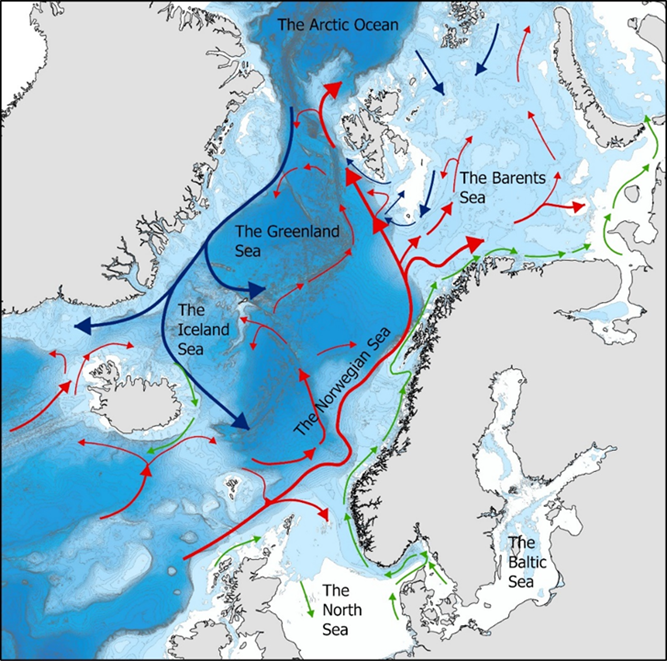
This report is the first output from the project NorScen - Nordiske klimaScenarioer (Nordic climate scenarios). It presents a standalone up-to-date overview of knowledge on the present status and future development of climate impact on physical properties, organisms, and ecosystems in the seas around the Nordic countries. Throughout we further often point to that the differences in expected consequences depend on present ability to curb the release of greenhouse gases. The report also sets the scene for upcoming work within the project. NorScen aims to increase our knowledge of the effects of future climate change on the Nordic sea areas, from oceanography through biogeochemistry to marine life and ecosystems. Geographically and scale wise it is comprehensive, from the Baltic Sea via the Danish Limfjord and the North Sea to the Norwegian- and Barents seas (Fig. 1).
Figure 1. The major ocean regions treated in this report. Red arrows show warm currents, blue arrows show cold currents. Coastal currents are shown in green. Map by Per Arne Horneland, IMR.
Abbrevations
AMAP
Arctic Monitoring and Assessment Programme, one of six Working Groups of the Arctic Council.
AR5
The United Nations’ Intergovernmental Panel on Climate Change (IPCC) Fifth Assessment Report
AR6
The United Nations’ Intergovernmental Panel on Climate Change (IPCC) Sixth Assessment Report
BACC
Assessment of Climate Change for the Baltic Sea Basin
BSAP
Baltic Sea Action Plan
CESM-LENS
Community Earth System Model - Large Ensemble Project is a publicly available set of climate model simulations intended for advancing understanding of internal climate variability and climate change.
CMIP5
Coupled Model Intercomparison Project Phase 5
CMIP6
Coupled Model Intercomparison Project Phase 6
Fish-MIP
The Fisheries and Marine Ecosystem Model - Intercomparison Project compares models of the impact of climate change on sea life
GSP
Gross secondary production.
HELCOM
The Baltic Marine Environment Protection Commission
ICES
International Council for the Exploration of the Seas
MHW
Marine heatwaves
NCM
The Nordic Council of Ministers
NEMO-NA10km
A regional ocean model that covers the area from the North Atlantic to the Arctic
NPP
Net primary production
NorESM2-MM
Norwegian Earth System Model, a coupled global earth system model
NorScen
Nordic climate Scenarios, the NCM funded project behind this report
NORWECOM.e2e
A marine ecosystem model system. e2e indicates the ambition to develop an end-to-end (physics-marine mammals) model.
NOSCCA
North Sea Region Climate Change Assessment
OSPAR
Convention for the Protection of the Marine Environment of the North-East Atlantic
RCP2.6
RCPs or Representative Concentration Pathway are greenhouse gas concentration trajectories adopted by he United Nations’ Intergovernmental Panel on Climate Change (IPCC). RCP2.6 is a “low concentration” future scenario.
RCP4.5
RCPs or Representative Concentration Pathway are greenhouse gas concentration trajectories adopted by IPCC. RCP4.5 is a “moderate concentration” future scenario.
RCP8.5
RCPs or Representative Concentration Pathway are greenhouse gas concentration trajectories adopted by IPCC. RCP8.5 is a “business as usual – extreme concentration” future scenario.
SLR
Sea Level Rise
SRES A1B
An older IPCC intermediate release level scenario.
SSP1-2.6
SSP or Shared Socioeconomic Pathways are scenarios of projected socioeconomic global changes up to 2100 adopted by IPCC. SSP1-2.6 is labelled Sustainability (Taking the Green Road)
SSP2-4.5
SSP or Shared Socioeconomic Pathways are scenarios of projected socioeconomic global changes up to 2100 adopted by IPCC. SSP2-4.5 is labelled “Middle of the Road”
SSP5-8.5
SSP or Shared Socioeconomic Pathways are scenarios of projected socioeconomic global changes up to 2100 adopted by IPCC. SSP5-8.5 is labelled “Fossil-fueled Development (Taking the Highway)”
SST
Sea Surface Temperature
WGIAB
ICES/HELCOM Working Group on Integrated Assessments of the Baltic Sea
WGIBAR
ICES Working Group on the Integrated Assessments of the Barents Sea
WGINOR
ICES Working Group on the Integrated Assessments of the Norwegian Sea
WGINOSE
ICES Working Group on Integrated Assessments of the North Sea
2 - Sea level rise
Globally, sea levels are rising due to human-caused climate change and this current sea level rise (SLR) began at the start of the 20th century. Between 1901 and 2018, the globally averaged sea level rose by 15–25 cm, or 1–2 mm per year on average (IPCC AR6). The main driver of sea level rise so far is thermal expansion, a consequence of warm water occupying a larger volume than an equal mass of colder water at the same pressure. This can be calculated with fair precision, at least for the period from 2005 and onwards when there has been good coverage of argo floats (https://argo.ucsd.edu) observing the ocean. However, the largest potential and uncertainty exists in the melting of the ice sheets covering Antarctica and Greenland (Fox-Kemper et al. 2022). Global SLR is currently accelerating. It has been estimated to 3.6 mm per year during the last decade (Fox-Kemper et al. 2022), which is roughly twice the average rate during the 20th century.
The last ice age ended around 10 000 years ago, then great sheets of ice, 3 km thick, had covered much of Earth's Northern Hemisphere. Though the ice melted long ago, the land once under and around the ice is still rising and falling in reaction to its ice-age burden. This ongoing movement of land is called glacial isostatic adjustment . In Scandinavia it has until recently kept pace with the sea surface so that relative sea level is only now starting to increase. Both the observed and projected SLRs differ a lot between regions.
The Nordic region is very varied regarding land uplift. Forecasts for future sea level therefore vary greatly. The Baltic region has a stronger uplift than Western Norway because the ice cap eastwards was thicker and thus heavier. Projected relative changes in sea level for the Nordic region and surrounding areas can be seen in Fig. 2. For the moderate climate scenario (Fig. 2, left panel) a sea level rise of 0.5 m is, for example, projected for Copenhagen and -0.35 m for the Bothnian Bay. Within the extreme scenario the corresponding numbers are 1.0 m and +0.1 m.
Figure 2. Projected relative changes in sea level from 1990-1999 to 2090-2099 for a moderate (left panel) and extreme (right panel) climate scenario. Information from Hill et al. (2010) and Grinsted et al. (2015).
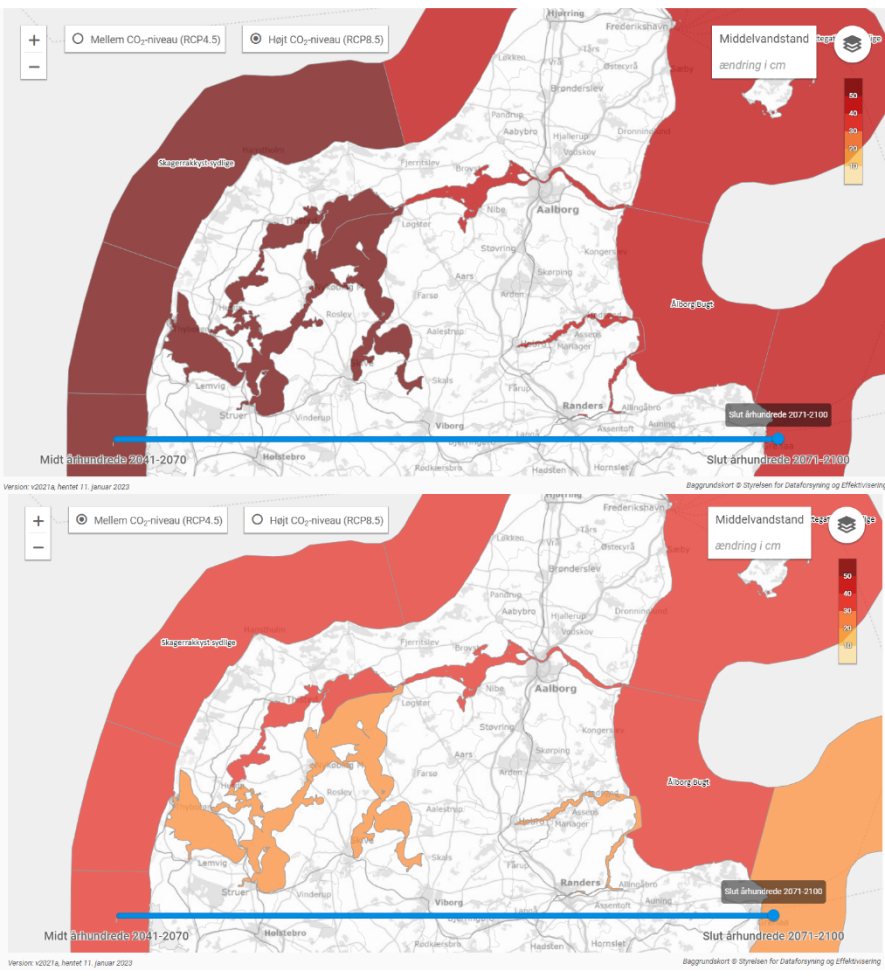
In Danish waters the sea level is projected to increase 0.3 m in the moderate climate scenario and 0.5 m in the extreme climate scenarios (Fig. 3). In the shallow Limfjorden, SLR follows the general trend for Denmark.
Figure 3. Projected relative changes in sea level from 1981-2010 to 2071-2100 for a moderate (lower panel) and extreme (upper panel) climate scenario with focus on Danish waters. The scale goes from 10 cm (light yellow) – 60 cm (dark red). Information from www.dmi.dk/klima-atlas
Present and projected SLR along the Norwegian coast was reviewed after IPCC’s fifth assessment report (AR5; Simpson et al. 2015, 2017); their report is presently being revised based on later progress in AR6. AR6 based sea level projections are currently available for all Swedish municipalities through SMHI (https://www.smhi.se/klimat/stigande-havsnivaer/framtida-medelvattenstand-1.165493) .
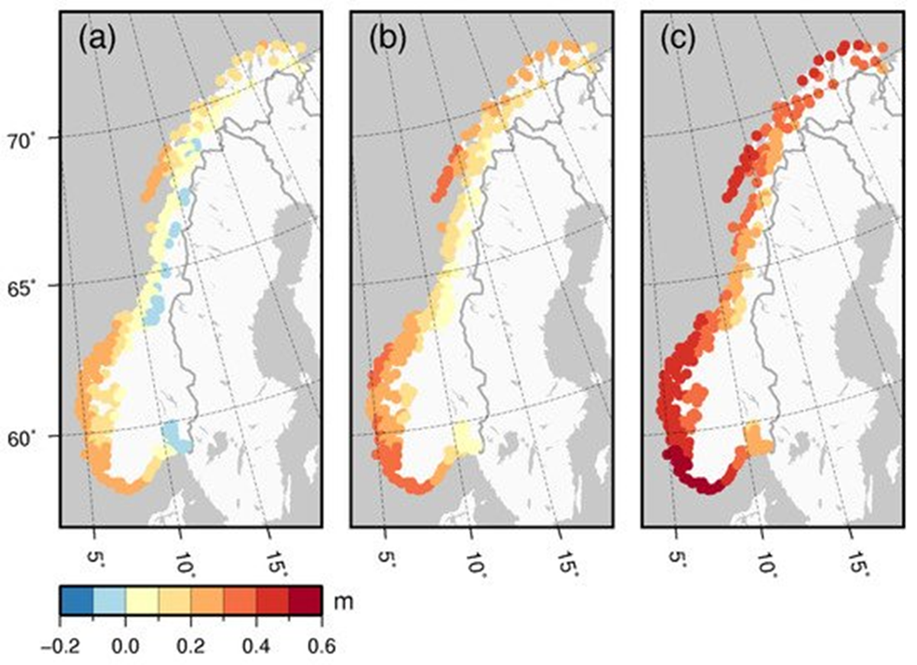
The projected SLRs for Norway differ a lot geographically, with lowest levels at Oslo and highest levels at the west coast of southern Norway, and also depend on scenario (Tab. 1, Fig. 4). For Sweden the highest sea level rise is projected for the southernmost part of the country, where the sea level rise is almost on par with the global average. On the northern Baltic Sea coast, in contrast, the sea level is expected to fall during the current century except for in very high emission scenarios.
Location
RCP2.6
RCP4.5
RCP8.5
Oslo
-8 (-36 to 19)
0 (-29 to 28)
23 (-11 to 56)
Stavanger
30 (4 to 54)
38 (12 to 63)
59 (28 to 90)
Bergen
23 (2 to 45)
33 (11 to 55)
53 (26 to 80)
Heimsjø
7 (-14 to 28)
17 (-6 to 40)
36 (8 to 65)
Tromsø
8 (-11 to 27)
15 (-5 to 35)
32 (3 to 63)
Honningsvåg
20 (-8 to 48)
29 (2 to 59)
48 (11 to 86)
Table 1. Mean relative sea level projections for the period from 1986-2005 to 2100 (cm) for three different climate scenarios. The model ensemble 5% to 95% spread in parenthesis.
Figure 4. Projected relative changes in sea level along the Norwegian coast from 1986–2005 to 2081–2100. Projections are shown for three IPCC climate scenarios: (a) RCP2.6 “low”, (b) RCP4.5 “moderate”, and (c) RCP8.5 “business as usual – extreme”. From Simpson et al. (2017) and the Norwegian Mapping Authority’s web page Visualize sea level https://www.kartverket.no/en/at-sea/se-havniva.
Mean sea levels are considerably exceeded during storm surges. Which measure is best suited for management purposes is debated as this also depends on emission scenarios and the length of the planning period. Norwegian authorities often use the 200-year return height (“200-year flood”, a large flood with a probability of 1/200 to occur in any given year, Tab. 2). The range of the 200-year return levels along the Norwegian coast is 1.2 to 2.2m.
Location
200-year return heights in meters
Oslo
1.86 (1.62, 1.99)
Stavanger
1.15 (1.06, 1.19)
Bergen
1.41 (1.35, 1.46)
Heimsjø
2.10 (2.00, 2.17)
Tromsø
2.21 (2.13, 2.26)
Honningsvåg
2.21 (2.05-2.30)
Table 2. 200-year return heights 1996-2014 (in meters above mean sea level). The 5% and 95% confidence levels are shown in parenthesis.
For Sweden the storms surges typically have the highest amplitude on the west coast, while the central Baltic Sea has the smallest amplitudes. Return heights derived for a number of different tide gauge stations are available in Södling and Nerheim (2017).
3 - Sea temperature
Globally, the average surface temperature in the ocean has risen by 0.88 °C since before the Industrial Revolution. Heat has also reached the deep sea, and as much as 9 per cent of the amount of heat absorbed by the ocean is now found below 2000 metres depth. Generally, but not always, sea temperature fluctuations on annual and longer time scales are in synchrony through most of the Nordic region (North Sea, Norwegian Sea and Barents Sea). Sea temperature fluctuations in the three seas are largely controlled by variations in Atlantic water further south, but also modified by local heat loss and mixing in water masses while heading north. In the Norwegian Sea and the whole North Atlantic, the temperature increase since measurements started has been approximately the same as the global average.
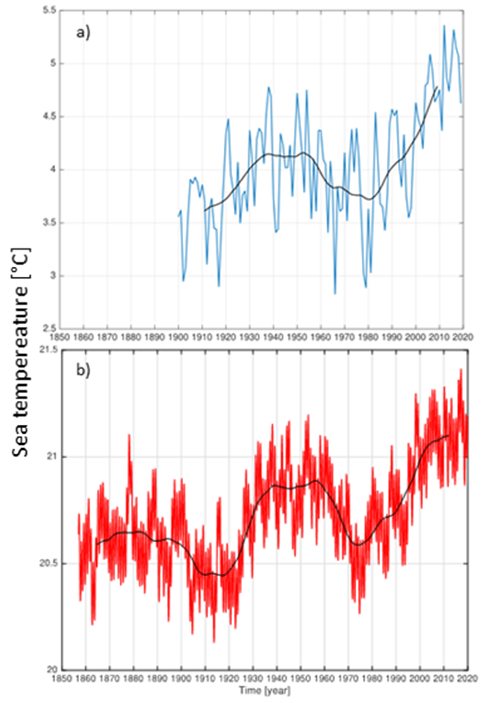
In addition to a slow increasing trend, sea temperature in the region is also subject to large-scale and long-term natural fluctuations (Fig. 5). There was a warm North Atlantic period during the 1940s and 1950s, followed by a much colder period around 1970, before the temperature rose again until about 2006, and was at that time record high. Since then, the temperature in the North Atlantic, including the North Sea and the Norwegian Sea has stabilized and even decreased somewhat. In the Barents Sea the fluctuations followed much the same pattern, but since the 1980s there has there been a very clear increasing trend on top of the decadal-scale fluctuations (Fig. 5).
Figure 5. Temporal development of mean sea temperature in degrees Celsius in a) the upper 200 m along the Kola meridian transect in the south-central Barents Sea and b) in the upper 100 m of the Atlantic Ocean from the equator to the polar circle. Please note the difference in scale between the y-axes in a) and b). The temperature increase in the Barents Sea over the last decades is ca twice of that in the northern Atlantic. Adapted from work by Dr. Øystein Skagseth, IMR.
There are major differences in the predictions of regional future SST among the consortium of global models available (Alexander et al. 2018). Using a large ensemble of models (CMIP5 and CESM-LENS) they estimated rate of increase of summer mean in the Arctic to be 0.5°C per decade under the RCP8.5 "business as usual" (extreme) greenhouse gas emission scenario. The corresponding predicted summer increase rates were 0.4°C per decade for the North Sea and the Norwegian Sea, and winter increase in these regions was estimated as 0.25°C per decade.
Sandø et al (2022) conducted a risk analysis for Norwegian marine ecosystems under climate change. This included direct and indirect impacts on marine fish of three different IPCC climate scenarios within the management plan units North Sea- Skagerrak, Norwegian Sea, and Barents Sea-Lofoten. The three scenarios SSP1-2.6, SSP2-4.5 and SSP5-8.5 from the global climate model NorESM2-MM were used to cover the full scope of future climate change. These were downscaled by means of the regional ocean model NEMO-NA10km, which has a horizontal spatial resolution of 10 km and covers the North Atlantic from 39 °N and northwards, the Nordic seas, the North Sea, the Barents Sea, and the Arctic Ocean (Sandø et al. 2022). Projected future development for 2015-2100 was estimated for the physical variables sea temperature, salinity and sea ice cover, sea temperature results shown in Figs. 6 and 7.
Figure 6. Projected Sea Surface temperature (°C) development in March for the period 2015-2100 in different ocean and coastal areas. Blue IPCC SSP1-2.6 (“2 °C”), purple SSP2-4.5 (“moderate”), and red SSP5-8.5 (“extreme, business as usual”). Thin lines are annual values, thick lines decadal values, and straight lines indicate trends. From Sandø et al. (2022).
Figure 7. Spatial pattern in projected development of March temperature at 100 m depth from 2015 to 2100 for three IPCC scenarios. Left panel SSP1-2.6 (“2 °C”), central panel SSP2-4.5 (“moderate”), and right panel SSP5-8.5 (“extreme, business as usual”). From Sandø et al. (2022).
For the Baltic Sea, the effects of climate change on the ocean are summarized in Meier et al. (2022a,b) and in the En-Clime fact sheet (Climate Change in the Baltic Sea, 2021). Results are also visualized in the SMHI climate change scenario service (SMHI, 2022) where one can interactively see maps for various parameters and for different climate and nutrient load scenarios. Meier et al. (2022b) conclude that sea surface temperatures (SST) increase between 1.1 °C (0.8 – 1.6 °C) for AR5 scenario RCP2.6 and 3.2 °C (2.5 – 4.1 °C) for RCP8.5 at the end of the century compared to the reference period 1976-2005. Large rates of temperature increase relative to other ocean basins, 0.59 °C per decade, have already been observed between 1990 and 2018, but part of that increase can be attributed to natural multidecadal temperature fluctuations over the North Atlantic rather than climate change.
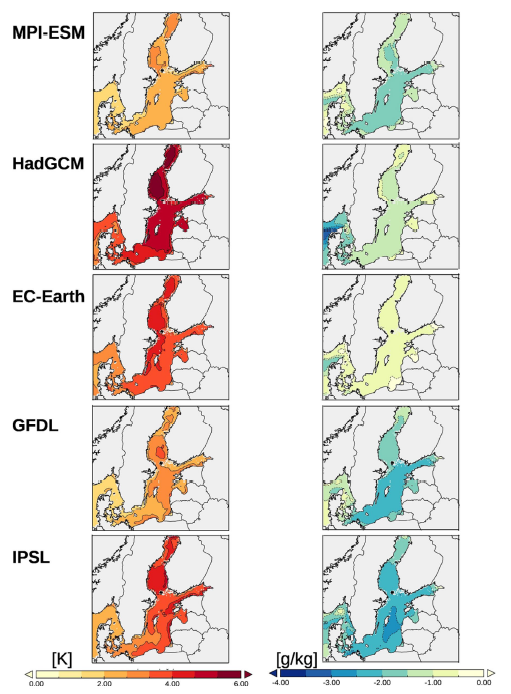
For Kattegat and Skagerrak, the number of downscaled projections is smaller than for the Baltic Sea since many of the regional ocean models used for the Baltic Sea assessments have used outer boundary conditions at the Kattegat/Skagerrak border. Results from downscaling of five global models to the North Sea and the Baltic Sea for RCP8.5, Fig. 8, show that summer SST generally increases most in the Gulf of Bothnia and least in the Kattegat and Skagerrak regions, but also that the increase differs between the different global models (Gröger et al. 2019). According to the SMHI scenario service (SMHI 2022) that is based on the same data for Kattegat and Skagerrak, Tab. 3, the ensemble mean SST increases in Skagerrak and Kattegat are 2.9 °C and 3.0 °C for RCP8.5, i.e. only slightly less than the 3.2 °C projected for the Baltic Sea.
Figure 8. Difference in average summer climatology (2070–2099 minus 1970–1999). Left: sea surface temperature. Right: sea surface salinity. Based on downscaling of five global climate models. From Gröger et al. (2019).
SST
SSS
Kattegat
Skagerrak
Kattegat
Skagerrak
RCP4.5
1.8 ° C
1.7 ° C
-0.6
-0.8
RCP8.5
3.0 ° C
2.9 ° C
-1.2
-1.5
Table 3. Ensemble mean changes in sea surface temperature (SST) and sea surface salinity (SSS, in g/kg) for Kattegat and Skagerrak for the period 2071-2100 compared with the reference period 1976-2005.
4 - Marine heatwaves
Marine heatwaves (MHWs) are episodes that potentially can severely change marine ecosystems with far-reaching ecological and socio-economic consequences. MHWs can generally be defined as a prolonged discrete anomalously warm water event that can be described by its duration, intensity, rate of evolution, and spatial extent, several more specific definitions have been made (Hobday et al., 2016). IPCC has warned that increasing frequency and severity of MHWs attributable to global warming is a worldwide threat to marine ecosystems (Collins at al. 2019). In the Pacific such heatwaves have reached enormous proportions and duration (Laufkötter et al. 2020). Huang et al. (2021) analyzed the historical occurrence since 1982 of MHWs north of the 60° latitude, and showed that in the Norwegian Sea east of the 0° meridian the frequency has been 1-2 year -1, and slightly higher between the 0° meridian and Iceland. The frequency around Svalbard was 2-3 year -1. The annual mean MHW frequency over the entire Barents Sea increased by 62 % from the pre- to the post-2004 period, the number of MHW days with 73 %. More than half of all MHW days from 1982-2020 occurred in the last decade (Mohamed et al., 2022).
Other literature relevant to the Nordic regions was reviewed and evaluated in a report ordered by the Norwegian Environment Agency (Borgman et al. 2022). They pointed out that MHW literature focused on the Nordic Sea is scarce, but that satellite information since 1982 can be utilized for many purposes. Moreover, there exist a substantial number of time series on temperature data from water profiles collected by research vessels that can be added to the suite of data for a reanalysis of historical MHWs. Borgman et al. (2022) also suggested a list of recommendations for scientific efforts. They recommend documentation of the historical record of MHW, and to strengthen biological monitoring and understanding of biological responses to future climate. In accordance with recommendations by IPCC the need for more marine protected areas was emphasized.
It has been demonstrated that the hydrographical and meteorological mechanisms involved in the formation and stabilization of MHWs are diverse and not completely constrained (Holbrook et al. 2019). Therefore, predictions of future regional patterns are rather imprecise, but all studies indicate increased frequency, severity, and duration concomitant with severity of global warming. At the present global mean temperature 1°C above preindustrial value, the North Sea and Norwegian Sea experience a frequency of MHWs 2-4 times the preindustrial probability (Borgman et al. 2022). In a world with 3.5°C warming, the relative probability is estimated to increase to 20-30 times that of preindustrial times.
5 - Salinity changes
Salinity is an important parameter for the marine ecosystems, especially in the Baltic Sea where the species have adjusted to the low salinities present there. Salinity projections in the Baltic Sea have large uncertainty due to problems with the representation of the hydrological cycle in global climate models. Early projections showed a clear future decrease in Baltic Sea salinities due to increased runoff of freshwater, but the most recent assessments (Climate Change in the Baltic Sea, 2021, Meier et al. 2022b) state that there are no robust estimates of future salinity changes for the Baltic Sea. The main reason for this changed conclusion regarding salinity is that the most recent projections also include sea level rise in the entrance region, which will tend to increase salinities due to larger inflows of saline water.
Projections for the North Sea do show decreased salinities due to increased runoff. For the extreme RCP8.5 scenario the projected decrease in sea surface salinity by the end of the century is –1.5 g kg -1 in Skagerrak and –1.2 g kg -1 in Kattegat based on downscalling of 5 global climate models (Fig. 8 and Table 3; Gröger et al. 2019).
6 - Ocean acidification, trends and potential consequences
The ocean has absorbed about a third of the human emissions of CO2 into the atmosphere. Increasing concentration of CO2 in the atmosphere affects the acidity of seawater, generally reducing pH and saturation state of carbonate minerals. When pH decreases, the saturation states of carbonate minerals (aragonite and calcite) decrease. The degree of saturation decreases downwards in the water column and the saturation horizon is the boundary between supersaturated conditions above this depth and undersaturated conditions below, i.e., the level below which carbonate minerals begin to dissolve. Acidification, causing decreasing saturation rate and the saturation horizon moving upwards in the water column, is potentially a major challenge for several forms of marine life, especially corals and calcifying algae, but also sea snails with “hard parts”.
In our waters, we find the lowest pH in the warm Atlantic water. However, mainly since more CO2 can be dissolved in cold than in warmer water, the lowest saturation states for carbonate minerals are in the colder Arctic waters to the north and west (Fransner et al. 2022). Currently the saturation horizon for aragonite in our region is at around 2000 m, i.e. all water deeper than this is undersaturated with this carbonate mineral. Calcite is less soluble than aragonite, and the entire water column is, so far, supersaturated.
The mean global surface seawater pH has decreased by 2 * 10-3 pH units per year since the 1980ies. In the Nordic Seas the ocean acidification has been faster than the global average. Since the onset of the Industrial Revolution, the pH level in our region has decreased by around 0.1 units. Measurement series since the 1990s show a significant decrease in pH in almost all locations in the North Sea and the Norwegian Sea where we have sufficient data to investigate trends. Tab. 4 shows the development in different parts of the Nordic (Greenland-Iceland-Norwegian) Seas and Tab. 5 for three Danish fjords.
Depth, m
Norwegian Basin
Lofoten Basin
Greenland Sea
Iceland Sea
0-200
-3.04±0.32
-2.40±0.23
-2.53±0.74
-3.31±0.30
200-500
-2.22±0.32
-1.89±0.31
-1.61±0.22
-2.51±0.27
Table 4. Change during the recent 20 years in pH ± standard errors in 10-3 pH units per year. From Fransner et al. (2022).
Depth, m
Ringkøbing Fjord on the Jutland west coast (1996-2016)
Skive Fjord in the Limfjorden (1980-2010)
Roskilde fjord on Zealand 1972-2016
0-5
-8.8±1.6
-6.1±1.7
-3.1±1.1
Table 5. Change over time of pH in three Danish fjords i n 10-3 pH units per year . From Carstensen et al. 2018.
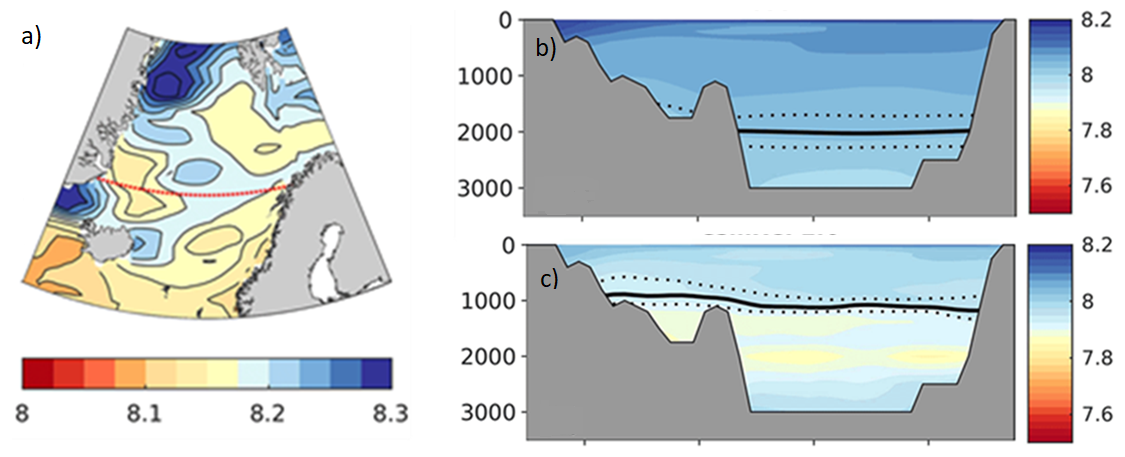
Future development of ocean acidification in the Nordic Seas as a function of CO2 emission scenarios has been projected by Fransner et al. (2022; Fig. 9). In the rather optimistic RCP-2.6 scenario the upper ocean pH will continue to decrease for the next decennium but will stabilize close to pH=8 after 2050. In the business-as-usual RCP8.5, pH steadily continues to decrease throughout the century and will average 7.67 in 2100. Within this scenario large parts of our sea areas will be undersaturated with aragonite before the end of this century.
Fransner et al. (2022) also present a comprehensive review of observations and model results from the beginning of the industrial revolution until present. The geographical distribution of acidification, measured as the saturation state of calcium carbonates in the upper waters, decreased more rapidly closer to land in the Norwegian Sea compared to further west
Figure 9. Present and future pH in the Nordic Seas. Zonal cross section at 70⁰N overlying present surface pH map a). Distribution of pH at depth 0-3000 m along the cross section at present in b) and under RCM2.6 in c). The horizontal solid lines in b) and c) show the saturation horizon of aragonite, the dotted lines indicate the uncertainty field. Adapted from Fransner et al. (2022).
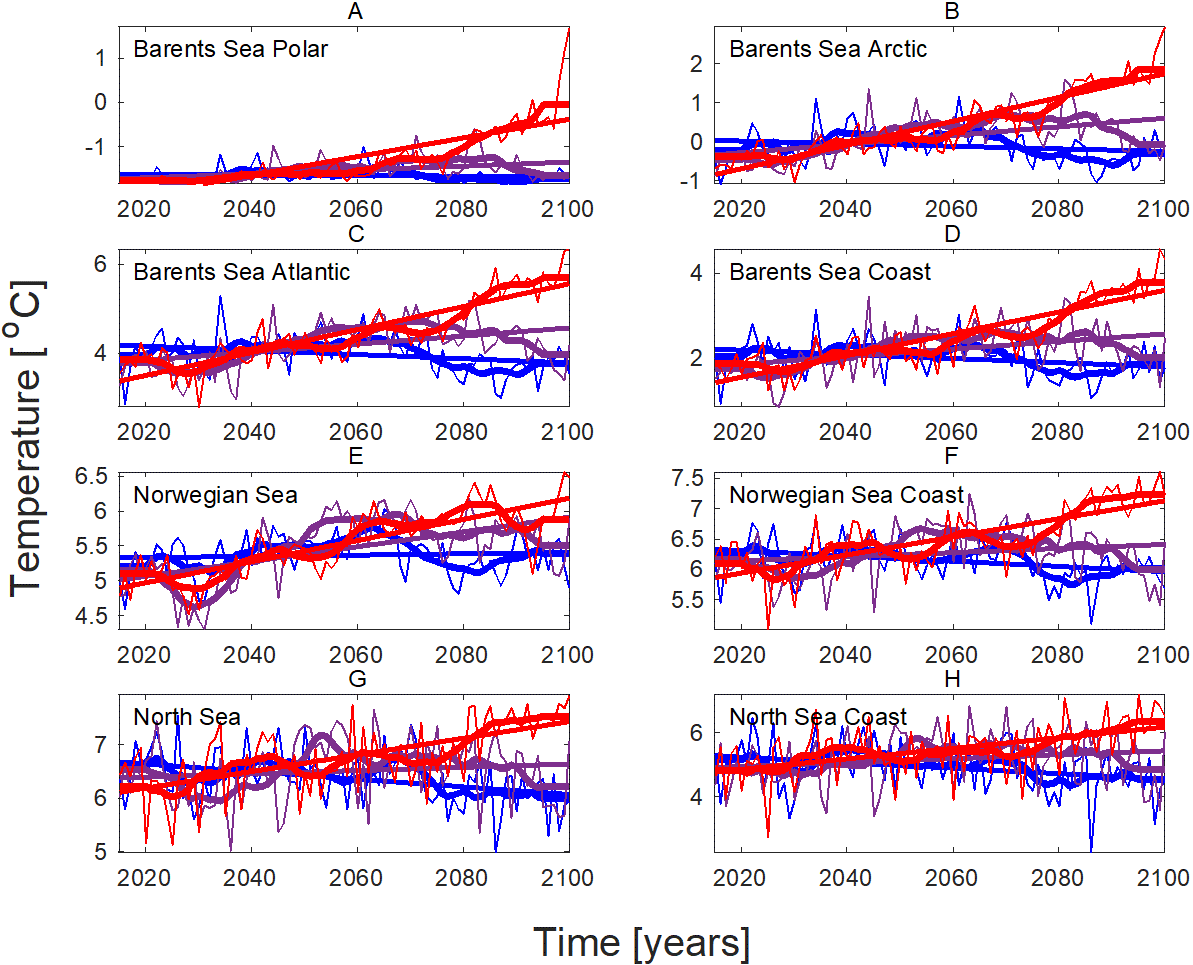
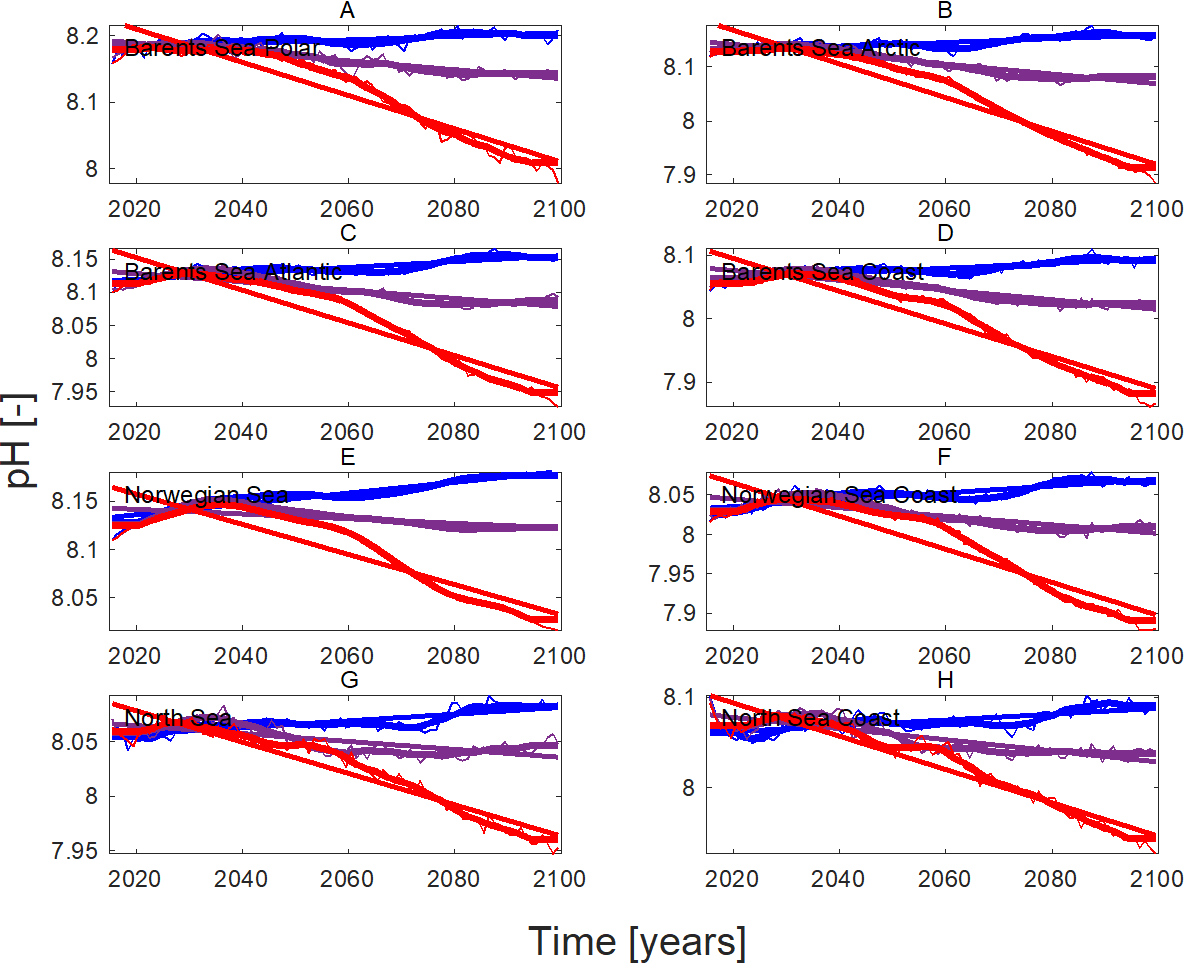
In addition to physical variables (described above) Sandø et al. (2022) also estimated the development of biogeochemical variables using the model system NORWECOM.e2e (Skogen et al., 1995). The physical model results were used as input to NORWECOM.e2e, which delivered pH (and also oxygen content, primary, and secondary production). For pH the projected decrease during the period 2015-2100 was, as expected, largest under scenario SSP5-8.5. For SSP1-2.6 the pH was stable or even increased slightly (Fig. 10). The spatial pattern in projected change in pH from 2015 to 2100 for each of three IPCC scenarios is shown in Fig. 11.
Figure 10. Projected development of pH during the period 2015-2100 in different ocean and coastal areas. Blue IPCC SSP1-2.6 (“2°C”), purple SSP2-4.5 (“moderate”), and red SSP5-8.5 (“extreme, business as usual”). Thin lines are annual values, thick lines decadal values, and straight lines indicate trends. A. Barents Sea, Polar region; B. Barents Sea Arctic region; C. Barents Sea Atlantic region; D. Barents Sea, coastal region; E. Norwegian Sea, ocean region; F. Norwegian Sea, coastal region; G. North Sea, open region; H. North Sea coastal region. From Sandø et al. (2022).
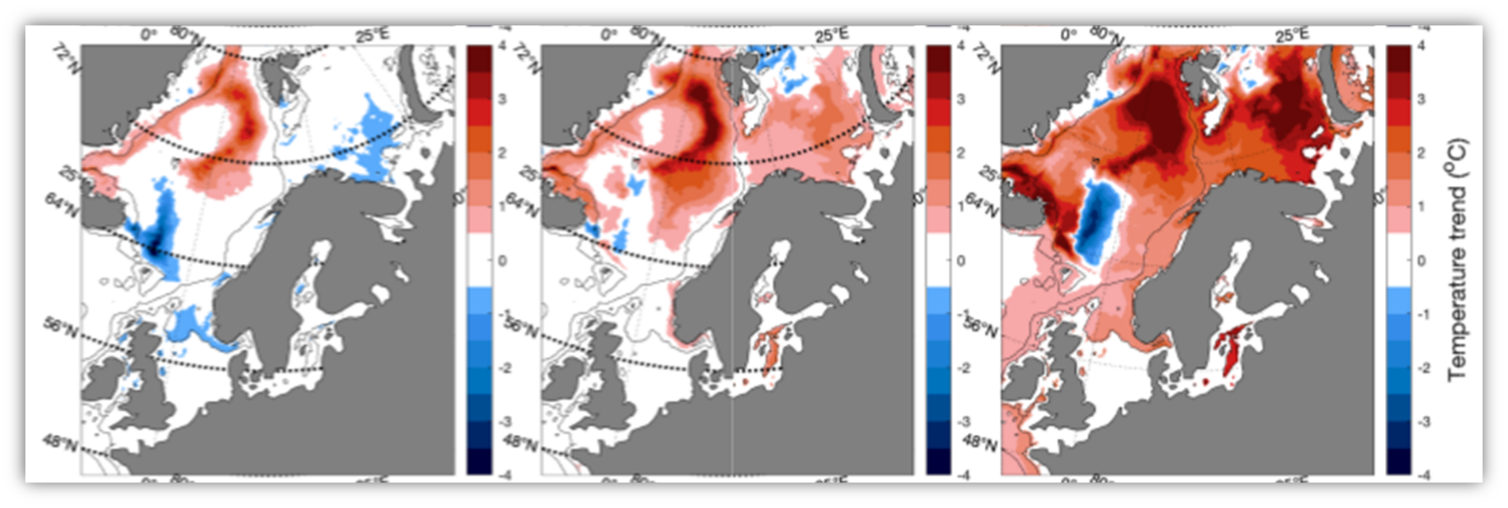
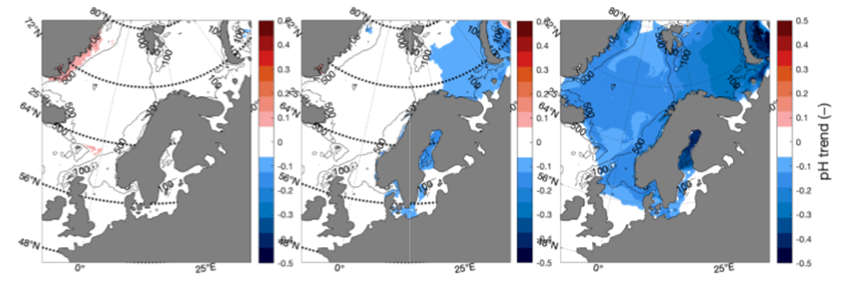
Figure 11. Spatial pattern in projected changes in pH from 2015 to 2100 for three IPCC scenarios. Left panel SSP1-2.6 (“2°C”), central panel SSP2-4.5 (“moderate”), and right panel SSP5-8.5 (“extreme, business as usual”). From Sandø et al. (2022). Values for the Baltic are likely more uncertain and should be interpreted with caution.
For coastal areas, ocean acidification does not only depend on atmospheric CO2 levels, but also on changes in the catchment areas and internal cycling of carbon and nutrients. Increased river runoff will lower salinity and thereby the alkalinity, while weathering on land and eutrophication may increase alkalinity. For the Baltic Sea there will most likely be a pH reduction, but the degree of this reduction is still highly uncertain (Climate Change in the Baltic Sea, 2021, Gustafsson and Gustafsson, 2020). In our northernmost regions, runoff from (mainly the large Russian) rivers is increasing and river water generally has a low calcium content.
Biological effects of ocean acidification have been hard to ascertain and scientists disagree on species’ sensitivity and scope for adaptation to this pressure (e.g., IPCC 2019). This is reviewed by Hurd et al. (2020).
7 - Deoxygenation
Model and observation results demonstrate that global warming leads to an expansion of ocean water bodies with low oxygen (hypoxia) and no oxygen (anoxia), and consequently the volume of habitats for organisms that are dependent on oxygen will shrink (Schmidtko et al. 2017). Moreover, reversal of the present development may take millennia, because of the slow turnover of bottom waters.
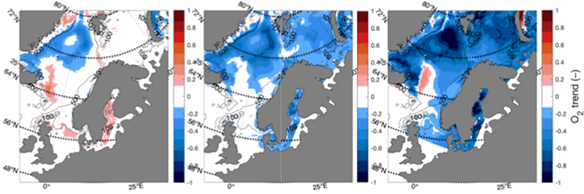
The rate of deoxygenation is slow in the North Atlantic compared to other regions of the world’s oceans (Schmidtko et al. 2017). Therefore, impacts will be small in most European coastal waters, where local mechanisms dominate the 21st century oxygen balance. However, in the Arctic Ocean, oxygen concentration will decrease mainly because the predicted warming reduces O2 solubility (Schmidtko et al. 2017; Sandø et al. 2022). Projected temporal development is shown in Fig 12, spatial pattern of change in O2 concentration in Fig. 13 (both from Sandø et al., 2022).
Figure 12. Spatial pattern in projected changes in oxygen concentration from 2015 to 2100 for three IPCC scenarios. Left panel SSP1-2.6 (“2 °C”), central panel SSP2-4.5 (“moderate”), and right panel SSP5-8.5 (“extreme, business as usual”). From Sandø et al. (2022).
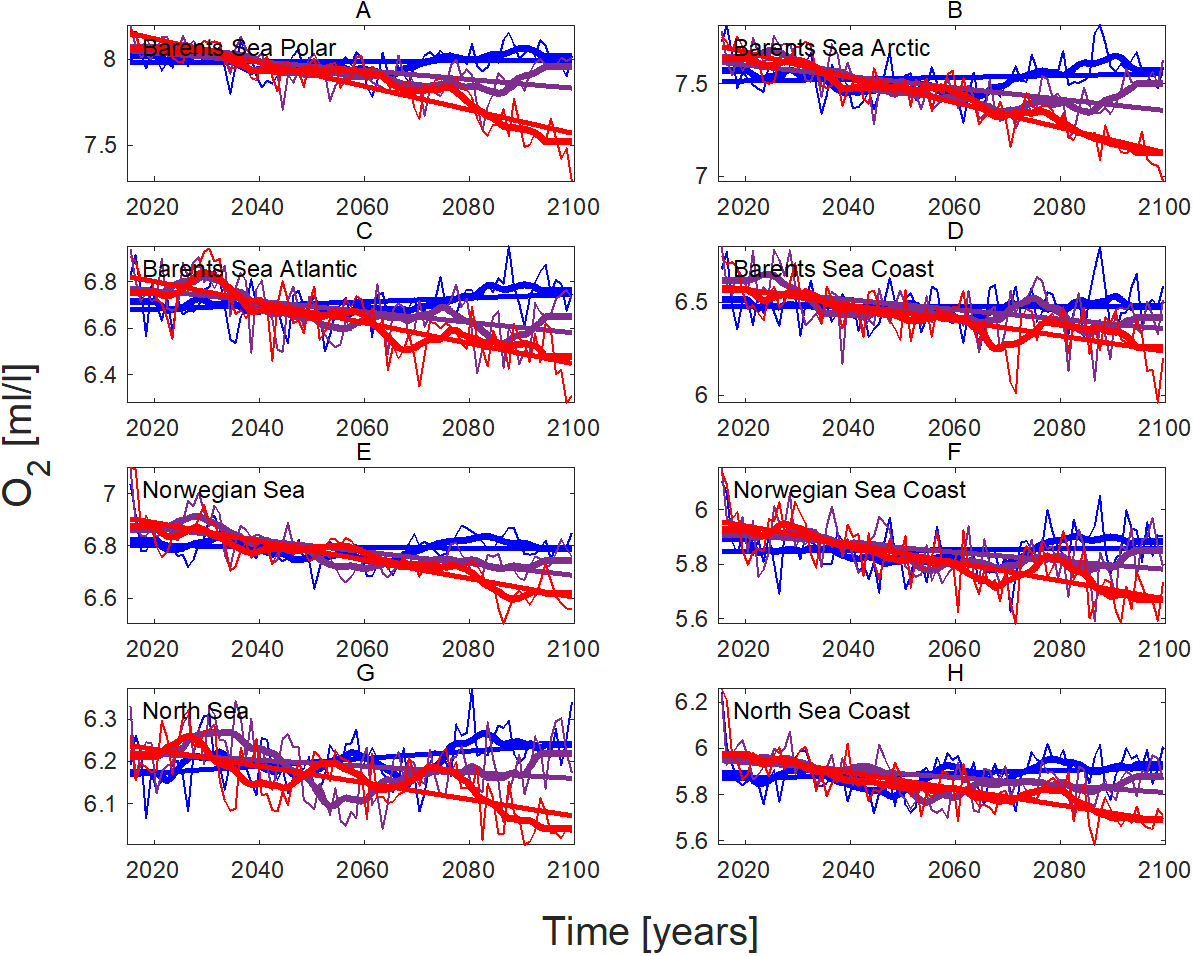
Figure 13. Projected development of oxygen concentration during the period 2015-2100 in different ocean and coastal areas. Blue IPCC SSP1-2.6 (“2 °C”), purple SSP2-4.5 (“moderate”), and red SSP5-8.5 (“extreme, business as usual”). Thin lines are annual values, thick lines decadal values, and straight lines indicate trends. A. Barents Sea, Polar region; B. Barents Sea Arctic region; C. Barents Sea Atlantic region; D. Barents Sea, coastal region; E. Norwegian Sea, ocean region; F. Norwegian Sea, coastal region; G. North Sea, open region; H. North Sea coastal region. From Sandø et al. (2022).
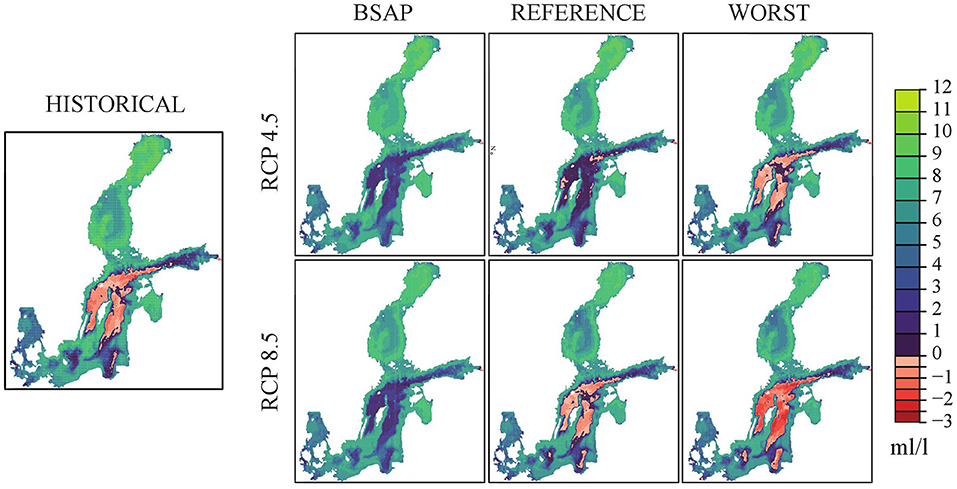
The Baltic Sea deep oxygen conditions are influenced by a permanent salinity stratification that limits ventilation of the deep water to the rare occasions when saline surface water from the North Sea enters though the shallow and narrow Danish Straits. Large amounts of nutrients that have accumulated in the system during the last century have caused a situation with large algae blooms that sink to the bottom and consume the oxygen with hypoxic and anoxic bottom areas as a consequence. Today the situation is worse than ever (Almroth-Rosell et al. 2021) although the nutrients loads have been drastically reduced since the 1980s (Gustafsson and Arneborg 2020). Projections for a combination of climate and nutrient load scenarios have been performed with a coupled physical-biogeochemical ocean model to study the relative influence of climate change and nutrient loads on future oxygen conditions (Saraiva et al. 2019, Fig. 14). The nutrient load scenarios were (i) the Baltic Sea Action Plan (BSAP) where nutrient loads followed the BSAP recommendations after 2020, (ii) a reference case, where land use in the catchment area was assumed to be similar to today, and (iii) a worst-case scenario with increased nutrient loads from cities and farmlands. It was found that nutrient load scenarios were more important for future oxygen conditions than climate change, although climate change also has a negative influence as it amplifies oxygen depletion. For all scenario except the worst climate scenario (RCP8.5) combined with the worst nutrient scenario, oxygen conditions will be better at the end of the century than they are today.
Figure 14. Historical (1976–2005) and projected future (2069–2098) ensemble mean summer bottom oxygen concentrations (in mL L −1 ) in three nutrient load (BSAP, Reference and Worst Case) and two greenhouse gas concentration scenarios (RCP 4.5 and 8.5). Hydrogen sulfide concentrations are represented by negative oxygen concentrations (1 mL H 2 S L −1 = −2 mL O 2 L −1 ). From Saraiva et al. (2019).
8 - Primary production
Future changes in temperature, precipitation, freshwater runoff, wind, and (in the northern parts) ice cover, may, through affecting nutrient availability and seasonal dynamics, lead to alterations in primary production in the Nordic region (phytoplankton and ice algae; Eriksen et al. 2021).
Primary production is dependent on nutrients mixed up from deeper water to the upper layer of the sea where light is available for photosynthesis. Warming of surface seawater and increased freshwater from precipitation leads to stronger stratification, and reduced vertical advection between surface and deeper water layers. This will again lead to a decrease in primary production and total biomass, which further can cause reduced energy flow upwards in the food web. On the other hand, stronger winds and an increase in the number and/or intensity of storms can have a positive effect on plankton production through weaker layering and thus increased mixing of nutrients. This is, however, complicated as really strong mixing of the water masses may transport the planktonic algae down to depths with insufficient light for photosynthesis. Further, changes in stratification may affect the balance between the different phytoplankton groups.
The Nordic Seas are situated in the transition zone of waters south of Iceland with predicted decrease in production, and Arctic waters with predicted increase. Data from satellites show no increase in the Norwegian Sea driven by global warming, a small increase in the Greenland Sea, and a clear increasing trend in the Polar Ocean (Børsheim 2017; Lewis et al. 2020; ICES 2022b).
In temperate European ocean and shelf Sea areas, including the North Sea, future climate is predicted to lead to reduced primary production (Laufkötter et al. 2015; Sandø et al. 2022). Community production is expected to decrease by up to 30 % at the end of the century (Carozza et al. 2019 ; Kwiatkowski et al. 2019). Fish and commercial fisheries are expected to be affected by this projected decrease in total production through the food web.
At high latitudes, including the northern parts of the Nordic seas, the effect of climate change on primary production is opposite to many other areas. The extent of the ice has already been significantly reduced, and the period of ice cover is shorter – a process that is expected to continue. Here, total primary production is expected to increase due to more light reaching into the sea and the warming of these previously very cold waters. Contrary, ice algae, with their entire life cycle within or connected to sea ice, are in danger of disappearing or being greatly reduced.
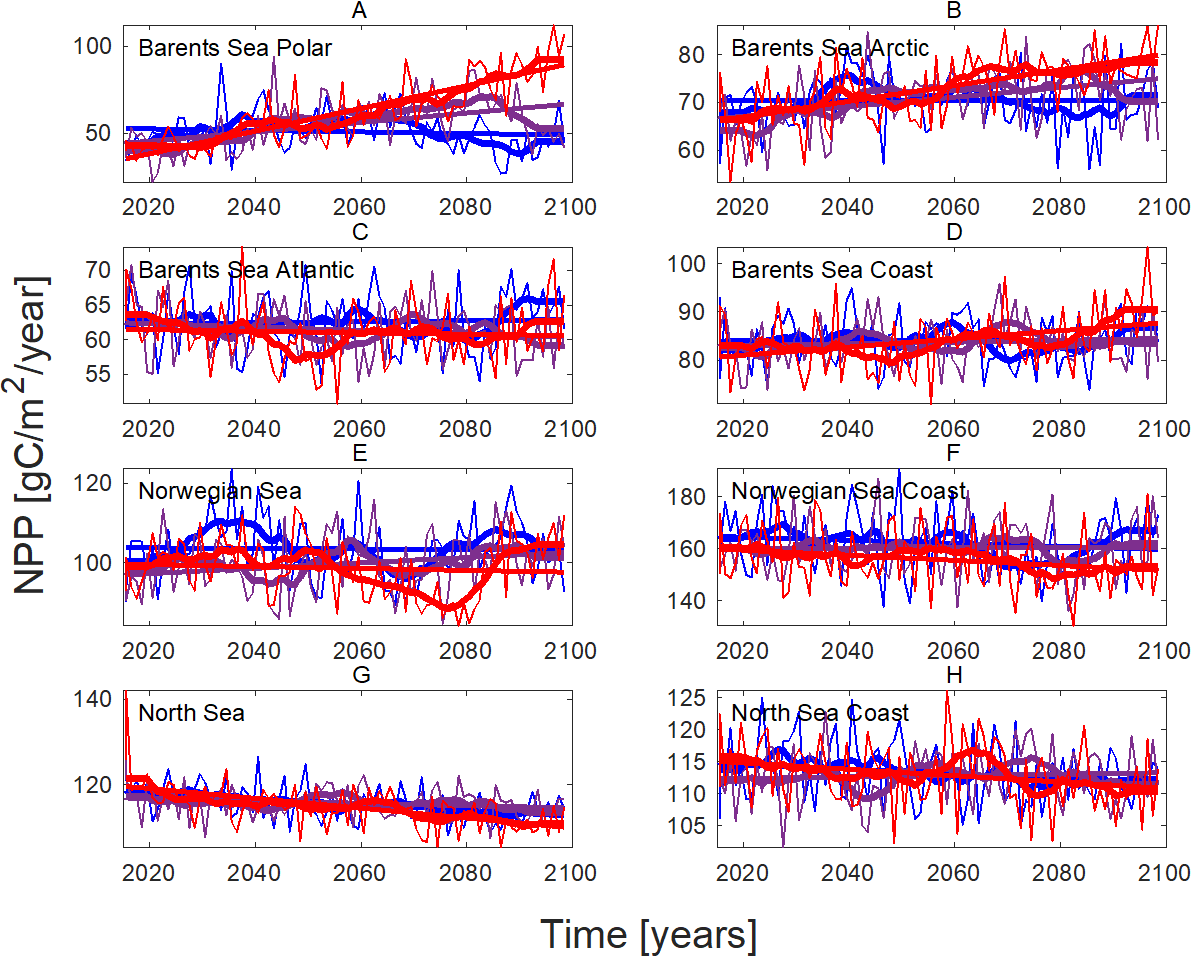
For the arctic and polar regions of the Barents Sea Sandø et al. (2022) project a near doubling of net primary production (NPP) from 2015-2100 for SSP5-8.5, while little or no change is expected under SSP1-2.6 (Figs. 15 and 16).
Figure 15. Projected development of NPP during the period 2015-2100 in different ocean and coastal areas. Blue IPCC SSP1-2.6 (“2 °C”), purple SSP2-4.5 (“moderate”), and red SSP5-8.5 (“extreme, business as usual”). Thin lines are annual values, thick lines decadal values, and straight lines indicate trends. From Sandø et al. (2022).
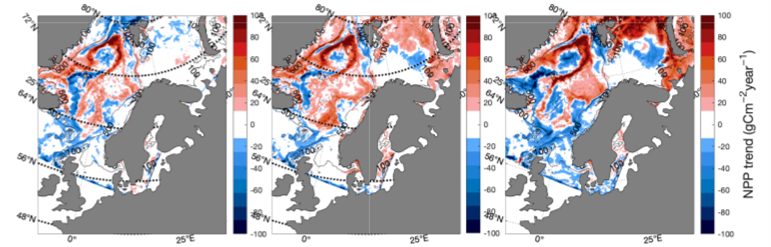
Figure 16. Spatial pattern in projected changes in NPP from 2015 to 2100 for three IPCC scenarios. Left panel SSP1-2.6 (“2 °C”), central panel SSP2-4.5 (“moderate”), and right panel SSP5-8.5 (“extreme, business as usual”). From Sandø et al. (2022).
In the Baltic Sea, primary production depends more on nutrient loads than on climate change. Climate change and warmer water will tend to increase primary production, but the expected long-term reductions due to reduced nutrient loads for the BSAP and reference scenarios are expected to cause reduced primary production at the end of the century (Saraiva et al. 2019). Primary production is only expected to increase for the worst case nutrient scenario.
9 - Secondary production
Biogeographic changes in zooplankton communities may have important impact on ecosystem structure and functioning. This is the case not least because they can lead to significant alterations in nutrient content and fatty acid profiles, which in turn affects the survival and growth of fish larvae. There is a clear example of this in our region. Here, climate change, through temperature increase, has caused redistribution of zooplankton species especially in the North Sea (Beaugrand et al. 2002, Edwards et al. 2016). The calanoid copepod Calanus finmarchicus has over a period of several decades been outcompeted by its “cousin”, the more warm-water affiliated species Calanus helgolandicus . Although only experts can see the difference, this change has had major implications for higher trophic levels. Nauplii (early stages) of Calanus finmarchicus are normally the main food for early life stages of North Sea cod. Cal helgolandicus nauplii have less nutritional value and appear too late in the season to match the need of the small cod. This mechanism is likely one of the main reasons (in addition to heavy fishing) for the abundance of cod in the North Sea being at worryingly low levels. This is an example of warming leading to a reduction of reproductive success, because early life stages no longer are present at the same time as food is available (the match-mismatch hypothesis (Cushing 1990, Durant et al. 2007).
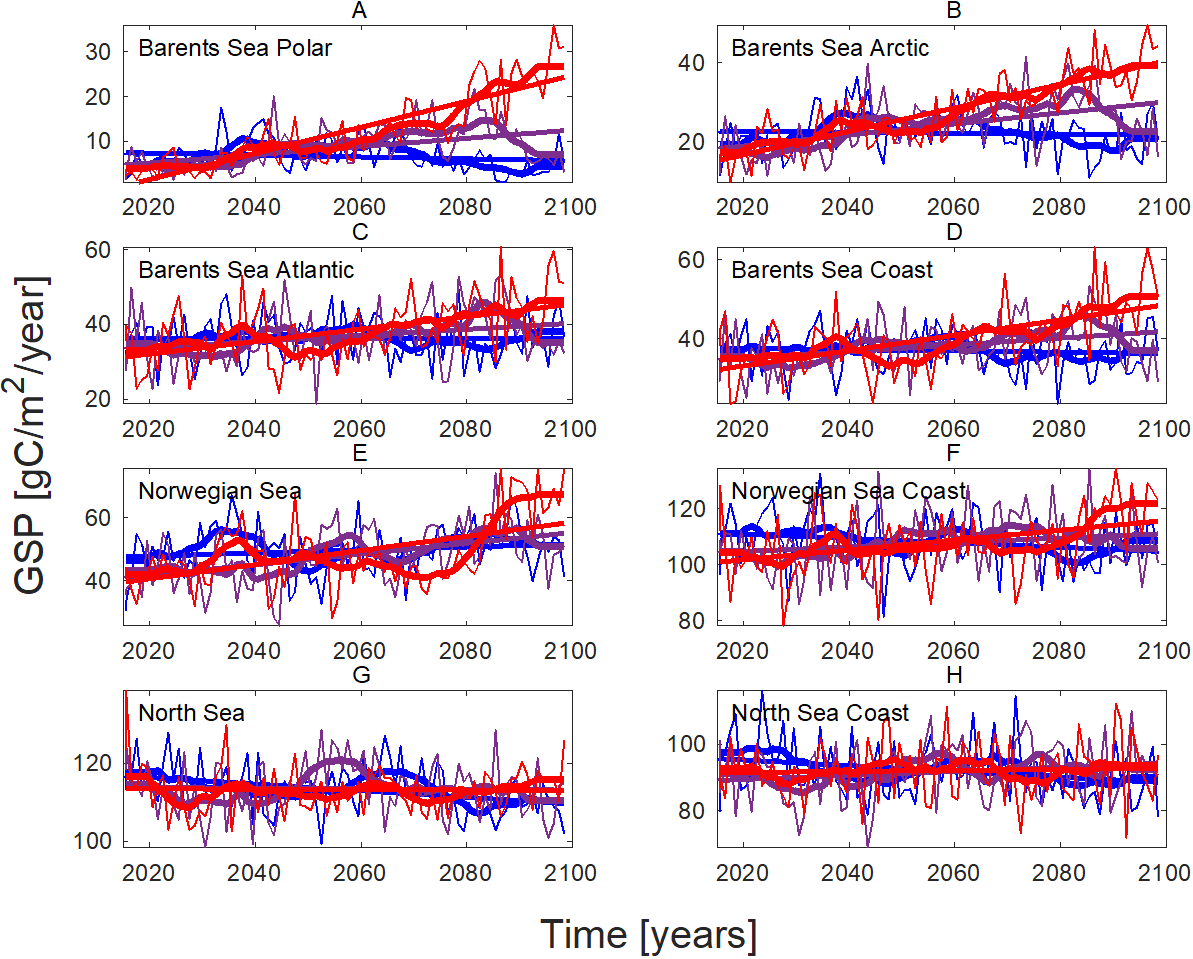
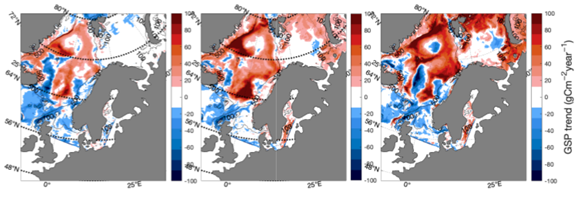
Relatively recent changes in the zooplankton community have also been seen in the Barents Sea (Eriksen et al. 2017), while no significant changes in zooplankton biomass or secondary production have been observed in the Norwegian Sea (ICES 2020, Kjesbu et al. 2021). The recent major modelling work of Sandø et al. (2022) also covered the anticipated future development of gross secondary production (GSP). Projected development of GSP at different locations is shown in Fig. 17, while Fig. 18 shows spatial development for three climate change scenarios.
Figure 17. Projected development of GSP during the period 2015-2100 in different ocean and coastal areas. Blue IPCC SSP1-2.6 (“2°C”), purple SSP2-4.5 (“moderate”), and red SSP5-8.5 (“extreme, business as usual”). Thin lines are annual values, thick lines decadal values, and straight lines indicate trends. From Sandø et al. (2022).
Figure 18. Spatial pattern in projected changes in GSP from 2015 to 2100 for three IPCC scenarios. Left panel SSP1-2.6 (“2 °C”), central panel SSP2-4.5 (“moderate”), and right panel SSP5-8.5 (“extreme, business as usual”). From Sandø et al. (2022).
10 - Fish in the wild
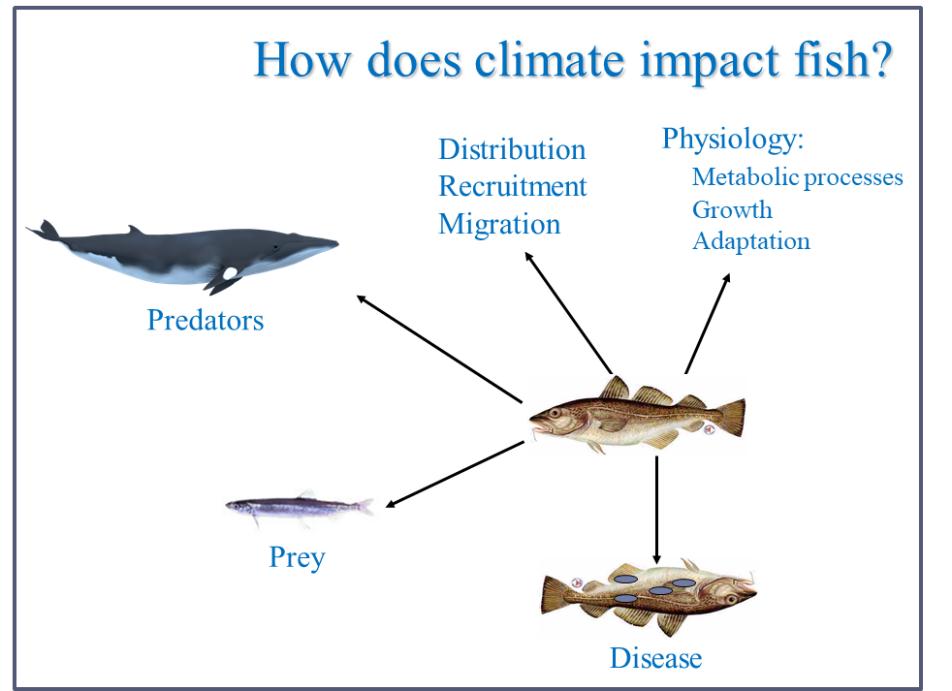
Marine fish in the Nordic region are significantly affected by variability in their environment, both directly on their physiology or indirectly through predators or prey. Impacts on individual fish may lead to responses at the population level, affecting distribution, seasonal migration patterns, and recruitment success (Fig. 19). Although it yet often is difficult to distinguish between impacts of natural variability and anthropogenic climate change, there are now developments we ascribe to the latter and we project clearer and stronger effects in the future.
Figure 19. Climate variability and change affects individual fish and fish populations through many different mechanisms.
Higher temperature, retreating sea ice, and changes in prey availability is affecting marine fish in the northern Barents Sea. Here higher temperatures have expanded suitable feeding areas for boreal/subarctic species towards the previously cold north and east and has contributed to increased Atlantic cod production (Kjesbu et al., 2014). In contrast, arctic species are expected to be affected negatively by a shortened ice covered season and reduced sea ice extent through loss of spawning habitat and shelter, increased predatory pressure, reduced prey availability, and impaired growth and reproductive success. Until recently, the northern Barents Sea was dominated by these small-sized, slow-growing arctic fish species with specialized diets, except for polar cod mostly living in close association with the sea floor. Thus, simultaneous with rising sea temperatures and retreating sea ice, these Arctic fishes are being replaced by boreal, fast-growing, large-bodied generalist fish moving in from the south. These large, migratory predators take advantage of increased production while the Arctic fish species suffer from higher competition and predation and are retracting northwards and eastwards. Consequently, climate change is inducing structural change over large spatial scales, leading to a borealisation or ‘Atlantification’ of the European Arctic biological communities (Fossheim et al., 2015; IPCC 2019).
An even more pronounced recent range expansion is that of the summer feeding distribution of the temperate Atlantic mackerel in the Nordic Seas. From 1997 to 2016 the total area occupied by this large stock expanded from 0.4 to 2.5 million km 2 and the centre-of-gravity of distribution shifted westward by 1650 km and northward by 400 km, far into Icelandic and Greenland waters and even up to Svalbard. This range expansion was linked to a combination of a pronounced increase in stock size and warming of the ocean (Fig. 20; Olafsdottir et al., 2019; IPCC 2019). The mechanism may be more complex though. The analyses of Pacariz et al (2016) suggest that declining silicate concentrations along the northern European continental slope reduces primary and thus secondary production, intensifying food scarceness in the east and adding to the incentive for the mackerel to migrate westward. Under the RCP4.5 and RCP8.5 scenarios further range expansions of mackerel are projected in Greenland waters (Jansen et al., 2016). However, further northwards expansion of planktivorous species may generally be restricted by them not being adapted to lack of primary production during winter (Sundby et al., 2016), while lack of light during the long winter season may seriously hamper the expansion of visual predators in general.
Figure 20. Mackerell spawning area and total distribution area after expansion. Red arrows indicate direction and degree of habitat expansion. Map from IMR.
As described under Secondary production, cod are not doing well in the North Sea. Fortunately, other species are increasing their abundance there. Hake is a warm-temperate codfish that for long has been a popular food fish further south in Europe. Hake is expanding quite rapidly in the northern North Sea and should be well suited for the present conditions there. The amount fished here is still moderate; the recent years around 5000 tons have been caught annually by Norwegian fishers.
In the Baltic Sea, species that already live on the edge of their tolerance limits for salinity will have fundamental challenges if salinity decreases further, while some other species will have an advantage of warmer water and less ice (e.g. Blenckner et al. 2021, Turkia et al. 2022). Nutrient and bottom oxygen conditions also influence the future Baltic ecosystem. Cod is an example of a species that today lives close to several of its tolerance boundaries in the Baltic. Cod require deep water with salinity levels above 11 g/kg and more dissolved oxygen than 2 ml/l to reproduce. The volumes of such waters will probably diminish in the future, putting even larger pressure on the Baltic Cod (Wåhlström et al. 2020).
In IPCC SROCC (2019) future projections of total animal biomass and maximum fisheries catch potential were made on a global scale (Fig. 21). If one zooms in a decrease is seen for most of the Nordic region, except the very northern part. However, this is very rough and more geographically focused model projections are needed to provide a better foundation for understanding the expected future situation in our seas. This has partly been done, and will be followed up in NorScen.
Figure 21. Projected changes (%) by 2081–2100 relative to recent past of total animal biomass (depth integrated, including fishes and invertebrates from FISHMIP) under a) low emission scenario (RCP2.6) and b) high emission scenario (RCP8.5). Maximum fisheries catch potential under c) low emission scenario (RCP2.6) and d) high emission scenario (RCP8.5). IPCC (2019).
The most likely development towards 2050 of 39 fish resources in the North, Norwegian and Barents Seas under the intermediate climate emission scenario RCP4.5 has been assessed by Kjesbu et al. (2022). Contrary to most results for other regions most of the assessed stocks were found to respond positively. However, the stocks will develop entirely different depending upon the encountered stressors: cold-temperate stocks at the southern fringe (like North Sea saithe and cod) and Arctic stocks at the northern fringe (like Polar cod) are expected to be severely negatively impacted, beyond what already is presently observed. On the other hand, warm-temperate stocks expanding from the south (like hake and sprat in the North Sea) were found to do well along with cold-temperate stocks as Barents Sea cod and haddock currently inhabiting below-optimal temperature (Fig. 22).
Figure 22. Future winners and losers. The most likely development towards 2050 of 39 fish resources in the North, Norwegian and Barents Seas under the intermediate IPCC climate emission scenario RCP4.5 as assessed by Kjesbu et al. (2022). A hybrid approach with expert opinions supported by an extensive literature review with mechanistic approaches was used.
These projections were confirmed and strengthened by an even more recent and thorough study of the same areas by Sandø et al. (2022). They assessed the accumulated directional development for marine resources, taking into account projected development of sea temperature, sea ice, O2, pH, primary and secondary production. Further, they undertook separate evaluations for each of the three most recent climate emission scenarios SSP1-2.6, SSP2-4.5, and SSP5-8.5 (Fig. 23).
Figure 23. Accumulated directional development (relative scale) for populations in the North Sea (to the left of the vertical line), the Norwegian Sea (middle, between the full and stippled vertical lines) and the Barents Sea (right of the stippled vertical line). Colours represent anticipated development within the three climate emission scenarios SSP1-2.6, SSP2-4.5, and SSP5-8.5. Modified from Sandø et al. (2022).
11 - Productivity of farmed fish
The potential effects of climate change on aquaculture range from changes to production capacity in existing cultivation areas to changes in the areas themselves. Locations may become unsuitable for particular species, but also suitable for new species (Cubillo et al. 2021). The prediction of where and how such changes may occur is challenging, not least because the cultivated species may themselves exhibit plasticity, which makes it difficult to forecast the degree to which different locations and culture types may be affected (Cubillo et al. 2021).
Climate change projections of six key aquaculture species in Europe showed different responses depending on the species and geographic region (Tab. 6). Most of the studied finfish species were projected to have increased feed conversion ratio (FCR, i.e. decreased feeding efficiency) in both mid-century and end-of-century scenarios (Cubillo et al. 2021). Hence, fish will need more feed to reach harvest size and feed costs will be higher (Tab. 6). In Norway, due to colder baseline (current) temperatures, the temperature under RCP4.5 does not reach such high values as to observe a negative effect on salmon growth. In fact, growth and profit increased in both mid- and end-of-century scenarios when compared to present-day results (Tab. 6). The RCP 8.5 scenarios do not cover Norwegian salmon so for them no conclusion can be drawn for more extreme temperatures.
Table 6 Projected changes (RCP4.5 and RCP8.5) in productivity in the mid (upper panel) and end-century (bottom panel) scenarios across regions and species, when compared to current conditions. The colors illustrate changes: Red = significantly worse, orange = moderately worse, yellow = no change, green = moderately better, blue = significantly better. The letters represent the variability of the results: S = low variability, M = moderate variability and L = high variability. APP, Average Physical Product; FCR, Feed Conversion Ratio. From Cubillo et al. 2021.
Country
Species
Harvest weight
Production
APP
Revenue
Profit
FCR
RCP 4.5
RCP 8.5
RCP 4.5
RCP 8.5
RCP 4.5
RCP 8.5
RCP 4.5
RCP 8.5
RCP 4.5
RCP 8.5
RCP 4.5
RCP 8.5
Ireland
Salmon
S
S
S
S
S
S
S
S
S
L
S
M
Norway
Salmon
S
S
S
S
S
L
Turkey
Sea bass
S
L
S
S
L
S
L
S
L
L
L
Spain
Gilthead bream
S
L
S
L
S
L
S
L
S
L
S
S
Denmark
Blue mussel
L
L
L
L
L
L
L
L
L
L
Netherlands
Blue mussel
L
M
L
L
L
L
L
L
L
L
Netherlands
Pacific oyster
L
M
L
S
L
S
L
S
L
S
Portugal
Med mussel
L
M
L
S
L
S
L
S
L
S
Country
Species
Harvest weight
Production
APP
Revenue
Profit
FCR
RCP 4.5
RCP 8.5
RCP 4.5
RCP 8.5
RCP 4.5
RCP 8.5
RCP 4.5
RCP 8.5
RCP 4.5
RCP 8.5
RCP 4.5
RCP 8.5
Ireland
Salmon
S
S
S
S
S
S
S
S
L
L
M
M
Norway
Salmon
L
L
L
L
S
L
Turkey
Sea bass
L
L
L
L
L
L
L
L
L
L
L
L
Spain
Gilthead bream
S
L
S
L
S
L
S
L
S
L
S
S
Denmark
Blue mussel
L
L
L
L
L
L
L
L
L
L
Netherlands
Blue mussel
L
L
L
L
L
L
L
L
L
L
Netherlands
Pacific oyster
M
S
L
S
L
M
L
M
L
M
Portugal
Med mussel
M
L
S
L
S
L
S
L
S
L
Shellfish bivalve species showed a decreasing trend in relation to most productivity parameters (e.g. average harvest size, production and profit) as climate change progressed under both emission scenarios (Tab. 6). The Limfjorden is currently the most productive area for both mussel fishery and aquaculture (bottom and suspended cultures) in Denmark. The longline culture of blue mussel in Denmark was projected to be most deleteriously impacted in the study. Increased number of hypoxia events and ocean acidification were, however, not considered in the projections and could amplify the negative impacts on shellfish even further.
Global population and seafood demand are both increasing, while fisheries decline during this period of rapid climate change. Aquaculture is well positioned to help meet the world’s future demand for protein and food security needs but is also heavily dependent on the environment and thus highly vulnerable to climate change effects since it relies on specific species that are sufficiently domesticated and takes place at fixed locations (Cubillo et al. 2021) . There are, however, opportunities for adaptation. In offshore-suspended cultivation systems, the effects of climate change seem to be ameliorated by oceanic conditions. The Norwegian salmon sector is already investing in moving production systems offshore. In Norway a more northerly distribution of coastal salmon farms is also an expected response to increasing sea temperatures. Steeves et al. (2018) also concluded that offshore aquaculture should be considered as a cultivation method to avoid increased temperature-related mortality of blue mussels from thermal stress.
12 - Marine mammals
For marine mammals, the warming has been negative for a number of particularly sensitive Arctic seal and whale species (Eriksen et al., 2021). Climate change generally has a negative impact on the grazing areas and breeding grounds of a number of Arctic marine mammals (Eriksen et al., 2021). Some of the Barents Sea species that have proven particularly sensitive to this are described here. Beluga whales around Svalbard face challenges with decreasing ice cover. Killer whales are an increased threat to them in areas with little sea ice. In addition, the areas in front of glaciers where beluga whales mainly hunt are becoming smaller and smaller as the glaciers melt and retreat. Nevertheless, beluga whales seem to be able to adapt to the new conditions to some extent. They now spend more time out in the fjords away from glacier fronts on the west side of Svalbard and probably hunt for Atlantic fish species. Narwhal is considered to be one of the Arctic marine mammal species most sensitive to climate change. They prefer cold Arctic waters (0.6–1.5°C) and studies on the effects of past climate variations suggest that this species responded strongly to changes in temperature and ice extent and will probably do so again as a result of current changes. The challenges are particularly related to their specialised deep-diving eating behaviour, ice dependence, limited distribution area, as well as disturbances from increased shipping. This ongoing increases in sea temperature and reduction in ice extent may also be perilous for bowhead whales , both due to habitat loss and more direct thermal stress. Moreover, also they may be exposed to increased predation from killer whales (this is already a serious problem for the bowhead whale population in the Sea of Okhotsk, off the western Pacific).
Less ice and poorer ice quality can lead to a further decline in the populations of greenland seals and hooded seals (Eriksen et al., 2021). After the drastic changes in ice conditions that started in 2006, which could be termed a “tipping point”, the behaviour of ringed seals around Svalbard has changed a great deal. This applies to both those who migrate out and those who remain close to the coast. They now spend much more time diving and less for resting; everything indicates they are working harder to find food (Hamilton et al. 2015).
One assumes that seals and whales in the North Sea and Skagerrak are somewhat less exposed to climate change as they typically have a wide temperature tolerance range, and there are no clear trends there. Nevertheless, there are major uncertainties here, especially in that they may be negatively affected by reduced food availability (Eriksen et al., 2021).
In the Baltic Sea four marine mammal species are resident: the grey seal, harbour seal, ringed seal, and harbour porpoise. Being at the top of the marine food web, these predators are sensitive to changes throughout the ecosystem, including those related to climate. The overall status of marine mammal species in the Baltic Sea is unfavourable. However, at species level, grey seals and harbour seals show increasing population sizes. Of particular concern is the local population of harbour porpoise in the Baltic Proper, with a population size recently estimated at around 500 animals. Ringed seal is in a critical state in the Gulf of Finland, where it is currently only represented by around 100 animals and has a decreasing abundance (HELCOM 2018).
Future changes in temperature and stratification, prey distribution, quality and quantity will affect all marine mammals, but aggregated effects on their abundance and distribution are unpredictable and the relation of the former to haul-out sites are not well known (HELCOM/Baltic Earth, 2021). Furthermore, the extent and quality of sea ice is important particularly to the ice-breeding ringed seals and also the ice-breeding grey seals.
In some areas, seals are dependent on low-lying haul-outs (land areas for resting, breeding, foraging etc.). Both the ice cover and duration of the ice season have already been markedly reduced. The changes are most prominent in the southern Baltic areas where the duration of ice cover during breeding season of ringed and grey seals has increasingly often been either too short or completely lacking. Disappearance of ringed seals from southern areas is possible and transfer of grey seal breeding to land sites probable. Sea level rise causing flooding of haul-outs in the southern Baltic may force out breeding seals. This will likely cause reduction of harbour and grey seal occurrence to foraging individuals (HELCOM/Baltic Earth 2021).
There are no direct studies of the effects of climate change on harbour porpoises in the Baltic Sea (Meier et al. 2022b). There are a multitude of ways that changes in one parameter can affect others, and we do not currently have the knowledge to predict the cumulative effects this might have on the Baltic Sea harbour porpoise population (Meier et al. 2022b).
13 - Seabirds
Seabirds are typically at the top of the marine food web and are the most numerous and visible of marine top predators. Predicting the effects of climate variability on and through the different trophic levels is a major challenge, and one that increases in complexity at successively higher levels of the food web up to seabirds. Worldwide, seabirds have declined faster than terrestrial bird groups with comparable numbers of species, with most trends consistent with climate change.
Seabirds can be affected by changing climate both directly, for example, if extreme weather becomes more frequent, or indirectly, through changes in their food supply. There is a substantial body of evidence suggesting that in most cases indirect effects are the more important of the two, but with fluctuations in seabird demography and population dynamics caused in part by climate fluctuations acting through the availability and distribution of food.
Effects of climate on life history traits have been documented across many species and populations in Nordic waters (e.g., Brander et al., 2016, Eriksen et al., 2021). Seabirds are vulnerable to changes in food availability. Especially in high latitude areas like the Barents and Norwegian Seas synchrony in food demand and production is important, causing match or mismatch. If zooplankton, fish larvae and fry do not appear at the right time for the seabirds' breeding season, this will have a negative effect and low juvenile survival. The future prospects for the various seabird species and populations are therefore closely linked to zooplankton and fish spawning grounds and times. One particular clear case seems to be Svalbard (Spitsbergen). Increased sea temperature to the west and north of Svalbard has resulted in less sea ice in the fjords, which has led to changes in the ecosystem. Arctic prey has largely been replaced by Atlantic species (herring, capelin and krill), which typically contains less energy. This is likely the reason that several seabird species now have reduced growth and juvenile survival. The consequence is a decline in the populations of these species in the Svalbard area.
The breeding results of seabirds will thus be negatively affected if climate change causes fish species to change preferences for spawning grounds and pull away, or if they spawn asynchronously with the birds' nesting (Eriksen et al., 2021). It is also conceivable that the availability of fish larvae is increasing in some areas as a result of changing spawning grounds and current conditions. Still, the decrease already observed for quite some time in in many seabird species in the Norwegian Sea is expected to continue (Fauchald et al. 2015).
Changes in plankton communities will affect the composition of seabird diet, for example, of specialized seabirds in the Barents Sea such as the little auk (“alkekonge”; Fig. 24). They need access to large energy-rich plankton organisms, like the arctic copepod species Calanus glacialis (“ isåte” ), and Calanus hyperboreus (“feitåte”) for better survival of the young (Eriksen et al., 2021). However, with increasing temperatures and expansion of Atlantic water masses, they are in large areas becoming out-competed by the smaller and less nutritious Calanus finmarchicus (“raudåte”; we have not been able to find English common names for these species).
Figure 24. The little auk will in many areas likely be forced to shift to a less nutritious diet because of climate-induced changes in food availability. Drawing from Royal Society for the Protection of Birds.
Seabirds in the other parts of the Nordic region; the Baltic, Skagerrak and North Sea face similar challenges. They too are of course dependent on access to food. If plankton or fish populations weaken or change from what the seabirds are adapted to eating, this will have a negative impact on breeding success and winter survival (Eriksen et al., 2021).
14 - Bottom living animals
The amount and species composition of bottom-dwelling animals (benthic fauna) varies geographically, particularly in relation to water mass impacts and sediment composition. Depth, temperature variation and current conditions also affect species composition, among other things because most bottom-dwelling species have larvae that are transported by the water masses. For example, sediment composition, depth, food availability and water temperature are the main environmental factors governing the large-scale distribution of benthic species in the North Sea (Brander et al., 2016) . This suggests that also benthos will be affected by climate change, something that indeed has been well documented (e.g., Brander et al., 2016).
In a future Arctic characterized by warmer waters and reduced sea-ice it is expected that species new to the region will expand or invade Arctic seafloor habitats. Historically, a warmer Arctic is more readily invaded or transited by boreal species than it is during cold periods and inflow shelves like the Barents Sea is among the most likely locations for expansion. Increasing human activities in the region could speed introductions of boreal fauna.
Although the link to climate change is not always clear, there are strong indications for also bottom-living animals being affected. A northward shift has been seen in the amount of benthic animals and temperate benthic communities, particularly in the Barents Sea. However, also along the coast of Norway more temperate species are spreading northwards (Eriksen et al., 2021). Concretely, a significant shift in boreal bottom-dwelling animals and changes in communities have been observed in the Arctic part of the Barents Sea during the last 20 years, with a decline in biomass of bottom surface living animals after 2014 (Eriksen et al., 2021). For instance, changes in biodiversity, particularly the increase in boreal species and the withdrawal of Arctic species have been registered in the Svalbard area.
Further south in the Nordic region, distributional shifts in benthic species related to increasing water temperatures have also been well documented. For example, t he northern range edge of many benthic invertebrate species in the North Sea has expanded with increased temperature. The impacts of climate change on benthic invertebrates, at least in the North Sea region, seem to arise from changes in temperature, nutrients and hydrodynamics affecting food supply and hence reproduction (Brander et al. 2016). Looking forward, Weinert et al. (2016) projected distributional changes in 75 North Sea benthic species to 2099, based upon the IPCC scenario SRES A1B (an older intermediate release level scenario). The results were complex, but revealed distributional shifts predominantly to the north. Further, the projected changes in species distribution resulted in a habitat loss for more than 60% of the modelled species (Weinert et al., 2016).
15 - Climate change versus other drivers
Species and ecosystems are challenged not only by climate change, but also other anthropogenic drivers. For example, in the Oslofjord the coastal cod populations are weak and show no sign of recovery. Many negative factors are suggested to contribute to this including professional and recreational fishing, overloading of nutrients through increased run-off from land, pollution in general, and dredging. Still, the additional pressure by increased temperatures may be decisive.
Another case illustrates the singular importance of climate change. The cumulative impact from a large number of pressures on many ecosystem components was assessed for Swedish waters using the marine spatial management tool SYMPHONY. Pressure from changing salinities, temperatures and ice cover under future climate scenarios was included (Wåhlström et al. 2022). It was concluded that the effects of climate change on the marine environment were as large as or larger than the cumulative impacts of all other present pressures (Fig. 25). Considering that the Barents and Norwegian Seas are more remote from major cities and towns and the level of human activities far less, the relative importance of climate change is expected to be even larger in these regions.
Figure 25. Impact maps for the Kattegat-Skagerrak, Baltic Proper, and the Gulf of Bothnia showing the percentage change between the baseline and the MEDIAN model ensemble for RCP4.5 (a) and RCP8.5 (b). Embedded text boxes denote change of cumulative impact per area (over the calculated anthropogenic environmental impact from human activities), including values for MINIMUM, MEDIAN, and MAXIMUM model ensembles, using an ensemble of 5 downscaled global climate models to obtain an uncertainty range. From Wåhlström et al. (2022).
Alexander, M. A., Scott, J. D., Friedland, K. D. et al. 2018. Projected sea surface temperatures over the 21st century: Changes in the mean, variability and extremes for large marine ecosystem regions of Northern Oceans. Elementa: Science of the Anthropocene, 6.
Almroth-Rosell, E., Wåhlstrom, I., Hansson, M. et al. 2021. A Regime Shift Toward a More Anoxic Environment in a Eutrophic Sea in Northern Europe. Frontiers in Marine Science , 8 .
BACC Author Team 2008. Assessment of Climate Change for the Baltic Sea Basin. Springer Verlag, 474 p.
BACC II Author Team 2015. Second Assessment of Climate Change for the Baltic Sea Basin. Springer Regional Climate Studies Open Access, 501 p
Beaugrand G., Reid PC., Ibañez F. et al. 2002. Reorganization of North Atlantic Marine Copepod Biodiversity and Climate. Science, 296, 1692-1694.
Blenckner, T., Ammar, Y., Mueller-Karulis, B. et al. 2021. The risk for novel and disappearing environmental conditions in the Baltic Sea. Frontiers in Marine Science , 8 .
Borgman, E. et al. 2022. Marine heatwaves in Northern Sea areas: Occurrence, effects, and expected frequencies. PlanMiljø. M-2239 I 2022. 38pp.
Børsheim, K.Y. 2017. Bacterial and primary production in the Greenland Sea. Journal of Marine Systems, 176, 54-63.
Brander, K. M., G. Ottersen, J. P. Bakker et al. 2016. Environmental Impacts—Marine Ecosystems. Pages 241-274 in M. Quante and F. Colijn, editors. North Sea Region Climate Change Assessment. Springer International Publishing, Cham.
Carozza, D. A., Bianchi, D., & Galbraith, E. D. 2019. Metabolic impacts of climate change on marine ecosystems: Implications for fish communities and fisheries. Global ecology and biogeography, 28(2), 158-169.
Carstensen, J., Chierici, M., Gustafsson, B. G., and Gustafsson, E. 2018. Long-term and seasonal trends in estuarine and coastal carbonate systems. Global Biogeochemical Cycles, 32, 497–513. https://doi.org/10.1002/2017GB005781
Climate Change in the Baltic Sea. 2021 Fact Sheet. Baltic Sea Environment Proceedings n°180. HELCOM/Baltic Earth 2021
Collins, M., et al. 2019. Extremes, Abrupt Changes and Managing Risk. In: IPCC Special Report on the Ocean and Cryosphere in a Changing Climate [H.-O. Pörtner, D.C. Roberts et al. (eds.)]. Cambridge Univ. Press, Cambridge, UK and New York, NY, USA, pp. 589-655. https://doi.org/10.1017/9781009157964.008 .
Cubillo, A.M., Ferreira, J.G., Lencart-Silva, J. et al. 2021. Direct effects of climate change on productivity of European aquaculture. Aquacult Int 29, 1561–1590 (2021). https://doi.org/10.1007/s10499-021-00694-6
Cushing, D. H. 1990. Plankton production and year-class strength in fish populations: An update of the match/mismatch hypothesis. Advances in Marine Biology 26 :249-294.
Durant, J., D. Hjermann, G. Ottersen, and N. Stenseth. 2007. Climate and the match or mismatch between predator requirements and resource availability. Climate Research 33 :271-283.
Edwards, M., Helaouet, P., Alhaija, RA., et al. 2016. Global Marine Ecological Status Report: results from the global CPR Survey 2014/2015. SAHFOS Technical Report, 11: 1-32. Plymouth, U.K. ISSN 1744-0750.
Eriksen, E., Skjoldal, HR., Gjøsæter, H., Primicerio, R. 2017. Spatial and temporal changes in the Barents Sea pelagic compartment during the recent warming. Progress in Oceanography 151, 206-226. https://doi.org/10.1016/j.pocean.2016.12.009
Eriksen, E., van der Meeren, G.I., Nilsen, B.M. et al.(eds). 2021. Particularly valuable and vulnerable areas (SVO) in Norwegian seas - Environmental values. Assessment of environmental values and borders of present SVOs and proposals for new areas. Report from IMR 2021-26. ISSN:1893-4536.
Fauchald, P., Anker-Nilssen, T., Barrett, RT. Et al. 2015. The status and trends of seabirds breeding in Norway and Svalbard – NINA Report 1151. 84 s.
Fossheim, M., R. Primicerio, E. Johannesen et al. 2015. Recent warming leads to a rapid borealization of fish communities in the Arctic. Nature Climate Change 5 :673-677.
Fox-Kemper, B., H.T. Hewitt, C. Xiao et al. 2021. Ocean, Cryosphere and Sea Level Change. In Climate Change 2021: The Physical Science Basis. Contribution of Working Group I to the Sixth Assessment Report of the Intergovernmental Panel on Climate Change [Masson-Delmotte, V., P. Zhai, A. Pirani et al. (eds.)]. Cambridge University Press, Cambridge, United Kingdom and New York, NY, USA, pp. 1211–1362
Fransner, F., F. Frob, J. Tjiputra et al. 2022. Acidification of the Nordic Seas. Biogeosciences 19:979-1012.
Grinsted, A., S. Jevrejeva, R. E. M. Riva, and D. Dahl-Jensen. 2015. Sea level rise projections for northern Europe under RCP8.5. Climate Research 64:15-23.
Gröger, M., Arneborg, L., Dieterich, C. et al. 2019. Summer hydrographic changes in the Baltic Sea, Kattegat and Skagerrak projected in an ensemble of climate scenarios downscaled with a coupled regional ocean–sea ice–atmosphere model. Climate Dynamics, 53(9), 5945-5966.
Gustafsson, B., Arneborg, L. 2020: Åtgärder stärker Östersjöns miljö - även I ett förändrat klimat. Policy brief, Östersjöcentrum, Stockholms Universitet.
Gustafsson, E. & Gustafsson, B. G. 2020. Future acidification of the Baltic Sea – A sensitivity study. Journal of Marine Systems 211, 103397, https://doi.org/10.1016/j.jmarsys.2020.103397.
Hamilton, CD., Lydersen, C., Ims, RA, and Kovacs, KM. 2015. Predictions replaced by facts in a changing Arctic: a keystone species’ responses to declining sea ice. Biol Lett 11: 20150803. http://dx.doi.org/10.1098/rsbl.2015.0803
Hausner, V.H. and Trainor, S.F. 2021. Impacts of climate change and climate extremes on Arctic livelihoods and communities. Capter 7 In: AMAP Arctic Climate Change Update 2021: Key Trends and Impacts. [pp. 107-144]. Arctic Monitoring and Assessment Programme (AMAP). Tromsø, Norway.
HELCOM 2018. State of the Baltic Sea – Second HELCOM holistic assessment 2011-2016. Baltic Sea Environment Proceedings 155. ISSN 0357-2994
HELCOM/Baltic Earth 2021. Climate Change in the Baltic Sea. 2021 Fact Sheet. Baltic Sea Environment Proceedings no 180.
Hill, E. M., J. L. Davis, M. E. Tamisiea, and M. Lidberg. 2010. Combination of geodetic observations and models for glacial isostatic adjustment fields in Fennoscandia. Journal of Geophysical Research-Solid Earth 115.
Hobday, A. J., L. V. Alexander, S. E. Perkins et al. 2016. A hierarchical approach to defining marine heatwaves. Progress In Oceanography 141 :227-238.
Holbrook, N. J., Scannell, H. A., Sen Gupta, A. et al. 2019. A global assessment of marine heatwaves and their drivers. Nature Communications, 10(1), 1-13.
Huang, B., Wang, Z., Yin, X. et al. (2021). Prolonged marine heatwaves in the Arctic: 1982−2020. Geophysical Research Letters, 48, e2021GL095590. https://doi.org/10.1029/2021GL095590
Hurd, C. L., Beardall, J., Comeau, S. et al. 2019. Ocean acidification as a multiple driver: how interactions between changing seawater carbonate parameters affect marine life. Marine and Freshwater Research, 71(3), 263-274.
ICES. 2018. Final Report of the ICES/HELCOM Working Group on Integrated Assessments of the Baltic Sea (WGIAB). ICES CM 2018/IEASG:08.
ICES. 2022a. Working Group on the Integrated Assessments of the Barents Sea (WGIBAR). ICES Scientific Reports. 4:50. 235 pp. http://doi.org/10.17895/ices.pub.20051438
ICES. 2022c. Working Group on Integrated Assessments of the North Sea (WGINOSE). ICES Scientific Reports. 4:86. 68 pp. https://doi.org/10.17895/ices.pub.21563802
IPCC 2019. IPCC Special Report on the Ocean and Cryosphere in a Changing Climate [H.-O. Pörtner, D.C. Roberts, V. Masson-Delmotte, P. Zhai, M. Tignor, E. Poloczanska, K. Mintenbeck, A. Alegría, M. Nicolai, A. Okem, J. Petzold, B. Rama, N.M. Weyer (eds.)]. Cambridge University Press, Cambridge, UK and New York, NY, USA, 755 pp. https://doi.org/10.1017/9781009157964 .
IPCC 2021. Climate Change 2021: The Physical Science Basis. Contribution of Working Group I to the Sixth Assessment Report of the Intergovernmental Panel on Climate Change [Masson-Delmotte, V., P. Zhai, A. Pirani, S.L. Connors, C. Péan, S. Berger, N. Caud, Y. Chen, L. Goldfarb, M.I. Gomis, M. Huang, K. Leitzell, E. Lonnoy, J.B.R. Matthews, T.K. Maycock, T. Waterfield, O. Yelekçi, R. Yu, and B. Zhou (eds.)]. Cambridge University Press, Cambridge, United Kingdom and New York, NY, USA, In press, doi: 10.1017/9781009157896 .
IPCC 2022. Climate Change 2022: Impacts, Adaptation, and Vulnerability. Contribution of Working Group II to the Sixth Assessment Report of the Intergovernmental Panel on Climate Change [H.-O. Pörtner, D.C. Roberts, M. Tignor, E.S. Poloczanska, K. Mintenbeck, A. Alegría, M. Craig, S. Langsdorf, S. Löschke, V. Möller, A. Okem, B. Rama (eds.)]. Cambridge University Press. Cambridge University Press, Cambridge, UK and New York, NY, USA, 3056 pp., doi:10.1017/9781009325844.
Jansen, T., S. Post, T. Kristiansen et al. 2016. Ocean warming expands habitat of a rich natural resource and benefits a national economy. Ecological Applications 26 :2021-2032.
Kjesbu, O. S., B. Bogstad, J. A. Devine et al. 2014. Synergies between climate and management for Atlantic cod fisheries at high latitudes. Proceedings of the National Academy of Sciences of the United States of America 111 :3478-3483.
Kjesbu, O. S., S. Sundby, A. B. Sandø, et al. 2021. Highly mixed impacts of near-future climate change on stock productivity proxies in the North East Atlantic. Fish and Fisheries 23 :601-615.
Kwiatkowski, L., Aumont, O., & Bopp, L. 2019. Consistent trophic amplification of marine biomass declines under climate change. Global change biology, 25(1), 218-229.
Laufkötter, C., Vogt, M., Gruber, N. et al. 2015. Drivers and uncertainties of future global marine primary production in marine ecosystem models. Biogeosciences , 12 (23), 6955-6984.
Laufkötter, C., Zscheischler, J., & Frölicher, T. L. 2020. High-impact marine heatwaves attributable to human-induced global warming. Science, 369(6511), 1621-1625.
Lewis, K.M., van Dijken, G.L., Arrigo, K.R., 2020. Changes in phytoplankton concentration now drive increased Arctic Ocean primary production. Science 369, 198-202.
Meier, H. E., Dieterich, C., Gröger, M. et al. 2022a. Oceanographic regional climate projections for the Baltic Sea until 2100. Earth System Dynamics , 13 (1), 159-199. https://doi.org/10.5194/esd-13-159-2022
Meier, H. E., Kniebusch, M., Dieterich et al. 2022b. Climate change in the Baltic Sea region: a summary. Earth System Dynamics, 13(1), 457-593. https://doi.org/10.5194/esd-13-457-2022
Mohamed, B., F. Nilsen, and R. Skogseth. 2022. Marine Heatwaves Characteristics in the Barents Sea Based on High Resolution Satellite Data (1982-2020). Frontiers in Marine Science 9.
Olafsdottir, A. H., K. R. Utne, J. A. Jacobsen et al. 2019. Geographical expansion of Northeast Atlantic mackerel (Scomber scombrus) in the Nordic Seas from 2007 to 2016 was primarily driven by stock size and constrained by low temperatures. Deep-Sea Research Part Ii-Topical Studies in Oceanography 159 :152-168.
Pacariz, S. V., H. Hatun, J. A. Jacobsen et al.. 2016. Nutrient-driven poleward expansion of the Northeast Atlantic mackerel (Scomber scombrus) stock: A new hypothesis. Elementa-Science of the Anthropocene 4 :1-13.
Quante, M. and Colijn, F. 2016. North Sea Region Climate Change Assessment. In: Regional Climate Studies, Springer, Hasmburg. p XLV+ 528. https://doi.org/10.1007/978-3-319-39745-0.
Sandø, A. B., S. S. Hjøllo, C. Hansen et al. 2022. Risikoanalyse for de norske havområdene om direkte og indirekte virkninger av klimaendringer på marine økosystemer under ulike utslippsscenarier - Risikorapport om hav og klima. Institute of Marine Research, Bergen, Norway. 70 p. ISSN:1893-4536
Saraiva, S., Meier, H. M., Andersson, H. et al. 2019. Uncertainties in projections of the Baltic Sea ecosystem driven by an ensemble of global climate models. Frontiers in Earth Science , 6 , 244.
Schmidtko, S., Stramma, L., & Visbeck, M. 2017. Decline in global oceanic oxygen content during the past five decades. Nature, 542(7641), 335-339.
Simpson, M. J. R., J. E. Ø. Nilsen, O. R. Ravndal et al. 2015. Sea Level Change for Norway: Past and Present Observations and Projections to 2100. Norwegian Centre for Climate Services report 1/2015, ISSN 2387-3027, Oslo, Norway.
Simpson, M. J., Ravndal, O. R., Sande, H. et al. 2017. Projected 21st century sea-level changes, observed sea level extremes, and sea level allowances for Norway. Journal of Marine Science and Engineering, 5(3), 36.
Skogen, M. D., E. Svendsen, J. Berntsen et al. 1995. Modelling the primary production in the North Sea using a coupled 3-d physical, chemical, biological Ocean model. Estuarine, coastal and shelf science 41 :545-565.
Steeves LE, Filgueira R, Guyondet T et al. 2018. Past, present, and future: performance of two bivalve species under changing environmental conditions. Front Mar Sci 5:184. https://doi.org/10.3389/fmars.2018.00184
Sundby, S., K. F. Drinkwater, and O. S. Kjesbu. 2016. The North Atlantic Spring-Bloom System-Where the Changing Climate Meets the Winter Dark. Frontiers in Marine Science 3 .
Södling, J. and S. Nerheim. 2017 Statistisk metodik för beräkning av extrema havsvattenstånd. SMHI. Ocenaografi Nr 124.https://www.smhi.se/polopoly_fs/1.165622!/Oceanografi_124%20Statistisk%20metodik%20f%C3%B6r%20ber%C3%A4kning%20av%20extrema%20havsvattenst%C3%A5nd.pdf
Turkia, T., Anderssén, E., Lakso, E. et al. 2022. Hur kommer havet att se ut år 2120: Framtida klimatoch artutbredningsmodeller för centrala Bottniska viken. ECOnnect-projektets slutrapport. Interreg Botnia-Atlantica projekt.
Viitasalo, M. and Bonsdorff, E. 2022. Global climate change and the Baltic Sea ecosystem: direct and indirect effects on species, communities and ecosystem functioning, Earth Syst. Dynam., 13, 711–747. https://doi.org/10.5194/esd-13-711-2022.
Weinert, M., M. Mathis, I. Kroncke et al. 2016. Modelling climate change effects on benthos: Distributional shifts in the North Sea from 2001 to 2099. Estuarine Coastal and Shelf Science 175 :157-168.
Wåhlström, I., Höglund, A., Almroth‐Rosell, E. et al. 2020. Combined climate change and nutrient load impacts on future habitats and eutrophication indicators in a eutrophic coastal sea. Limnology and Oceanography , 65 (9), 2170-2187.
Wåhlström, I., Hammar, L., Hume, D. et al. 2022. Projected climate change impact on a coastal sea—as significant as all current pressures combined. Global change biology , 28 (17), 5310-5319.