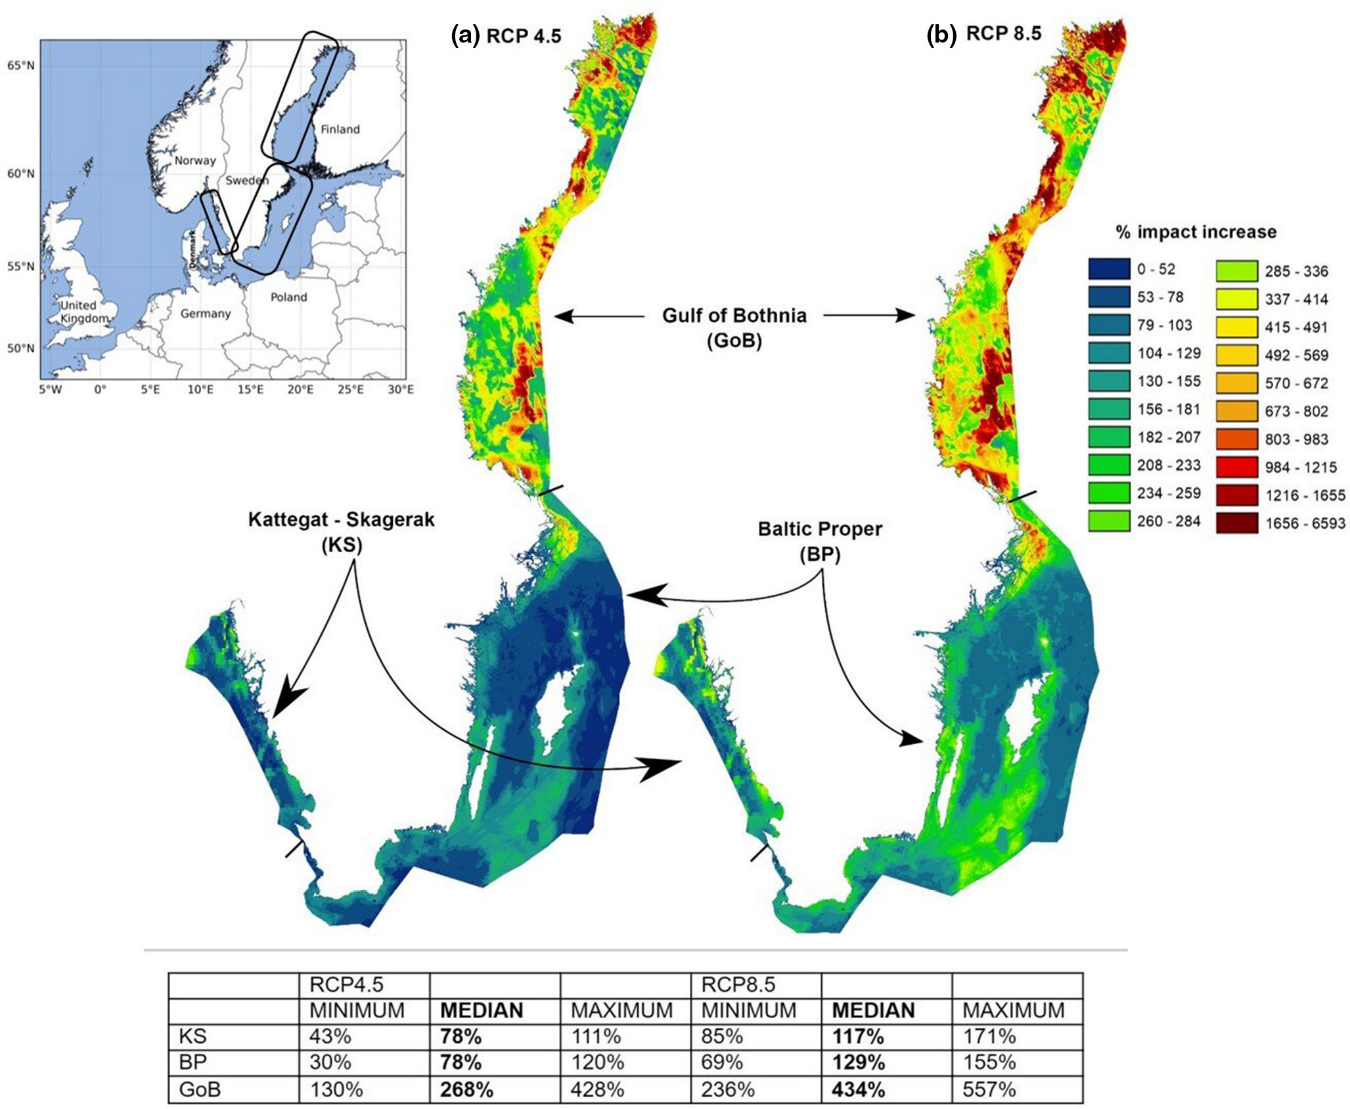
Figure 25. Impact maps for the Kattegat-Skagerrak, Baltic Proper, and the Gulf of Bothnia showing the percentage change between the baseline and the MEDIAN model ensemble for RCP4.5 (a) and RCP8.5 (b). Embedded text boxes denote change of cumulative impact per area (over the calculated anthropogenic environmental impact from human activities), including values for MINIMUM, MEDIAN, and MAXIMUM model ensembles, using an ensemble of 5 downscaled global climate models to obtain an uncertainty range. From Wåhlström et al. (2022).