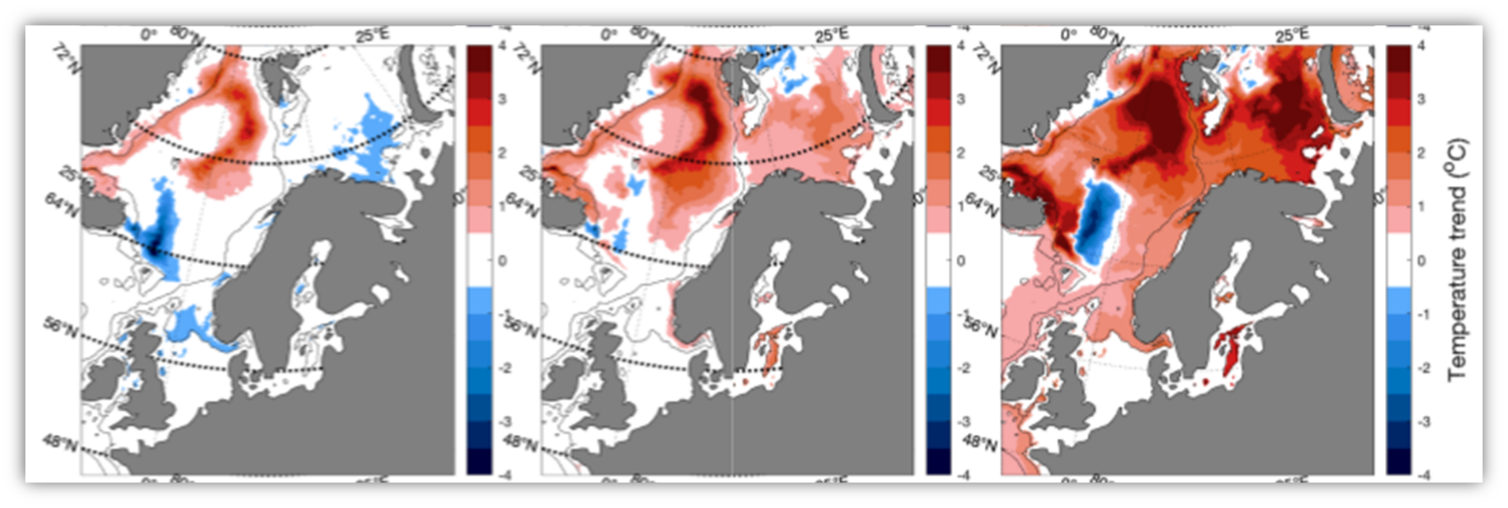
Figure 7. Spatial pattern in projected development of March temperature at 100 m depth from 2015 to 2100 for three IPCC scenarios. Left panel SSP1-2.6 (“2 °C”), central panel SSP2-4.5 (“moderate”), and right panel SSP5-8.5 (“extreme, business as usual”). From Sandø et al. (2022).