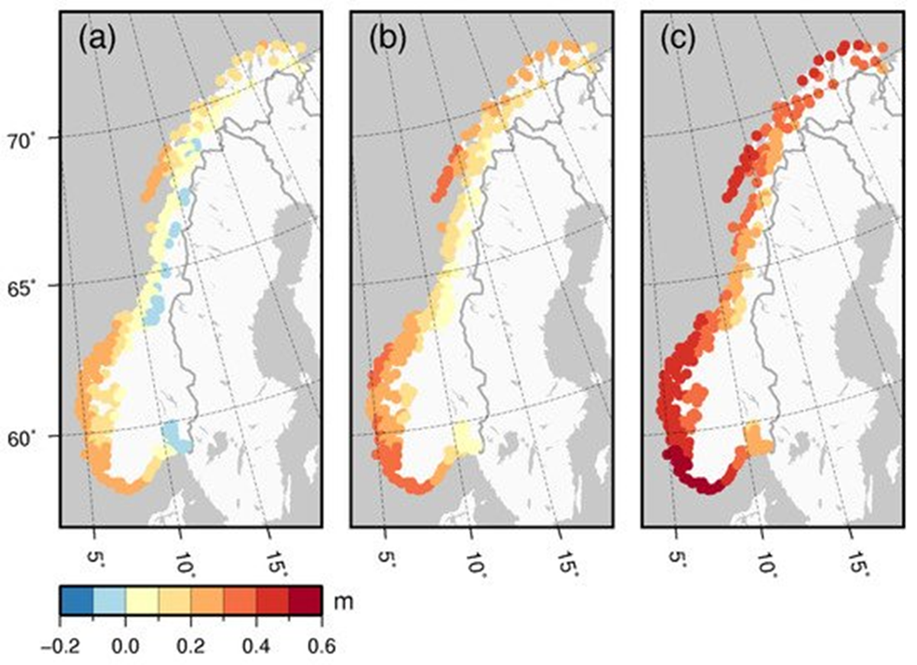
Figure 4. Projected relative changes in sea level along the Norwegian coast from 1986–2005 to 2081–2100. Projections are shown for three IPCC climate scenarios: (a) RCP2.6 “low”, (b) RCP4.5 “moderate”, and (c) RCP8.5 “business as usual – extreme”. From Simpson et al. (2017) and the Norwegian Mapping Authority’s web page Visualize sea level https://www.kartverket.no/en/at-sea/se-havniva.