Gå til hovedinnhold
Havforskningsinstituttet
HI
English
<- Tilbake
Søk
Søk
Søk
View page in English
Figur
Fra rapporten:
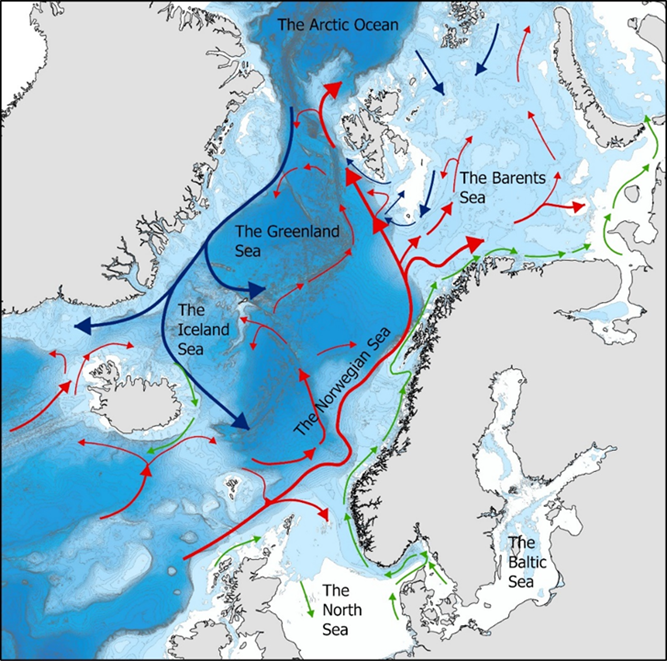
Observed and expected future impacts of climate change on marine environment and ecosystems in the Nordic region
Figure 1. The major ocean regions treated in this report. Red arrows show warm currents, blue arrows show cold currents. Coastal currents are shown in green. Map by Per Arne Horneland, IMR.