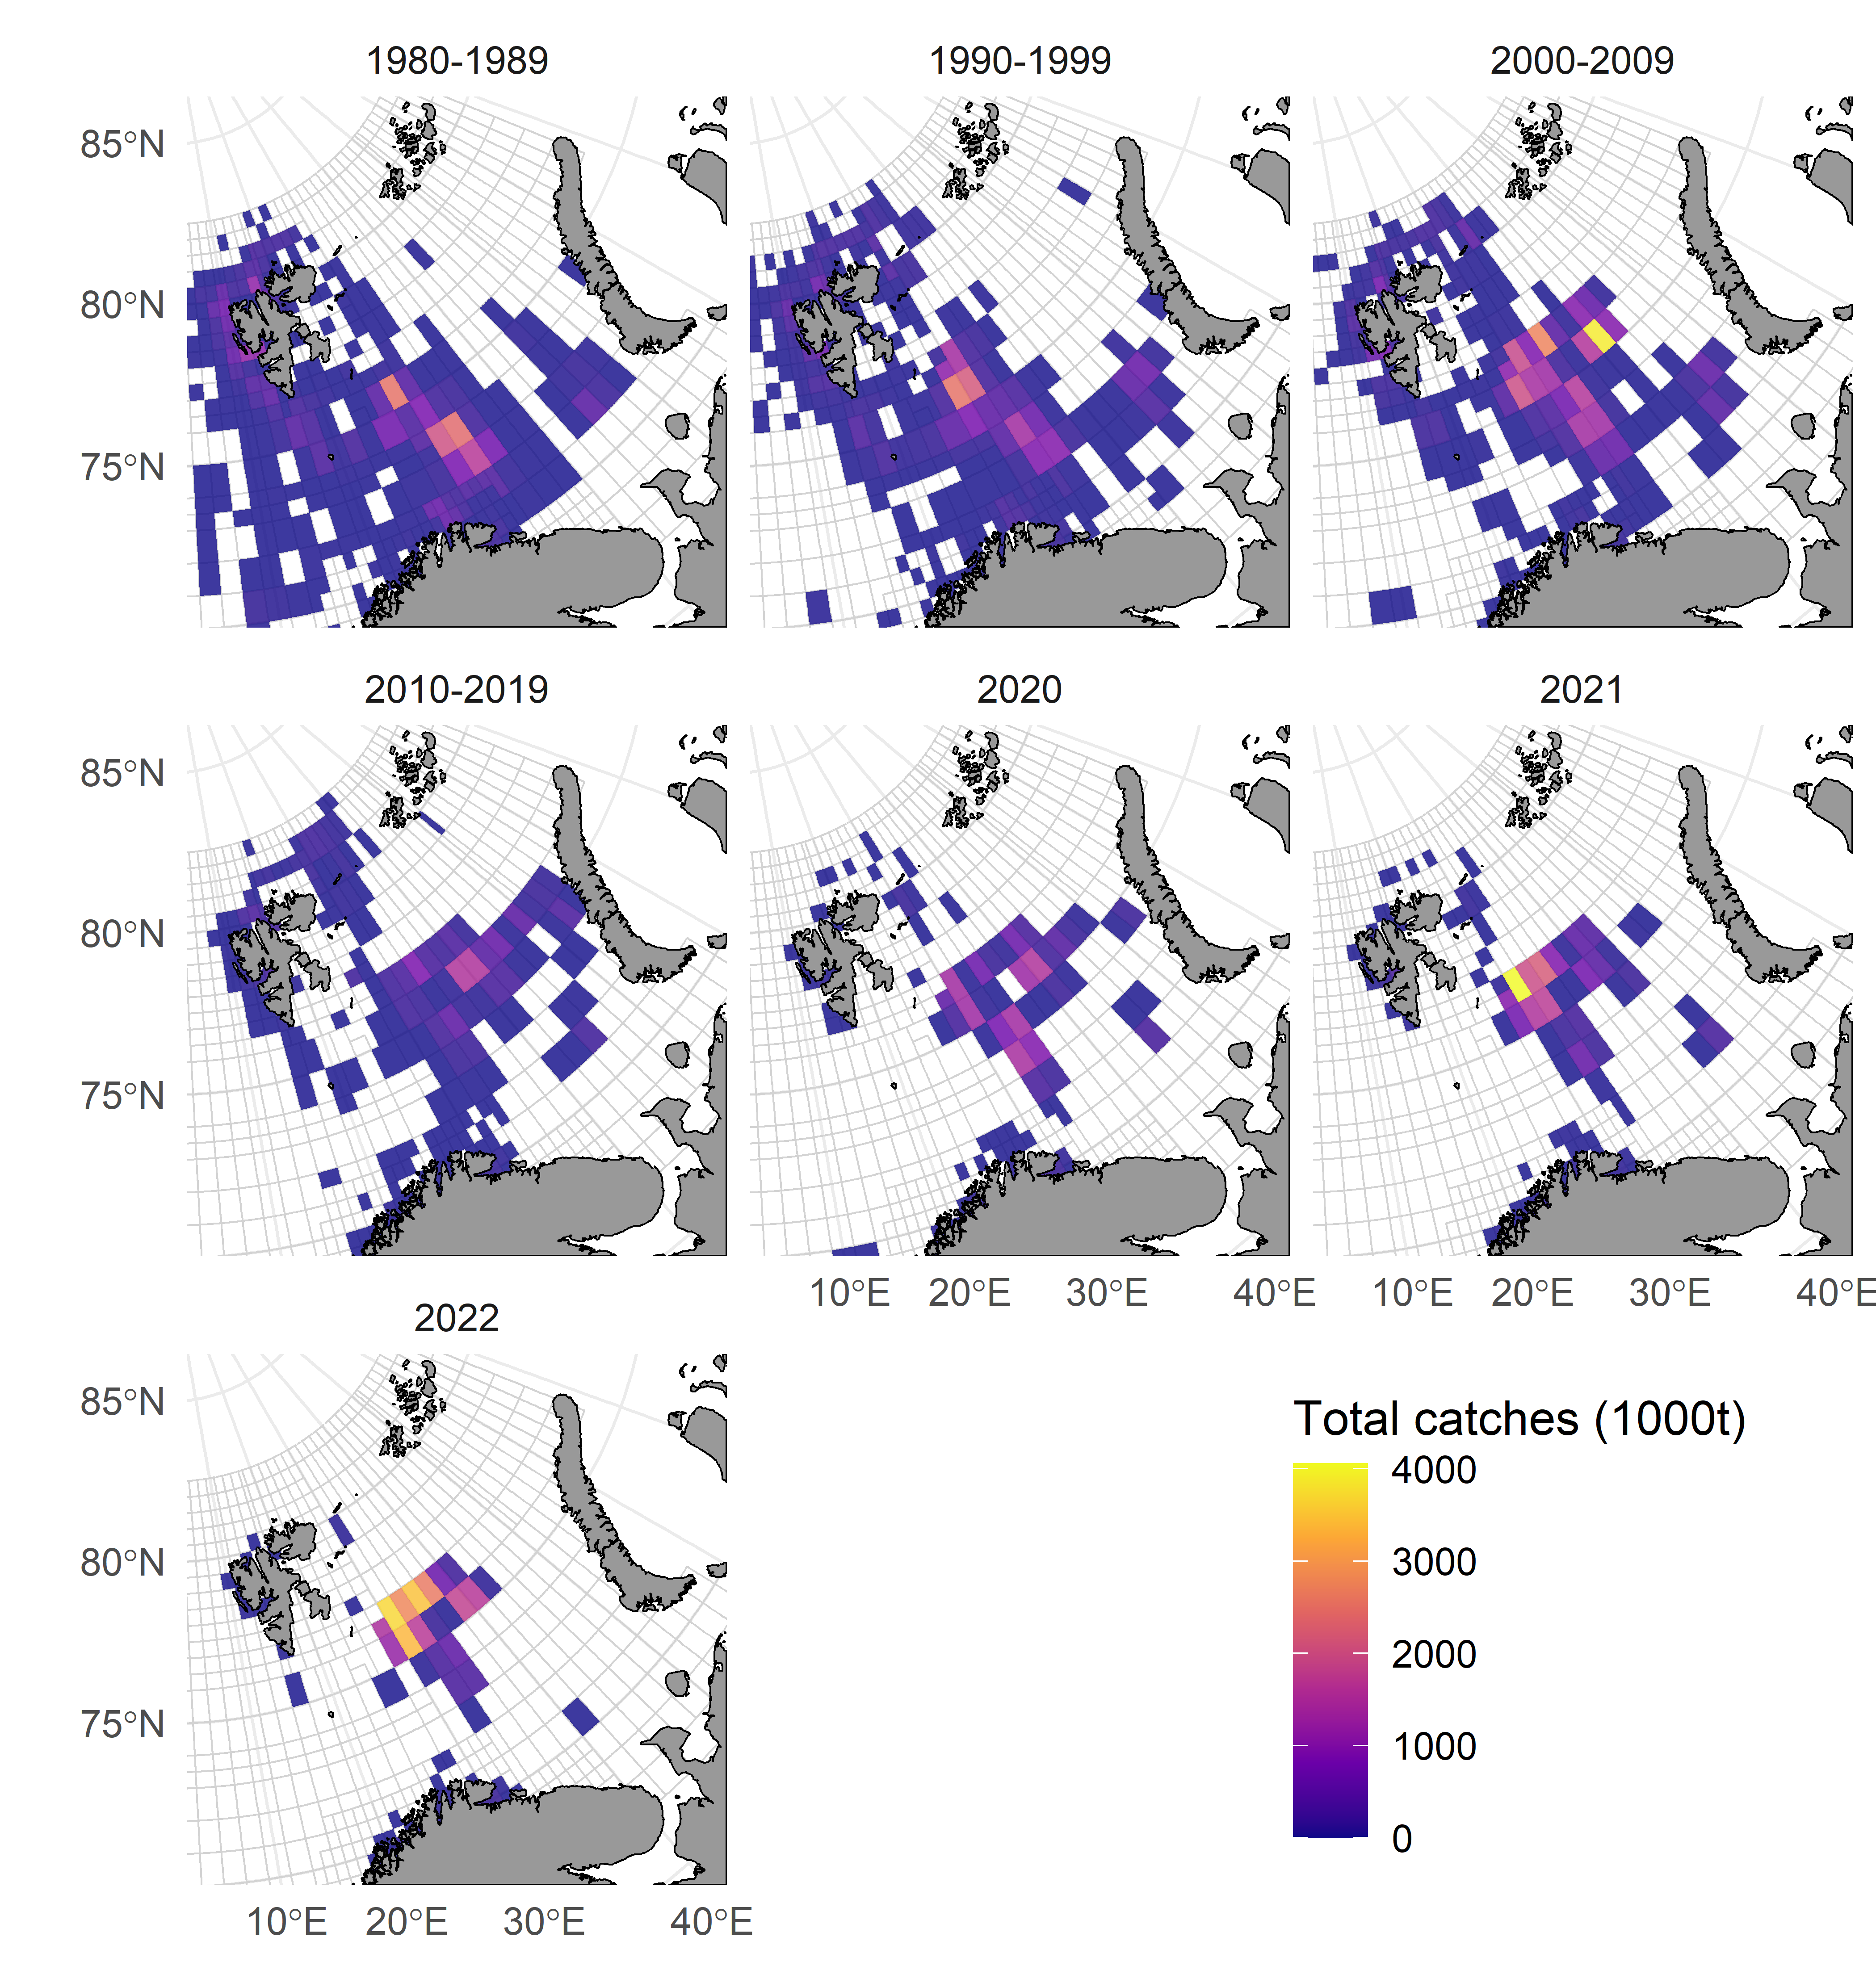
Figure 3 : Distribution of annual catches by Norwegian vessels since 1980 based on logbook information. For periods before 2020, mean annual catches across a decade are shown. 2022 includes only data until November. Grey lines indicate the Norwegian statistical grid.