Since the 1980s, the Barents Sea has gone from a situation with high fishing pressure, cold conditions and low demersal fish stock levels, to the current situation with high levels of demersal fish stocks, reduced fishing pressure and warm conditions.
The capelin stock has increased again after a steep decline in 2019 and has been estimated to be above Blim. Cod biomass has decreased in recent years following a peak around 2013 but is still abundant in the Barents Sea ecosystem. Despite the recent increase in capelin, which is the preferred food item for cod, the cod may still exert a substantial predation pressure on shrimp. The levels of environmental and organic pollution in the Barents Sea are generally low and do not exceed threshold limits or global background levels. More detailed information can be found in ICES (2022b).
2 - Introduction
Northern shrimp (Pandalus borealis) in the Barents Sea and in the Svalbard fishery protection zone (ICES Subareas 1 and 2) is considered as one stock. Norwegian and Russian vessels exploit the stock in the entire area, while vessels from other nations are restricted to the Svalbard fishery zone and the “Loophole”.
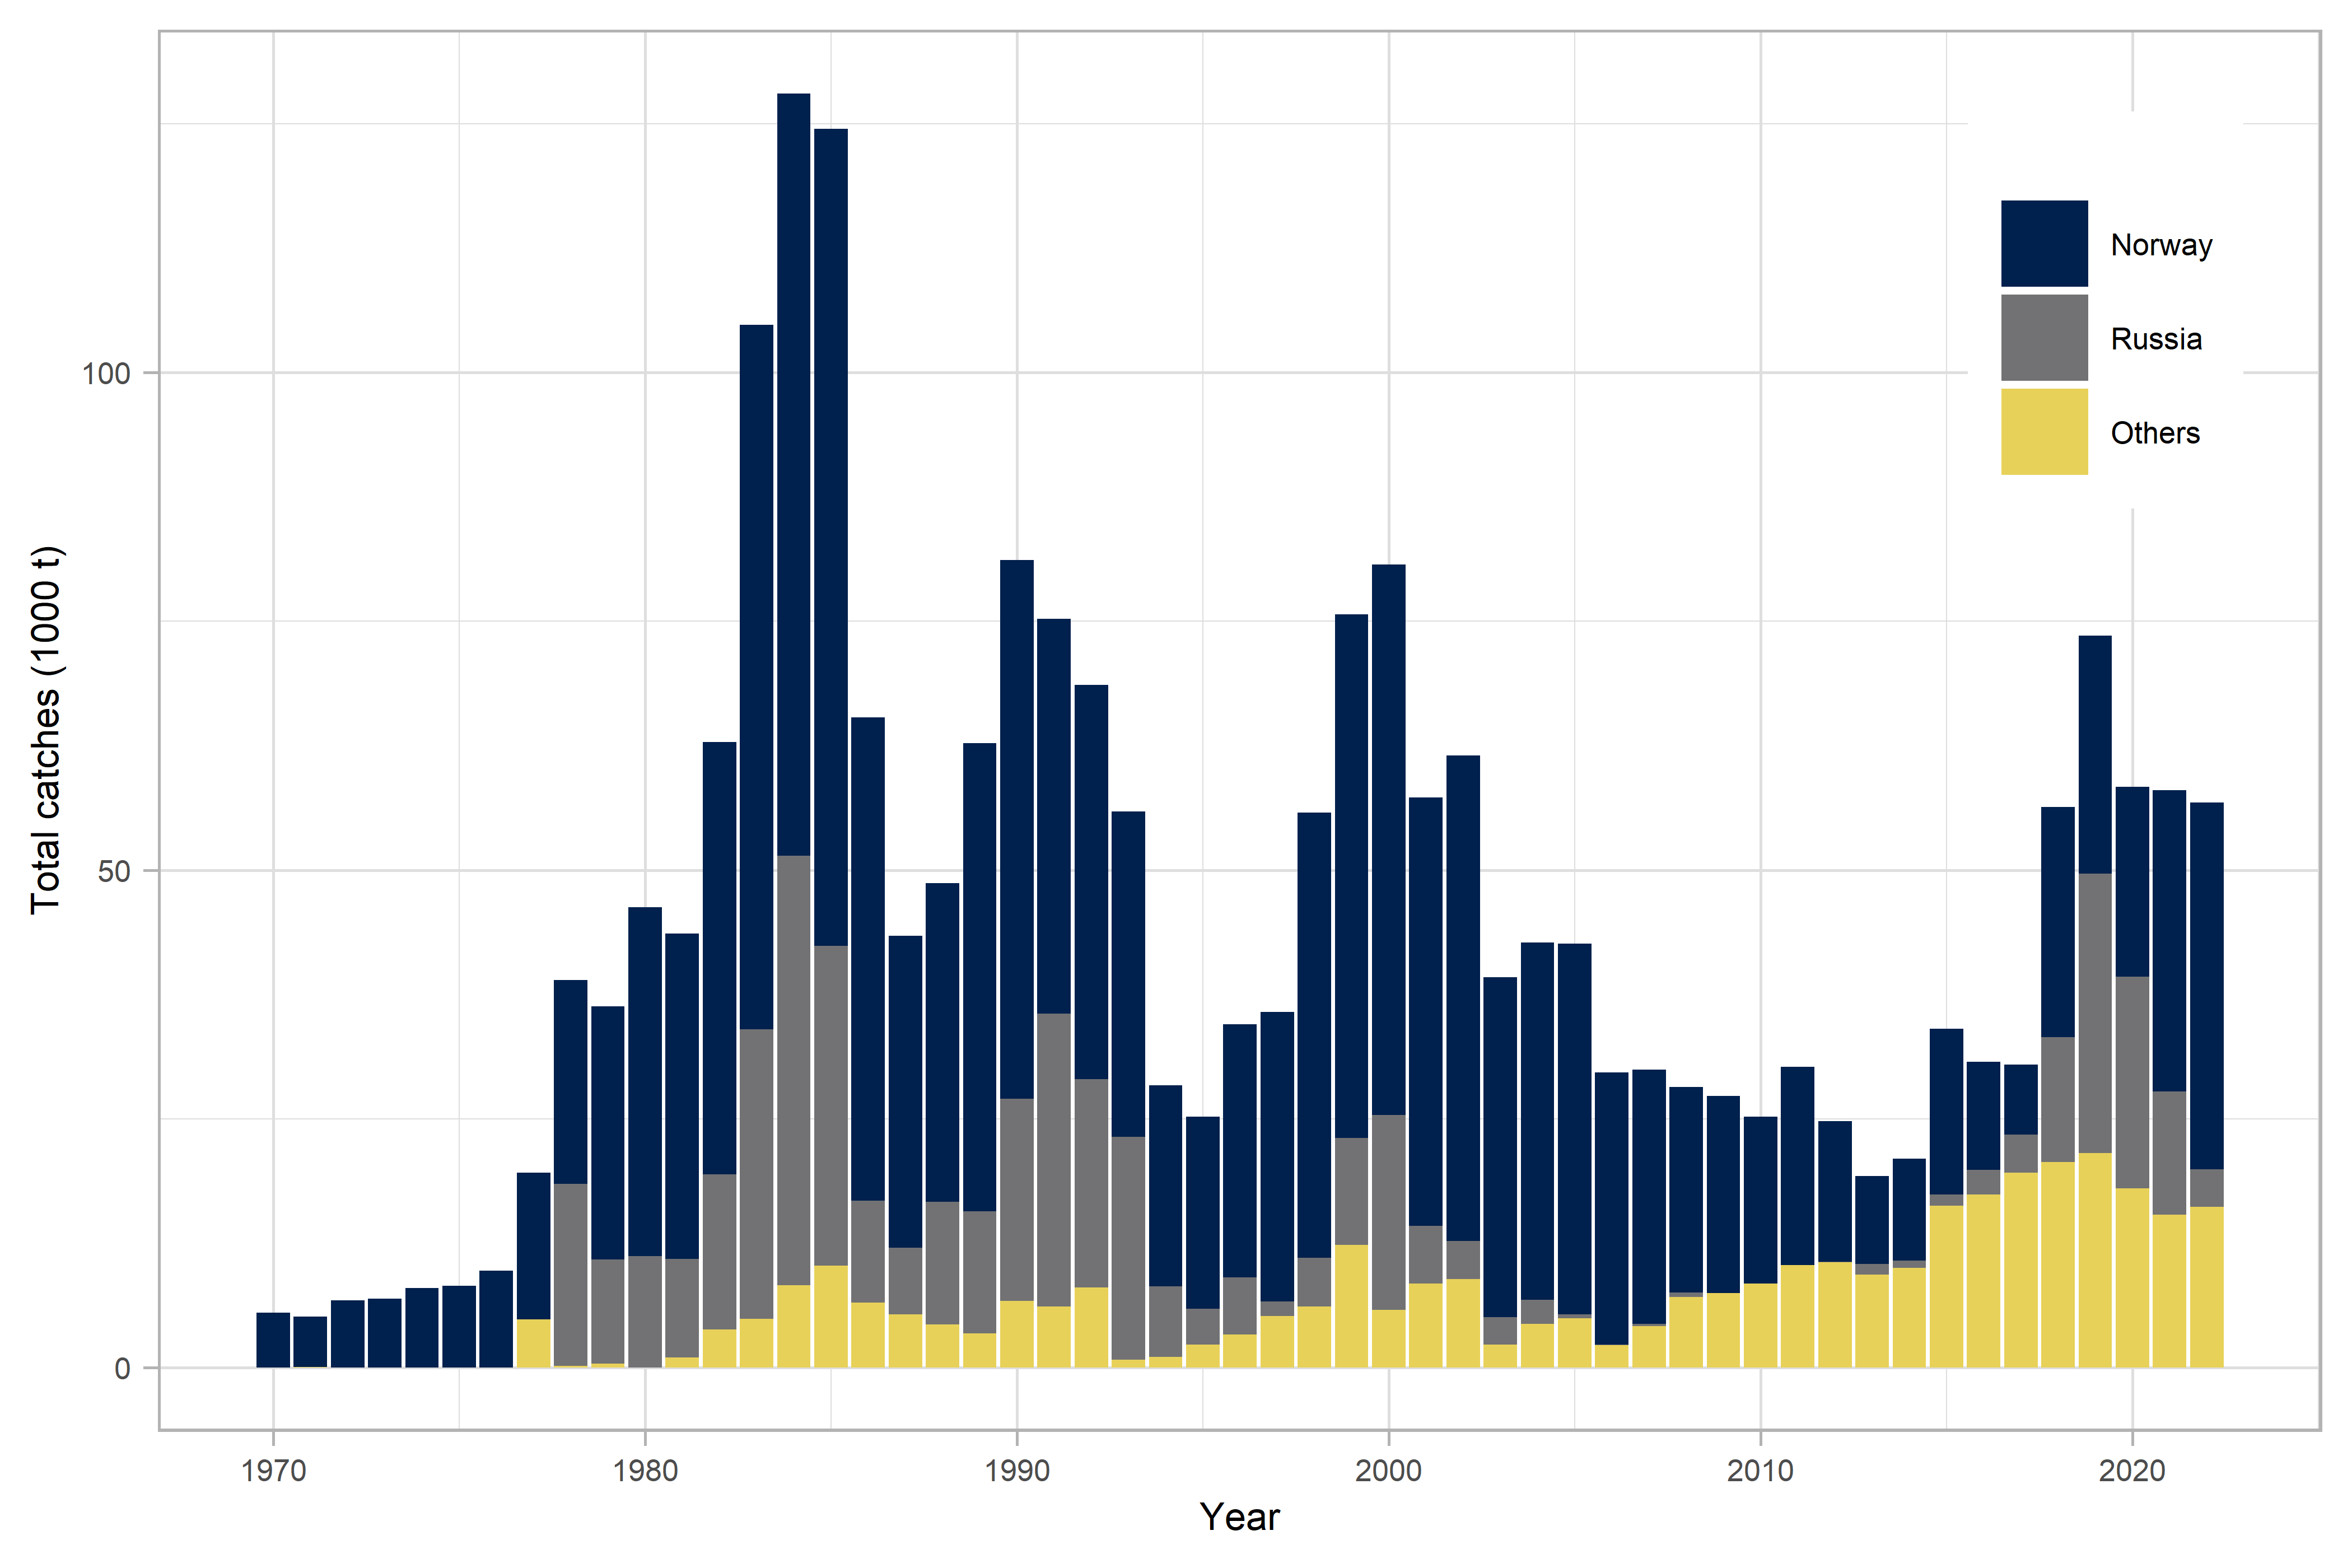
Norwegian vessels initiated the fishery in 1970. As the fishery developed, vessels from several nations joined and landings increased rapidly (Figure 1 ). Vessels from Norway, Russia, Iceland, Greenland, Faroes, United Kingdom and the EU participate in this fishery on a regular basis. There is no overall TAC established for this stock. The fishery is partly regulated by effort control (Norwegian and Svalbard zone), and a TAC in the Russian zone only. Licenses are required for the Russian and Norwegian vessels. In the Norwegian and Svalbard zones, the fishing activity of these license holders is constrained only by bycatch regulations whereas the activity of third country fleets operating in the Svalbard zone is also restricted by the number of effective fishing days and the number of vessels by country. The minimum stretched mesh size is 35 mm. Bycatch is limited by mandatory sorting grids and by the temporary closing of areas where excessive bycatch of juvenile cod, haddock, Greenland halibut, redfish or shrimp <15 mm CL is registered.
Landings. Landings have increased from 30200 t in 2011 to 73500 t in 2019, stabilizing below 60000 t in the most recent years (Table 1).
2012
2013
2014
2015
2016
2017
2018
2019
2020
2021
20221
Catch
24 763
19 248
20 963
34 022
30 748
30 441
56 341
73 582
58 380
58 029
56 791
Norway
14 158
8 846
10 234
16 618
10 898
7 010
23 126
23 924
19 115
30 281
36 862
Russia
5
1 067
741
1 151
2 491
3 849
12 561
28 081
21 265
12 378
3 790
Others
10 599
9 335
9 988
16 252
17 359
19 582
20 653
21 576
17 999
15 370
16 138
1Preliminary
Table 1 : Recent landings in tonnes.
Figure 1 : Total official landings (2021 data are preliminary; Values for 2022 are projected for the total year based on preliminary catch reporting).
Discards, by-catch and ecosystem effects. Discard of shrimp cannot be quantified but is believed to be small as the fishery is not limited by quotas. Bycatch rates of other species are estimated from at-sea inspections and research surveys and are corrected for differences in gear selection pattern (ICES 2018). Area-specific bycatch rates are then multiplied by the corresponding shrimp catches from logbooks to give an overall bycatch estimate. Revised and updated discards estimates (1983–2017) of cod, haddock and redfish juveniles in the Norwegian commercial shrimp fishery in the Barents Sea were available in 2018. Since the introduction of the Nordmøre sorting grid in 1992, only small individuals of cod, haddock, Greenland halibut, and redfish, in the 5–25 cm size range, are caught as bycatch.
In 2017, specific information on bycatch from EU-Estonia based on onboard scientific observers was presented. They indicated 2.9% by weight of fish discards and 0.6% discards of shrimp. No new information has been available since.
Collecting bags, an extra codend mounted on the shrimp trawl for catching ground fish as bycatch, are being used by some EU vessels. Attempts to quantify the magnitude of this type of bycatch has been made (see ICES 2022c).
3 - Input data
3.1 - Commercial fishery data
Logbook data are normally available only from the Norwegian fleet. For 2020 - 2022 summary catch and effort data was received from Poland, Latvia, Lithuania and Estonia. In addition, information was provided by Russia in SCR Doc. 20-063, including information on catch distribution and standardized catch rates in 2020.
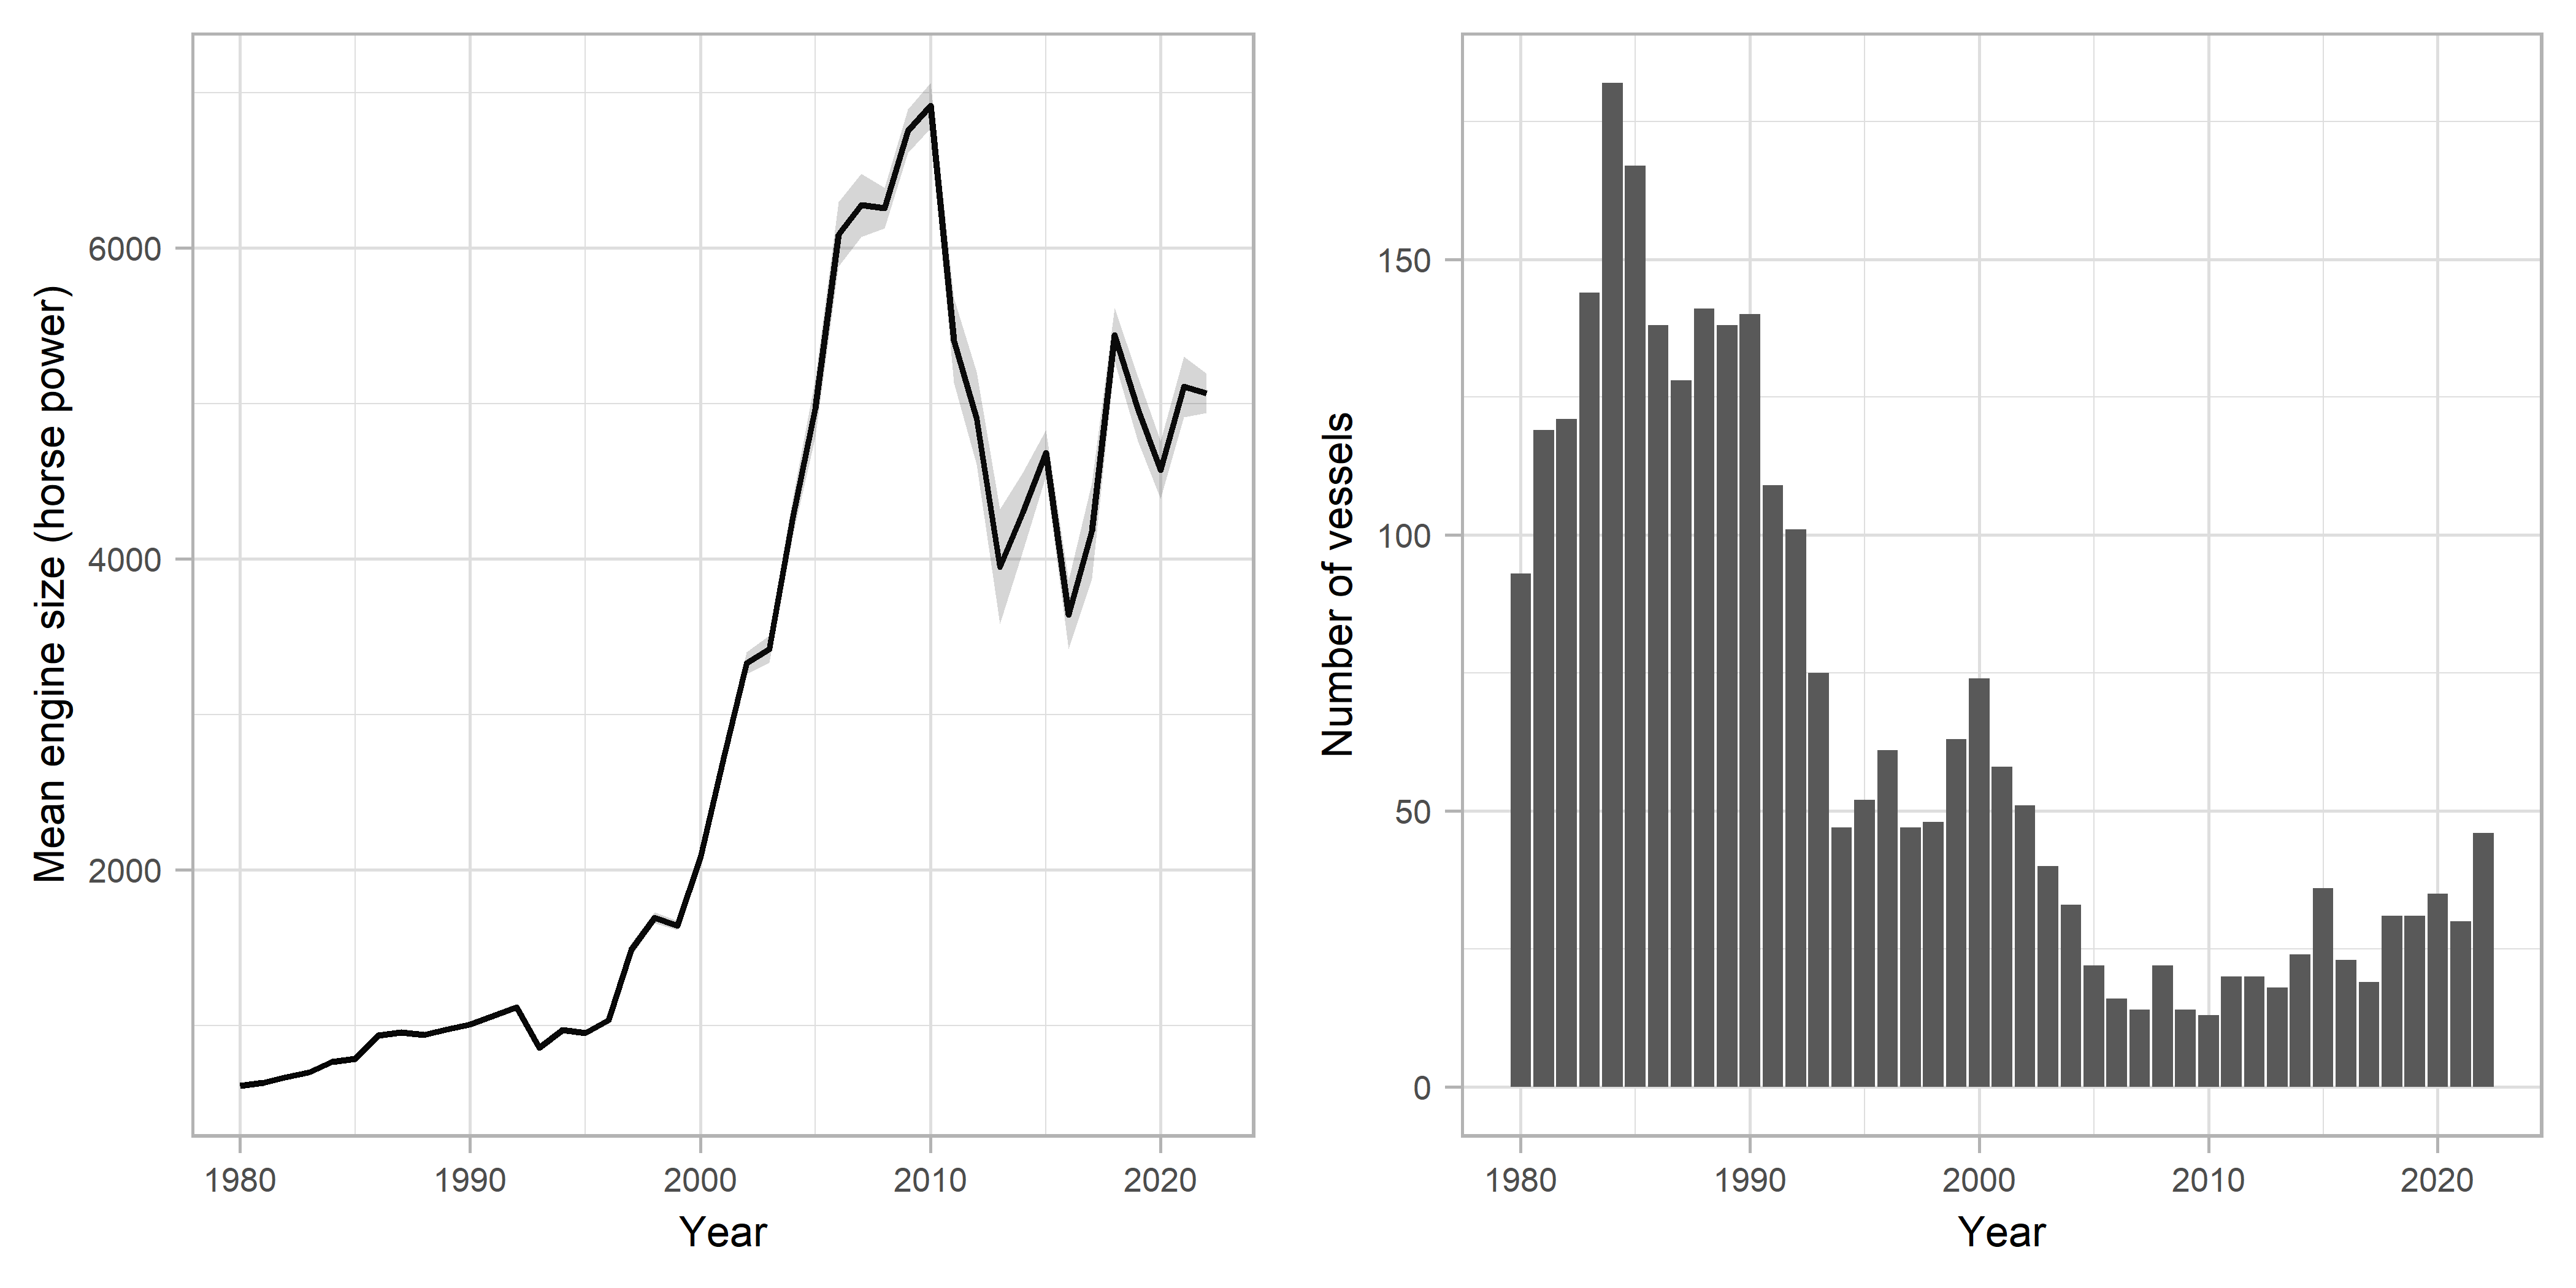
A major restructuring of the Norwegian shrimp fishing fleet towards fewer and larger vessels took place during the late-1990s through the early 2000s (Figure 2 ). Until 1996, the fishery was conducted using single trawls only. Double and triple trawls were then introduced. An individual vessel may alternate between single and multiple trawling depending on what is appropriate on given fishing grounds.
Figure 2 : Mean engine power (HP) weighted by trawl-time (left) and number of vessels (right) in Norwegian fleet. Data are based on logbook registrations.
The fishery takes place throughout the year but may in some years be seasonally restricted by ice conditions. The lowest effort is generally in October through March, the highest in May to August.
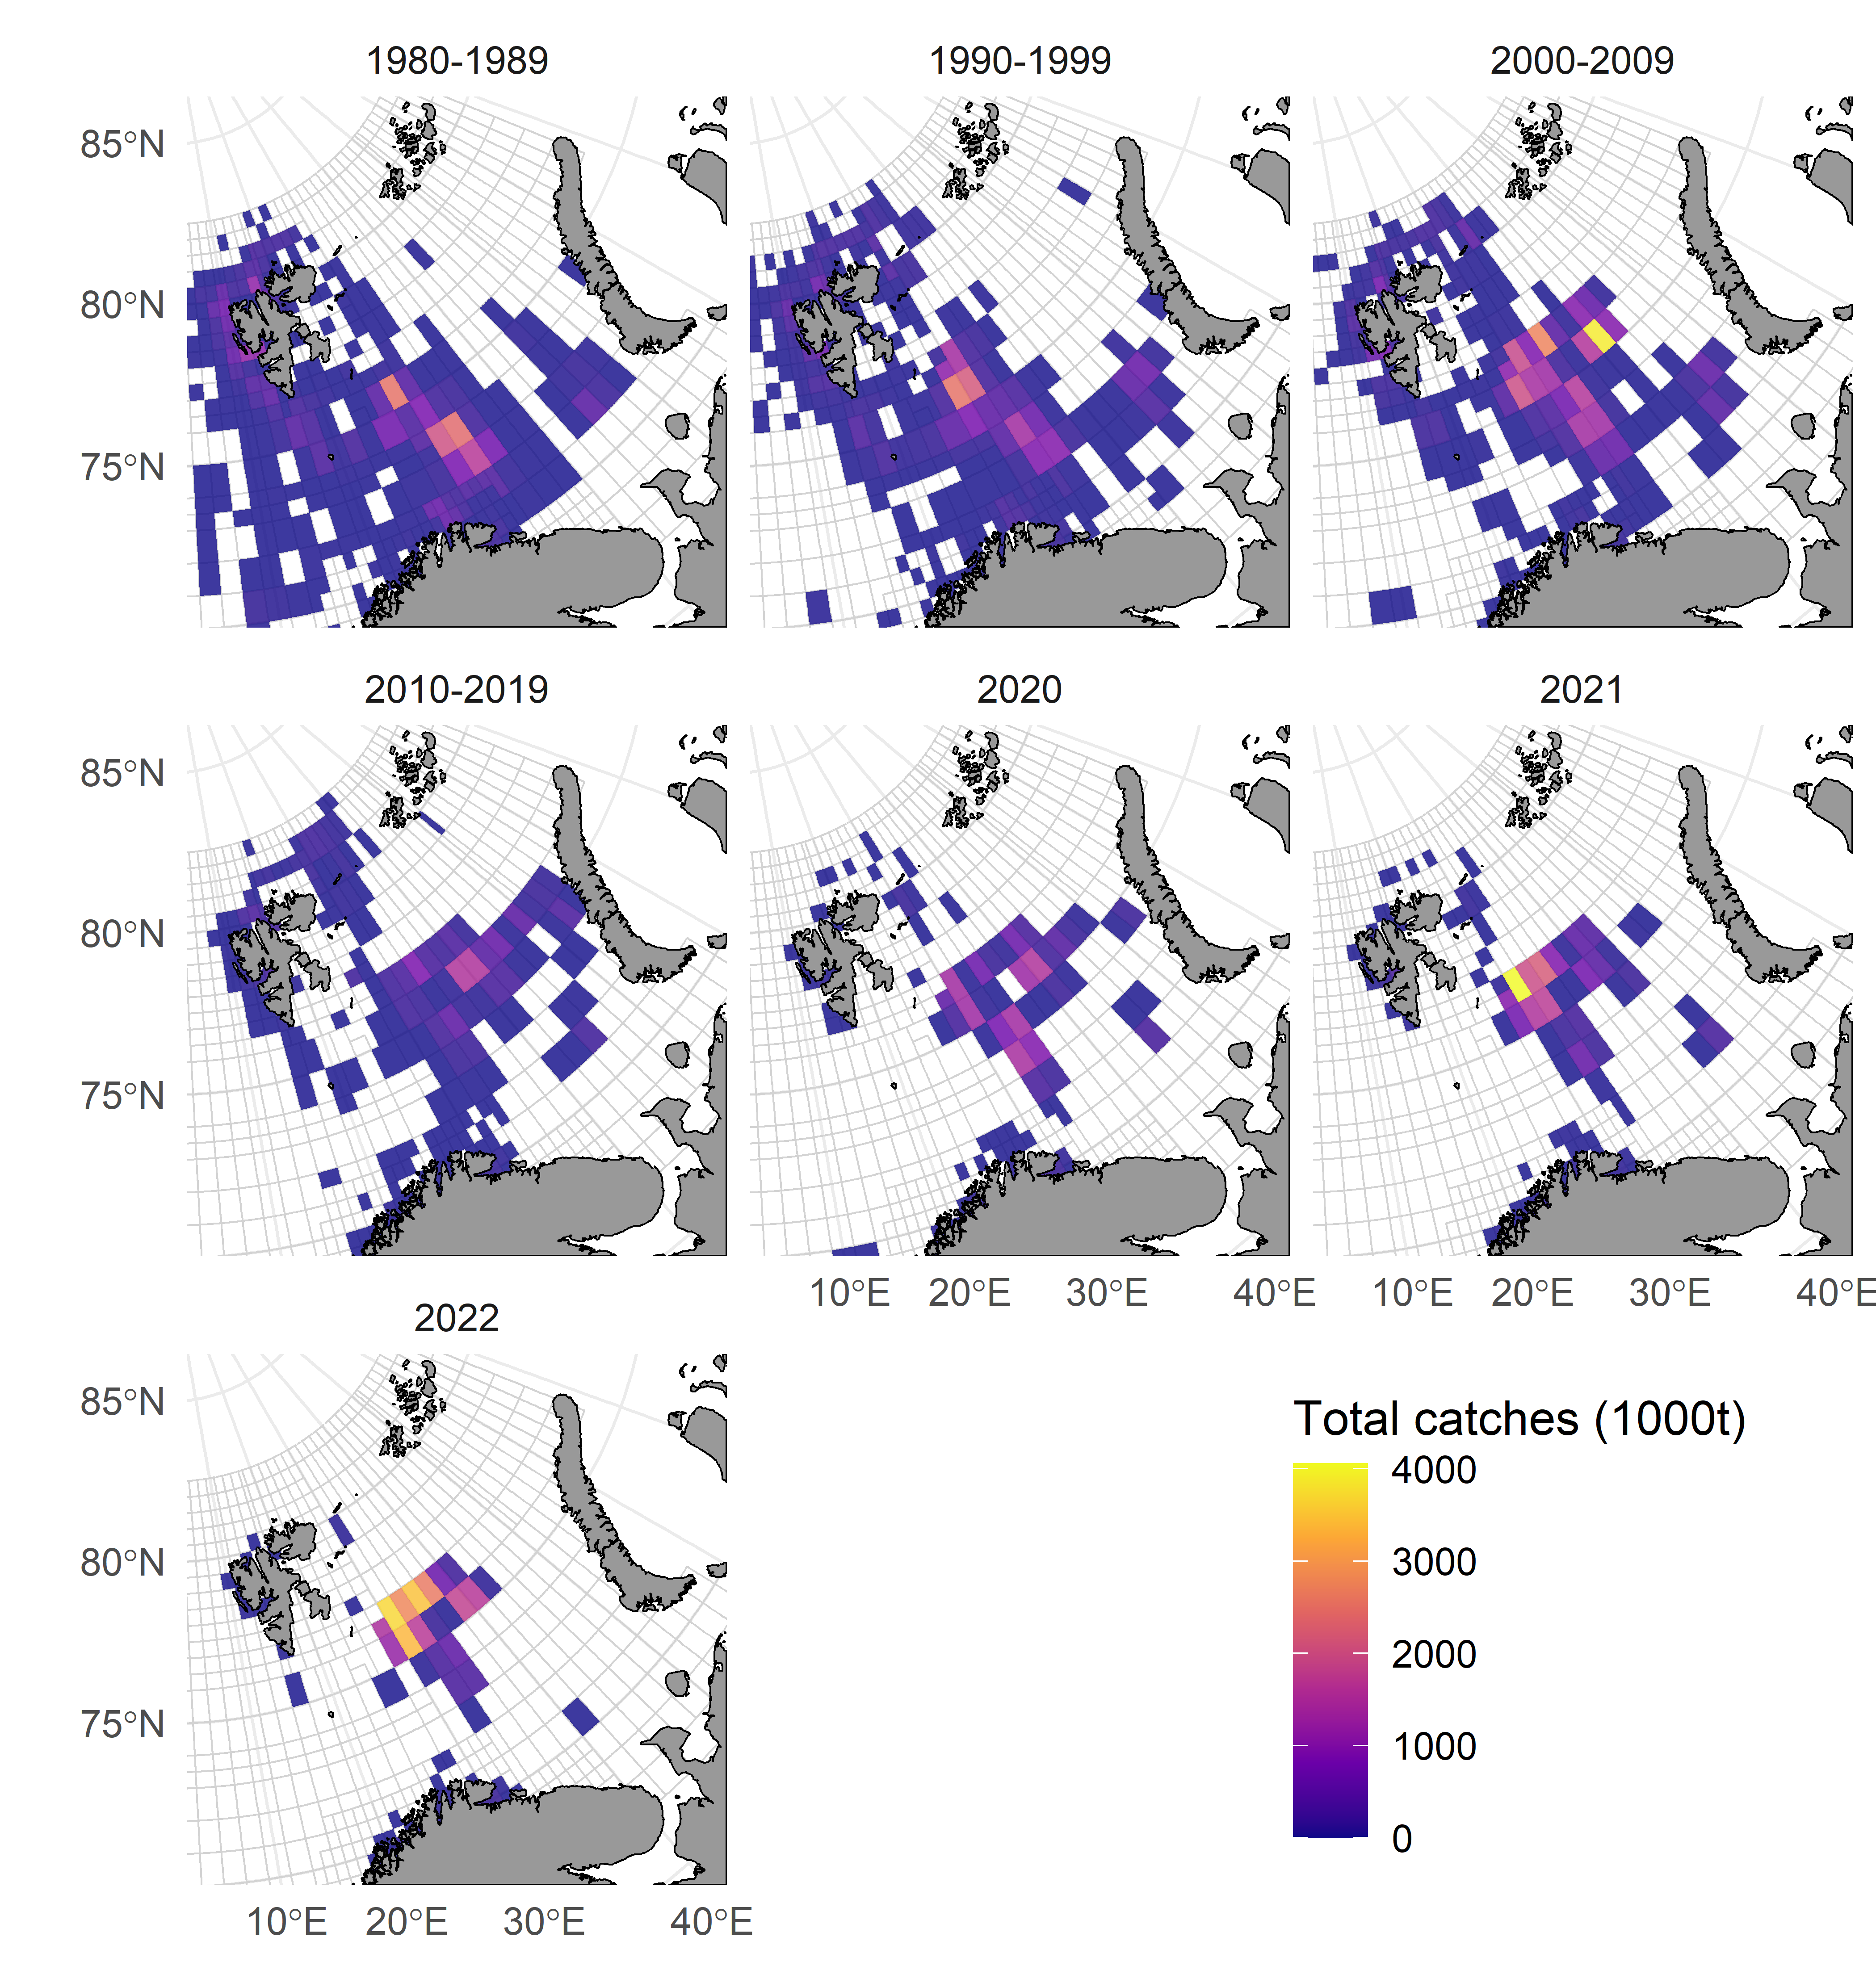
The fishery was originally conducted mainly in the central Barents Sea and on the Svalbard Shelf along with the Goose Bank (southeast Barents Sea). Norwegian logbook data since 2009 show decreased activity in the Hopen Deep and around Svalbard, coupled with increased effort further east in international waters (the “Loop Hole”) (Figure 3). Information from the Norwegian industry points to decreasing catch rates and more frequent area closures due to bycatch of juvenile fish on the traditional shrimp fishing grounds as the main reasons for the observed change in fishing pattern.
The Soviet/Russian fishery for the northern shrimp in the Barents Sea started in 1978. Catches peaked in 1983-1985 and varied in subsequent years (Figure 1). In 2009-2012, the Russian fishery for shrimp came to a full stop. Following a restructuring of the fleet catches have again increased in excess of 20 000 t in 2020. In the early 2000s, the Russian fishery was mainly conducted in the open part of the Barents Sea and the Svalbard area. With the resumption of fishery in 2013, the main fishing grounds were shifted eastward. Currently fishing occurs in the Russian EEZ in the areas of the Novaya Zemlya Bank, the Perseus Upland, Cape Zhelaniya and Cape Sukhoi Nos. The main fishing period is March to September; however, some vessels fish all year round.
A standardized CPUE index based on Russian logbook data that that took area, depth, gear, and month into account in a generalized additive mixed model (GLM), was stable from 2000 to 2015. From a maximum in 2019 it decreased by 23% in 2020, but in 2021 it was higher than 2019 despite annual catch in 2021 of only 12 000 t compared to 28 000. t in 2019. This standardized CPUE was not evaluated at the 2022 benchmark and is at this point not used as input to the assessment model.
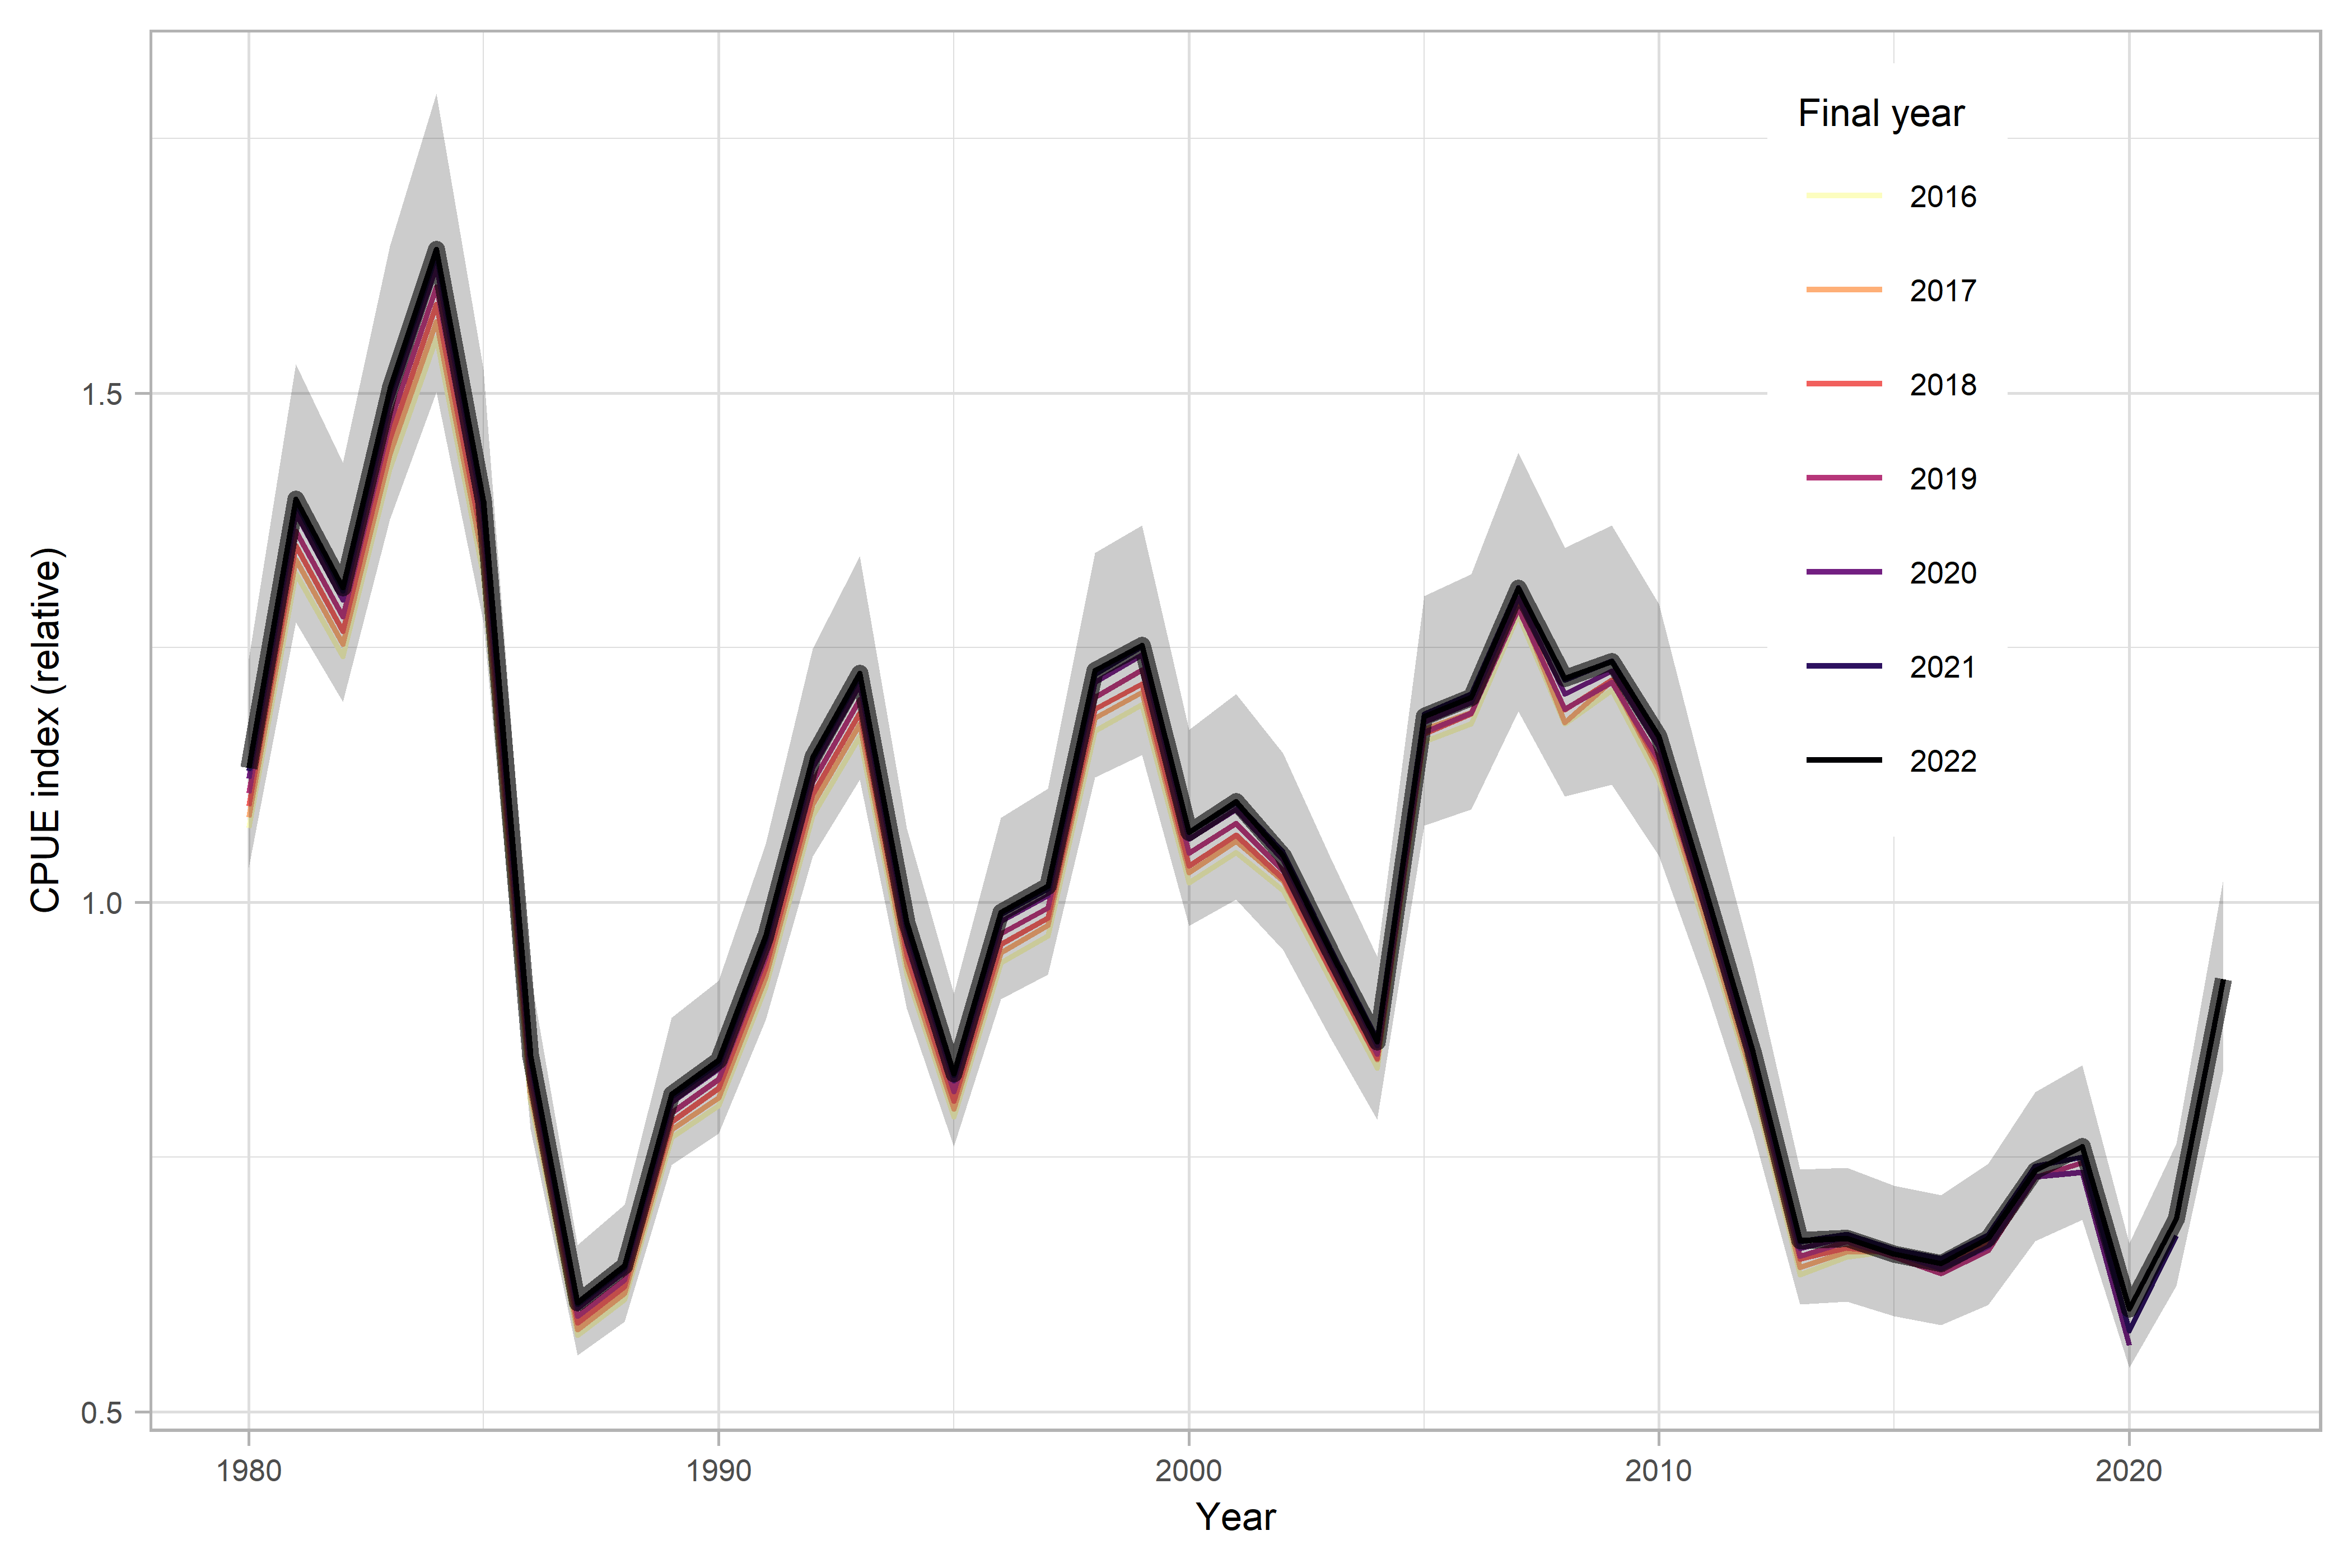
Norwegian logbook data were used in a generalized additive mixed model (GAMM) to calculate standardized annual catch rate indices (SCR Doc. 19/56). The GAMM used to derive the CPUE indices included the following variables: (1) vessel and (2) area (five survey strata) as random effects, (3) season (month), (4) gear type (single, double or triple trawl), and vessel size (registered length, continuous). The underlying data combines logbook data with lower resolution prior to 2011 with electronic logbooks from 2011 onward. The approach estimation method has been evaluated and revised during the last benchmark (ICES 2022a), resolving prior robustness issues and resulting in a stable index (Figure 4).
The resulting series provides an index of the fishable biomass of shrimp ≥17 mm CL, i.e. females and older males. The minimum commercial size in this fishery is 15mm. The Norwegian logbook data on which the CPUE index is based represents fishing activity from most of the stock distribution area. Although in recent years the portion of total catches taken by Norway has varied, it has remained between one third and more than half of the total catches.
Figure 3 : Distribution of annual catches by Norwegian vessels since 1980 based on logbook information. For periods before 2020, mean annual catches across a decade are shown. 2022 includes only data until November. Grey lines indicate the Norwegian statistical grid.
Figure 4 : Standardized CPUE index based on Norwegian data. This index (solid line) is used in the current assessment and retrospective indices with data restricted to January-October in the final year, peeling off years back to 2016. Index values are centered around the mean of the series. The shaded area marks the 95% confidence intervals.
3.2 - Research survey data
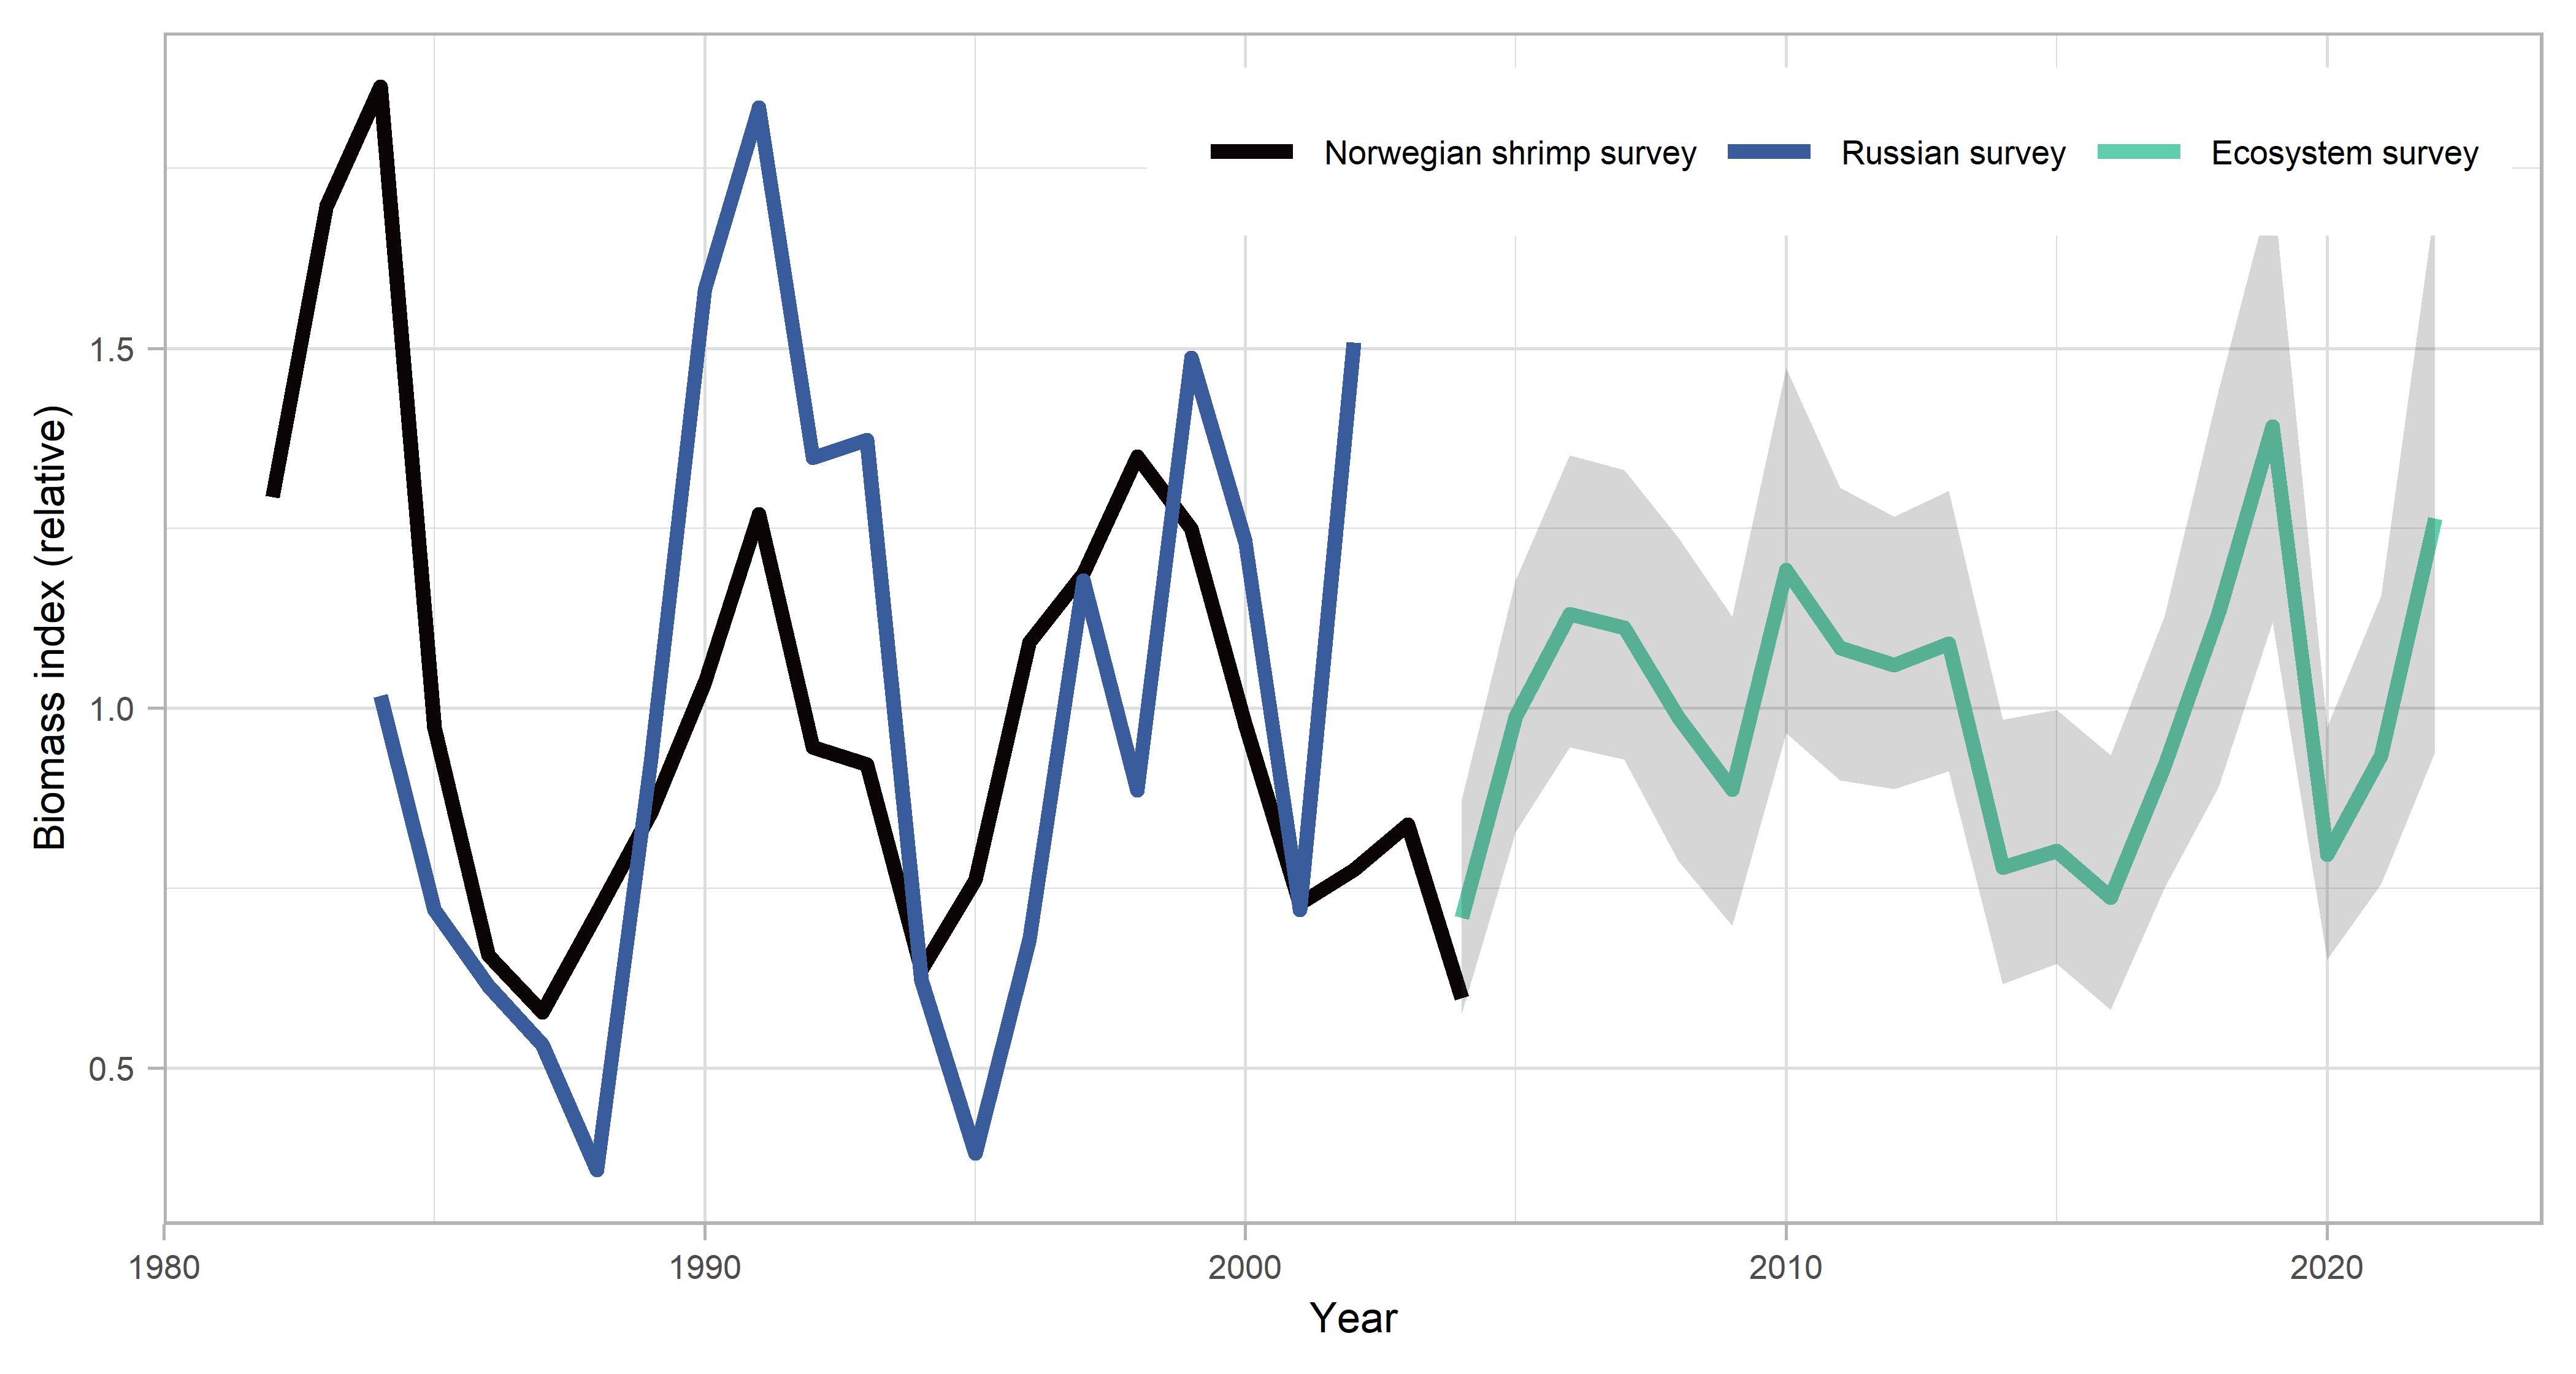
Russian and Norwegian surveys were conducted in their respective EEZs of the Barents Sea from 1982 to 2005 to assess the status of the northern shrimp stock (SCR Docs. 06/70, 07/75, 14/51, 15/52). In 2004, these surveys were replaced by a joint Norwegian-Russian “Ecosystem survey” in August/September, which monitors shrimp along with a multitude of other ecosystem variables in the Barents Sea and around Svalbard (SCR Docs.14/55, 7/68).
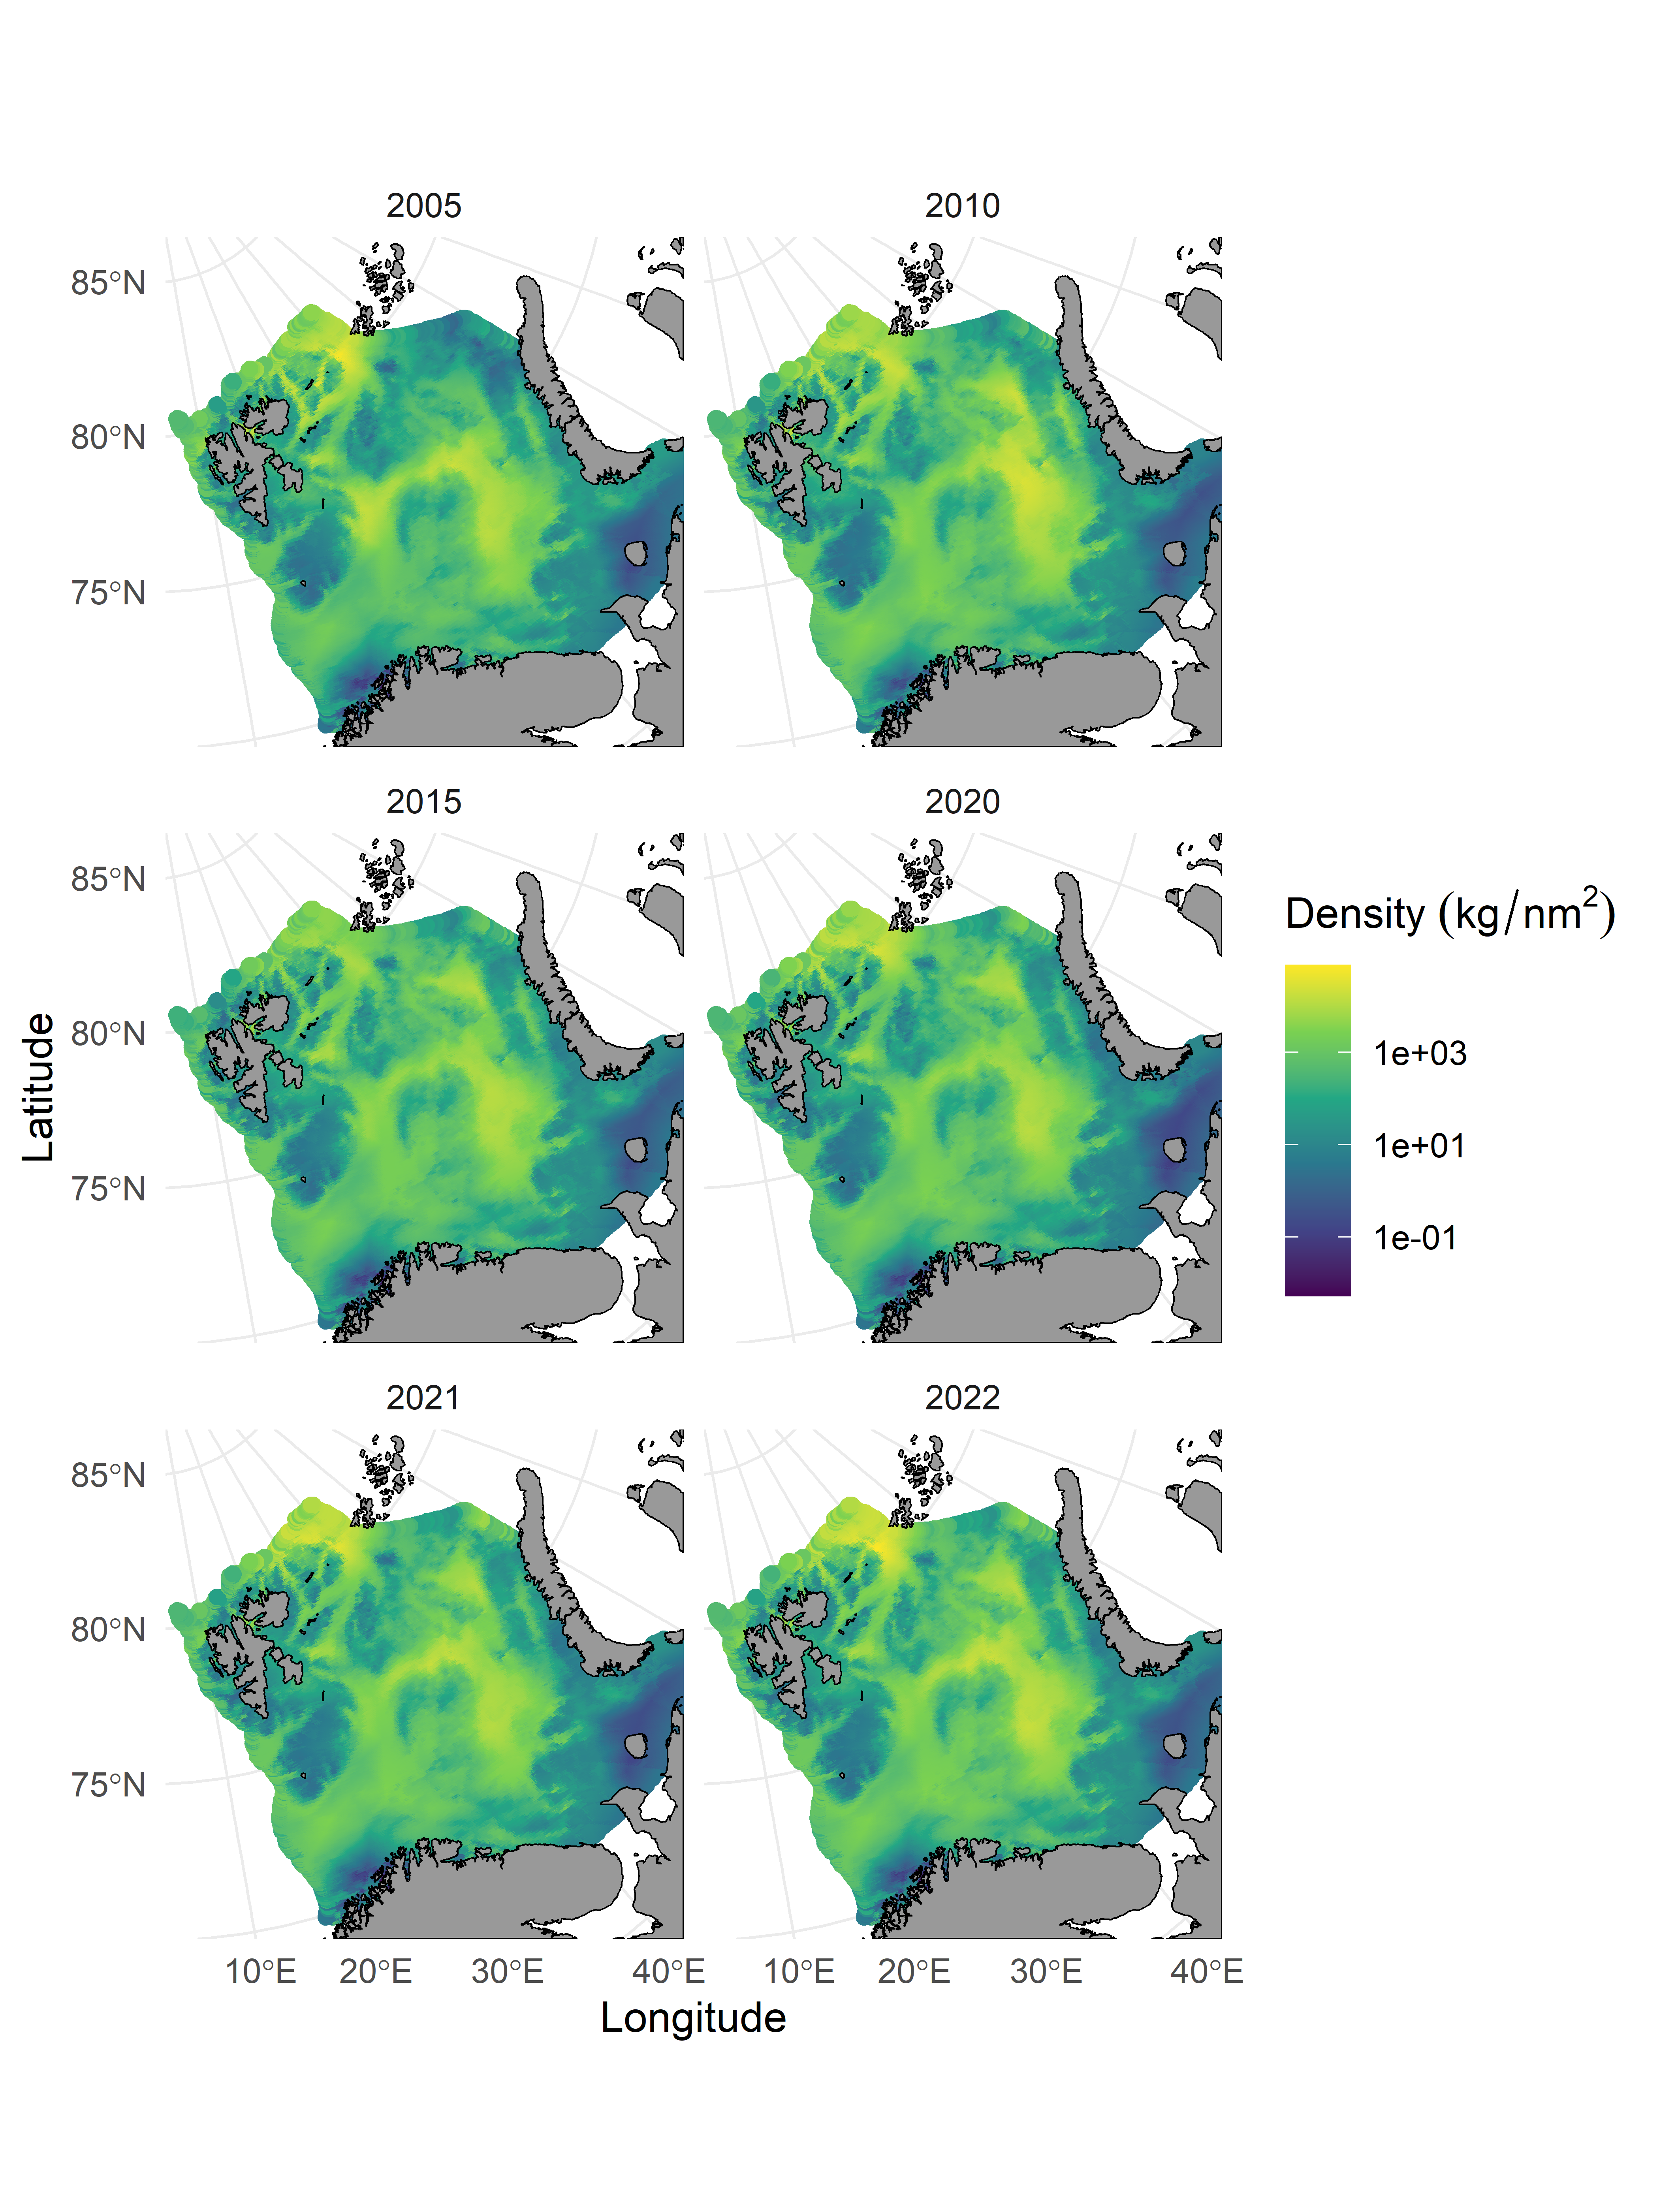
Biomass. The biomass indices of the Norwegian shrimp and Russian surveys have fluctuated without trend over their respective time periods covered (Figure 5 ). The most recent survey series, the ecosystem survey, has fluctuated substantially after a low in 2016 to reach its highest value in 2019. However, the 2020 value is down again close to the 2016 value. In 2021 and 2022, a positive trend in biomass was registered. However, the 2022 value comes with large uncertainty due to incomplete coverage. The spatial distribution of shrimp biomass has been relatively stable over the recent six-year period (Figure 6 ).
In general, the entire survey area of the ecosystem survey (Figure 6 ) is covered in all years, however, due to heavy ice conditions in 2014 the northern part of the area (stratum 3, see SCR Doc. 17/68) was not covered, and in 2020 and 2022, parts of the survey were not conducted or at a later stage due to technical problems with survey vessels. In 2020 the Russian part of the survey area (about 50%) was not finalized before the start of the 2020 assessment due to technical issues. These data have now been added. The same situation repeated itself in 2022, underlining that the ecosystem survey has been plagued by minor and major coverage and data availability issues.
During the benchmark in 2022, estimation methods for the ecosystem survey index were therefore evaluated to determine a suitable approach that can handle better incomplete coverage (ICES 2022a). A geostatistical model was subsequently adopted to replace the prior design-based approach, using a GAMM that includes spatio-temporal correlation. In the modelled index, missing coverage is predicted based on estimated fixed and random effects, namely the estimated relationship between shrimp density and depth as well as the spatio-temporal random fields. The new method provides a robust approach that relies on established statistical methodology, provides uncertainty estimates, and improves on the past ad-hoc approaches to produce indices in situations with incomplete coverage.
Figure 5 : Indices of stock biomass from the (1) joint Russian-Norwegian ecosystem survey (since 2004), (2) Norwegian shrimp survey (1982-2004), and (3) the Russian survey (1984-2005). Lines show the mean estimates, the shaded area the 95% confidence interval. All indices were standardized to their respective mean.
Figure 6 : Spatial distribution of shrimp biomass based on ecosystem system survey data. Biomass is predicted with a GAMM including spatio-temporal correlation that was used to produce the standardized survey index (not complete data coverage for all years; for 2022 no data available for the eastern part).
Recruitment indices. No information is included as data are not available since 2013. The benchmark in 2022, concluded that availability of length data from the joint ecosystem survey was too inconsistent and spatially incomplete for extracting reliable information about changes in size composition or recruitment.
4 - Assessment
The modelling framework introduced in 2022 (ICES 2022a) was used for the assessment. Model settings were the same as those determined during the benchmark meeting. However, the observation error for the 2022 survey data point was assumed to be twice that of the remaining series, considering that the survey data did not cover the entire shrimp distribution area.
Within this model, parameters relevant for the assessment and management of the stock are estimated, based on a stochastic version of a surplus-production model. The model is formulated in the state-space framework Surplus production in Continuous Time (SPiCT), implemented in the R package with the same name (Pedersen and Bergen 2017). The model synthesized information from input priors for carrying capacity and initial exploitation level, four independent series of shrimp biomass indices and one series of shrimp catch. The shape of the surplus production function was fixed to a Schaefer-type shape (shape parameter = 2).
The input data consisted of standardized sock indices from time series of annual fishery catch rates for 1980–2022 (Figure 4, SCR Doc. 20/067); and trawl-survey biomass indices for 1982–2004, 1984–2005 and for 2004–2022 (Figure 5, SCR Doc. 20/065). These indices were scaled to true biomass by individual catchability parameters, q, and lognormal observation errors were applied. Total reported catch in ICES Div. 1 and 2 since 1970 was used as yield data (Figure 1, SCR Doc. 20/067). Catches are being estimated in the model, thus inputted catches are not treated as error-free values. Biomass, B, was thus measured relative to the biomass that would yield Maximum Sustainable Yield, BMSY. The estimated fishing mortality, F, refers to the removal of biomass by fishing and is scaled to the fishing mortality at MSY, FMSY. Model specification, fitting procedure and diagnostics followed the standard recommendations (Berg et al 2021, Mildenberger et al 2021).
The model was validated and performed well, in line with the in-depth exploration and sensitivity analysis conducted during the benchmark (ICES 2022a). K could not be well estimated from the data alone, underlining the importance of the prior. However, sensitivity analysis showed that the relative stock trends are insensitive to the K prior. The model gives more weight to the CPUE index than the survey indices, likely due to the longer time series with less inter-annual variation.
Parameter
Estimate
Low
High
MSY (kt)
131
39
436
Carrying capacity K (kt)
1821
564
5884
Catchability NO survey q1
0.150
0.041
0.558
Catchability RU survey q2
0.375
0.100
1.404
Catchability BESS q3
0.00072
0.00019
0.00268
Catchability CPUE q4
0.00064
0.00017
0.00237
Process error NO survey sdi1
0.205
0.152
0.276
Process error RU survey sdi2
0.406
0.295
0.558
Process error BESS survey sdi3
0.244
0.172
0.348
Process error CPUE survey sdi4
0.030
0.005
0.171
Table 2 : Summary of parameter estimates: mean and 95% confidence intervals for selected parameters estimated in the 2022 assessment.
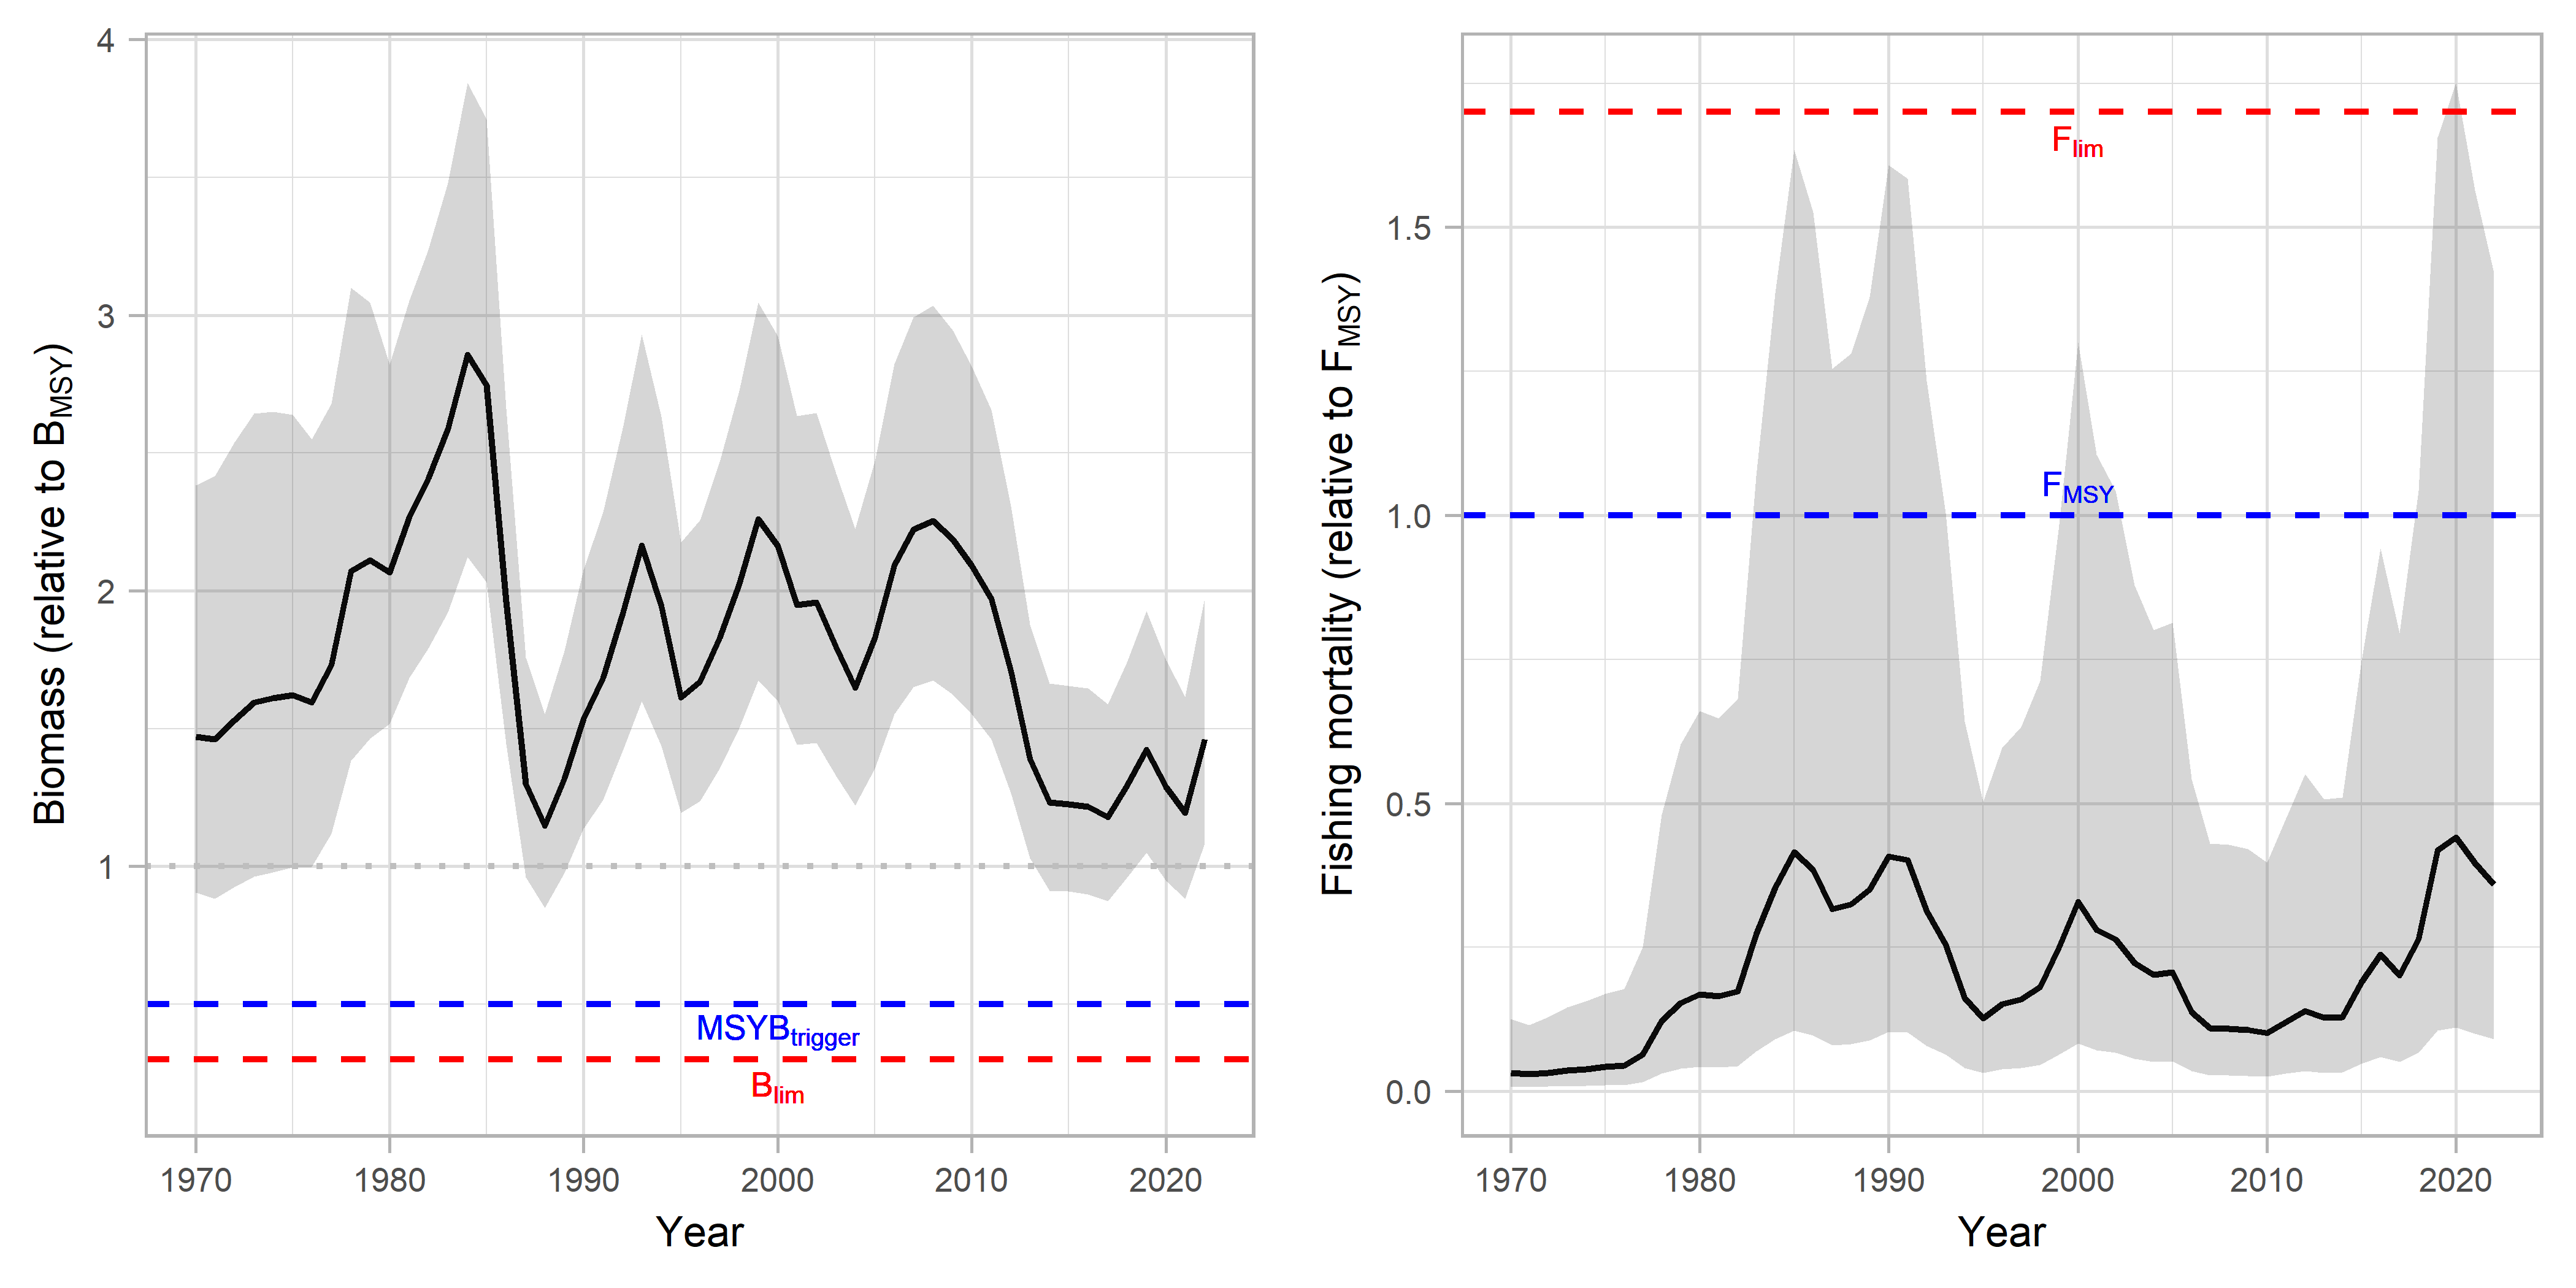
Reference points. Four reference points are considered: MSY Btrigger and FMSY representing the MSY approach, Blim and Flim representing the precautionary approach. MSY Btrigger is defined as 50% of BMSY, and Blim and Flim as 30% and 170% of BMSY and FMSY, respectively (NIPAG 2021). BMSY and FMSY are estimated directly in the assessment model. Buffer reference points are obsolete as probability of transgressing the PA limit reference points can be calculated directly.
Despite the changes in assessment inputs and model introduced during benchmark in 2022, the results of this year’s assessment have remained largely consistent with those of previous years. The conclusions on stock status drawn from the model have been found on investigation to largely be insensitive to the setting of the priors for initial stock biomass and carrying capacity (SCR Docs. 06/64 and 07/76).
Stock size and fishing mortality. A steep decline in stock biomass almost to BMSY-level in the mid-1980s was noted following some years with high catches (Figure7). After the late 1980s, however, the stock has varied on a higher level before stabilizing on the current level above BMSY during the past 8 years. The estimated risk of stock biomass being below Btrigger by the end of 2022 is less than 1% (Table 3). The mean estimate of fishing mortality has remained below FMSY throughout the history of the fishery (Figure 7). In 2022, there is a 7% probability of the F being above FMSY (Table 3).
Figure 7 : Estimated relative biomass (B/BMSY) and fishing mortality (F/FMSY) since 1970. Solid lines represent the point estimates, shaded surfaces the 95% confidence intervals. MSY and precautionary approach reference points are indicated with blue and red dashed lines, respectively.
2022
2023
Stock size (B/BMSY)
1.46
1.67
Fishing mortality (F/FMSY)
0.34
0.30
Probability of falling below Btrigger
<0.1%
<0.1%
Probability of falling below Blim
<0.1%
<0.1%
Probability of exceeding FMSY
6.3%
4.8%
Probability of exceeding Flim
1.1%
0.8%
Table 3 : Stock status for the beginning of 2022 and projected to the beginning of 2023 with a predicted total catch of 56791 t.
Projections. Catch advice at the median of FMSY and the ICES advice rule would imply no more than 188 kt or 169 kt, respectively – far above the historic catches of the fishery. Given that the right-hand side of the probability distributions of the yield at the FMSY is difficult to estimate, the working group considers it more appropriate to apply the mode as a point estimate of yield at FMSY. This mode is at 153 kt. Assuming a catch of 58 kt for 2022, catch options up to 153 kt for 2023 have moderate risks of exceeding FMSY (<39%), Flim (<17%), and low risk of going below Btrigger (<1%) by the end of 2023 (Table 4). All these catch options are likely to maintain the stock above BMSY.
Scenario
Catch (kt)
Stock size (B/BMSY)
Fishing mortality (F/FMSY)
Probability B<Blim
Probability B< Btrigger
Probability F> FMSY
Probability F>Flim
Fish at FMSY
188
1.54
1.00
<1%
<1%
50.0%
24.8%
ICES advice rule
169
1.56
0.89
<1%
<1%
44.3%
20.5%
FMSY mode
153
1.58
0.80
<1%
<1%
39.1%
16.9%
Constant catch
100
1.63
0.52
<1%
<1%
20.0%
6.4%
125
1.61
0.65
<1%
<1%
29.2%
11.0%
150
1.58
0.79
<1%
<1%
38.1%
16.3%
175
1.55
0.93
<1%
<1%
46.2%
21.9%
Table 4 : Predictions of risk and stock status associated with optional catch levels for 2023.
5 - Environmental and other considerations
Temperature. In the ecosystem survey, shrimps were only caught in areas where bottom temperatures were above 0°C. Highest shrimp densities were observed between zero and 4°C, while the limit of their upper temperature preference appears to lie at about 6-8°C. Although temperature is a likely driver for stock dynamics and distribution, no relationship of temperature with observed catch rates or stock biomass could be found during analysis conducted at the benchmark (ICES 2022a).
Predation. Both stock development and the rate at which changes might take place can be affected by changes in predation, in particular by cod, which has been documented as capable of consuming large amounts of shrimp. The relationship between shrimp biomass and cod has been investigated during the benchmark but was not found to be significant given the available data (ICES 2022a). The cod stock in the Barents Sea has decreased but remained at a relatively high level during the recent ten years. If predation on shrimp was to increase rapidly beyond the range previously experienced, the shrimp stock might decrease in size more than the model results have indicated as likely.
Recruitment, and reaction time of the assessment model. The model used is best at projecting trends in stock development but estimates and uses long-term averages of stock dynamic parameters. Large and/or sudden changes in recruitment or mortality may therefore be underestimated in model predictions.
Model performance. The model was able to produce good simulations of the observed data (Figure 6.13). The differences between observed values of biomass indices and the corresponding values predicted by the model were checked numerically (SCR Doc 20/066). They were found generally not to include excessively large deviations.
6 - State of the stock
Biomass. Stock biomass has been above Btrigger throughout the history of the fishery. The probability that the biomass at the end of 2022 is below Btrigger is less than 1%. Mortality. Fishing mortality is likely to have remained below FMSY throughout the history of the fishery. In 2022 there is 2% risk of fishing mortality exceeding Flim.
Recruitment. No explicit information was available but there were some indications of good recent recruitment from preliminary investigation of observer and survey data.
State of the stock. The Stock is estimated to be well above BMSY and exploited sustainably.
7 - Research recommendations
The fishery has expanded since 2014 and catches by countries other than Norway have increased to account for more than 50% of the total in most years. In 2016, NIPAG therefore recommended that available data (logbook data and catch samples) from the participating nations be made available to the assessment. Status: an official data call has been made and some parties have now provided aggregated data on total catch and effort. This is of limited use in the assessment work and the original recommendation is therefore reiterated.
During the 2022 benchmark, it was recommended to explore the utility of the joint Norwegian-Russian demersal survey in winter as a potential data source for a stock index (separate or integrated with the ecosystem survey index). Status: further analysis is needed and will be conducted in 2023.
During the 2022 benchmark, it was recommended to investigate further the predator-prey relationship between shrimp and cod, including available data from cod stomach sampling. Status: further analysis is needed.
8 - References
Pedersen, M. W., and Berg, C. W. 2017. A stochastic surplus production model in continuous time. Fish and Fisheries, 18: 226-243. https://doi.org/10.1111/faf.12174.
Berg, C., Coleman, P., Cooper, A., Hansen, H. Ø., Haslob, H., Herrariz, I. G., Kokkalis, A., et al. 2021. Benchmark Workshop on the development of MSY advice for category 3 stocks using Surplus Production Model in Continuous Time; SPiCT (WKMSYSPiCT).
ICES. 2018. Interim Report of the Working Group on the Integrated Assessments of the Barents Sea (WGIBAR). ICES WGIBAR REPORT 9-12 March 2018. Tromsø, Norway. ICES CM 2018/IEASG:04. 210 pp.
ICES. 2022a. Benchmark workshop on Pandalus stocks (WKPRAWN). Edited by C. Lordan, and J. Lövgren. https://doi.org/10.17895/ices.pub.19714204.v1
ICES 2022b. Working Group on the Integrated Assessments of the Barents Sea (WGIBAR). ICES Scientific Reports. https://doi.org/10.17895/ices.pub.20051438.v1.
ICES 2022c. ICES Workshop on the use of Collecting bags in shrimp fisheries (WKCB). ICES Scientific Reports 4:1. 126 pp. https://doi.org/10.17895/ices.pub.9709
Mildenberger, T., Kokkalis, A., and Berg, C. 2021. Guidelines for the stochastic production model in continuous time (SPiCT).
NAFO/ICES 2021. NAFO/ICES Pandalus Assessment Group Meeting-February and September 2021. SCR Doc. 20/21.