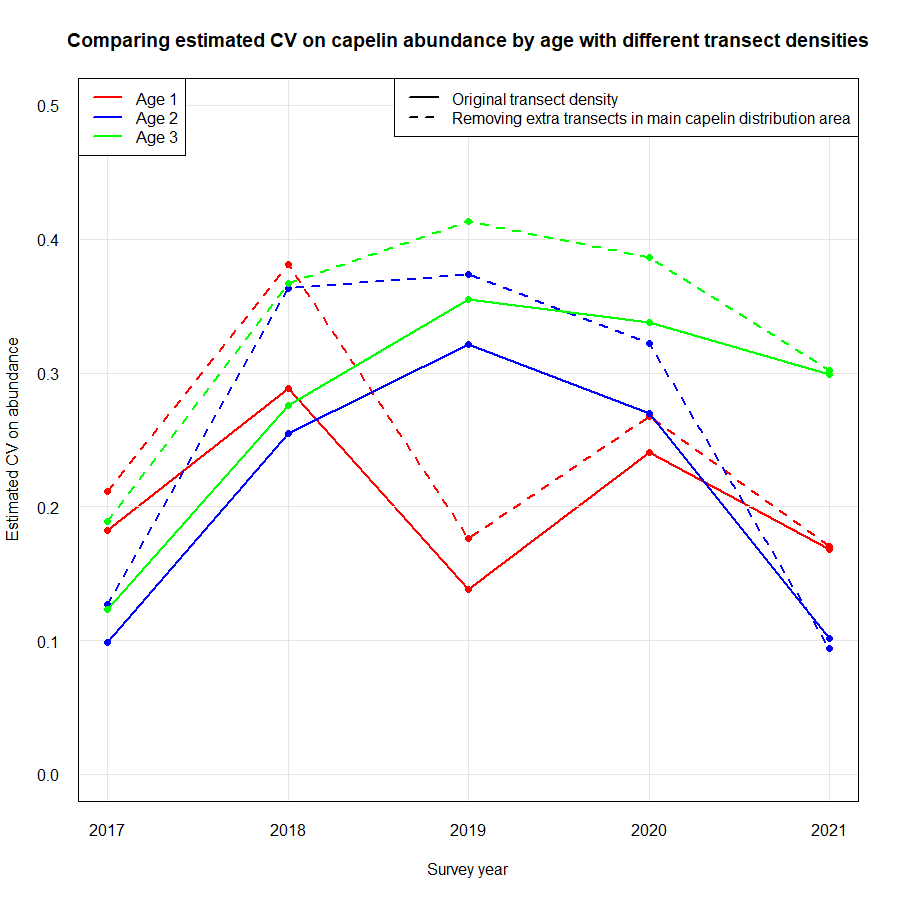
Figure 9.6.3. Estimated CV on capelin abundance by age for 2017-2021 comparing different transect densities: 1) original transect density with increased effort in main capelin distribution area, and 2) equal transect density over the coverage area – extra transects in main distribution area are removed (dashed lines).