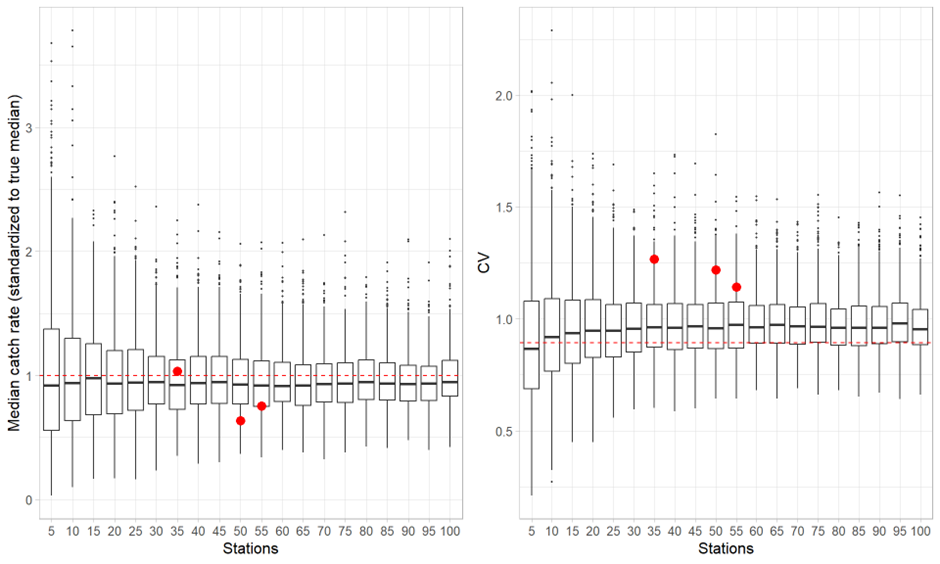
Figure 9.11.3 Median annual catch rate (number per nm) and CV based on resampling of video stations from the snow crab survey. Shown are boxplots of median densities and CVs for a resampled station number based on 500 repetitions each. Red dots indicate the survey data in 2020-2022, red dashed line the median density and CV from geostatistical model predictions.