Gå til hovedinnhold
Havforskningsinstituttet
HI
English
<- Tilbake
Søk
Søk
Søk
View page in English
Figur
Fra rapporten:
Revision of the Norwegian-Russian Barents Sea Ecosystem Survey (BESS)
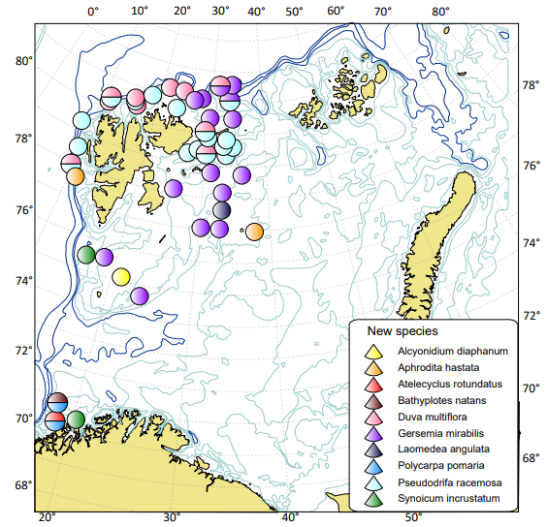
Figure. 9.12.1 The number of species identified (black line) during 2004-2021 across the number of stations (dotted line) (above) and the areas where new species was recorded in 2021 (below).