Gå til hovedinnhold
Havforskningsinstituttet
HI
English
<- Tilbake
Søk
Søk
Søk
View page in English
Figur
Fra rapporten:
Revision of the Norwegian-Russian Barents Sea Ecosystem Survey (BESS)
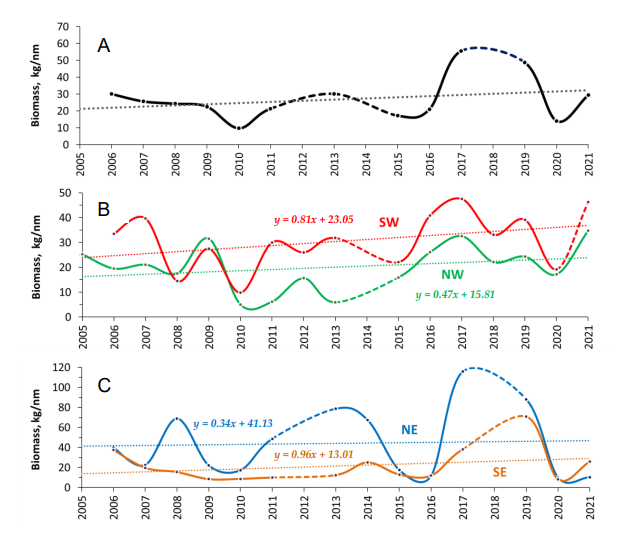
Figure 9.12.3. Biomass fluctuations for the entire sea (black line below), but also for the 4 areas. SW (red), SE (orange), NW (green), NE (blue).