Gå til hovedinnhold
Havforskningsinstituttet
HI
English
<- Tilbake
Søk
Søk
Søk
View page in English
Figur
Fra rapporten:
Revision of the Norwegian-Russian Barents Sea Ecosystem Survey (BESS)
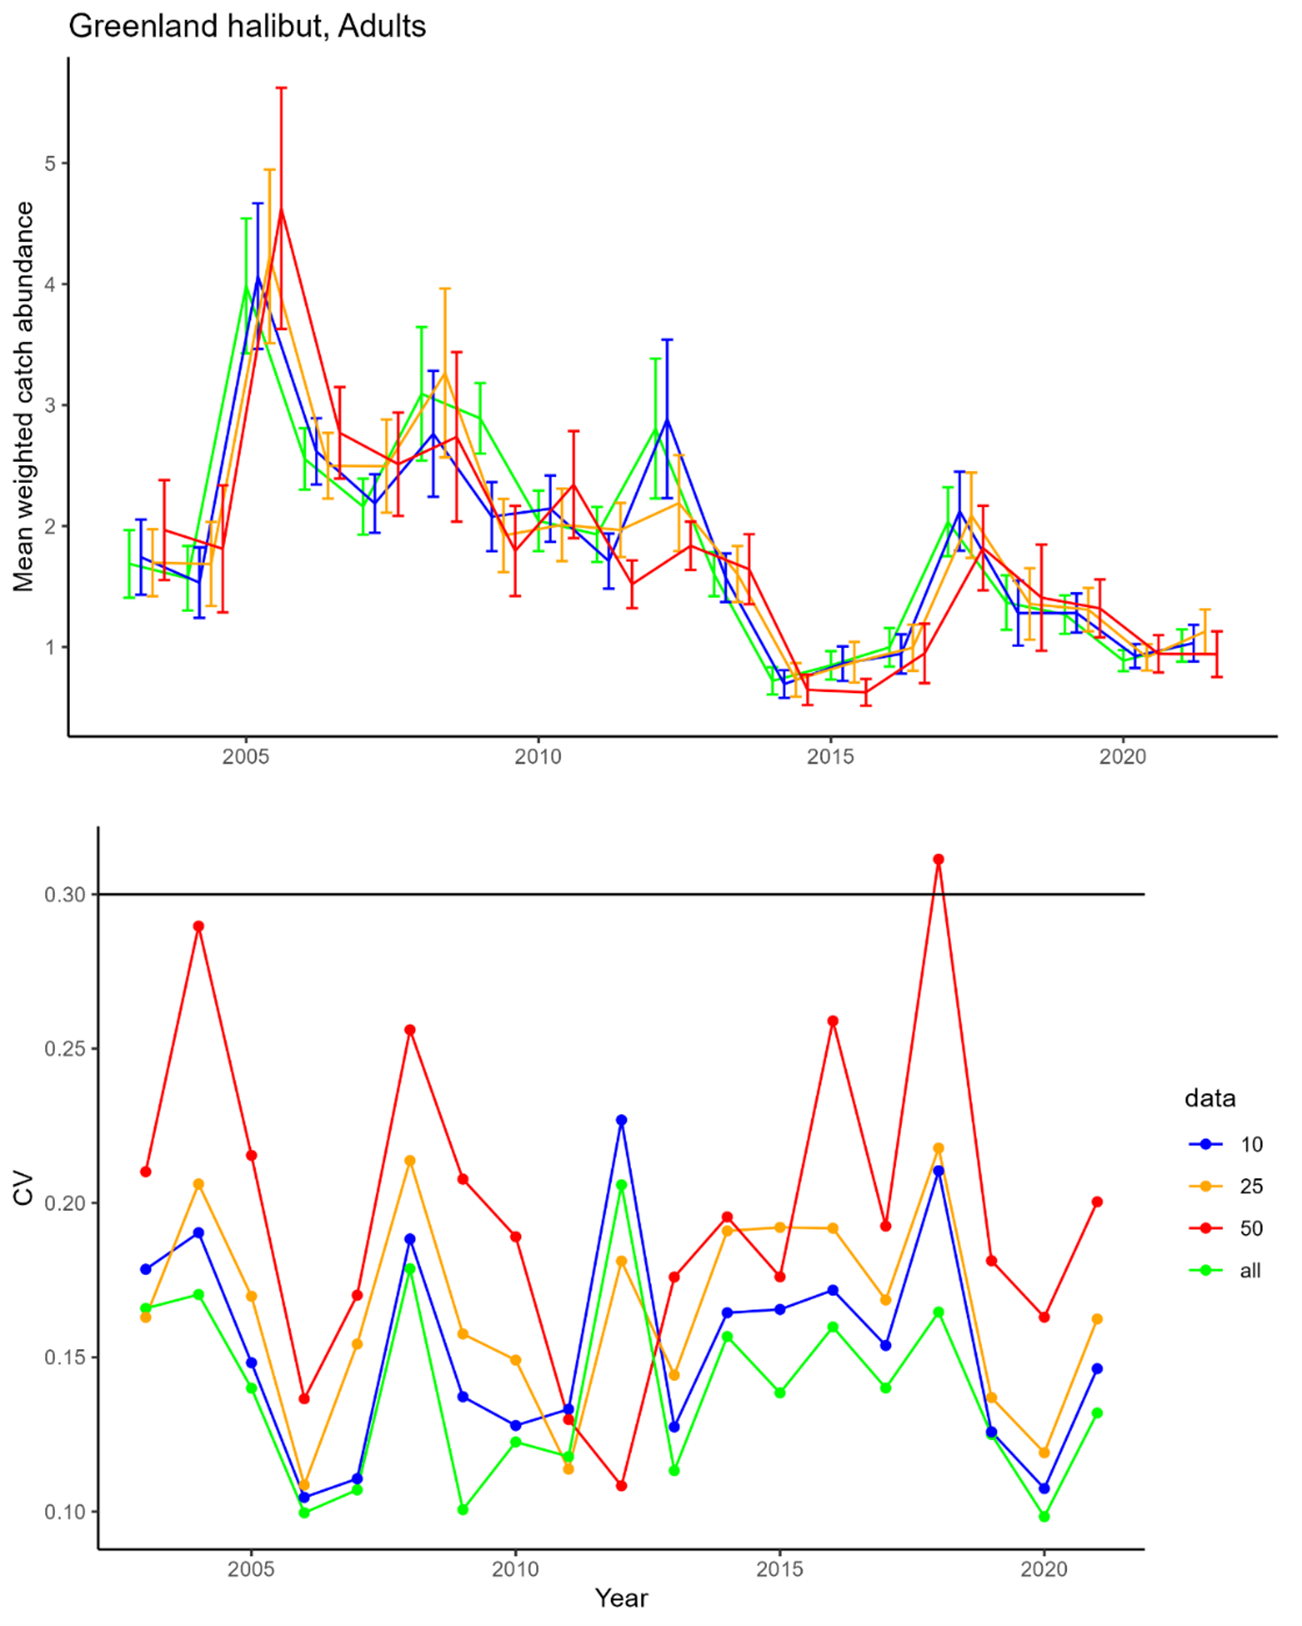
Figure 9.9.2: Mean weighted catch (with 95% confidence intervals, upper graph) and CV per year of adult Greenland halibut index (lower graph), with all data and 10 %, 25% and 50% reduction in station density.