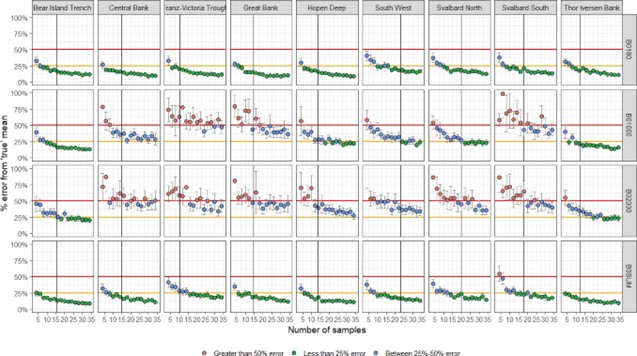
Figure 9.3.7. Simulation of likely error from “true” mean as a function of sampling effort for different combinations of biomass size- fraction and Barents Sea polygons. Horizontal lines show 25% (orange) and 50% (red) error from “true” mean. Vertical black line shows mean number of samples collected annually (1990-2021) within the different polygons. Error bars show 1.96*SE of the 100 replicate simulations.