Gå til hovedinnhold
Havforskningsinstituttet
HI
English
<- Tilbake
Søk
Søk
Søk
View page in English
Figur
Fra rapporten:
Revision of the Norwegian-Russian Barents Sea Ecosystem Survey (BESS)
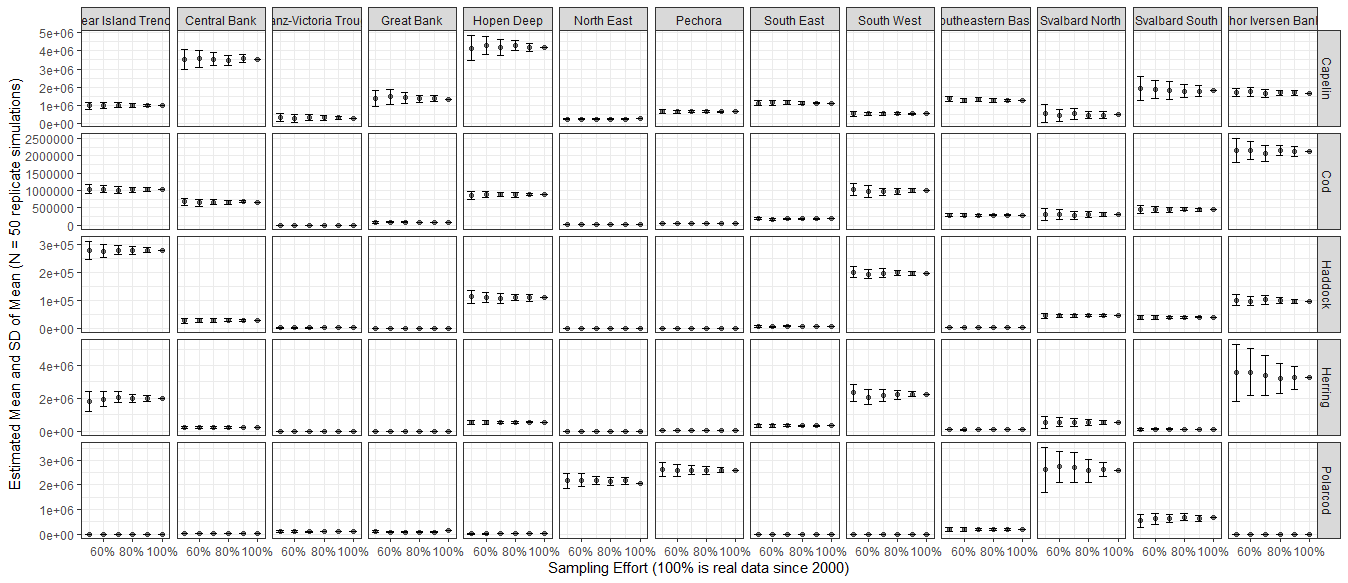
Figure 9.5.3. Estimated mean abundance and the standard deviation presented for each fish species and each polygon using data since 2000 and 50 replicates.