Gå til hovedinnhold
Havforskningsinstituttet
HI
English
<- Tilbake
Søk
Søk
Søk
View page in English
Figur
Fra rapporten:
Revision of the Norwegian-Russian Barents Sea Ecosystem Survey (BESS)
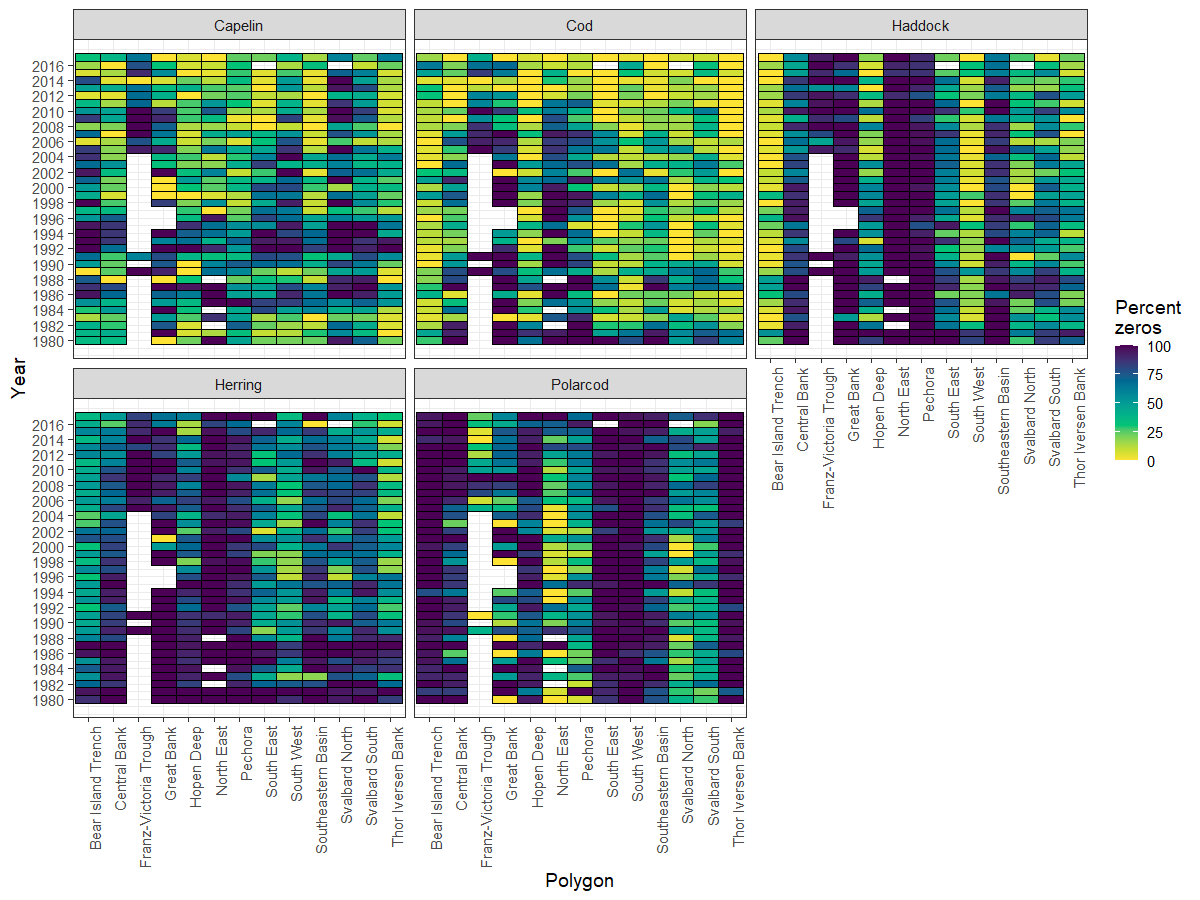
Figure 9.5.2. Percentage of zero catches per combination of fish species and polygons for the period 1980-2017.