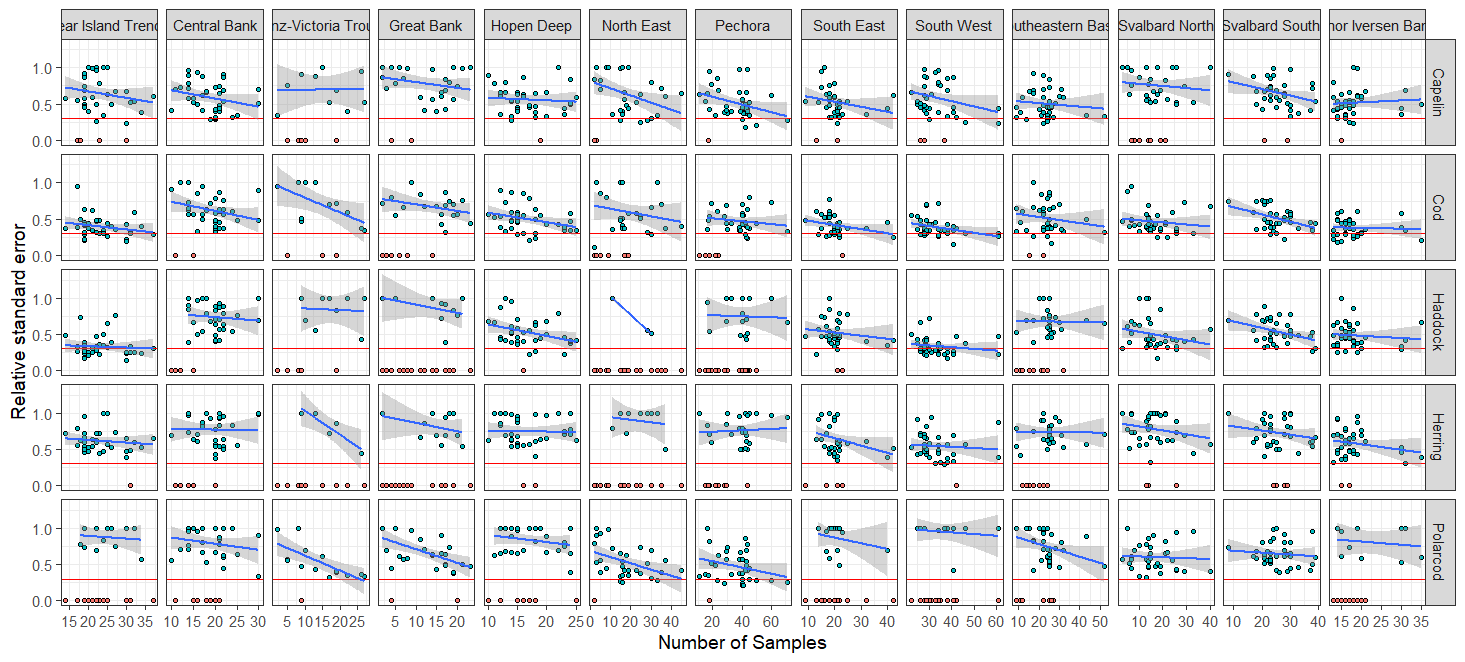
Figure 9.5.4. Calculated Relative Standard Error (RSE) for each polygon (columns) and species (rows). One datapoint per year. Red dots show fish absent in all catches (mean = 0 & sd = 0), while green dots showw years where fish is presentin the catches. Blue line is a linear smoother to the datapoints (with 0- data omitted). Red horizontal line shows the RSE = 0.3.