Gå til hovedinnhold
Havforskningsinstituttet
HI
English
<- Tilbake
Søk
Søk
Søk
View page in English
Figur
Fra rapporten:
Revision of the Norwegian-Russian Barents Sea Ecosystem Survey (BESS)
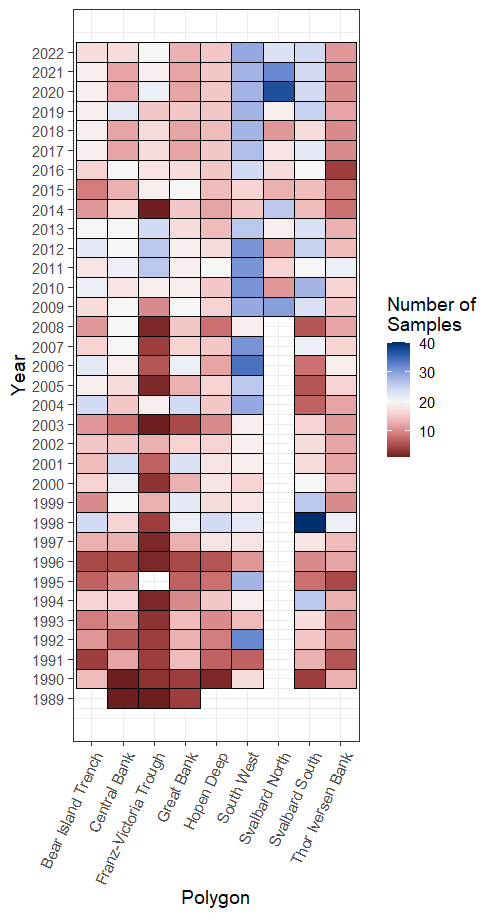
Figure 9.3.2. Number of WP2 samples per polygon per year