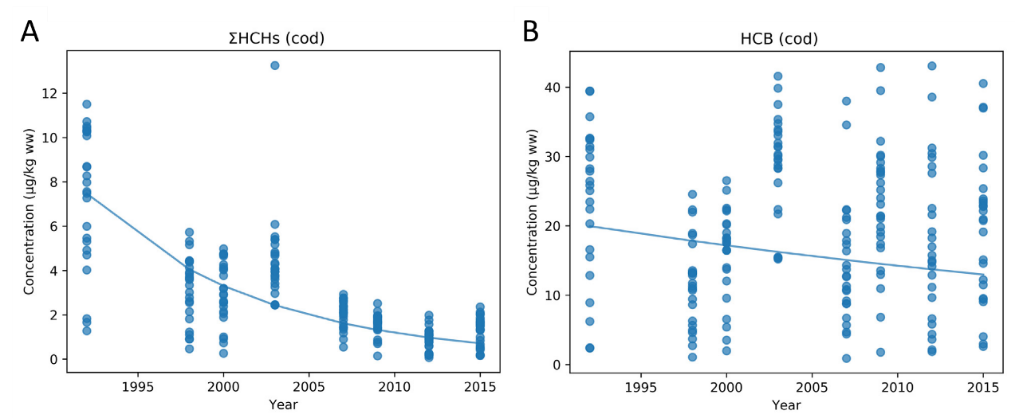
Figure 9.2.2. The levels of chlorinated POPs in cod liver for all individuals (the dots), in μg/kg wet weight, and the regression model corrected for the median fish weight (the curve), in the period 1992 – 2015. A: sum of alpha-, beta- and gamma-hexachlorocyclohexane (ΣHCHs); B: hexachlorobenzene (HCB). From Boitsov et al., 2019.