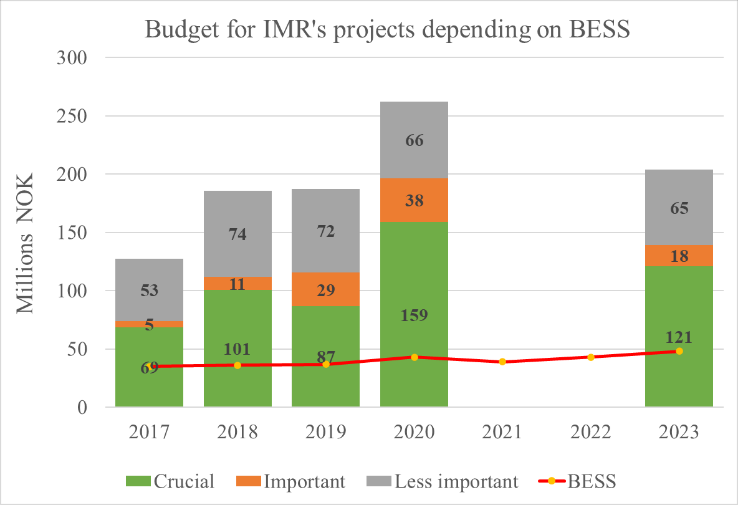
Figure 7.3 AII.3. The economic value of IMR projects relying on BESS as their data input source. The red line represents the IMR budget required every year to run BESS. On average BESS represents a yearly economic revenue of 4.5 times the cost for IMR.