Gå til hovedinnhold
Havforskningsinstituttet
HI
English
<- Tilbake
Søk
Søk
Søk
View page in English
Figur
Fra rapporten:
Revision of the Norwegian-Russian Barents Sea Ecosystem Survey (BESS)
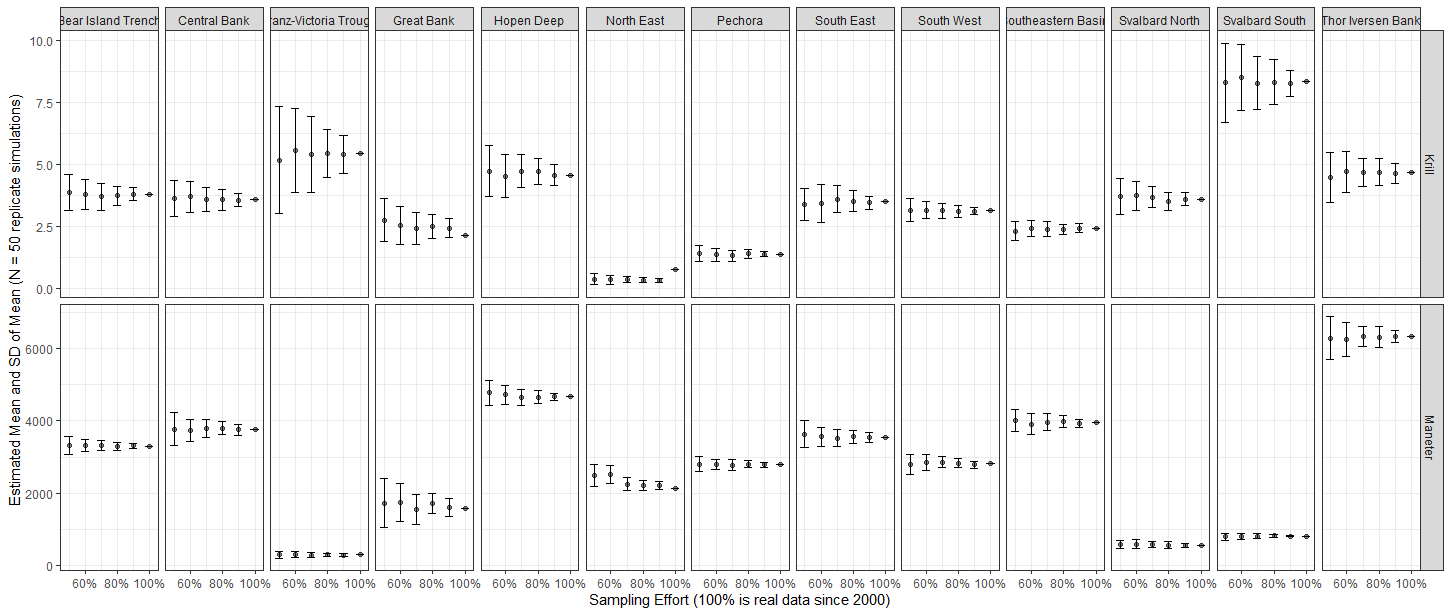
Figure 9.4.1. Estimated mean biomass of krill (above) and jellyfish (below) and the standard deviation presented for each fish species and each polygon using data since 2000 and 50 replicates.