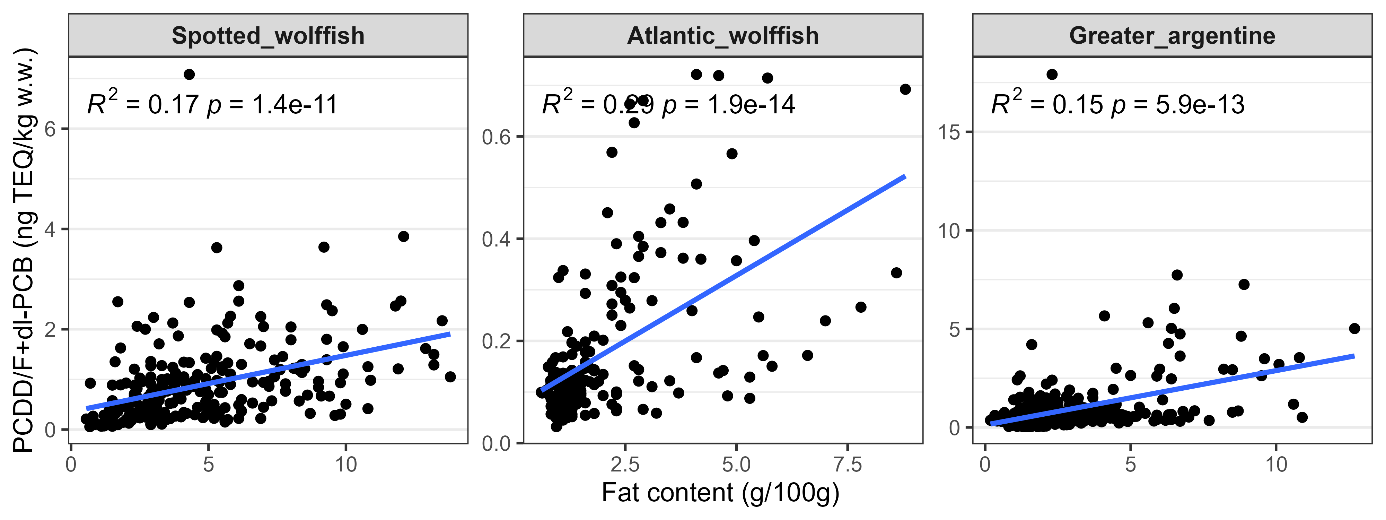
Figure 11. Correlation between fish length (cm) and fat content (g/100g) and concentration of sum PCDD/F+dl-PCB (ng TEQ/kg wet weight) in fillet of spotted wolffish, Atlantic wolffish and greater argentine from Norwegian water fished in 2019-2022. Results for Pearson’s linear correlation are given.