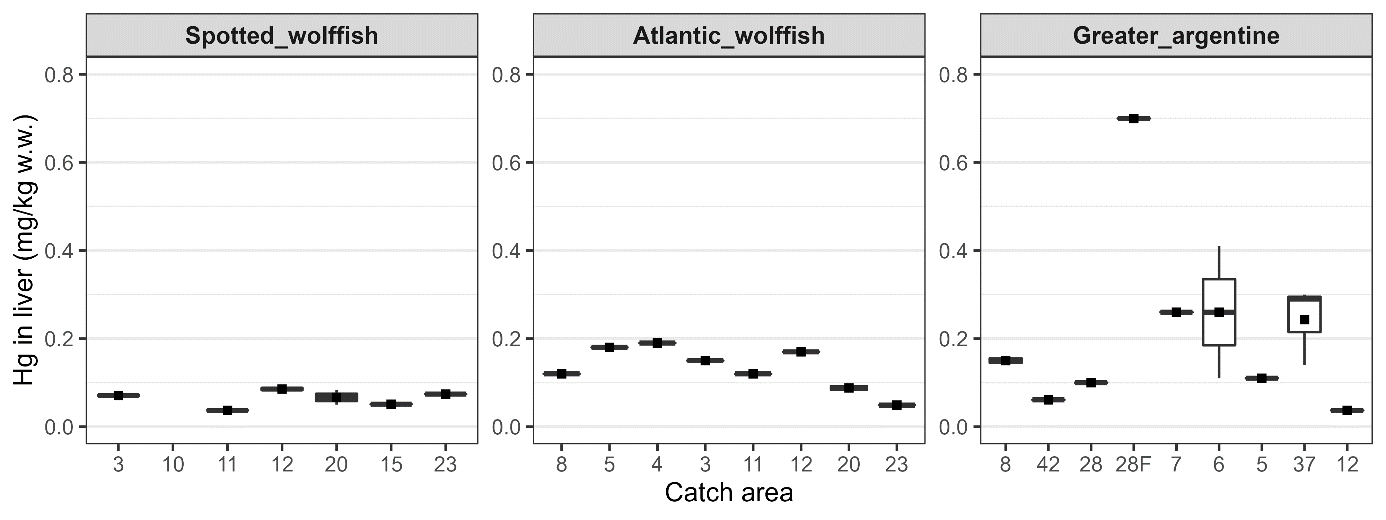
Figure 8. Concentration of mercury (mg/kg wet weight) in fillet of individuals (upper panels) and composite samples of liver (lower panels) of spotted wolffish, Atlantic wolffish and greater argentine sampled in different areas (see Figures 1, 2 and 3 for geographical location of the stations within areas, 28F refers to a fjord sample (MAP-ID GA28-40) in Norwegian waters in 2019-2022. Mean (squares), median (line), interquartile range (box), minimum and maximum (whiskers as Q1/3 ± 1.5 IQR), and outliers (dots) are given. The red horizontal line indicates the EU and Norway’s maximum level for mercury in fish fillet for human consumption.