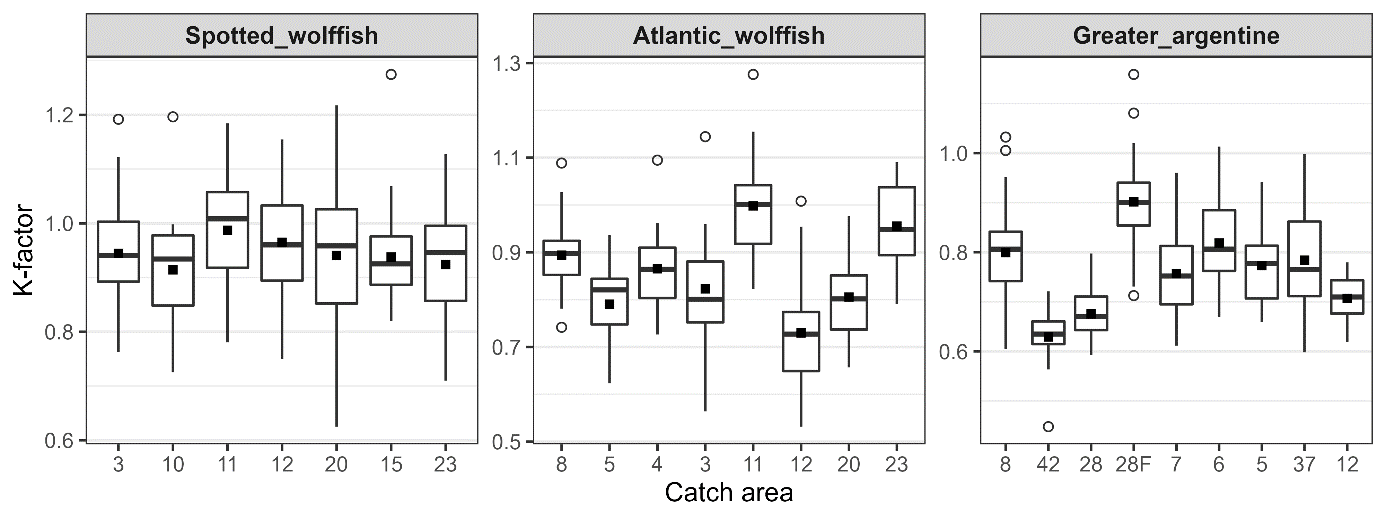
Figure 4. Fish length (cm), weight (g) and K-factor (weight*100/length3) of spotted wolffish, Atlantic wolffish and greater argentine sampled in different areas from south to north (see Figures 1, 2 and 3 for geographical location of the stations within areas, 28F refers to a fjord sample (MAP-ID GA28-40)) in Norwegian waters in 2019-2022. Mean (squares), median (line), interquartile range (box), minimum and maximum (whiskers as Q1/3 ± 1.5 IQR), and outliers (dots) are given.