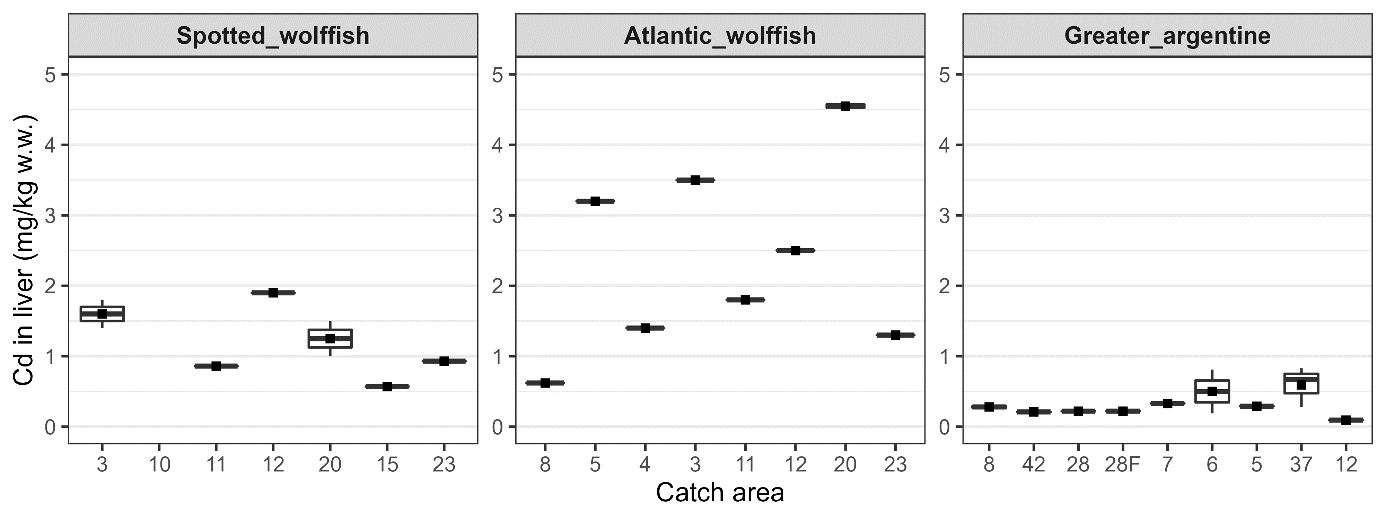
Figure 6. Concentration of cadmium (mg/kg wet weight ) in fillet of individuals (upper panels) and composite samples of liver (lower panels) of spotted wolffish, Atlantic wolffish and greater argentine sampled in different areas from south to north (see Figures 1, 2 and 3 for geographical location of the stations within areas, 28F refers to a fjord sample (MAP-ID GA28-40)) in Norwegian waters in 2019-2022. Mean (squares), median (line), interquartile range (box), minimum and maximum (whiskers as Q1/3 ± 1.5 IQR), and outliers (dots) are given. The red horizontal line indicates the EU and Norway’s maximum level for cadmium in fish fillet for human consumption.