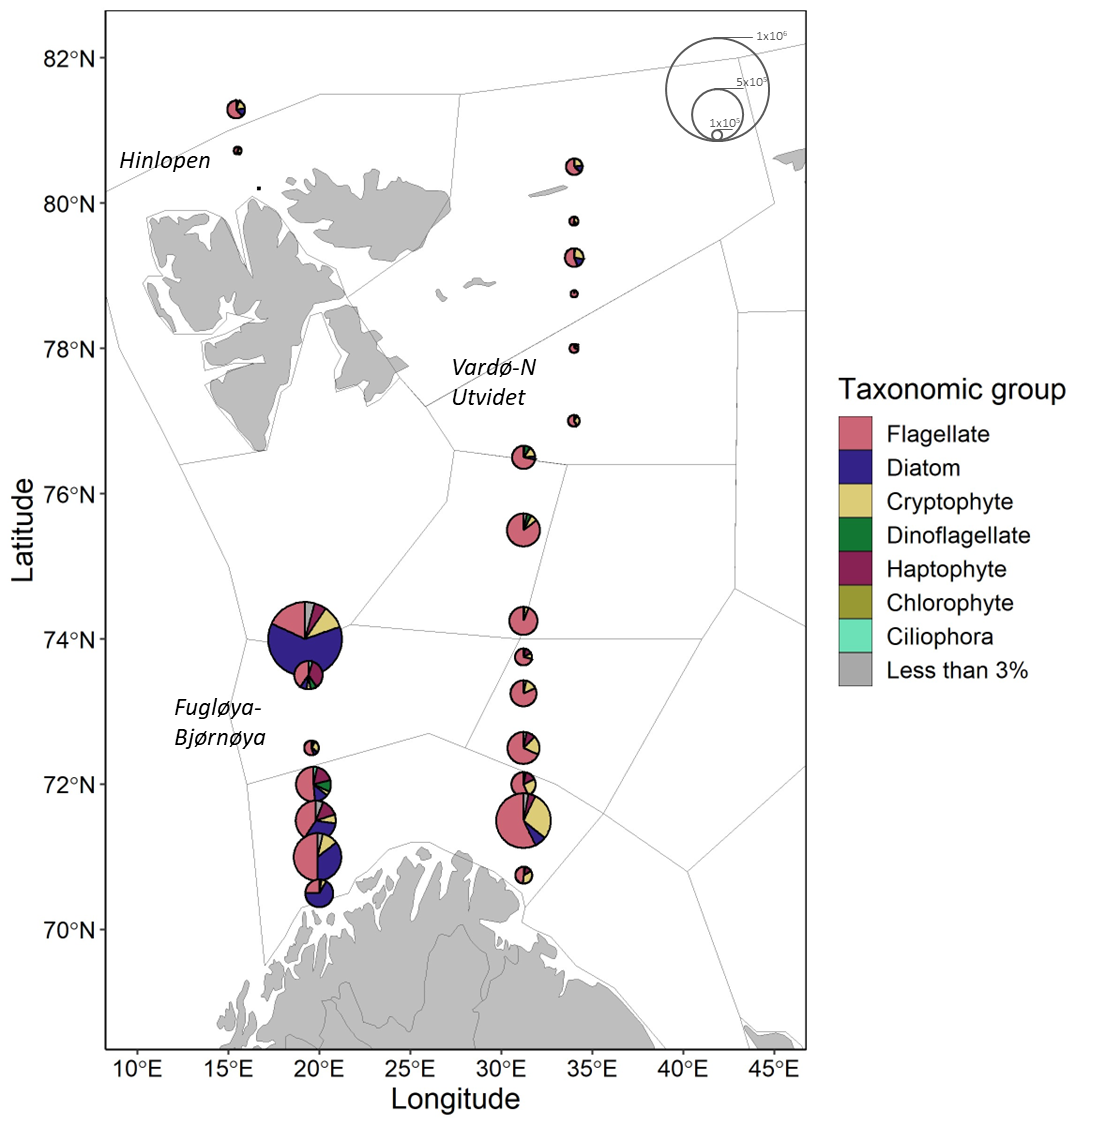
Figure 5.1.2. Maps showing microplankton community composition and abundance for samples collected August-October 2023. Pie chart radii scale to cell concentrations in cells per liter based on key. Divisions within pie charts show the contributions from broad taxonomic groups. Italicized labels indicate fixed transects. All groups which comprised < 3% of the community are summed.