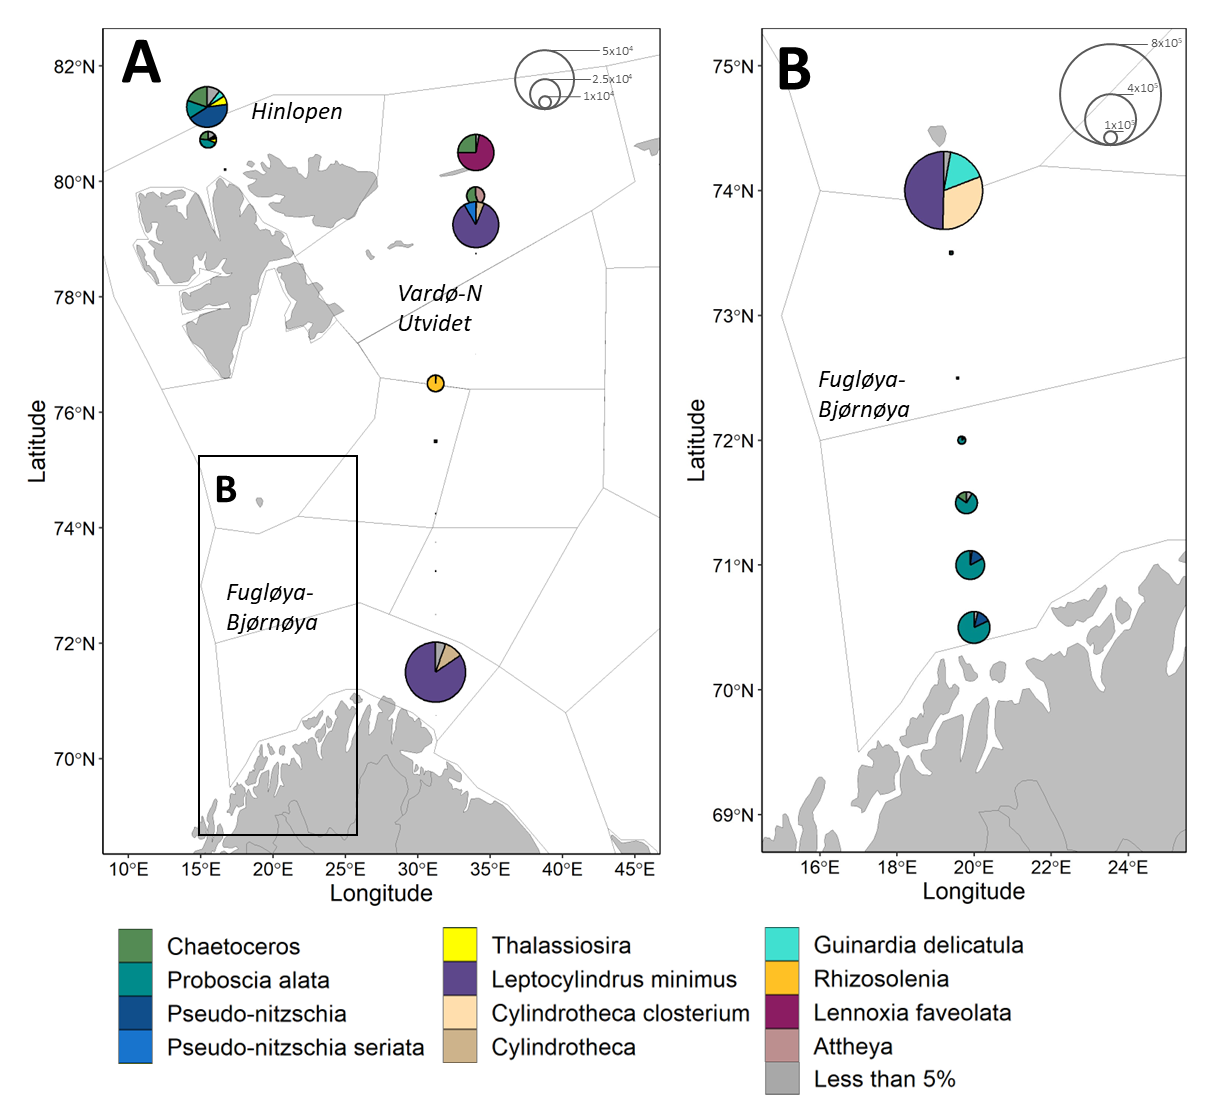
Figure 5.1.3. Maps showing diatom community composition and abundance for samples collected August-October 2023. A) Samples collected along Vardø-Nord and Hinlopen transects. B) Inset from A showing samples collected along Fugløya-Bjørnøya. Divisions within pie charts show taxonomic groups to the highest possible resolution. Pie chart radii scale to cell concentrations in cells per liter based on key. All groups which comprised < 3% of the community are summed.