Gå til hovedinnhold
Havforskningsinstituttet
HI
English
<- Tilbake
Søk
Søk
Søk
View page in English
Figur
Fra rapporten:
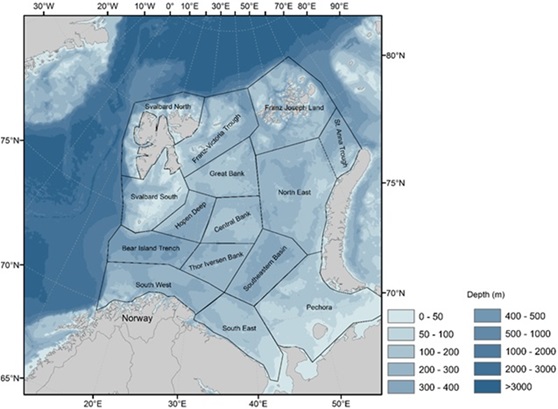
Survey report (Part 1) from the joint Norwegian/Russian Ecosystem Survey in the Barents Sea and the adjacent waters August-October 2023
Figure 5.3.1.1. Map showing subdivision of the Barents Sea into 15 subareas (polygons) used to estimate abundance of 0-group fish based on the BESS.