Gå til hovedinnhold
Havforskningsinstituttet
HI
English
<- Tilbake
Søk
Søk
Søk
View page in English
Figur
Fra rapporten:
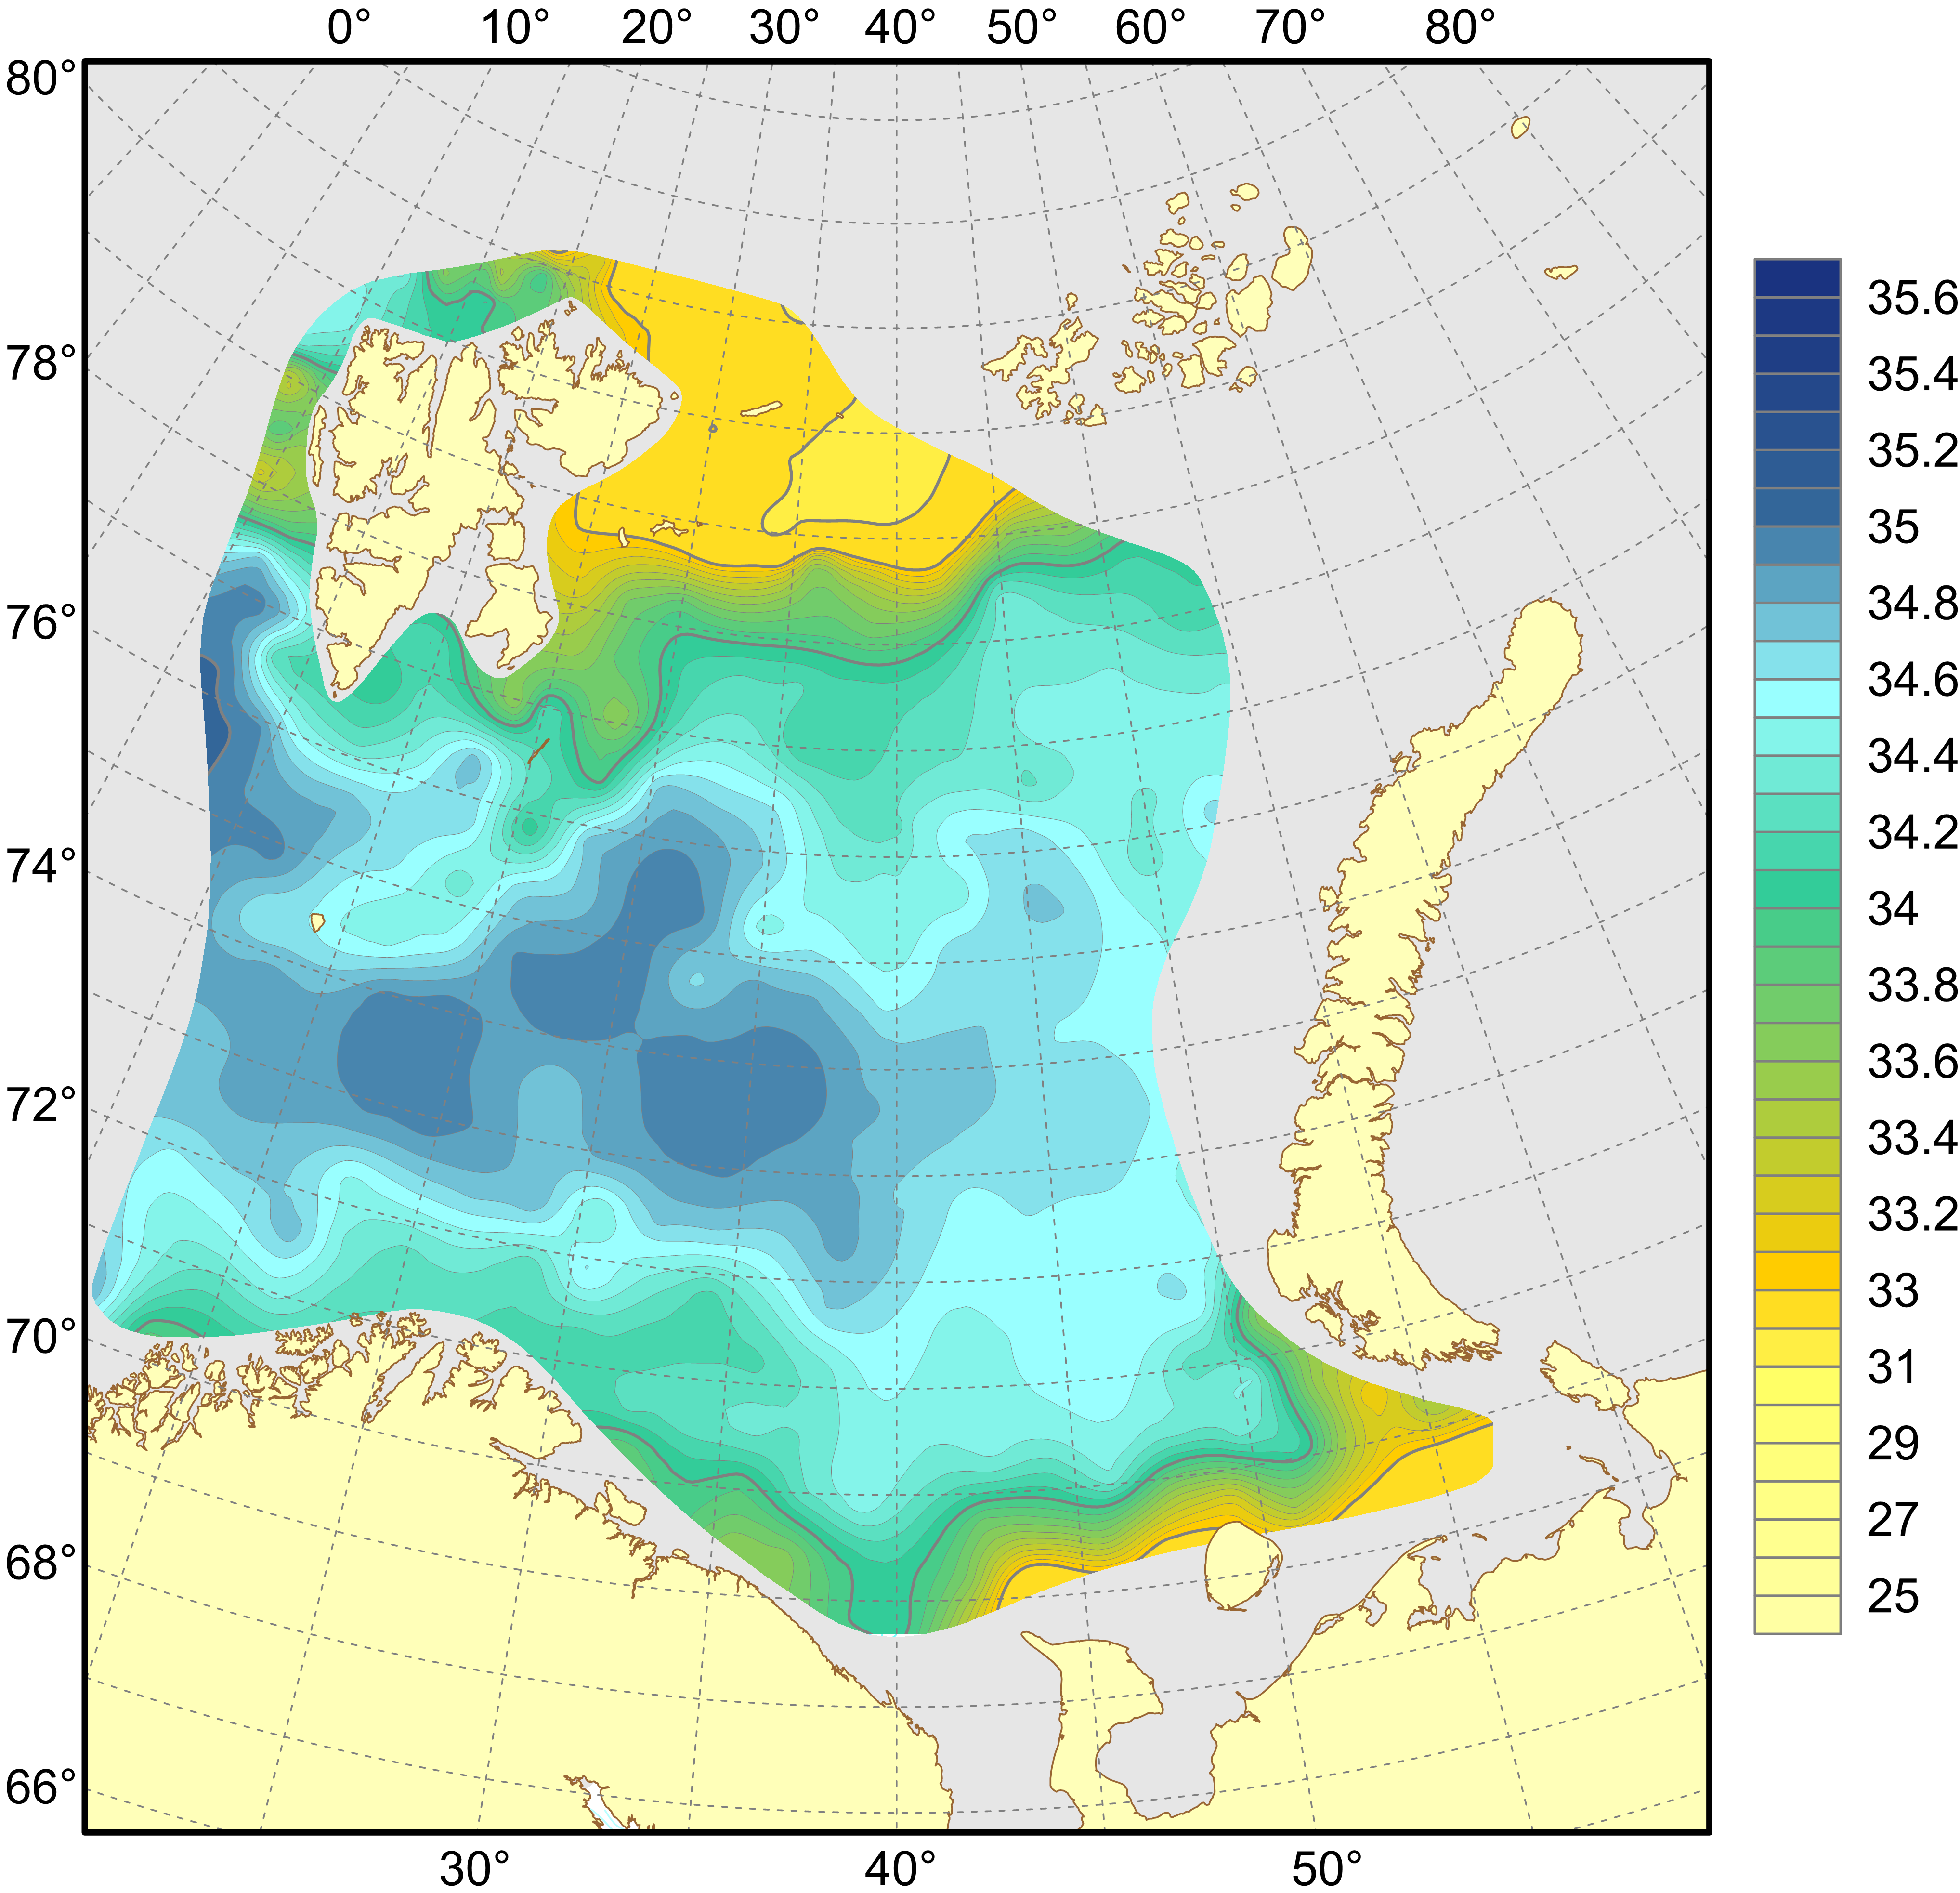
Survey report (Part 2) from the joint Norwegian/Russian Ecosystem Survey in the Barents Sea and the adjacent waters August-October 2023
Figure 4.1.1.2. Distribution of surface salinity, August–September 2023.