Målet med den felles norsk-russiske økosystemtoktet i Barentshavet og tilstøtende farvann, august-oktober (BESS) er å overvåke status og endringer i Barentshavets økosystemet og skaffe data til for bestandsrådgivning og forskning. Toktet har blitt gjennomført hvert år i samarbeid mellom Havforskningsinstituttet (HI) i Norge og VNIROs polaravdeling (PINRO) i Russland siden 2004. Den generelle toktplanen og undersøkelser ble avtalt på det årlige HI-PINRO-møtet i mars 2023. Båtruter og andre tekniske detaljer ble avtalt via korrespondanse mellom toktkoordinatorer. Toktet sikter på å dekke hele Barentshavet. Økosystemstasjonene er fordelt i et regelmessig rutenett (35×35 nautiske mil) og båtrutene følger dette designet med unntak, området rundt Svalbard med ekstra bunntråltrekk for et bedre estimat for bunnfisk og ekstra akustiske transekter for et bedte estimat for loddebestandens størrelse.
Det 20. BESS-toktet ble gjennomført i perioden 10. august til 7. oktober av de norske forskningsfartøyene "Kronprins Haakon", "G.O. Sars" og "Johan Hjort", og det russiske fartøyet "Vilnyus".
Som alltid vil vi takke mannskapet og det vitenskapelige personellet om bord på "Vilnyus", "G.O. Sars", "Kronprins Haakon" og "Johan Hjort" for deres innsats, samt til alle andre som har vært involvert i planleggingen og rapporteringen av BESS 2023.
Dette er andre del av toktrapporten som oppsummerer observasjoner og statusvurderinger basert på tokt dataene. Informasjonen fra BESS 2023 vil bli brukt videre til ulike internasjonale og nasjonale prosjekter, rapporter, vurdering av bestander av fisk og virvelløse dyr, miljøovervåking osv.
The aim of the joint Norwegian/Russian ecosystem survey in the Barents Sea and adjacent waters, August-October (BESS) is to monitor the status and changes of in the Barents Sea ecosystem. The survey has since 2004 been conducted annually in the autumn, as a collaboration between the IMR in Norway and the Polar Branch of VNIRO (PINRO) in Russia. The general survey plan, tasks, and sailings routes are usually agreed at the annual PINRO-IMR Meeting in March, but in 2023, due to external factors making physical meetings between Norwegian and Russian researchers difficult, they were agreed by correspondence. Survey coordinators in 2023 was Dmitry Prozorkevich (PINRO) and Geir Odd Johansen (IMR). No exchange of Russian and Norwegian experts between their respective vessels in 2023. The 21th BESS was carried out during the period from 10th August to 7th October by the Norwegian research vessels “Kronprins Haakon”, “G.O. Sars” and “Johan Hjort”, and the Russian vessels “Vilnyus”. The scientists and technicians taking part in the survey onboard the research vessels are listed in Table 1. As always, we would like to express our sincere gratitude to all the crew and scientific personnel onboard RVs “Vilnyus”, “G.O. Sars”, “Kronprins Haakon” and “Johan Hjort” and for their dedicated work, as well as all the people involved in planning and reporting of BESS 2023. This is a first part of the survey report summarising the observations and status assessments based on the survey data. The information obtained in BESS 2023 will be further used for the implementation of various international and national projects, assessment of fish and invertebrate stocks, environmental monitoring, etc.
The aim of the joint Norwegian/Russian ecosystem survey in the Barents Sea and adjacent waters, August-October (BESS) is to monitor the status and changes of in the Barents Sea ecosystem. The survey has since 2004 been conducted annually in the autumn, as a collaboration between the IMR in Norway and the Polar Branch of VNIRO (PINRO) in Russia. The general survey plan, tasks, and sailings routes are usually agreed at the annual PINRO-IMR Meeting in March, but in 2023, due to external factors making physical meetings between Norwegian and Russian researchers difficult, they were agreed by correspondence. Survey coordinators in 2023 was Dmitry Prozorkevich (PINRO) and Geir Odd Johansen (IMR). No exchange of Russian and Norwegian experts between their respective vessels in 2023. The 21-th BESS was carried out during the period from 10th August to7th October by the Norwegian research vessels “Kronprins Haakon”, “G.O. Sars” and “Johan Hjort”, and the Russian vessels “Vilnyus”. The scientists and technicians taking part in the survey onboard the research vessels are listed in Table 1. As always, we would like to express our sincere gratitude to all the crew and scientific personnel onboard RVs “Vilnyus”, “G.O. Sars”, “Kronprins Haakon” and “Johan Hjort” and for their dedicated work, as well as all the people involved in planning and reporting of BESS 2023. This is a second part of the survey report summarising the observations and status assessments based on the survey data. The information obtained in BESS 2023 will be further used for the implementation of various international and national projects, assessment of fish and invertebrate stocks, environmental monitoring, etc.
Author(s):
Dmitry Prozorkevich (PINRO-VNIRO) and Elena Eriksen
(IMR)
Figures by S. Karlson and E. Bagøien
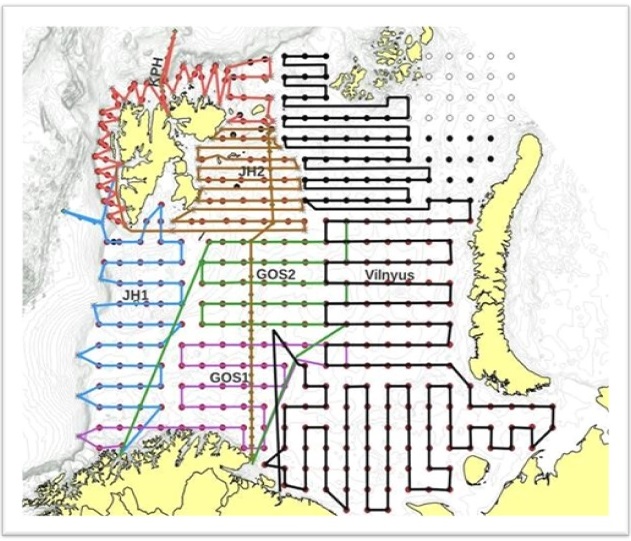
BESS aims to cover the entire ice-free area of the Barents Sea and, from south to north. The ecosystem stations are distributed on a regular 35×35 nautical mile regular grid with the exception of the slope around Svalbard/Spitsbergen, with additional bottom trawl hauls for demersal fish indices estimation and additional acoustic transects east for Svalbard/Spitsbergen for the capelin stock size estimation. The planned vessel tracks for BESS 2023 are given in Figure 2.1.
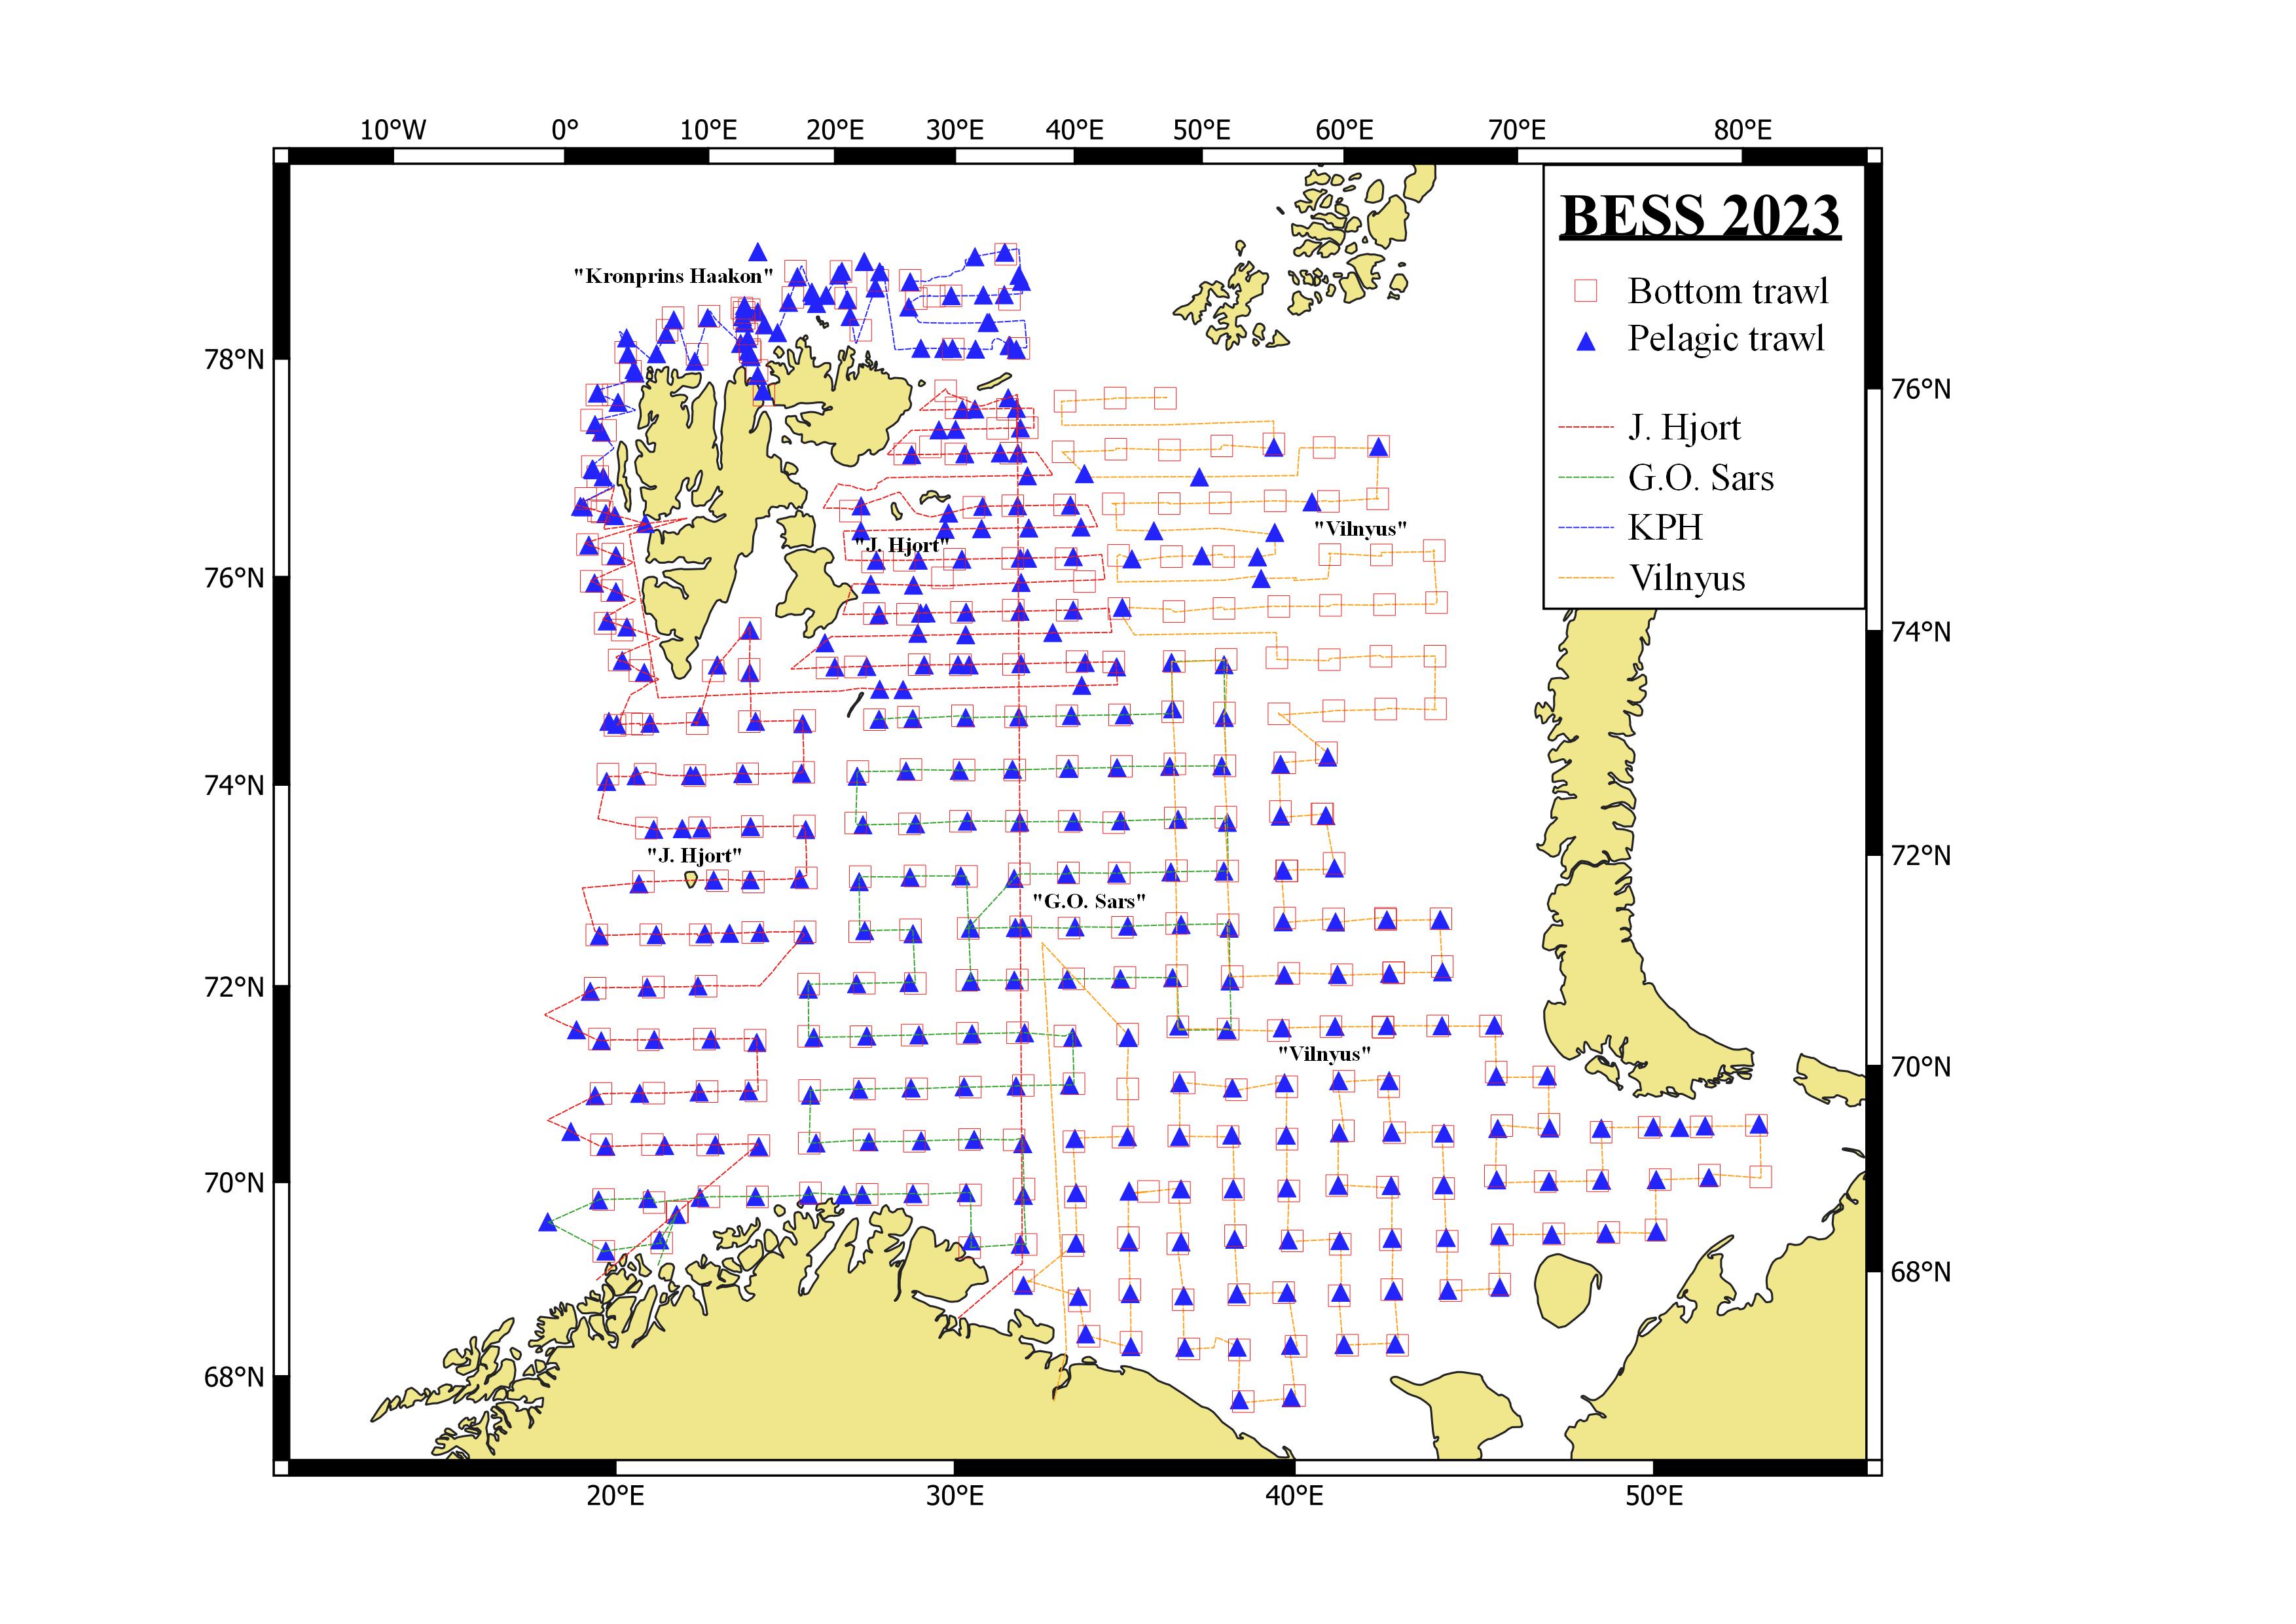
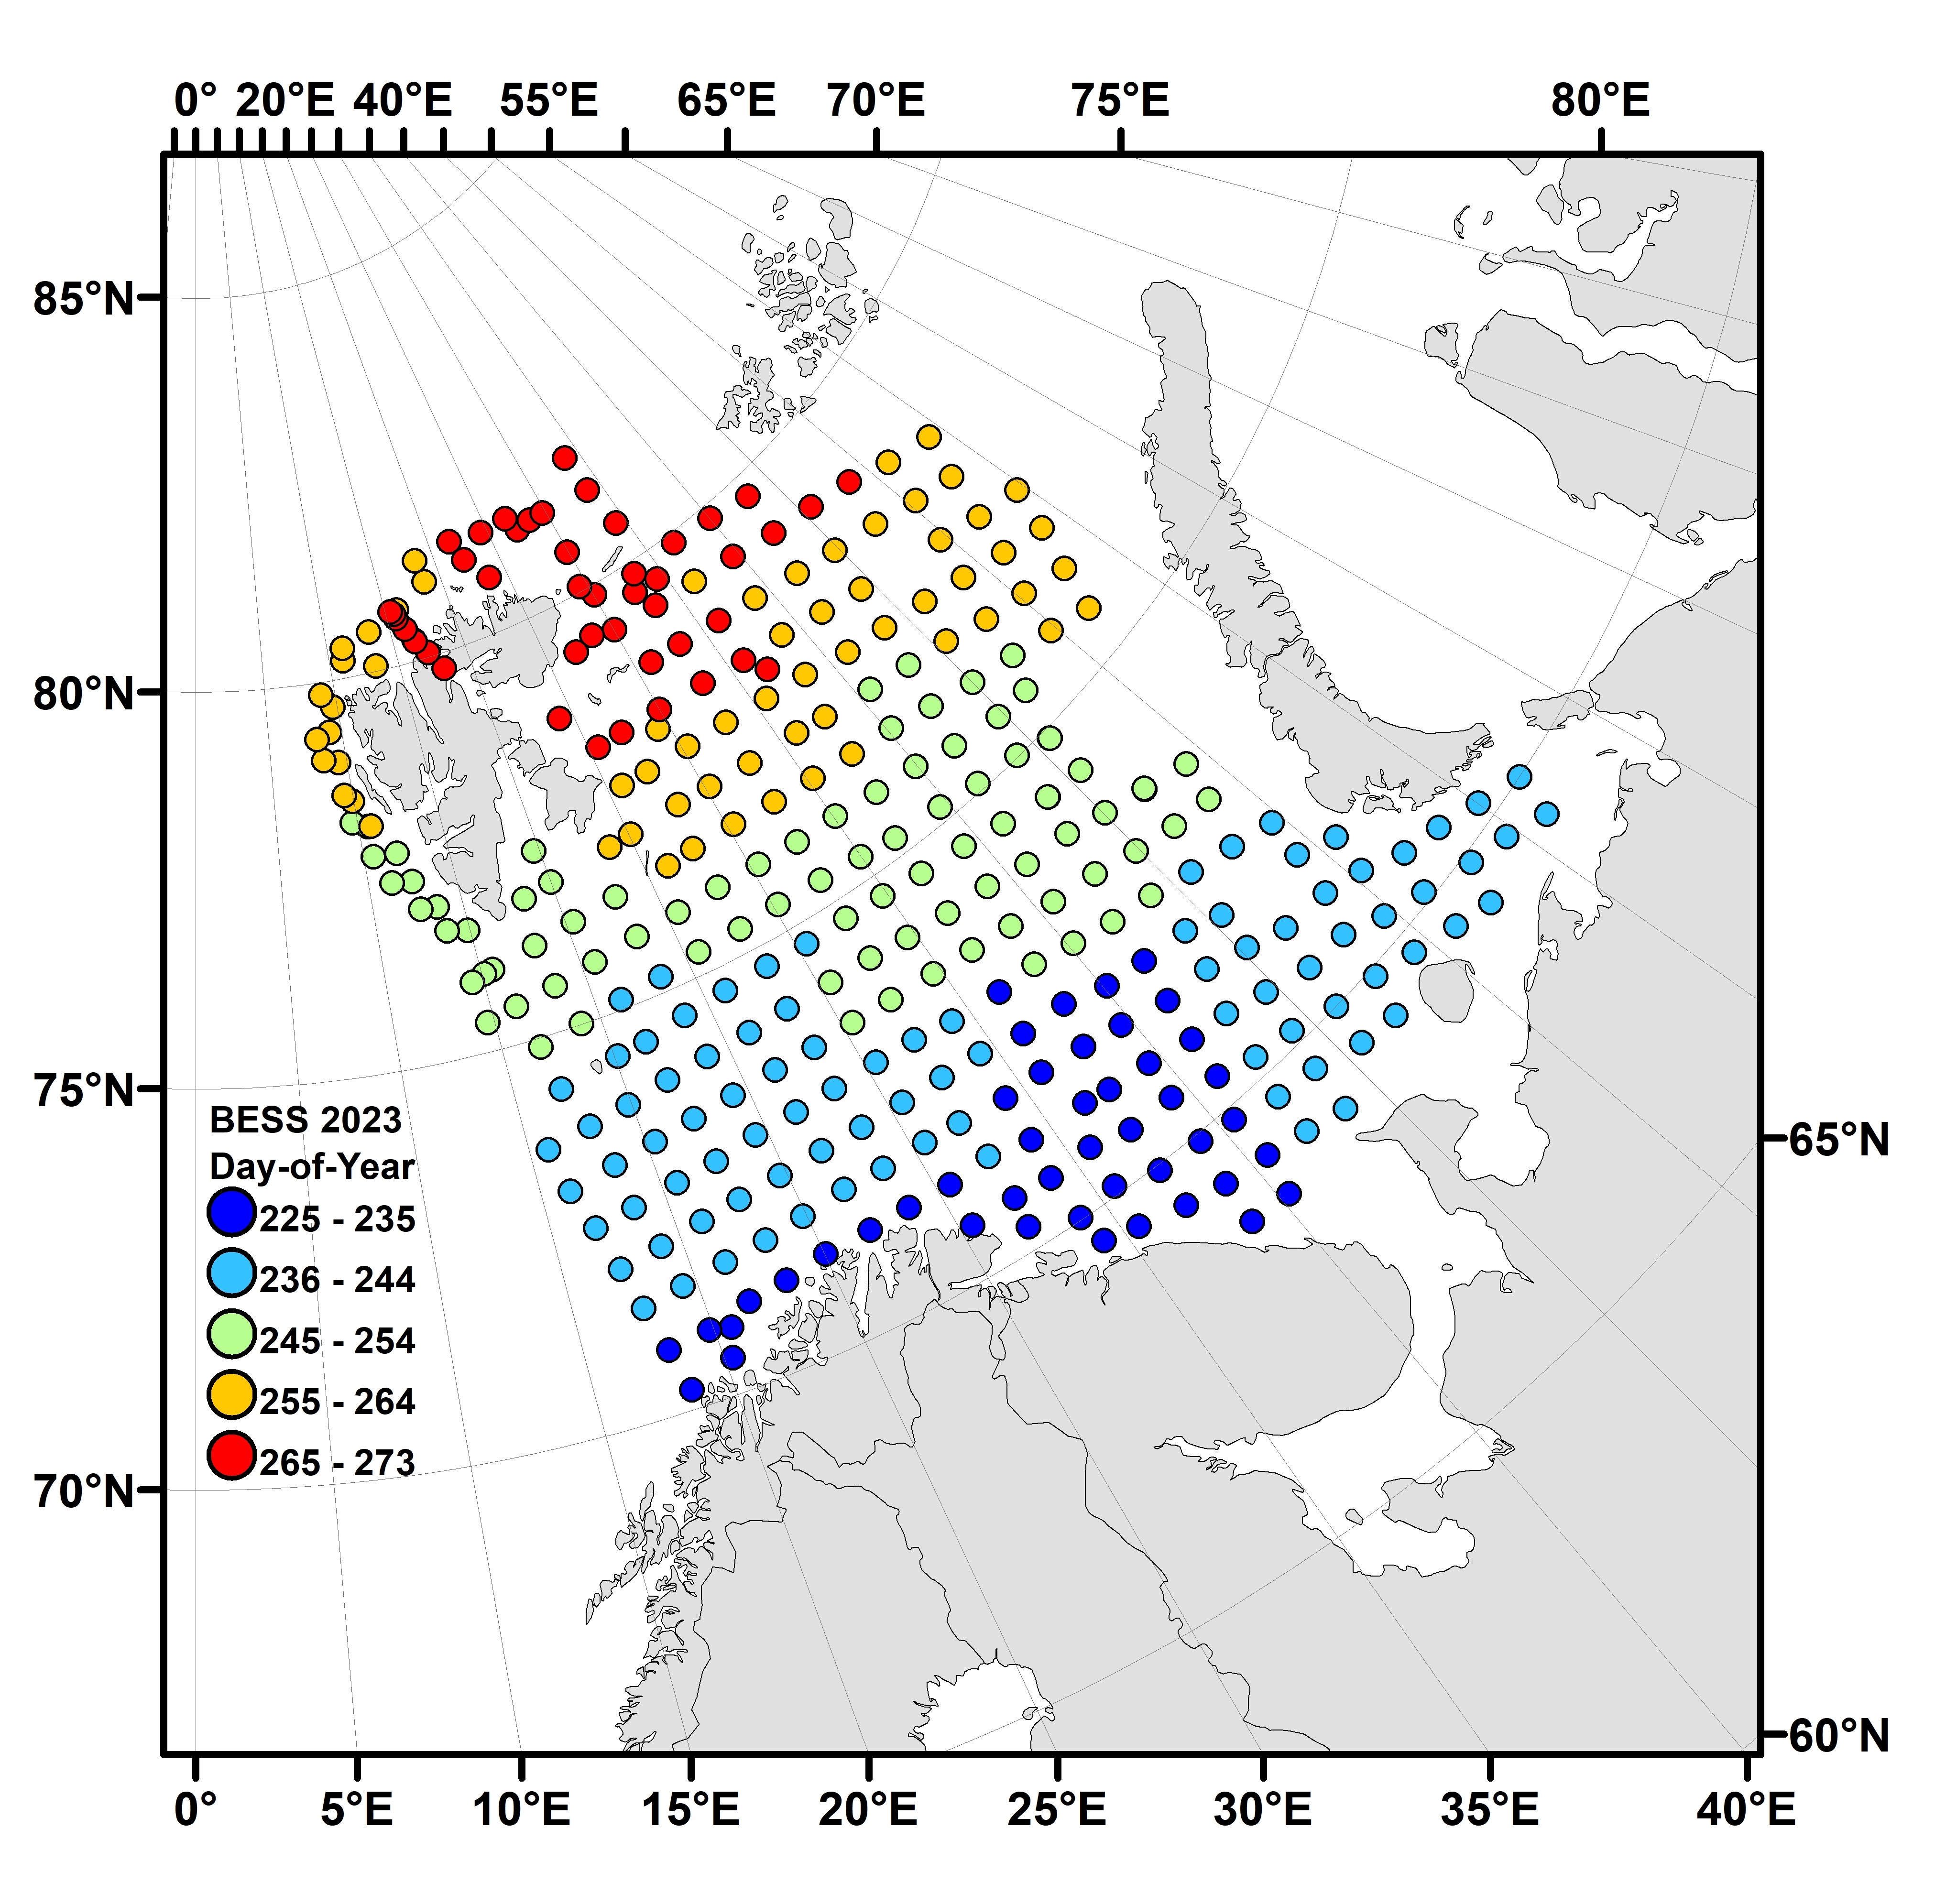
According to the plan, BESS 2023 was largely implemented. The realized tracks of the research vessel with the sampling taken are shown in Figures 2.2 and 2.3. The execution of BESS 2023 did not reveal any major changes or irregularities. The Russian vessel did not have enough allocated vessel-days to cover the region to east of Franz Josef Land and in the north-eastern part of the survey area (Figures 2.2 and 2.3). A relatively large part of the Russian EEZ to the west of the Novaya Zemlya was closed for fishing at the request of the Russian Ministry of Defence, so survey area along the archipelago coast was not fully covered (Figure 2.2). For the same reason, some of the coverage of Loophole has been moved from G.O. Sars part 1 to G.O. Sars part 2. A decrease in the number of standard pelagic trawls and reduced area coverage west of the Novaya Zemlya may lead to some underestimation 0-group of cod, juvenile Greenland halibut numbers including 0-group and the significant underestimation the polar cod stock size. BESS 2023 was largely conducted according to the planned time schedule. In recent years, the number of ship days for a Russian vessel has been reduced with 10 %., while additional tasks (such as microplastic samples) have been added, that inevitably leading to a reduction in survey area coverage. The planned schedule for BESS 2023 was 148 days (98NOR+50RUS), while the effective vessel days (time between first and last sample in the vessel logs) was 129 days (83NOR+46RUS). The difference between the two is as expected, as vessels need time for sailing to and from the harbor and preparation before sampling. The temporal and spatial progression during the survey was good (Figure 2.4). Weather conditions were very good for most of the period. Note that in reports from earlier years, only the planned schedule is reported.
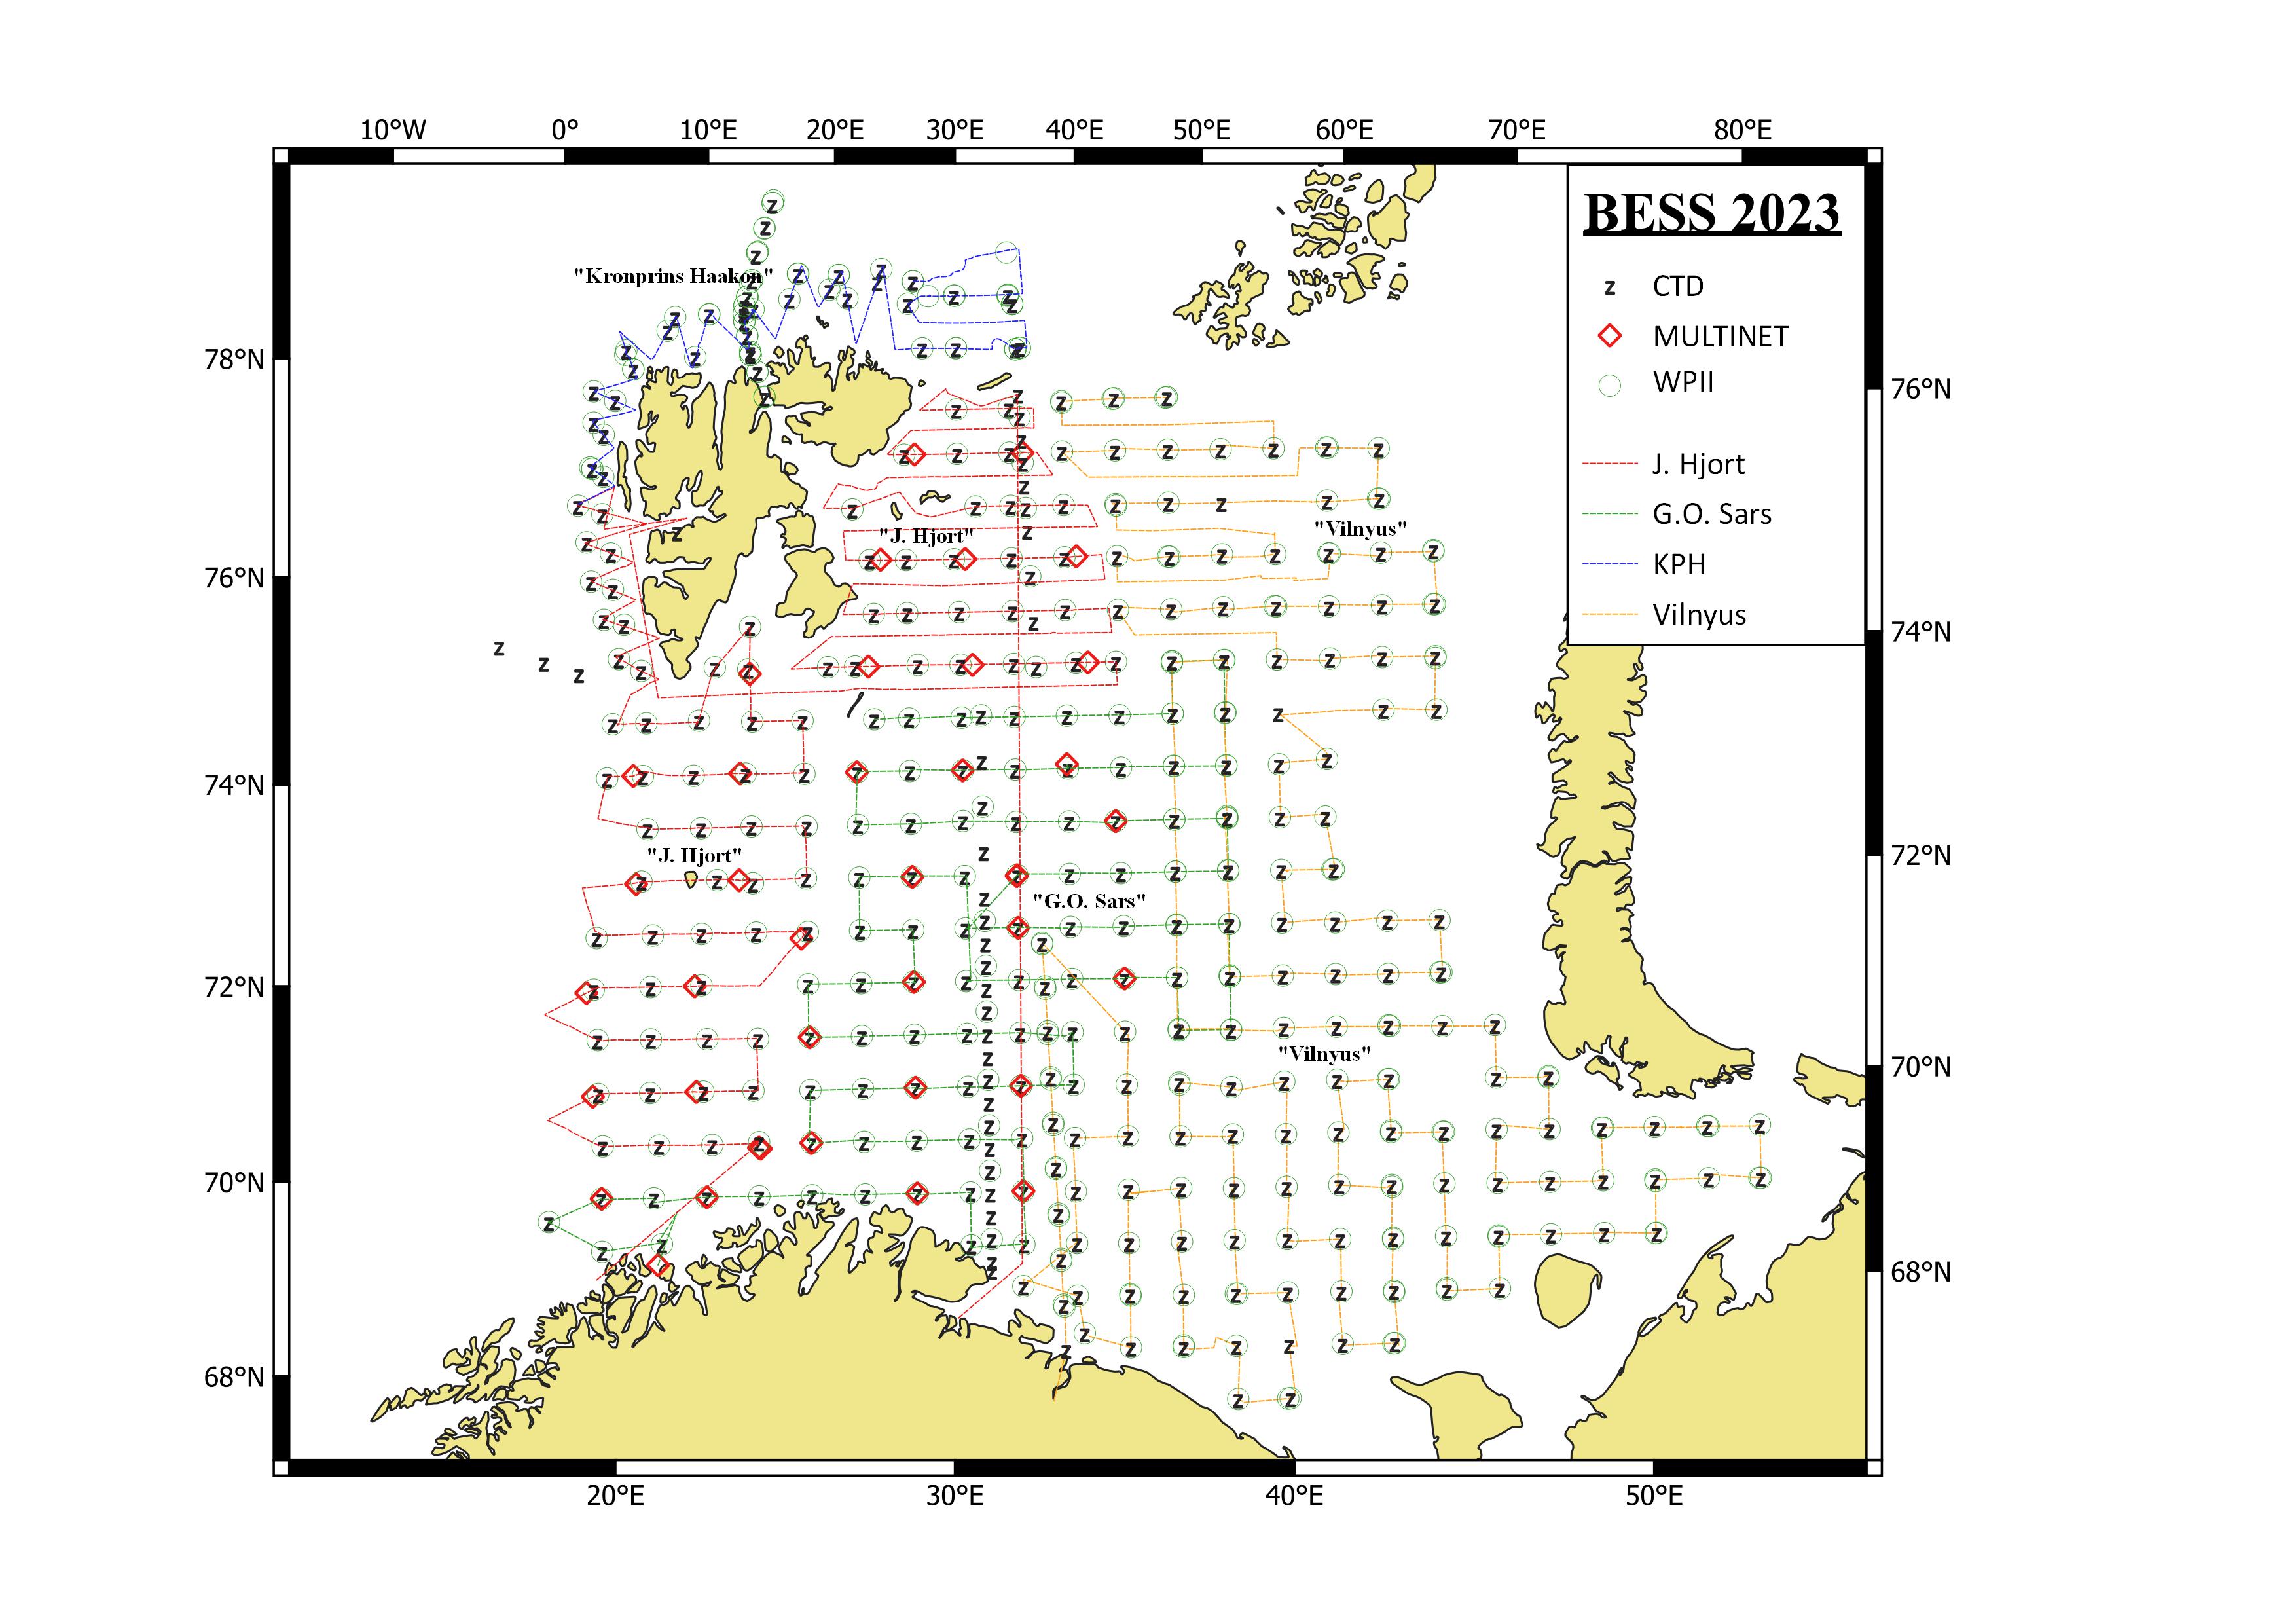
The ecosystem survey in 2023 was similar to previous years, covering most ecosystem components. Norwegian vessels in addition, the standard oceanography sections “Vardø-Nord”, “Sørkapp-Vest”, and “Hinlopen” were taken by the Norwegian survey area, and the “Kola” (twice) were taken by the Russian survey area (Figure 2.3). During the BESS, in totally 362 pelagic hauls and 337 demersal were taken.
Figure 2.1. BESS 2023, planned survey map with ecosystem stations and vessel tracks.Figure 2.2 BESS 2023, realized vessel tracks with pelagic and bottom trawl sampling stations, note that some trawl stations are taken in addition to the regular ecosystem stations.Figure 2.3 BESS 2023, realized vessel tracks with hydrography and plankton samples at ecosystem stations.Figure 2.4. Progression of BESS 2023 in space and time. Points represent samples taken at ecosystem stations during the survey. The point’s colour indicates the number of Julian days between the first and last day of the survey. The colours scale from blue (early in the survey) to red (late in the survey).
2.1. Sampling methods
In 2023, compared to 2022, there were no changes in sampling gear. Manta trawl was included as standard equipment for monitoring microplastics at BESS in 2022 and was also used in 2023. 47 samples were collected on Russian vessel and 25 on board Norwegian vessels. A new length stratified individual sampling of haddock, consisting of two fish taken for each 5 cm group, was started in 2022 and continued in 2023.
Plankton stations were carried out within the entire survey water area with sampling in the bottom-0 m layer. On the Kola oceanography section, plankton sampling collected separate for the layers: bottom-0 m, 100-0 m and 50-0 m.
The survey sampling manuals can be obtained by contacting the survey coordinators.
These manuals include methodological and technical descriptions of equipment, the trawling and capture procedures by the sampling tools, sampling and registration of the catch in the lab, and the methods that are used for calculating the abundance and biomass of the biota.
Author(s):
Dmitry Prozorcevich (PINRO-VNIRO) and Elena Eriksen
(IMR)
3.1 Databases
A wide variety of data are collected during the ecosystem surveys. All data collected during the BESS are quality controlled and verified by experts Herdis Langøy Mørk and Elena Eriksen (IMR) and Tatyana Prokhorova (PINRO) during and after the survey. The data are stored in IMR and PINRO national databases, with different formats. However, the data are exchanged so that both sides have access to each other’s data and use equal joint data.
3.2 Data application
The BESS aimed to cover the whole Barents Sea ecosystem geographically and provide survey data for commercial fish and shellfish stock estimation. Stock estimation is particularly important for capelin, because capelin TAC is based on the survey result, and the Norwegian-Russian Fishery Commission determines TAC immediately after the survey. In addition, a broad spectrum of physical variables, ecosystem components and pollution are monitored and reported. The survey data will be used by each party for various purposes within the framework of national and international programs.
This survey report is based on joint data and contains the main results of the monitoring. The survey report will come in two parts and will be published in the IMR/PINRO Joint Report series.
All reports from BESS from 2004 until the latest are available at this web site: https://imr.brage.unit.no/imr-xmlui/handle/11250/2658167. This report is published in the IMR digital report series IMR-PINRO.
3.3 Time series of distribution maps
The redesigned IMR web site for the joint Norwegian/Russian Barents Sea Ecosystem Surveys is still not finished. The maps from this report series are to be made public in this map site when ready.
Author(s):
Alexander Trofimov (PINRO-VNIRO), Randi Ingvaldsen
, Bjørn Einar Grøsvik
(IMR), Tatyana Prokhorova (PINRO-VNIRO), Roman Klepikovskiy (PINRO-VNIRO) and Pavel Krivosheya (PINRO-VNIRO)
4.1 Hydrography
Text by A. Trofimov and R. Ingvaldsen
Figures by A. Trofimov
4.1.1 Geographic variation
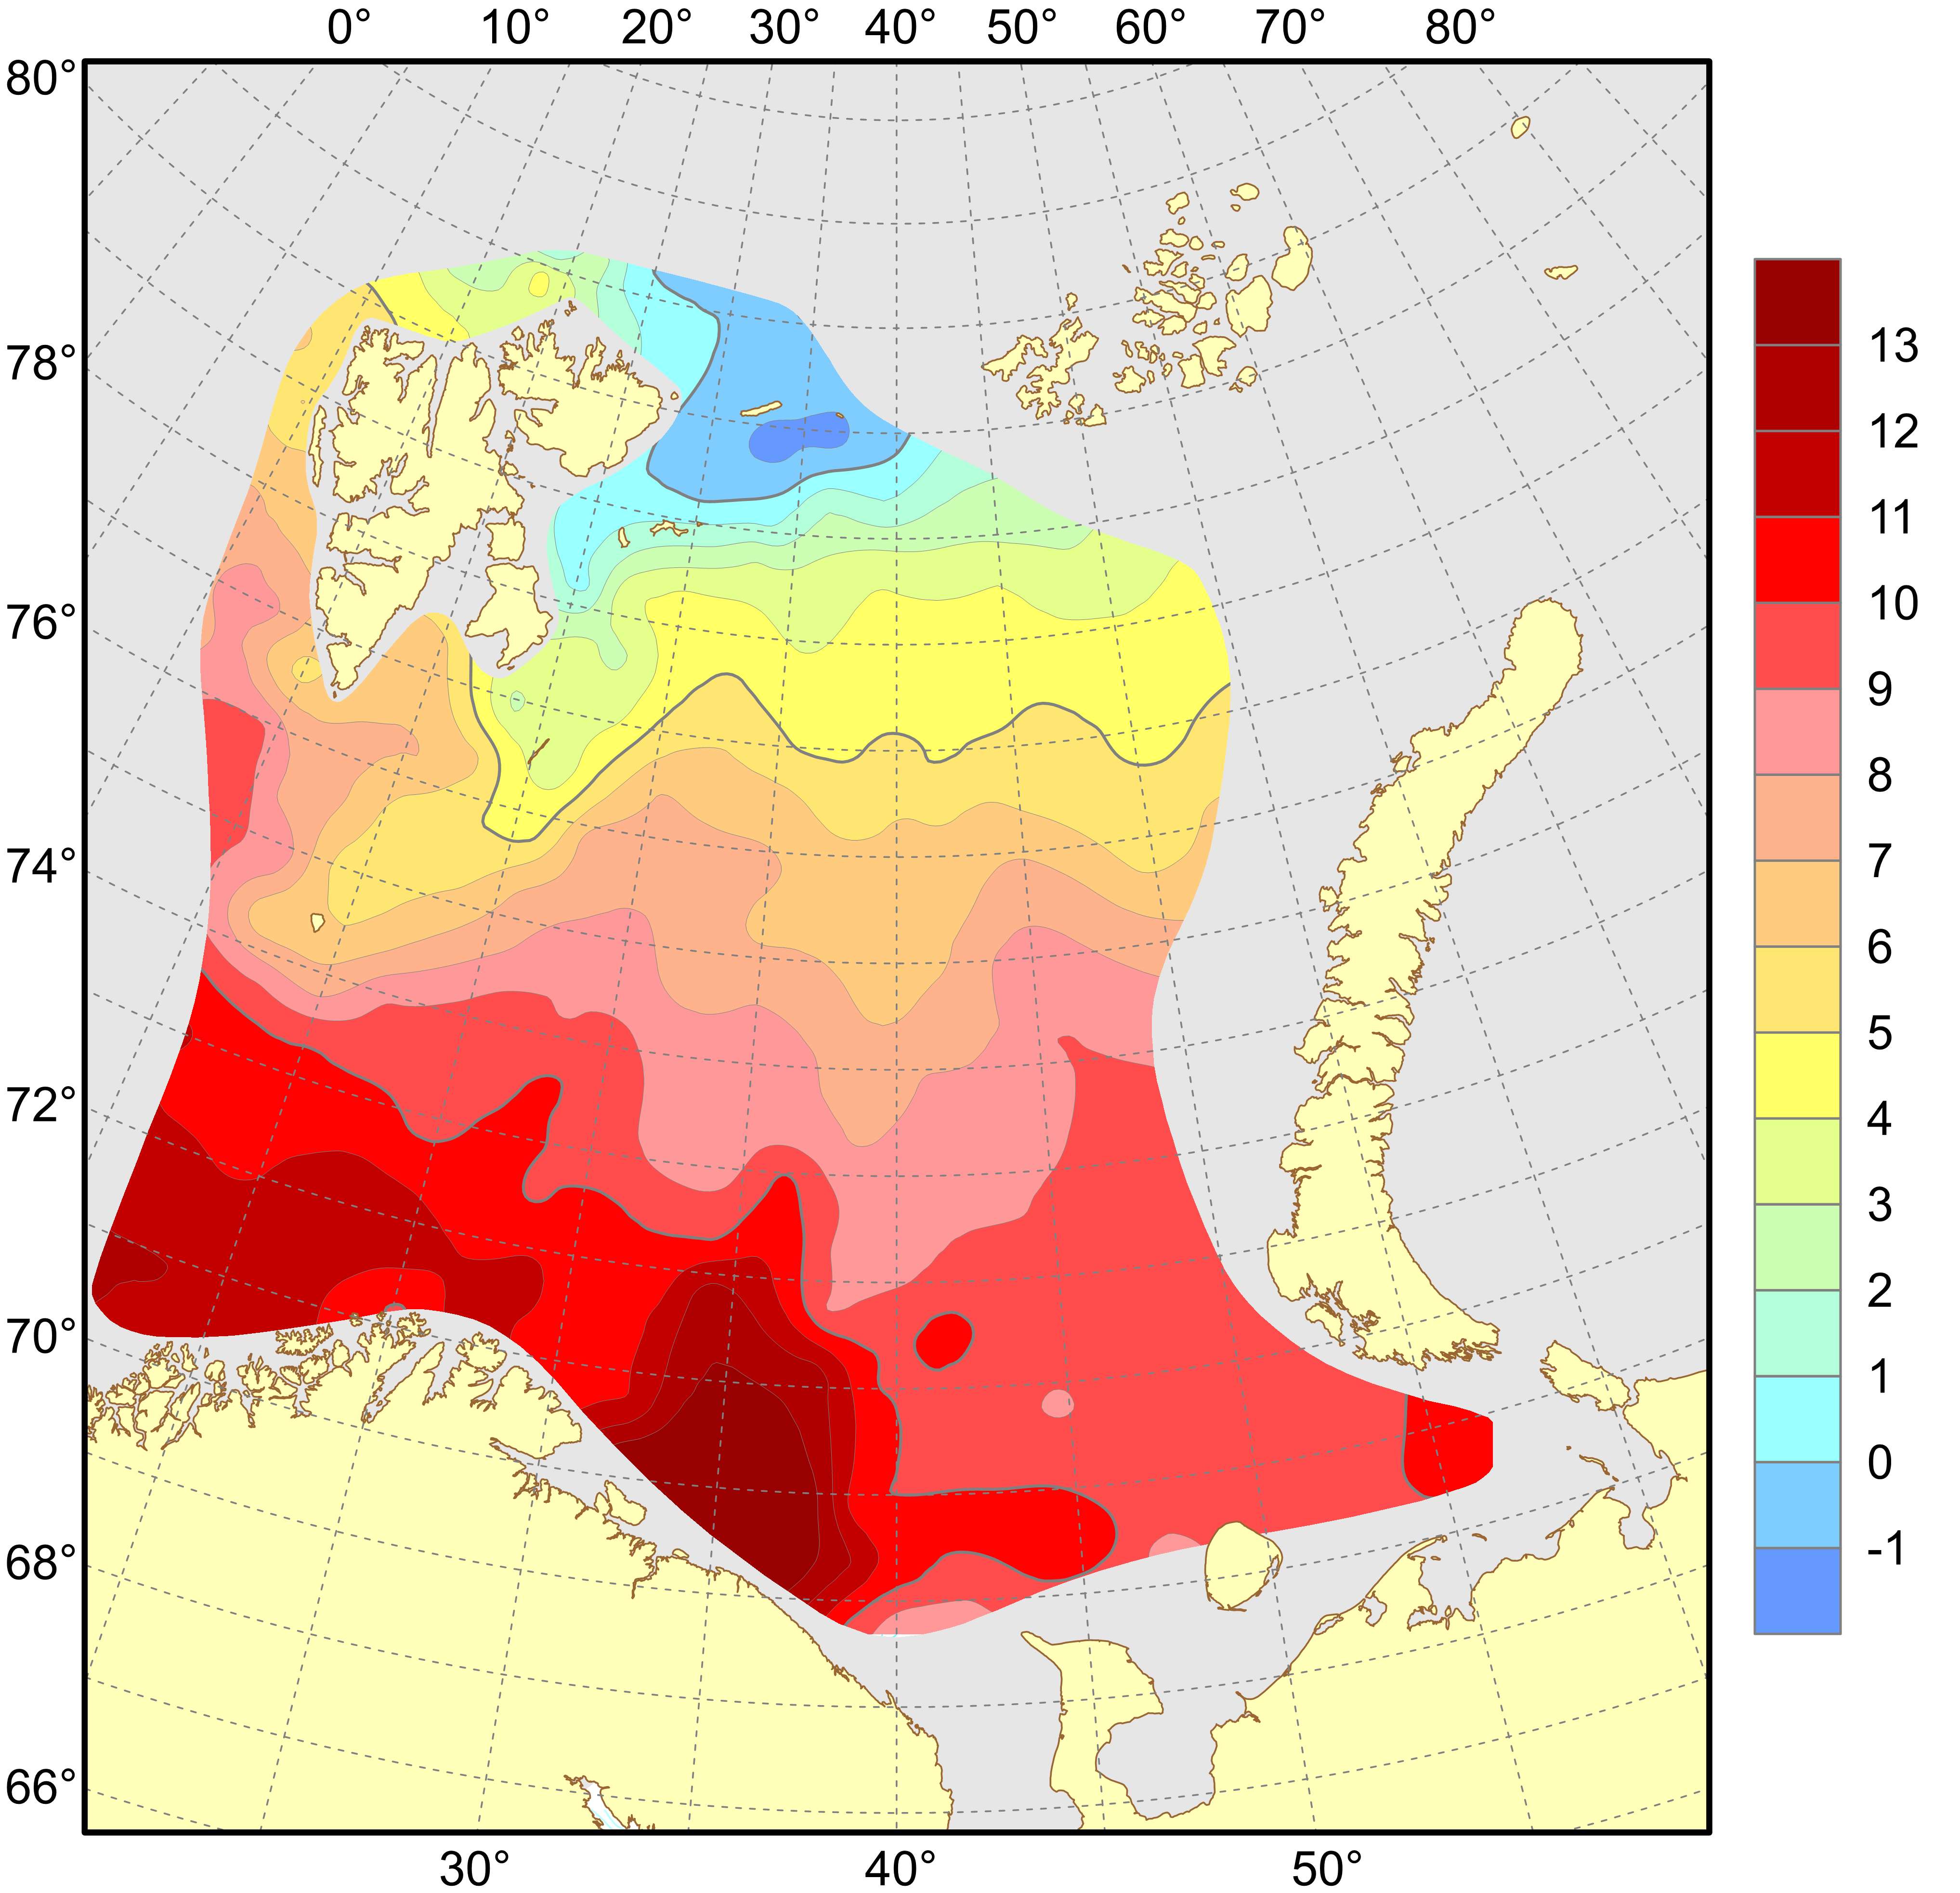
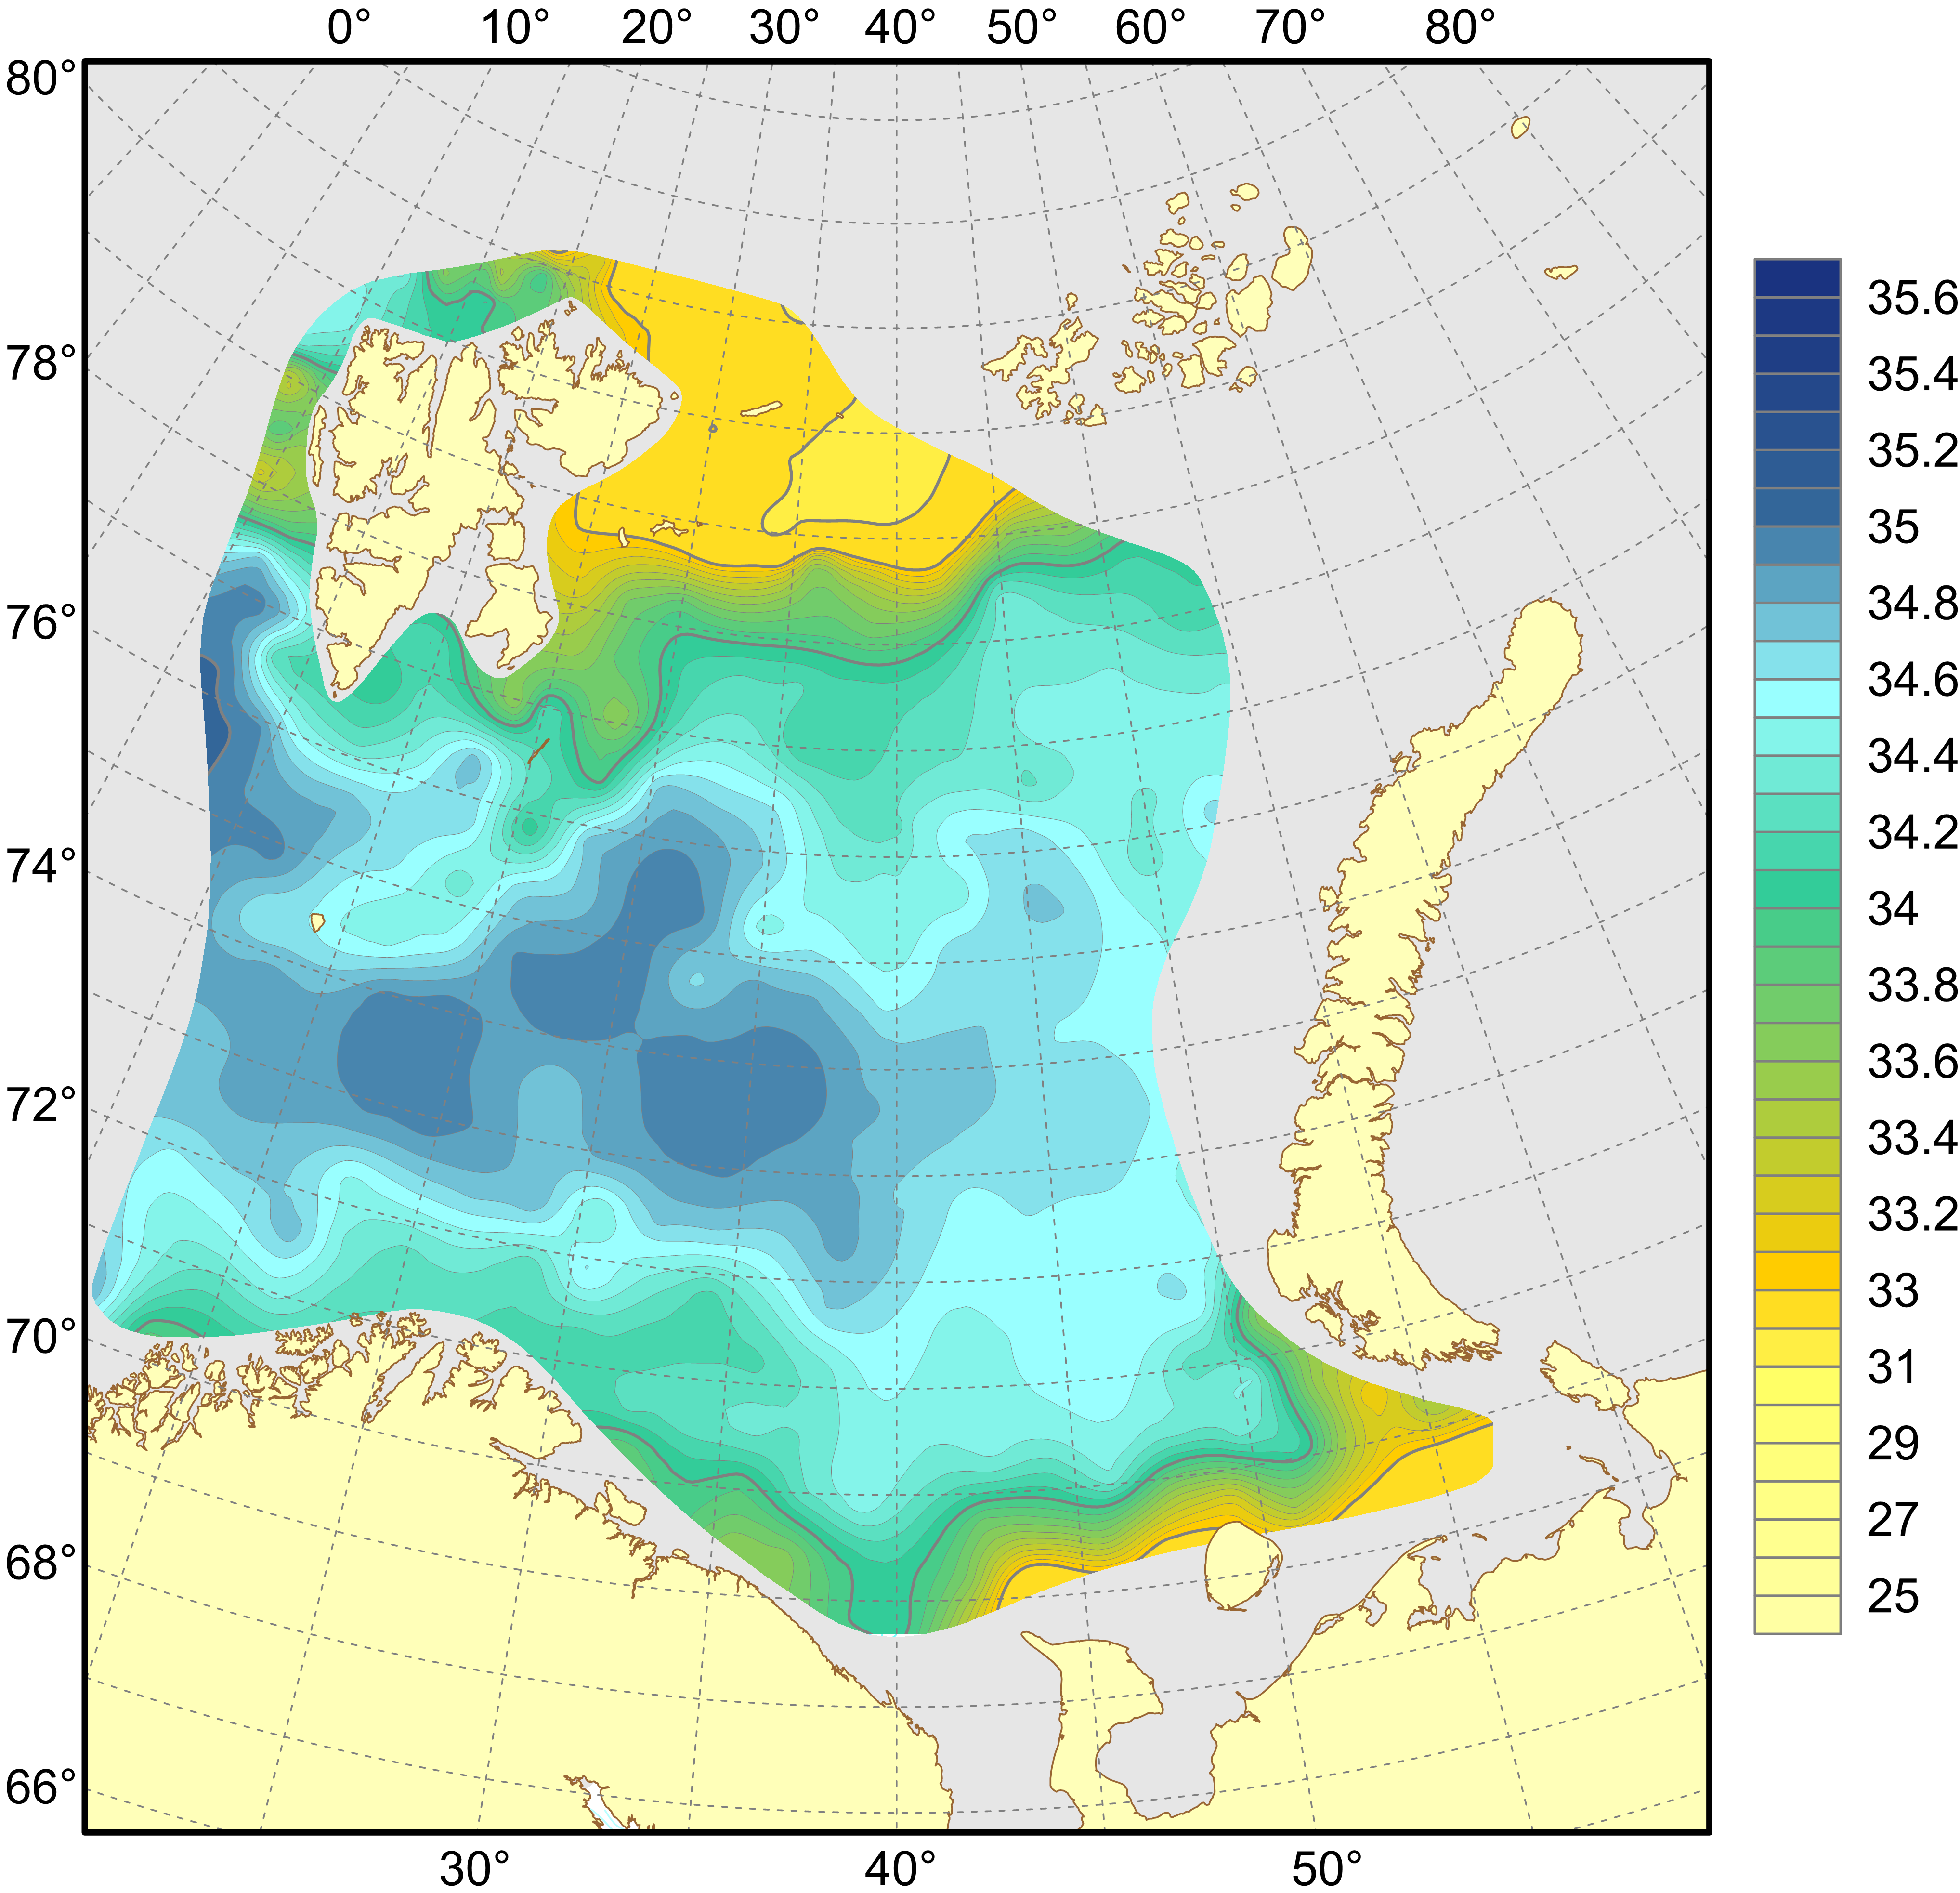
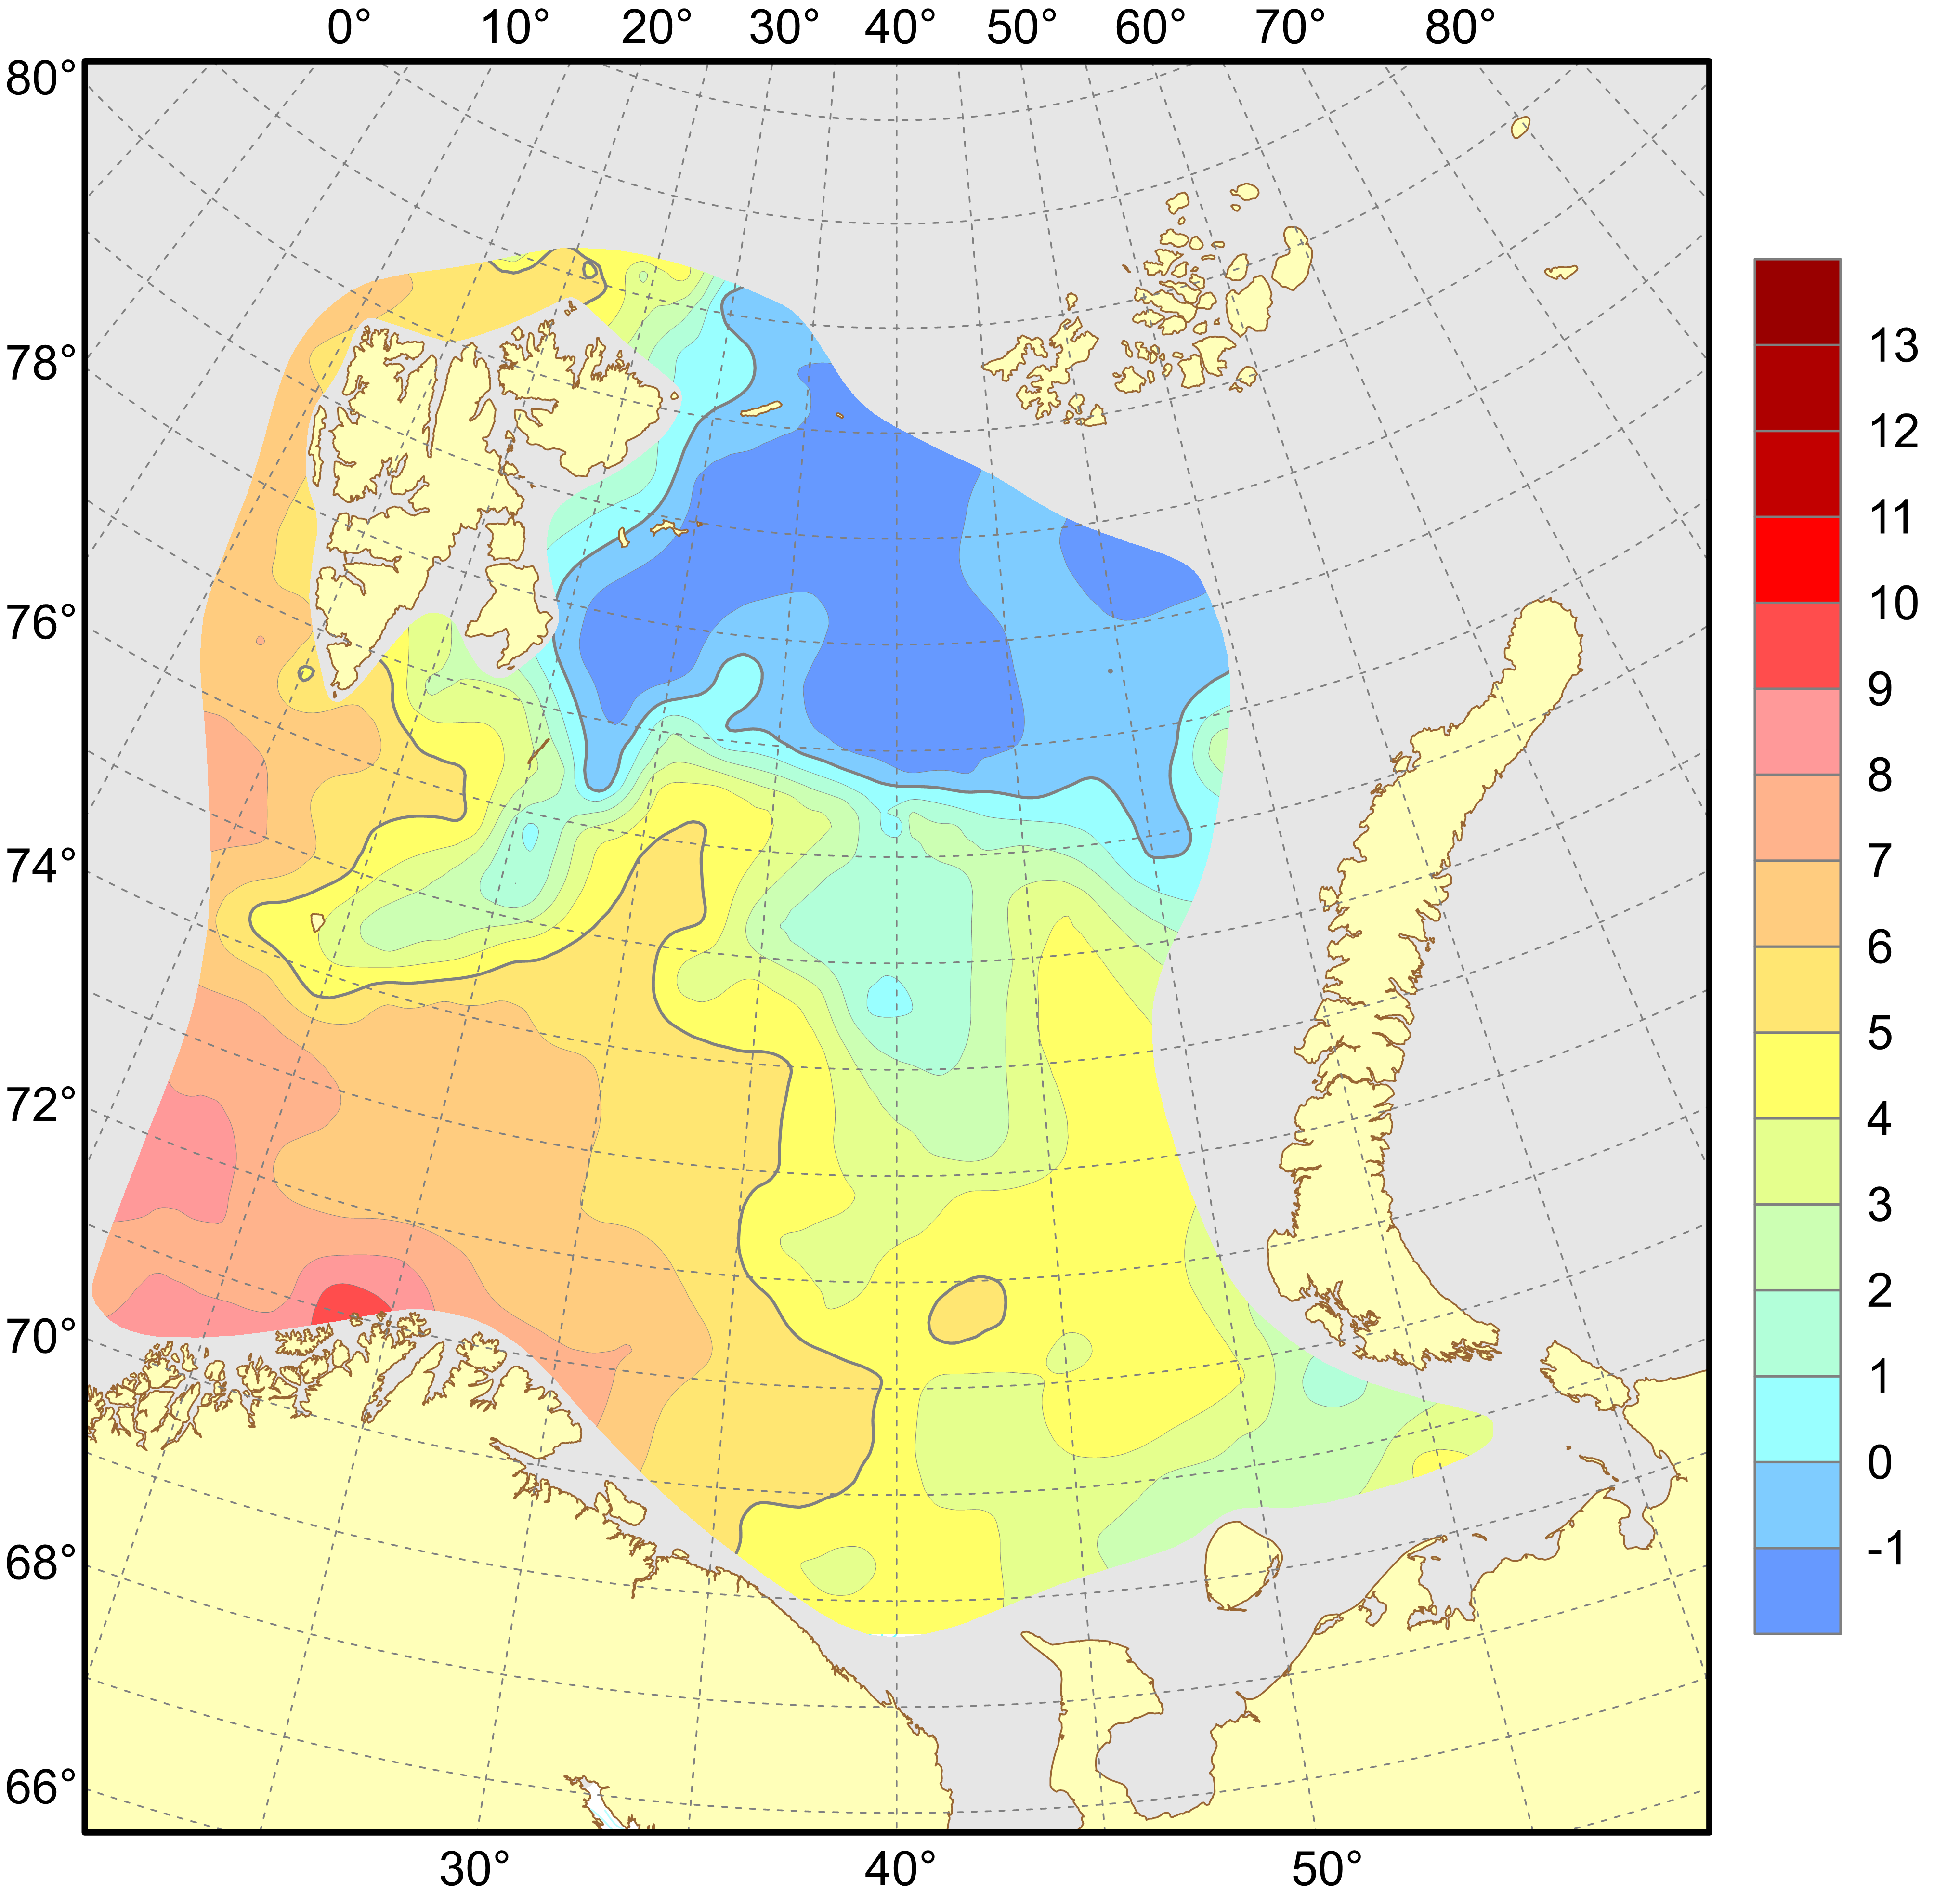
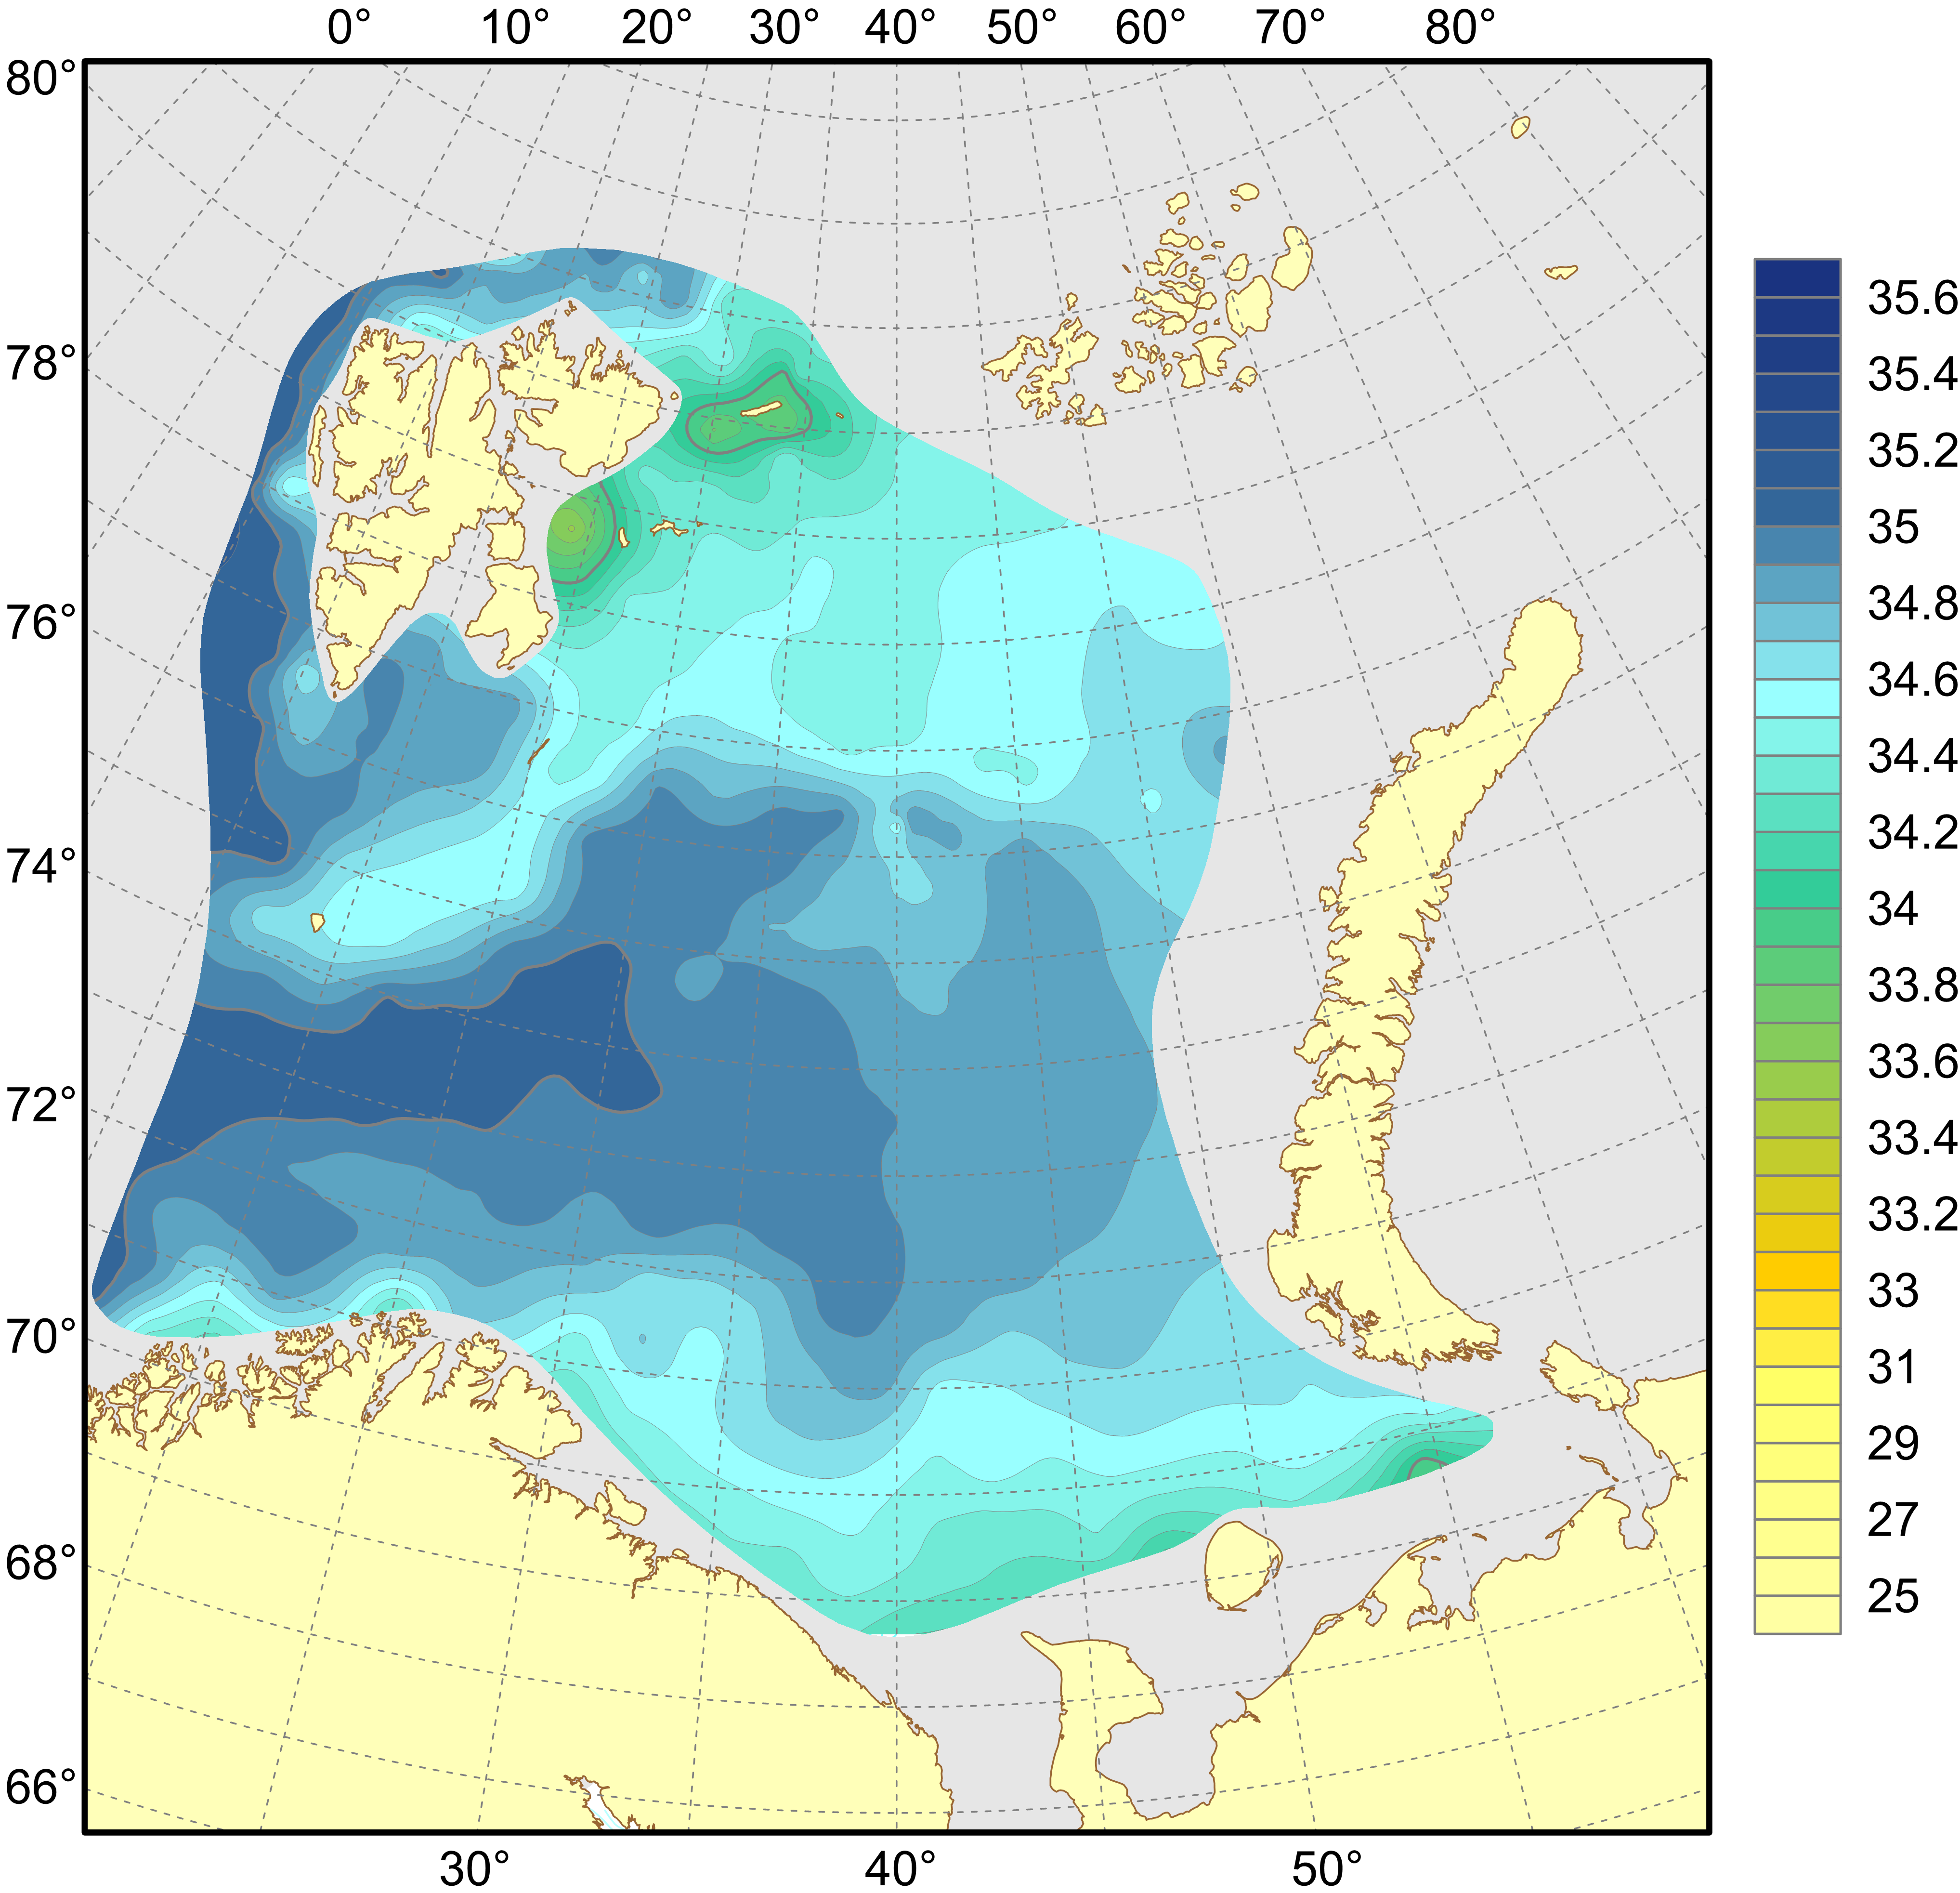
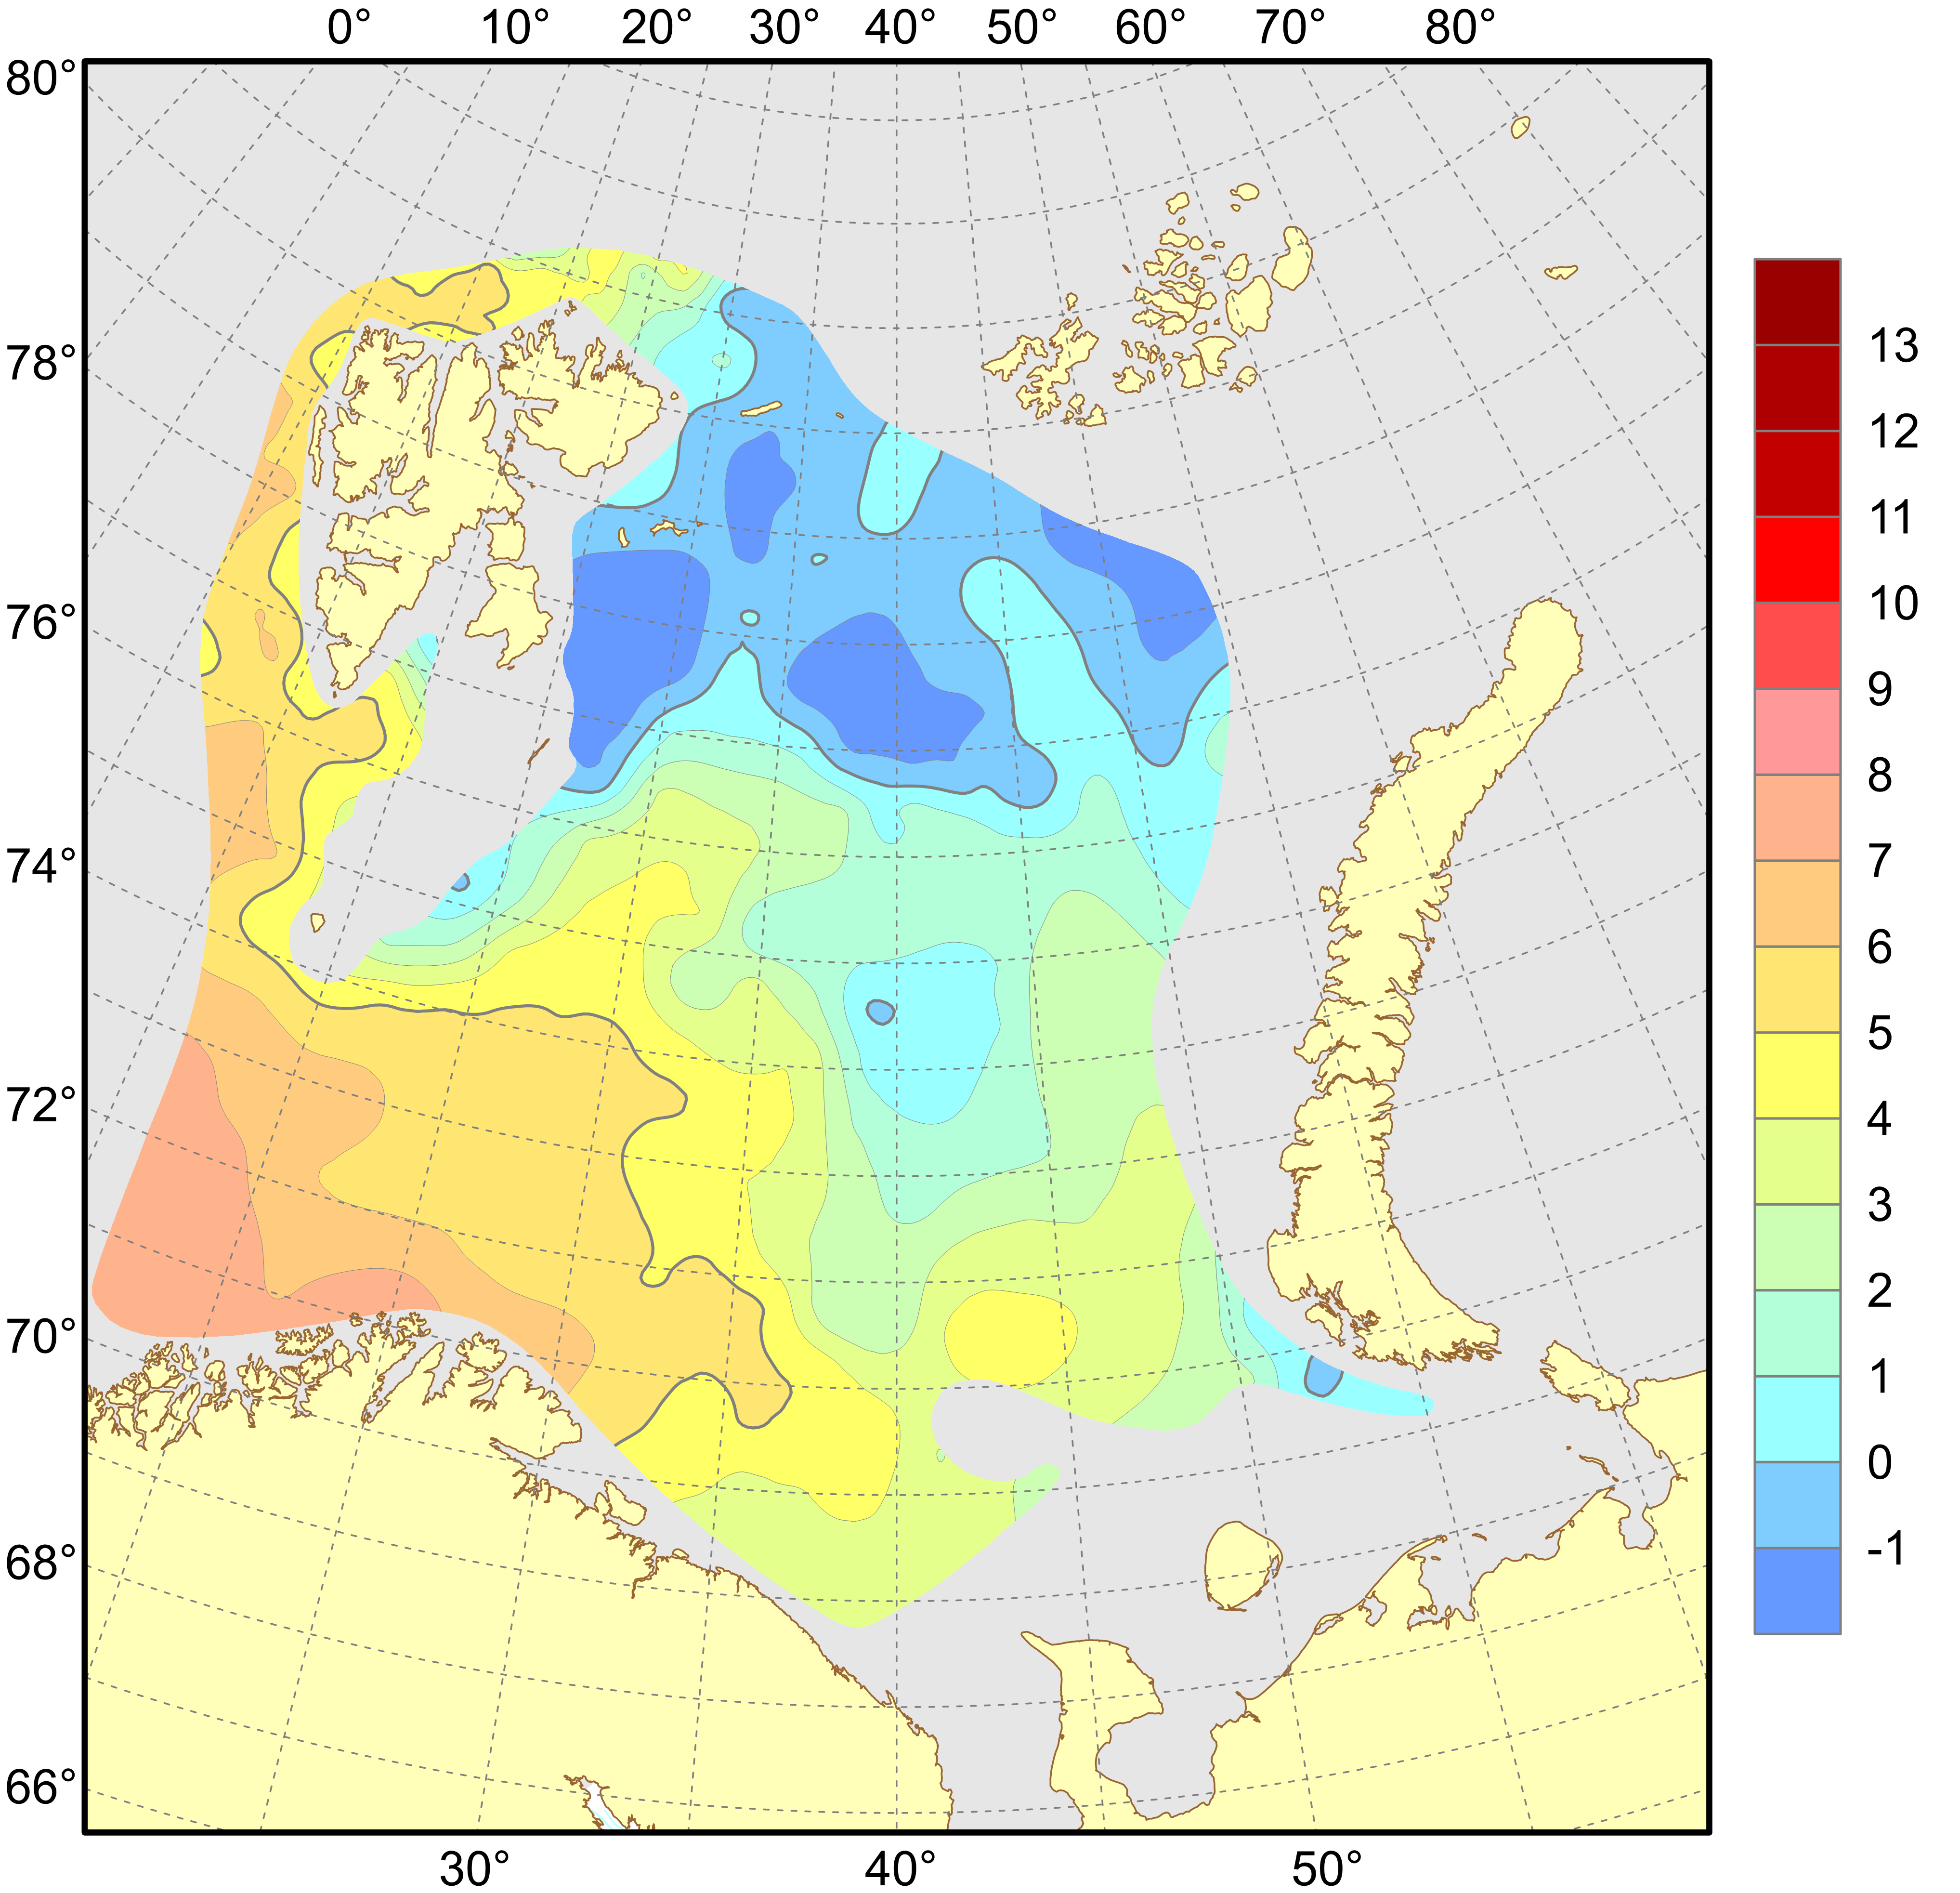
Horizontal distributions of temperature and salinity are shown for depths of 0, 50, 100 m and near the bottom in Figs 4.1.1.1–4.1.1.8, and anomalies of temperature and salinity at the surface and near the bottom are presented in Figs 4.1.1.9–4.1.1.12. The anomalies have been calculated using the long-term means for the period 1991–2020.
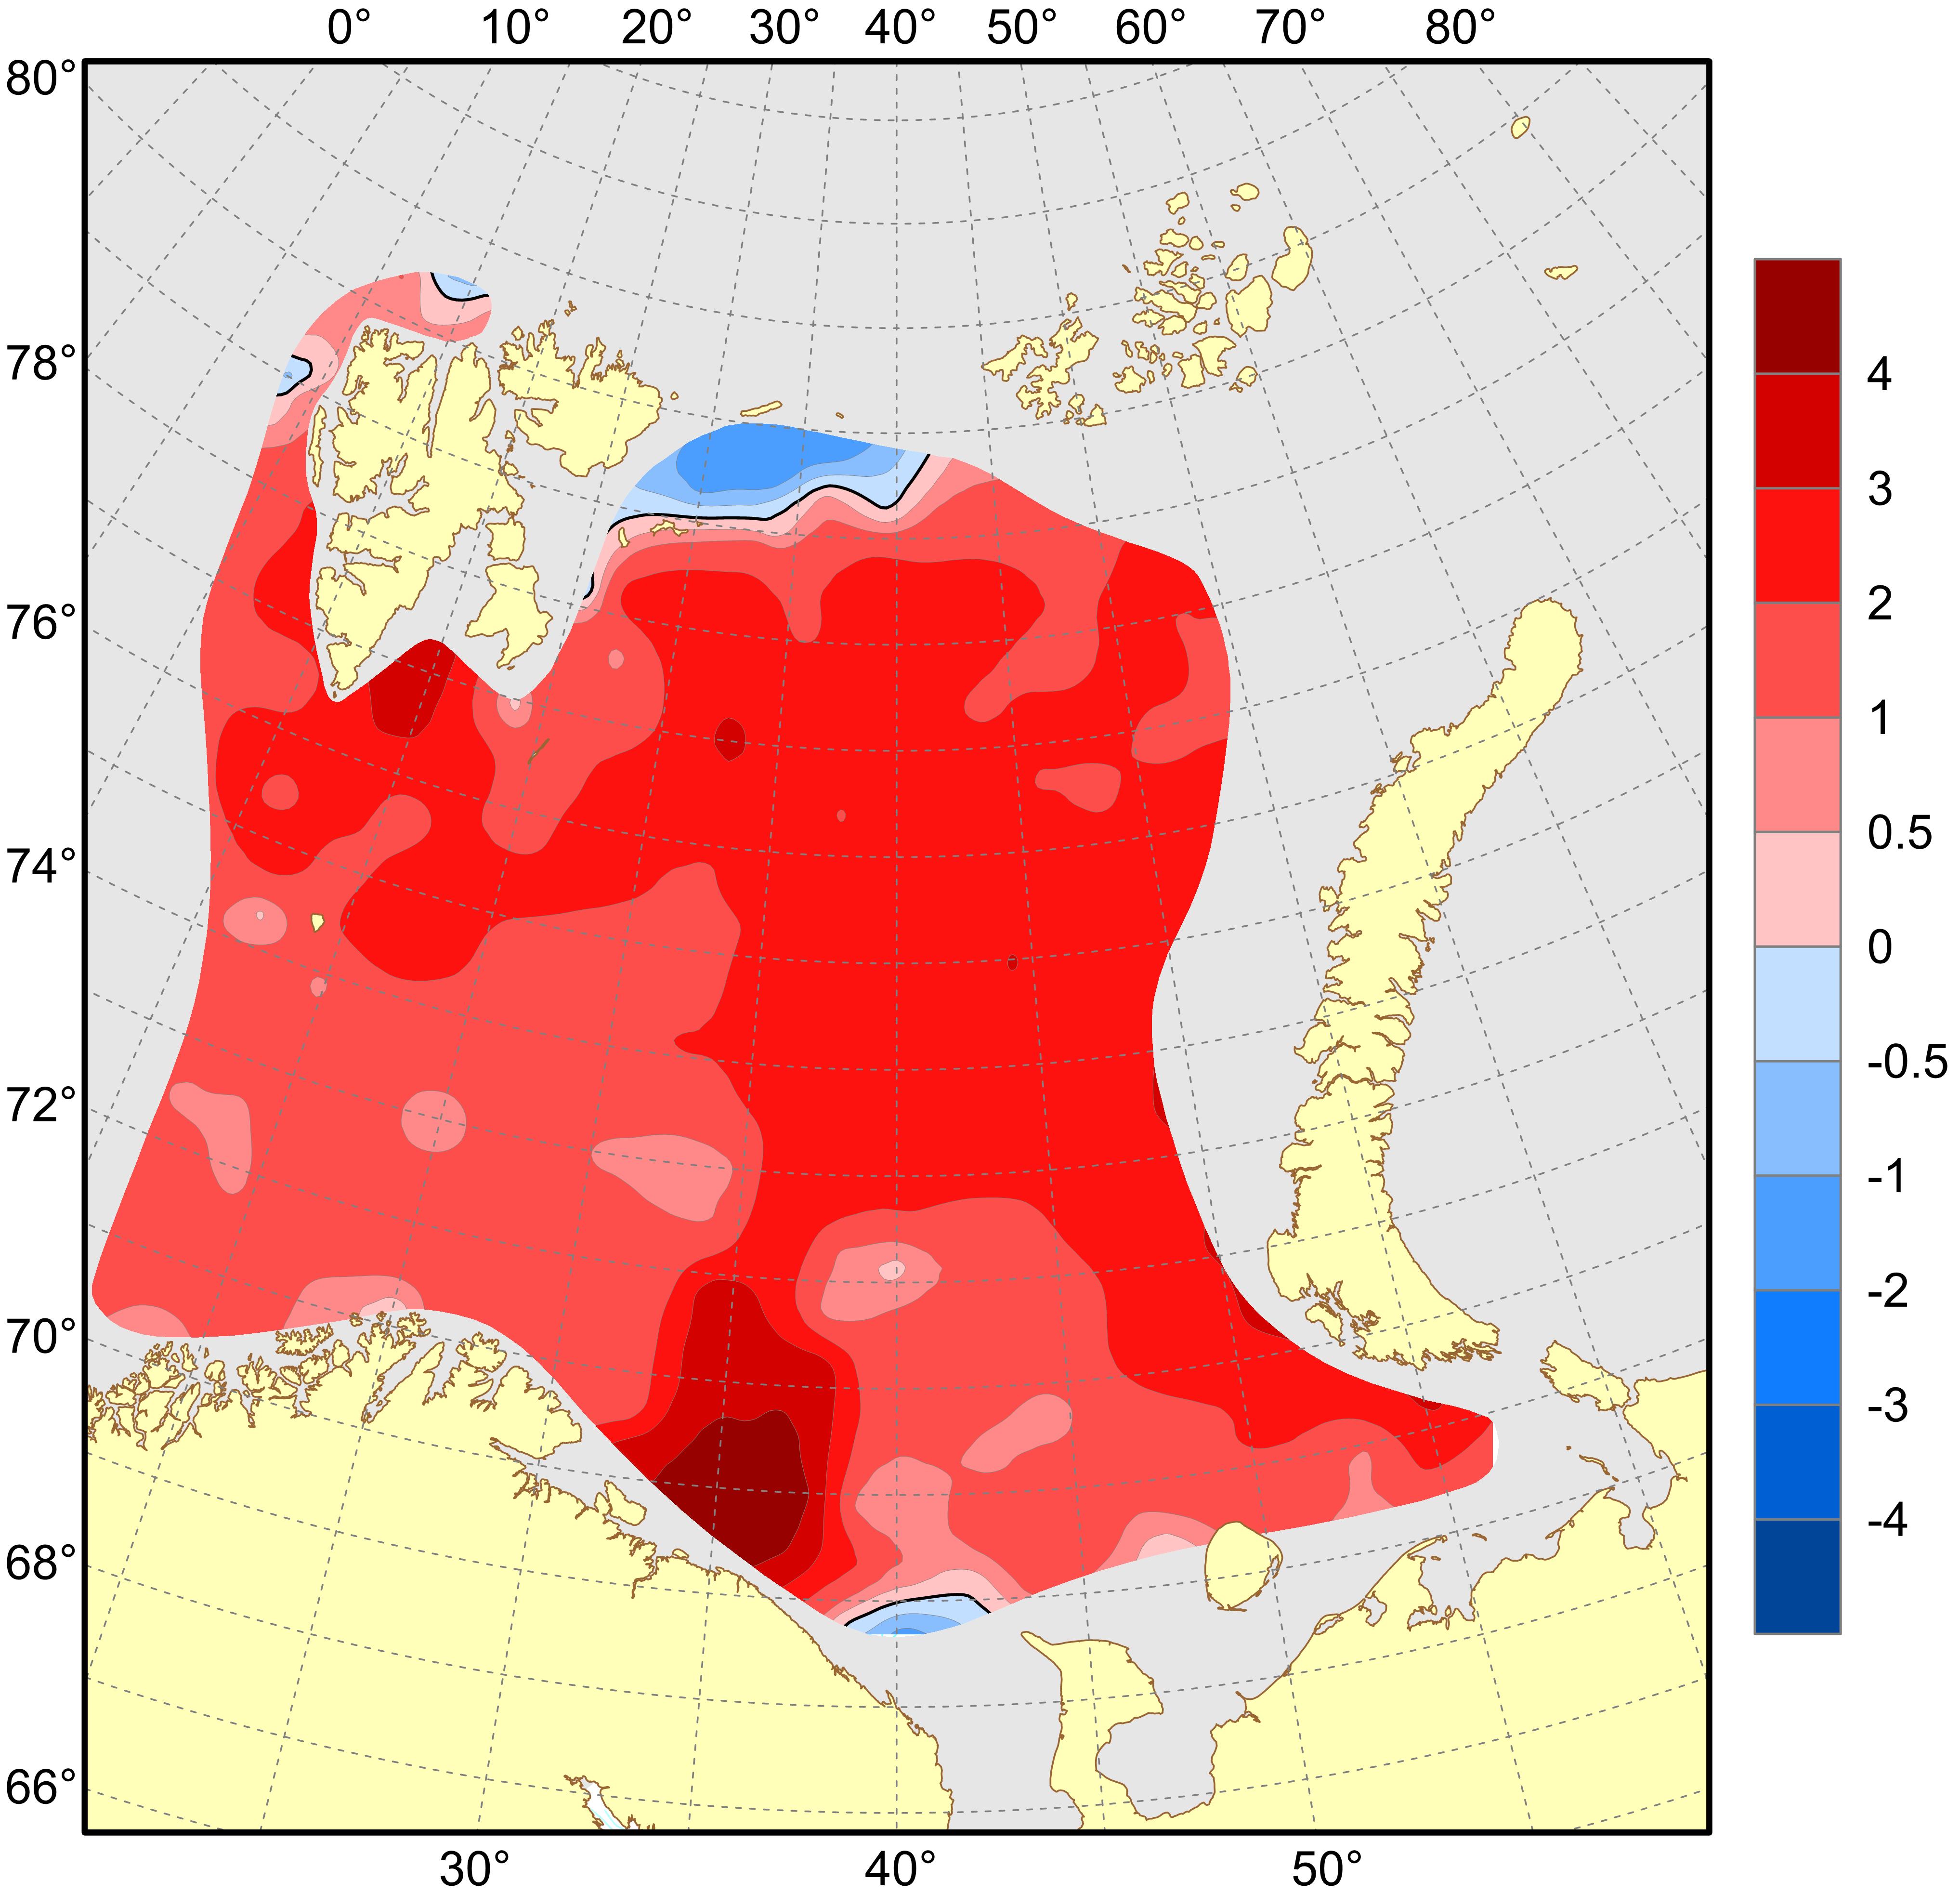
In August–September 2023, surface temperature was on average 1.9°C higher than the long-term mean all over the surveyed area (Fig. 4.1.1.9). Compared to 2022, the surface temperature in 2023 was much higher (by 1.1°C on average) in most of the area (80%).
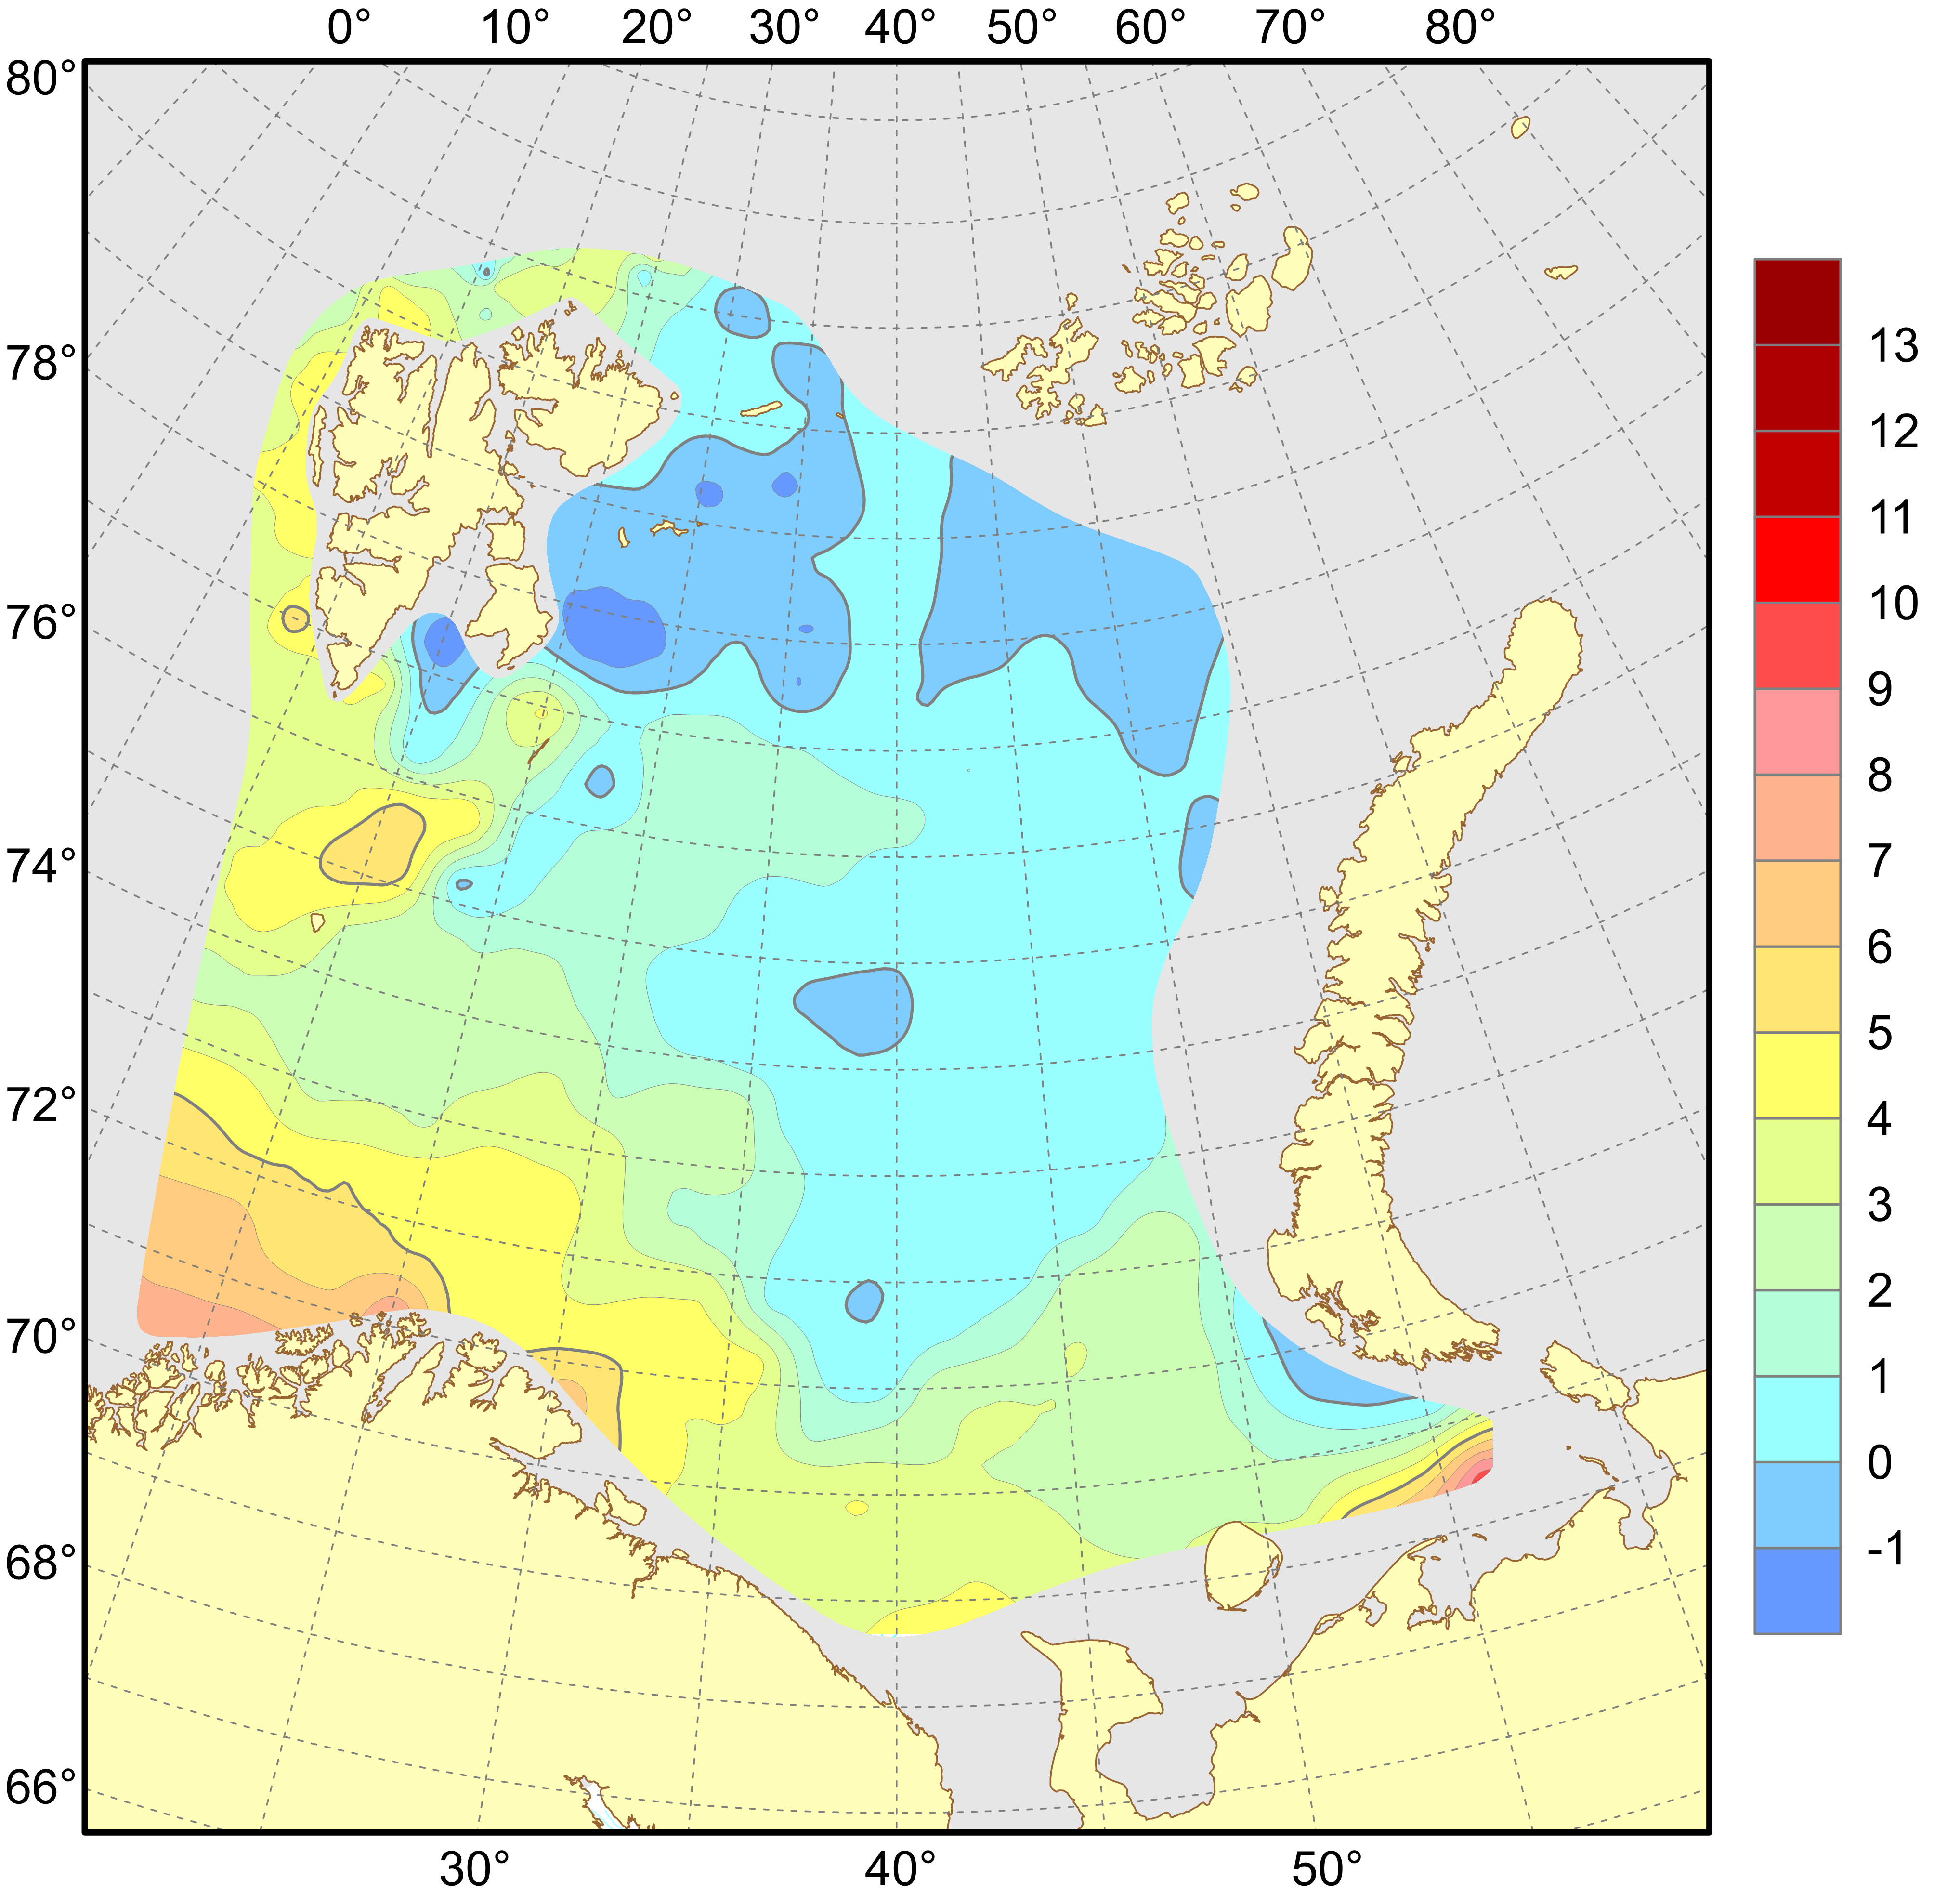
Arctic waters were mainly found, as usual, in the 50–100 m layer north of 77°N (Fig. 4.1.1.3 and 4.1.1.5). Temperatures at depths of 50 and 100 m were higher than the long-term means (on average, by 0.8 and 0.6°C respectively) in most of the surveyed area (80%), with the largest positive anomalies at 50 m depth in the southeast. Negative anomalies (on average, −0.3°C at 50 m and −0.4°C at 100 m) were mostly found in the northern Barents Sea. Compared to 2022, the 50 and 100 m temperatures in 2023 were higher (on average, by 0.7 and 0.5°C respectively) in 54 and 68% of the surveyed area. Negative differences were mainly observed in the southern, central and northern Barents Sea, with the largest values at 50 m. Small differences (both negative and positive, <0.5°C in magnitude) prevailed at 100 m depth.
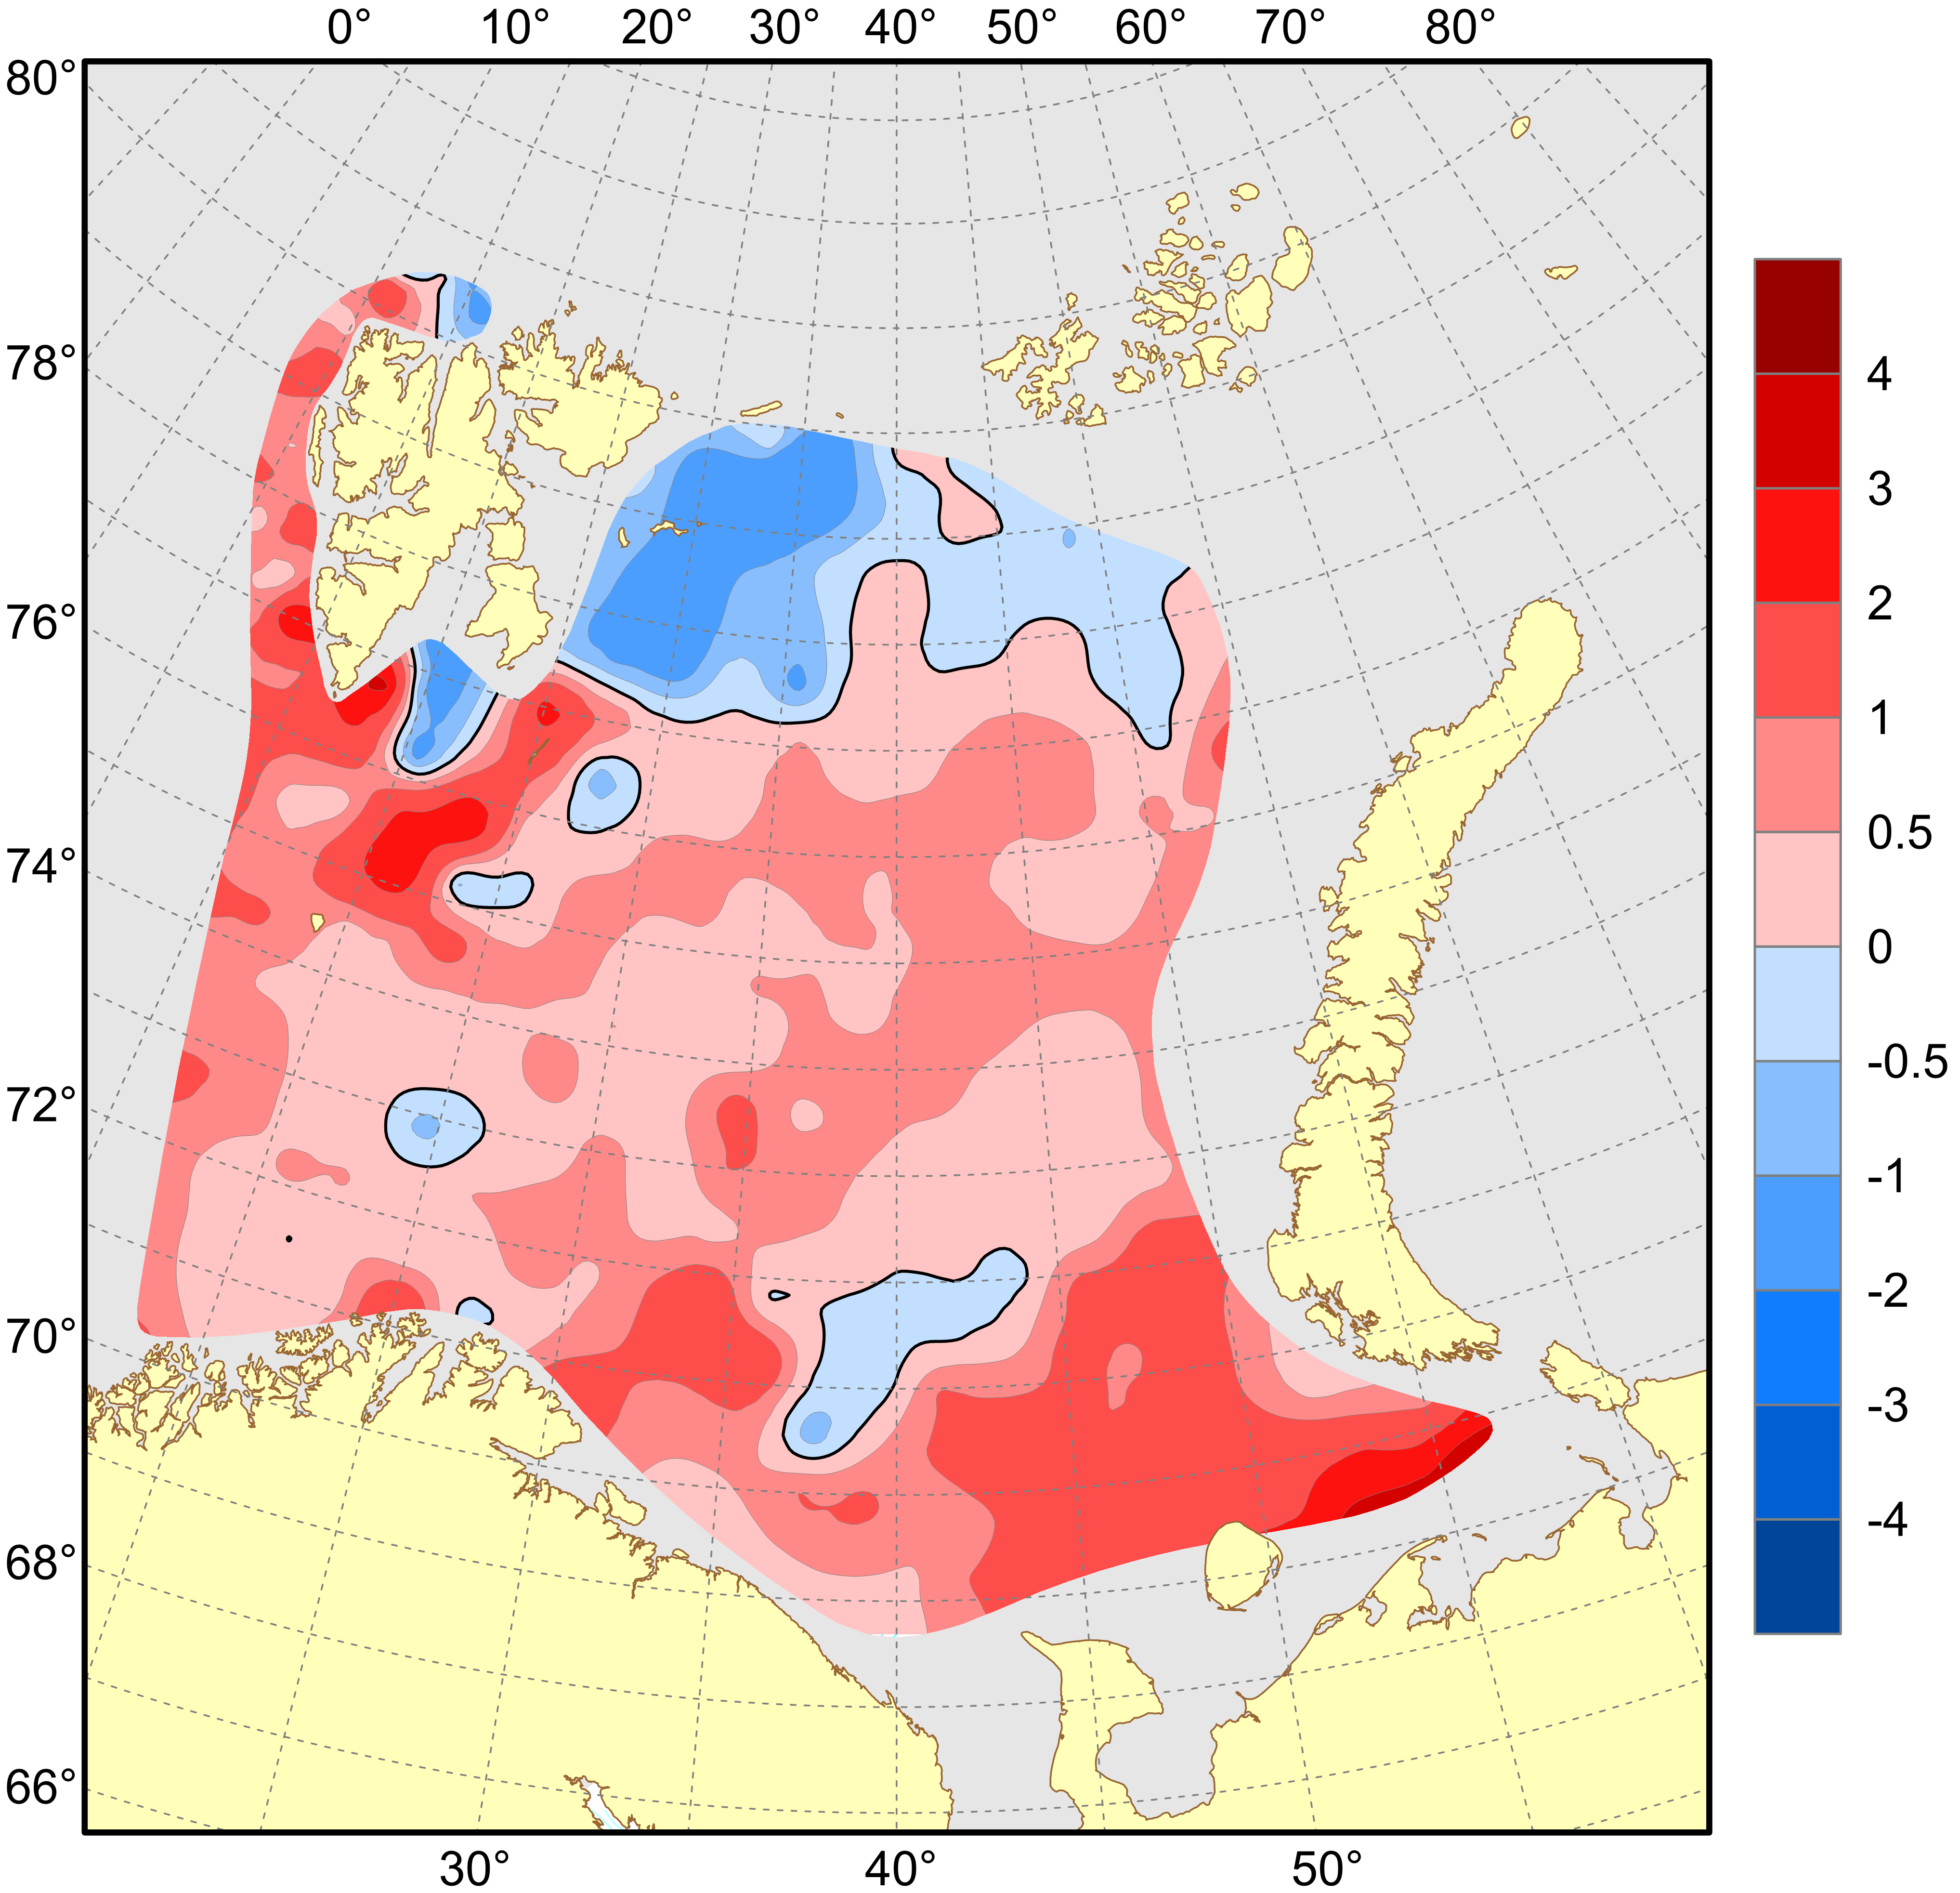
Bottom temperature was in general 0.7°C above average almost all over the surveyed area (Fig. 4.1.1.10). Negative anomalies (−0.6°C on average) were found in the northern part of the sea, east of the Spitsbergen Archipelago. Bottom waters in 2023 were 0.5°C warmer than in 2022 in most of the area. Small temperature differences between 2023 and 2022 (both negative and positive, <0.5°C in magnitude) occupied half of the sea. In August–September 2023, the area covered by bottom water with temperatures below zero was 17% in the Barents Sea (71–79°N 25–55°E) being much lower than those in the previous four years.
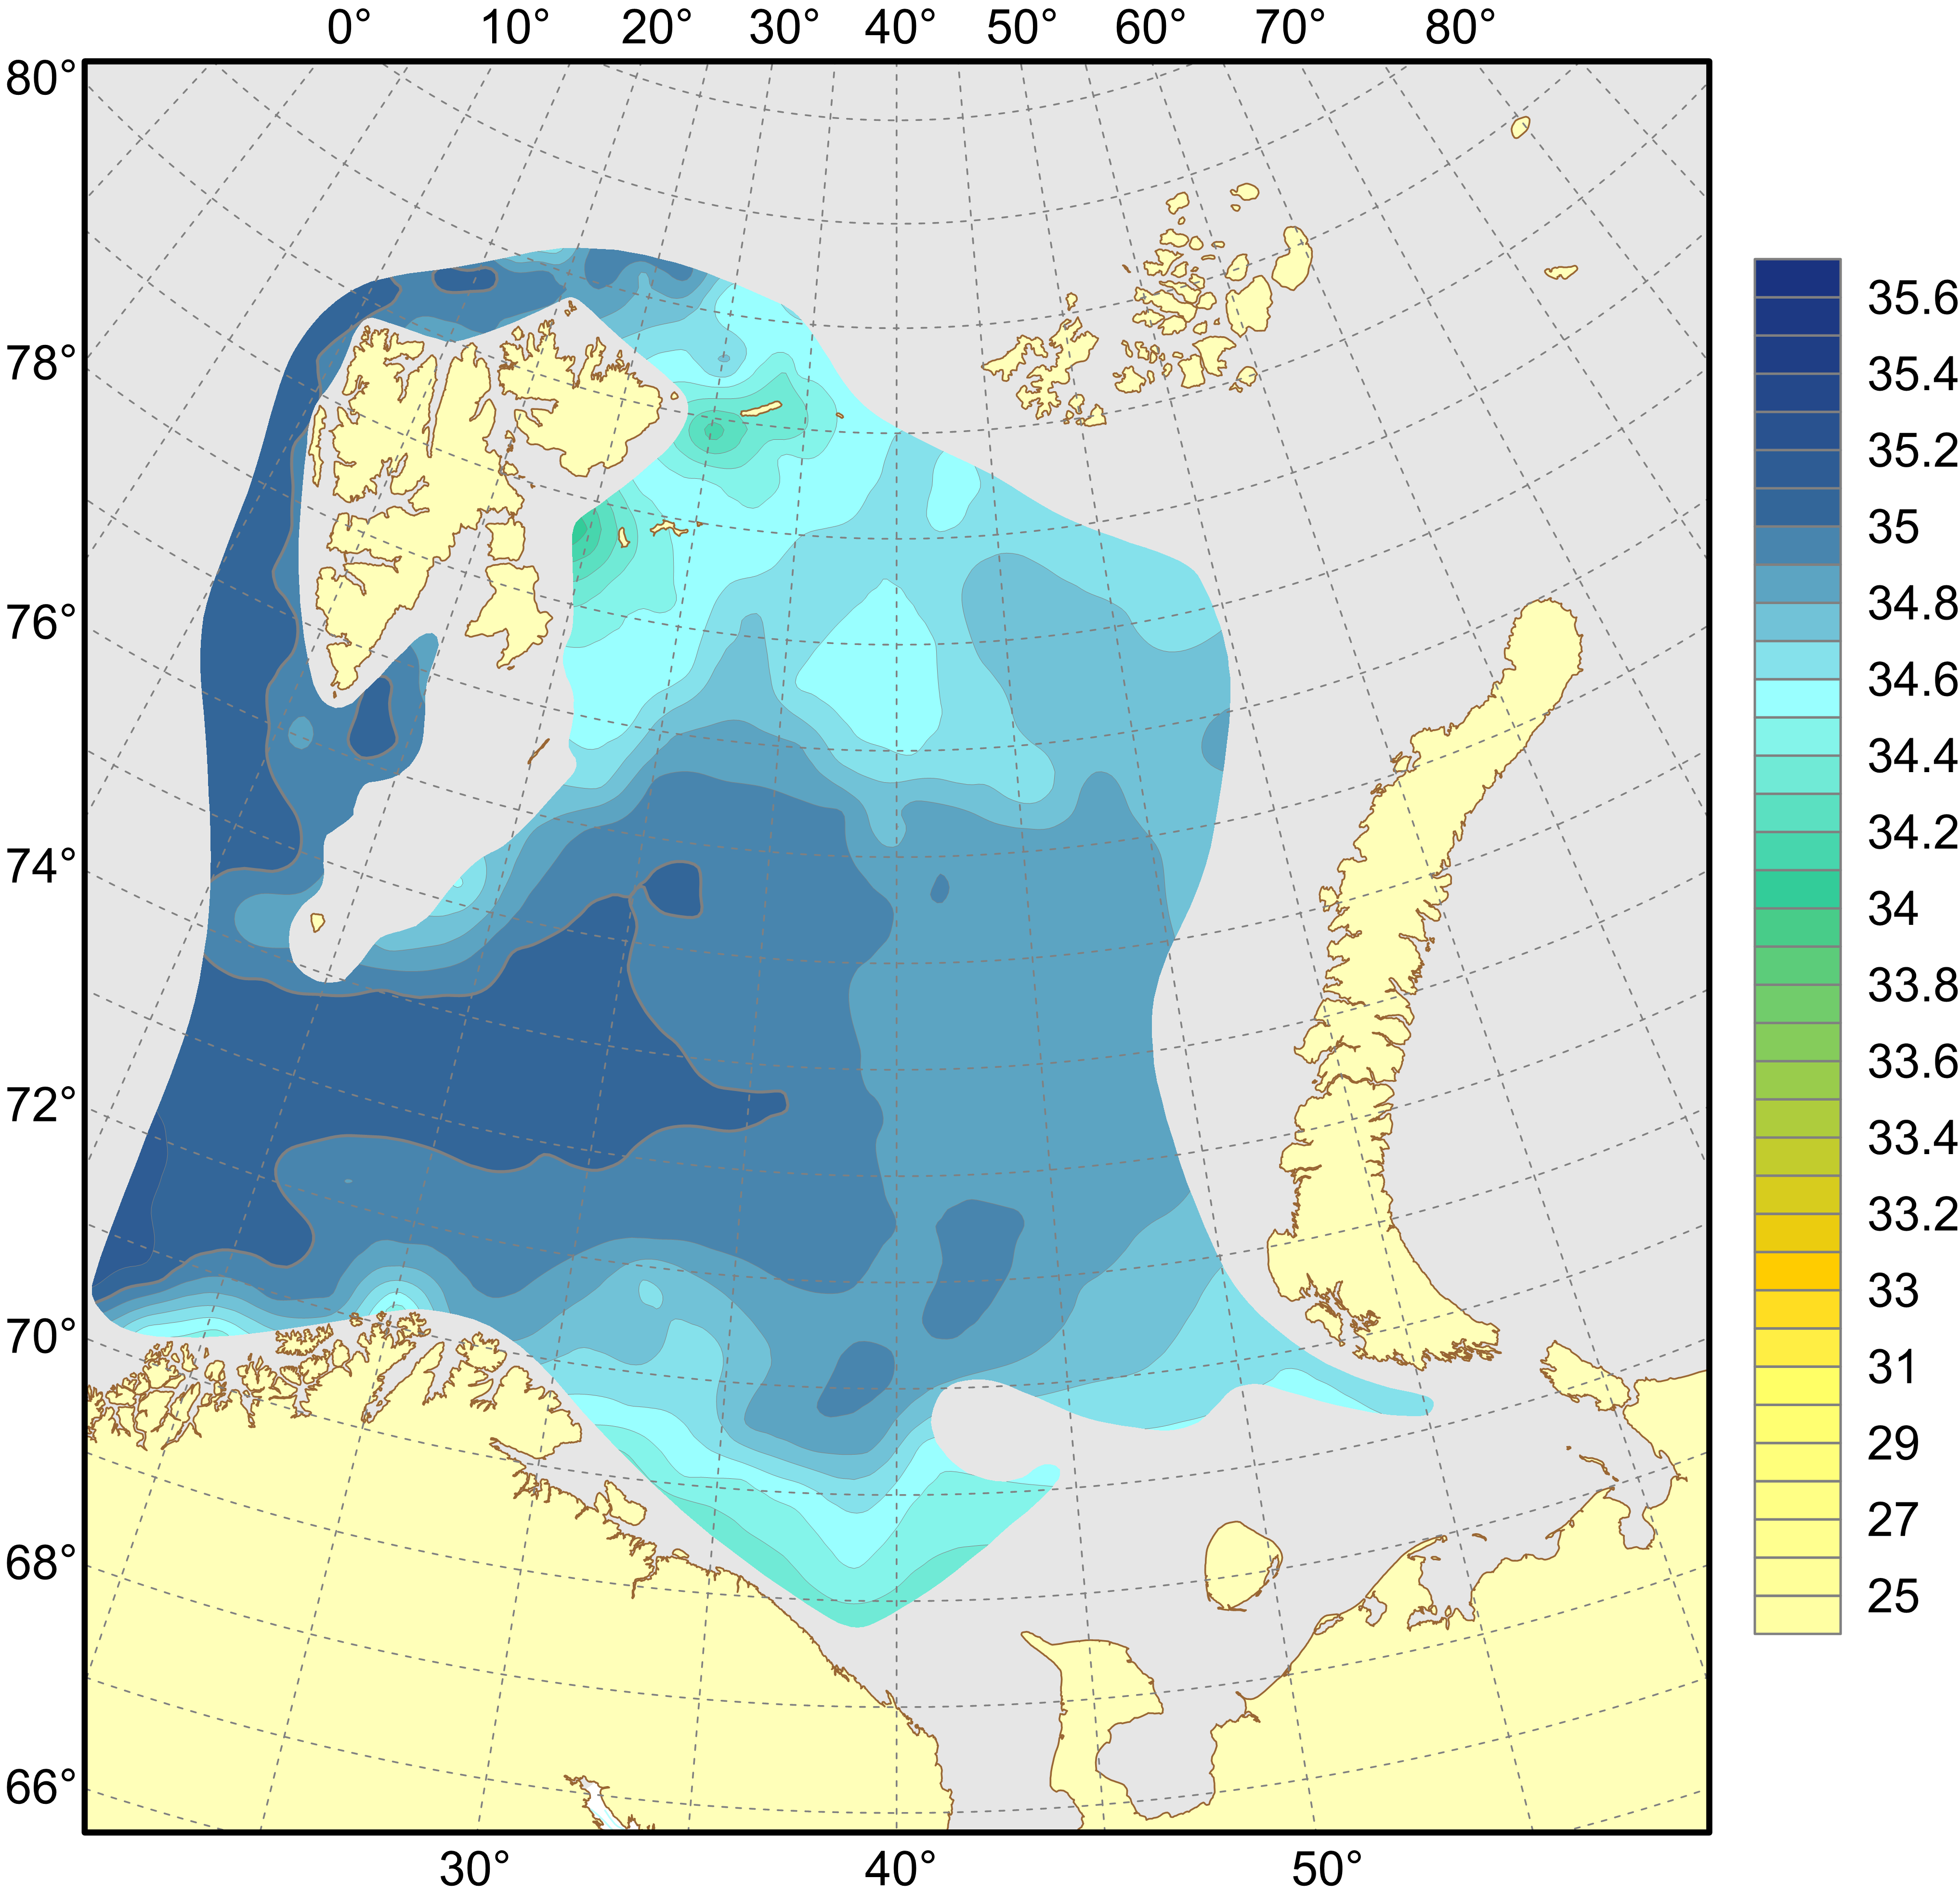
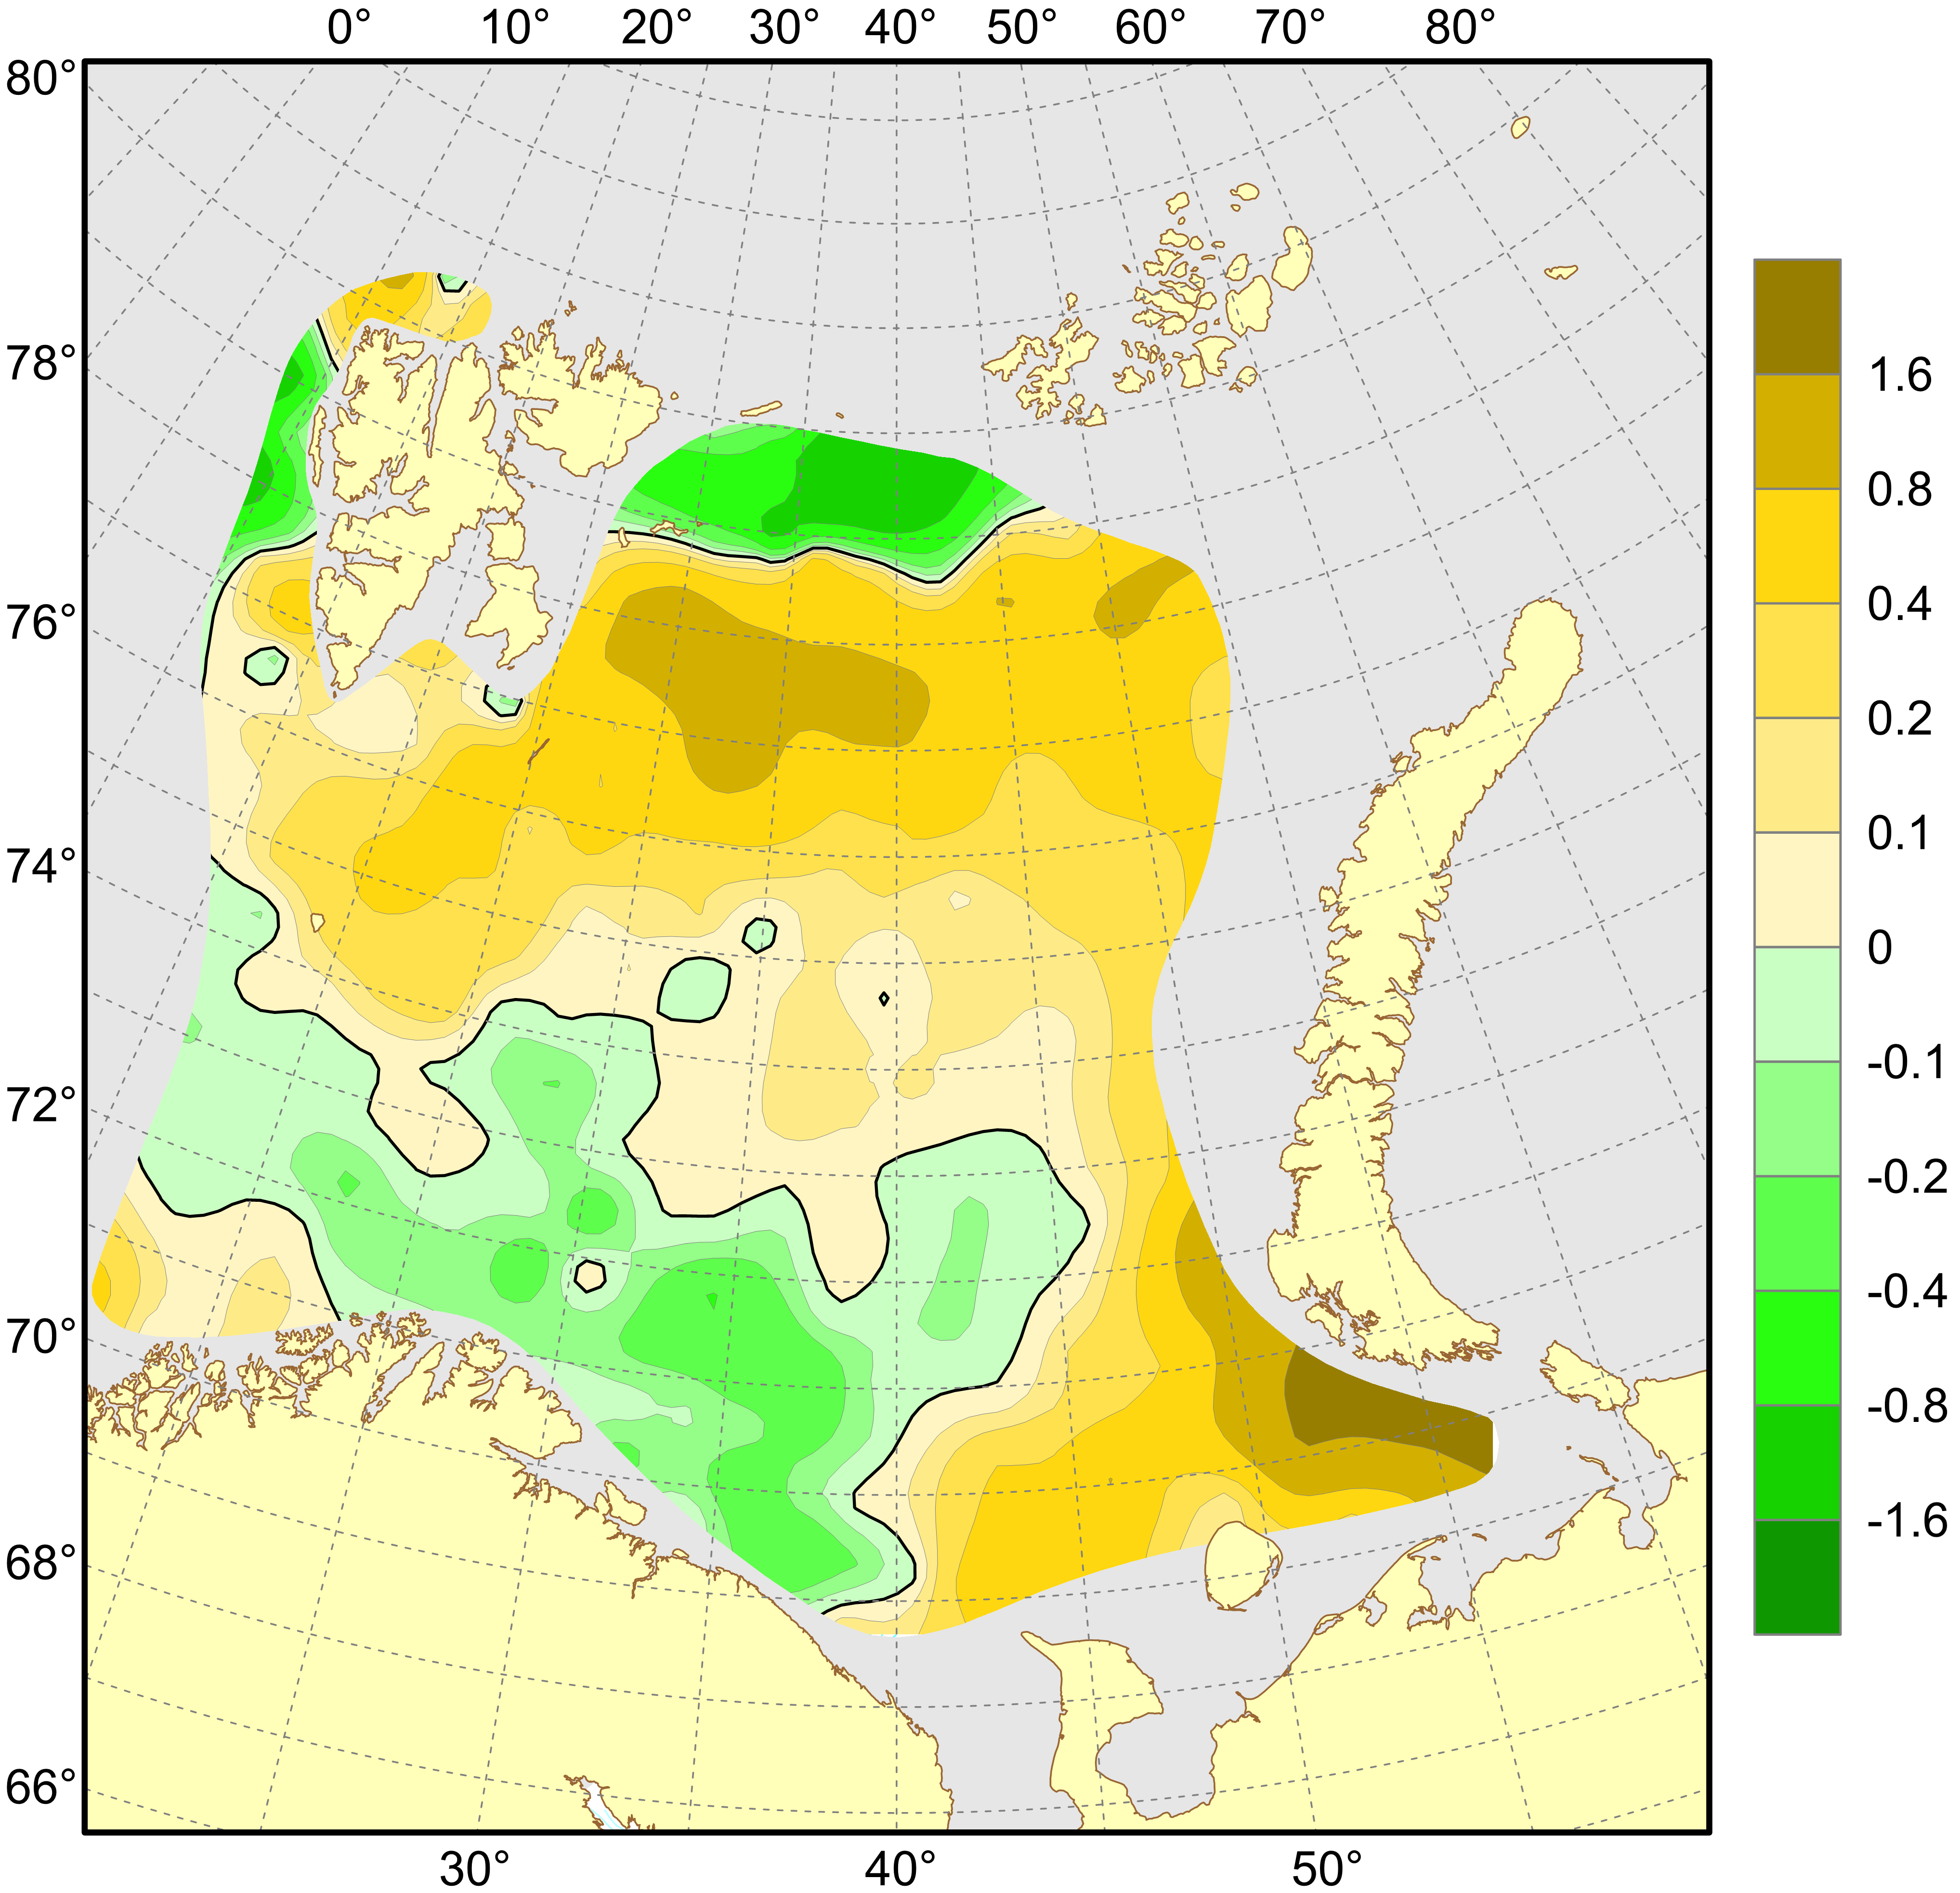
Surface salinity was on average 0.4 higher than the long-term mean in two thirds of the surveyed area, with the largest positive anomalies (>0.8) over the Great Bank and in the southeastern Barents Sea (Fig. 4.1.1.11). Negative anomalies (–0.2 on average) were mainly observed in the southern, southwestern and northernmost parts of the sea. In August–September 2023, surface waters were on average 0.2 saltier than in 2022 in 64% of the surveyed area, with the largest positive differences in the southeast. They were fresher (on average, by 0.3) in the north and southwest, with the largest negative differences in the northernmost part of the sea.
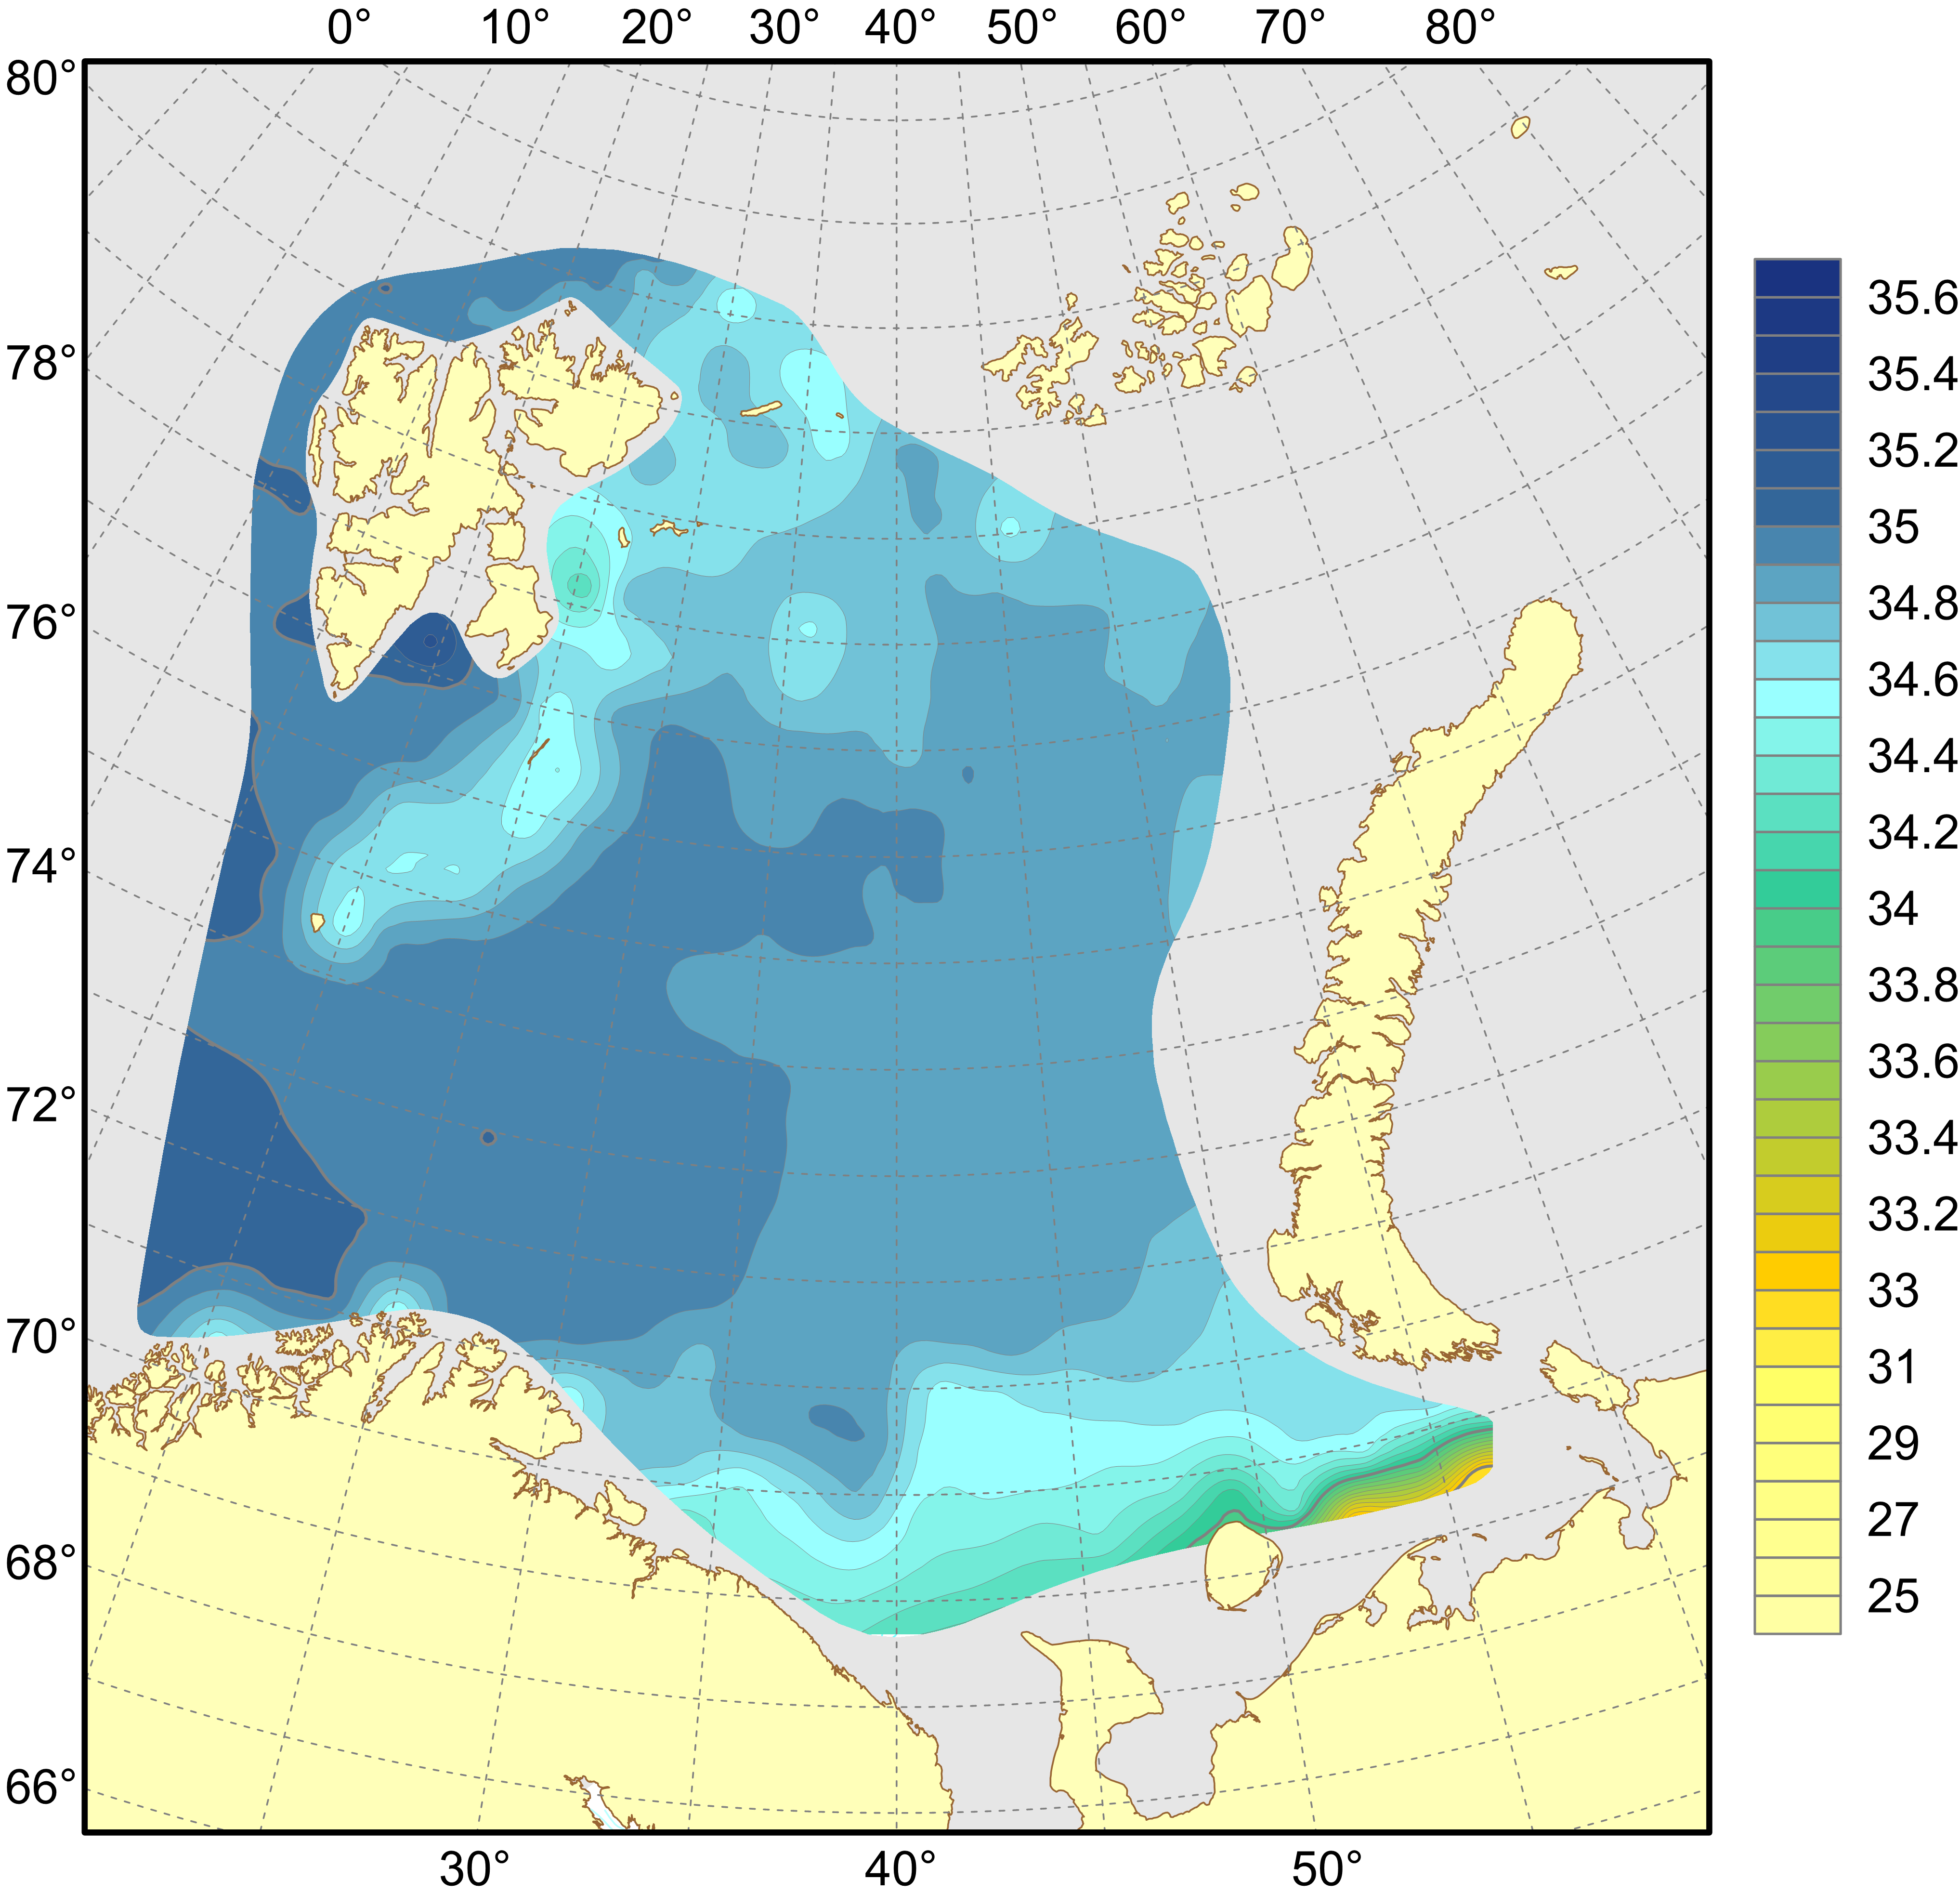
Salinity at 50 m depth was higher than average (by 0.1 on average) in most of the surveyed area (61%), with the largest positive anomalies around the Spitsbergen Archipelago and over the Spitsbergen Bank. Negative anomalies were mainly observed in the southern and southwestern parts of the sea. In August–September 2023, waters at 50 m were saltier (by 0.1 on average) than in 2022 in most of the area (73%). At a depth of 50 m, both positive and negative anomalies and differences were larger than at 100 m. At a depth of 100 m, salinity anomalies and differences of <0.1 in magnitude occupied about 90% of the surveyed area.
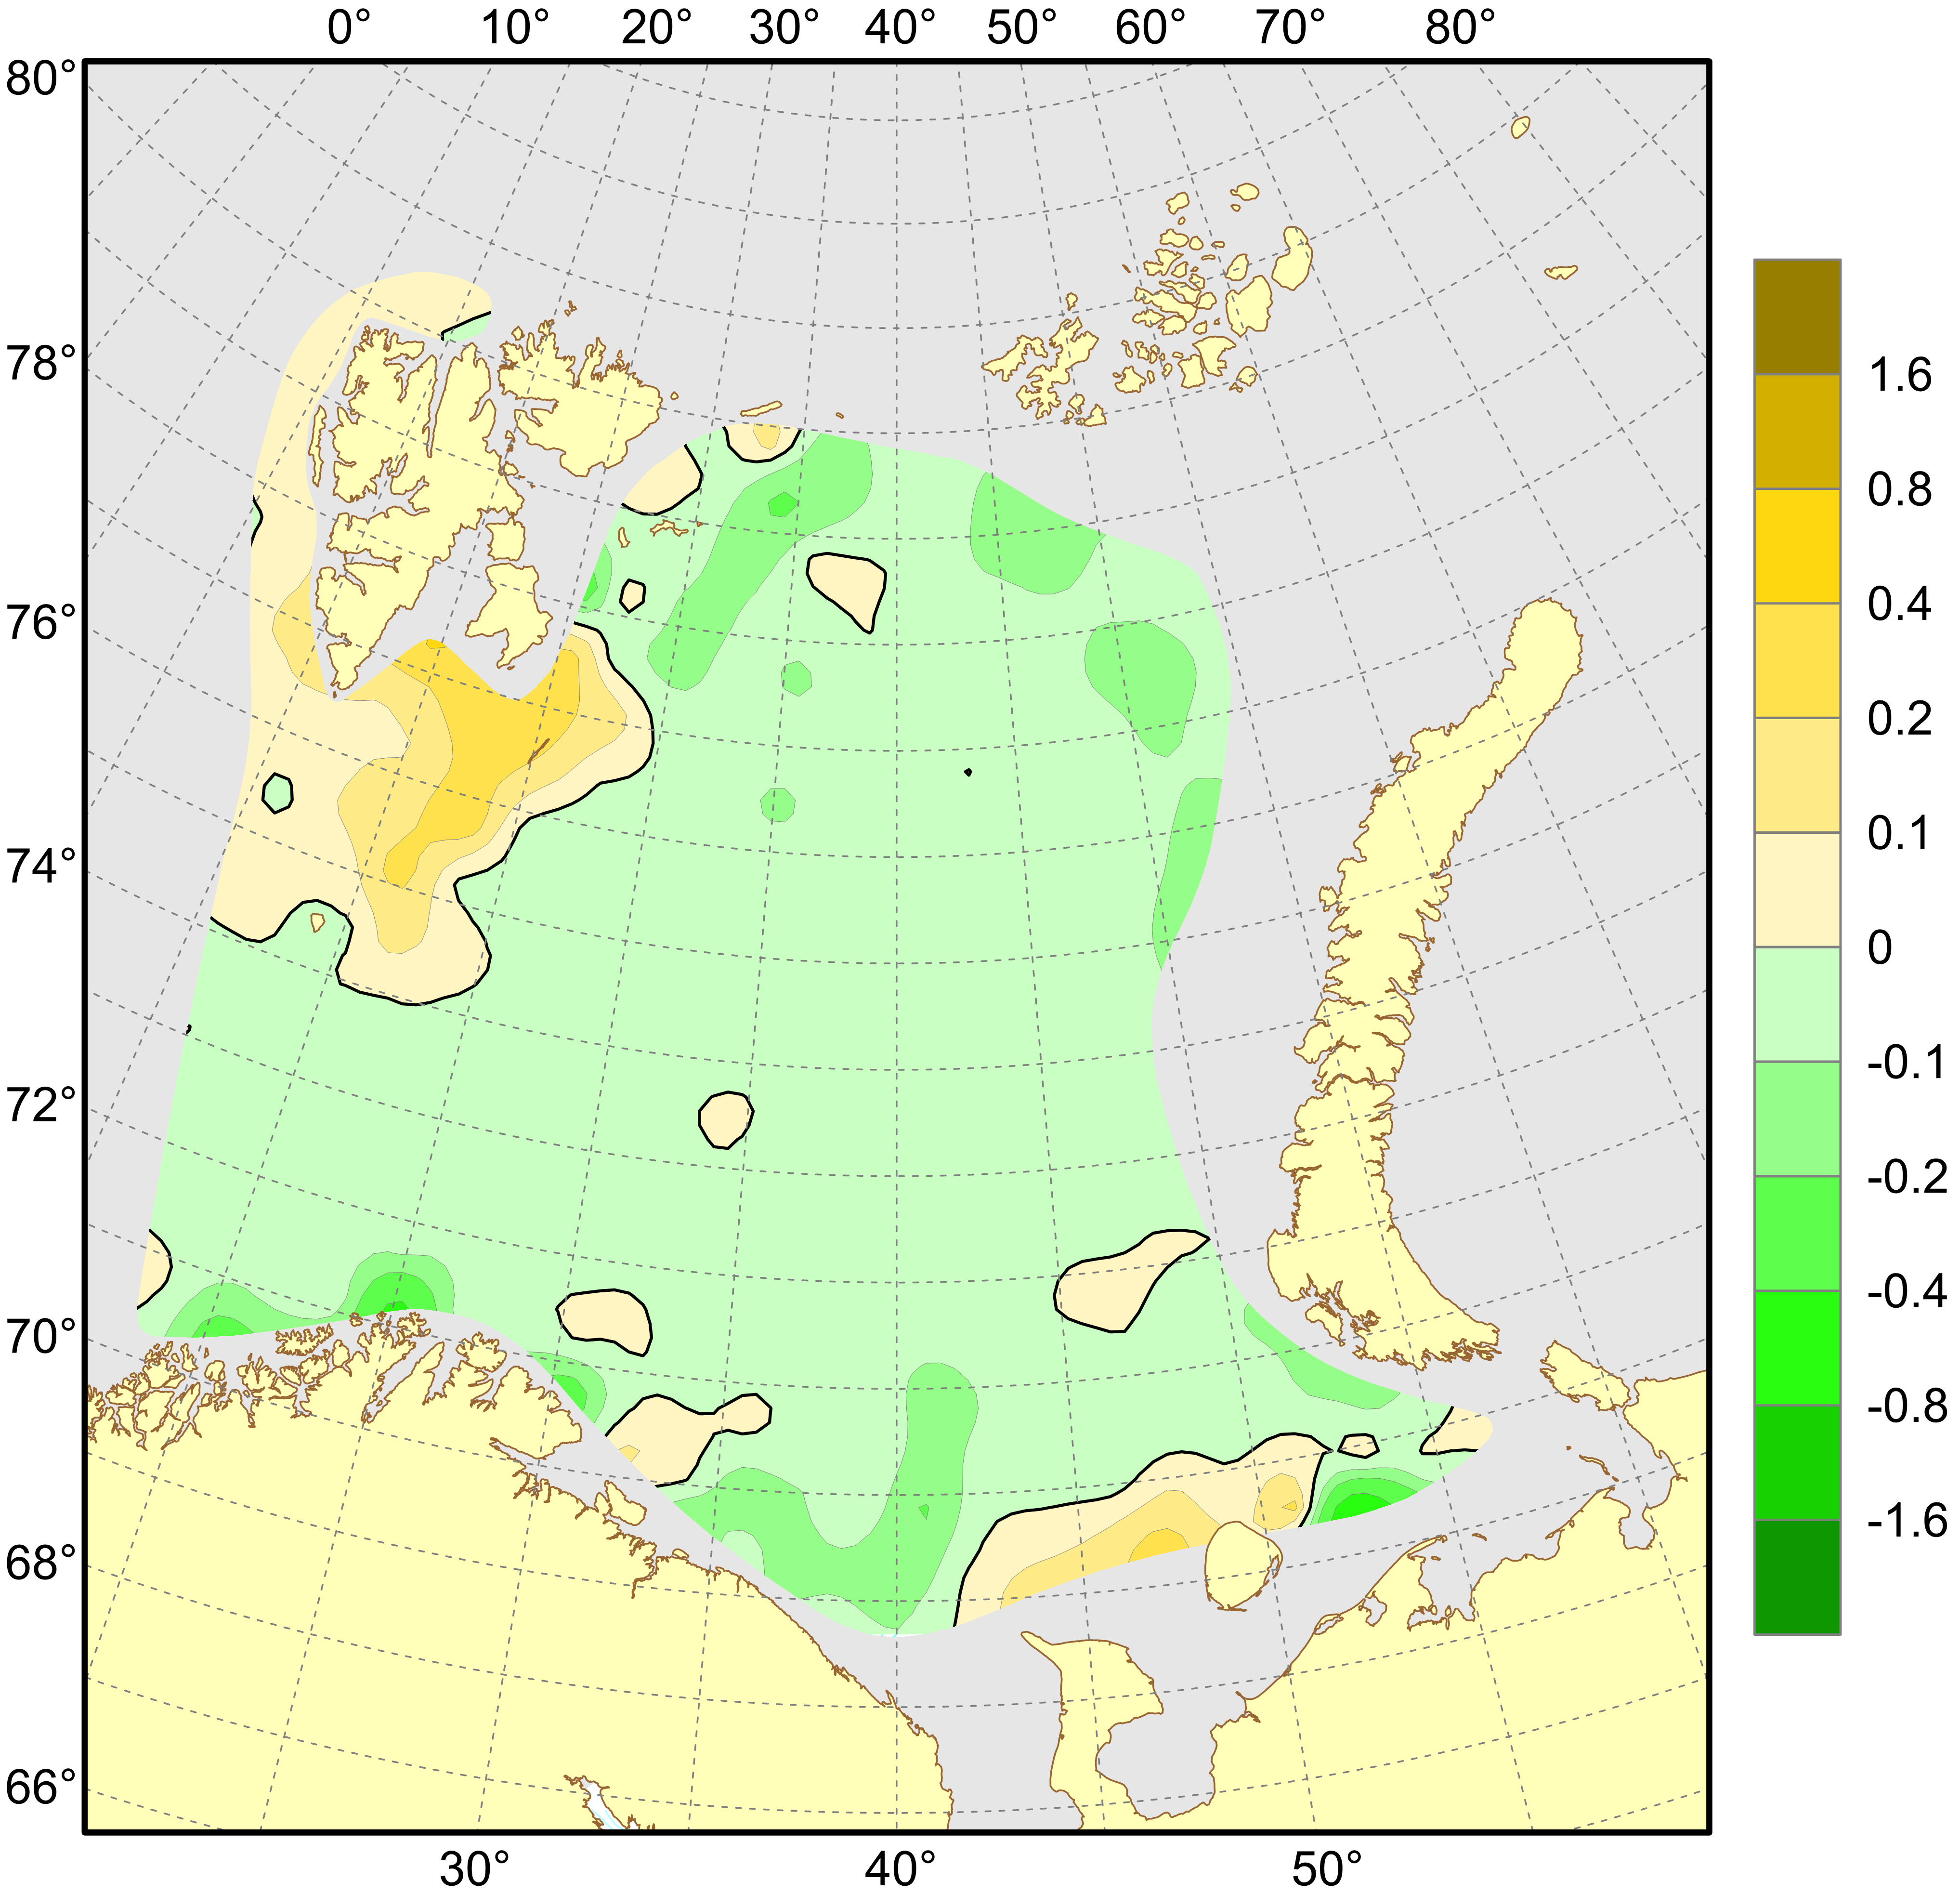
Bottom salinity was slightly lower than average in most of the area (81%) (Fig. 4.1.1.12). Positive anomalies were mainly found south of the Spitsbergen Archipelago, over the Spitsbergen Bank, and north of Kanin Peninsula and Kolguev Island. In August–September 2023, bottom waters were a bit saltier than in 2022 in 61% of the surveyed area, with the largest positive differences (>0.1) over the Spitsbergen Bank and north of Kolguev Island. As a whole, bottom salinity anomalies and differences were small (<0.1 in magnitude) almost all over the area (84 and 90% respectively).
Figure 4.1.1.1. Distribution of surface temperature (°C), August–September 2023.
Figure 4.1.1.2. Distribution of surface salinity, August–September 2023.
Figure 4.1.1.3. Distribution of temperature (°C) at the 50 m depth, August–September 2023.
Figure 4.1.1.4. Distribution of salinity at the 50 m depth, August–September 2023.
Figure 4.1.1.5. Distribution of temperature (°C) at the 100 m depth, August–September 2023.
Figure 4.1.1.6. Distribution of salinity at the 100 m depth, August–September 2023.
Figure 4.1.1.7. Distribution of temperature (°C) at the bottom, August–September 2023.
Figure 4.1.1.8. Distribution of salinity at the bottom, August–September 2023.
Figure 4.1.1.9. Surface temperature anomalies (°C), August–September 2023.
Figure 4.1.1.10. Temperature anomalies (°C) at the bottom, August–September 2023.
Figure 4.1.1.12. Salinity anomalies at the bottom, August–September 2023.
4.1.2 Standard sections
Table 4.1.2.1 shows mean temperatures in the main parts of standard oceanographic sections of the Barents Sea, along with historical data back to 1965.
The Fugløya–Bear Island and the southern part of the Vardø–North Sections cover the inflow of Atlantic and Coastal water masses from the Norwegian Sea to the Barents Sea. The mean Atlantic Water (50–200 m) temperature in the inflow region to the Barents Sea, i.e. at the Fugløya–Bear Island Section, was 0.1°C higher than the long-term mean (1991–2020) and 0.1°C colder than in 2022 (Table 4.1.2.1). Slightly further east, in the southern part of the Vardø-North Section, temperatures on the other hand were higher than both the long-term mean (0.4°C) and that in 2022 (0.2°C) (Table 4.1.2.1).
The Kola Section covers the flow of coastal and Atlantic waters in the southern Barents Sea. In August–September 2023, the Kola Section was sampled twice: in the middle of August (Table 4.1.2.1) and in late September. In August, temperature in the Kola Section was 0.3–0.8°C higher than the long-term mean (1991–2020) for different layers (0–50, 0–200, 50–200, 150–200 m) and parts (inner – coastal waters, central and outer – Atlantic waters) of the section that was typical of warm years. The highest anomaly of +0.8°C was observed in the upper 50 m layer in Atlantic waters. From August to September, temperature anomalies increased slightly (by 0.1–0.2°C) in the upper 50 m layer in the inner and central parts of the section that was typical of anomalously warm years. But deeper, in the 50–200 m layer, they decreased by 0.1–0.2°C in Atlantic waters being still typical of warm years and dropped by 0.8°C in coastal waters having reached a close-to-normal value of −0.2°C. The mean salinity of coastal and Atlantic waters in the Kola Section (0–200 m) was lower than the long-term mean (1991–2020) by 0.07–0.12 in August and by 0.06–0.10 in September.
Since 2012-2014, the hydrographic monitoring in the northern Barents Sea was strengthened by extending the Vardø-North Section all the way up to 81oN, and by establishing a new standard section north of Svalbard/Spitsbergen (the Hinlopen Section). Both sections are sampled in late September-early October. The northern part of the Vardø-North section covers mainly Arctic Waters, while the Hinlopen section covers the Atlantic Water flowing along the slope toward the deep Arctic Ocean. The time series are too short to be compared to the long-term mean and are instead compared to their 10-year mean (2014-2023). The Arctic Water in the northern part of the extended Vardø-North Section was slightly colder (0.1°C) than the 10-year mean and the situation in 2022 (Table 4.1.2.1). The Hinlopen Section had temperatures close to the 10-year mean and was 0.5°C warmer than in 2022 (Table 4.1.2.1).
Table 4.1.2.1. Mean water temperatures in the main parts of standard oceanographic sections in the Barents Sea and adjacent waters in August–September 1965–2023. The sections are: Kola (70º30′N – 72º30′N, 33º30′E), Kanin S (68º45′N – 70º05′N, 43º15′E), Kanin N (71º00′N – 72º00′N, 43º15′E), Fugløya – Bear Island (FBI, 71º30′N, 19º48′E – 73º30′N, 19º20′E), Vardø – North South (VN S, 72º15′N – 74º15′N, 31º13′E), Vardø-North N (WN N, 77º30′N – 79º30′N, 34º00' E), and Hinlopen (80º32′N – 81º06′N, 15º36' E).
Year
Section and layer (depth in metres)
Kola
Kola
Kola
Kanin S
Kanin N
FBI
VN S
VN N
Hinlopen
0–50
50–200
0–200
0–bot.
0–bot.
50–200
50–200
30–100
100-500
1965
1966
1967
1968
1969
1970
1971
1972
1973
1974
1975
1976
1977
1978
1979
1980
1981
1982
1983
1984
1985
1986
1987
1988
1989
1990
1991
1992
1993
1994
1995
1996
1997
1998
1999
2000
2001
2002
2003
2004
2005
2006
2007
2008
2009
2010
2011
2012
2013
2014
2015
2016
2017
2018
2019
2020
2021
2022
2023
6.7
6.7
7.5
6.4
6.7
7.8
7.1
8.7
7.7
8.1
7.0
8.1
6.9
6.6
6.5
7.4
6.6
7.1
8.1
7.7
7.1
7.5
6.2
7.0
8.6
8.1
7.7
7.5
7.5
7.7
7.6
7.6
7.3
8.4
7.4
7.6
6.9
8.6
7.2
9.0
8.0
8.3
8.2
6.9
7.2
7.8
7.6
8.2
8.8
8.0
8.5
8.7
7.9
8.1
7.8
8.2
7.9
-
8.5
3.9
2.6
4.0
3.7
3.1
3.7
3.2
4.0
4.5
3.9
4.6
4.0
3.4
2.5
2.9
3.5
2.7
4.0
4.8
4.1
3.5
3.5
3.3
3.7
4.8
4.4
4.5
4.6
4.0
3.9
4.9
3.7
3.4
3.4
3.8
4.5
4.0
4.8
4.0
4.7
4.4
5.3
4.6
4.6
4.3
4.7
4.0
5.3
4.6
4.6
4.8
4.7
4.8
4.9
4.4
4.3
4.5
-
4.7
4.6
3.6
4.9
4.4
4.0
4.7
4.2
5.2
5.3
4.9
5.2
5.0
4.3
3.6
3.8
4.5
3.7
4.8
5.6
5.0
4.4
4.5
4.0
4.5
5.8
5.3
5.3
5.3
4.9
4.8
5.6
4.7
4.4
4.7
4.7
5.3
4.7
5.8
4.8
5.7
5.3
6.1
5.5
5.2
5.0
5.5
4.9
6.0
5.6
5.4
5.7
5.8
5.6
5.7
5.2
5.3
5.3
-
5.6
4.6
1.9
6.1
4.7
2.6
4.0
4.0
5.1
5.7
4.6
5.6
4.9
4.1
2.4
2.0
3.3
2.7
4.5
5.1
4.5
3.4
3.9
2.7
3.8
6.5
5.0
4.8
5.0
4.4
4.6
5.9
5.2
4.2
2.1
3.8
5.8
5.6
4.0
4.2
5.0
5.2
6.1
4.9
4.2
-
4.9
5.0
6.2
5.5
4.5
6.1
-
-
-
5.5
-
6.0
-
-
3.7
2.2
3.4
2.8
2.0
3.3
3.2
4.1
4.2
3.5
3.6
4.4
2.9
1.7
1.4
3.0
2.2
2.8
4.2
3.6
3.4
3.2
2.5
2.9
4.3
3.9
4.2
4.0
3.4
3.4
4.3
2.9
2.8
1.9
3.1
4.1
4.0
3.7
3.3
4.2
3.8
4.5
4.3
4.0
4.3
4.5
3.8
5.2
4.6
4.1
4.6
5.5
-
-
4.1
-
4.3
-
-
5.2
5.3
6.3
5.0
6.3
5.6
5.6
6.1
5.7
5.8
5.7
5.8
4.9
4.9
4.7
5.5
5.3
6.0
6.1
5.7
5.6
5.5
5.1
5.7
6.2
6.3
6.2
6.1
5.8
5.9
6.1
5.7
5.4
5.8
6.1
5.8
5.9
6.5
6.2
6.4
6.2
6.9
6.5
6.4
6.4
6.2
6.4
6.4
6.3
6.1
6.6
6.5
6.4
6.0
5.9
6.2
6.1
6.4
6.3
3.8
3.2
4.4
3.4
3.8
4.1
3.8
4.6
4.9
4.3
4.5
4.4
3.6
3.2
3.6
3.7
3.4
4.1
4.8
4.2
3.7
3.8
3.5
3.8
5.1
5.0
4.8
4.6
4.2
4.8
4.6
3.7
4.0
3.9
4.8
4.2
4.2
4.6
4.7
4.8
5.0
5.3
4.9
4.7
5.2
-
5.1
5.7
4.9
5.2
5.5
5.1
5.2
-
4.7
5.1
5.0
5.0
5.2
-
-
-
-
-
-
-
-
-
-
-
-
-
-
-
-
-
-
-
-
-
-
-
-
-
-
-
-
-
-
-
-
-
-
-
-
-
-
-
-
-
-
-
-
-
-
-
-0.2
-0.4
-
-0.6
0.2
-1.1
0.3
-1.1
-0.8
-1.1
-0.7
-0.8
-
-
-
-
-
-
-
-
-
-
-
-
-
-
-
-
-
-
-
-
-
-
-
-
-
-
-
-
-
-
-
-
-
-
-
-
-
-
-
-
-
-
-
-
-
-
-
-
-
3.5
3.6
4.1
3.8
3.9
3.7
3.4
3.5
3.2
3.7
Average
1991–2020
7.9
4.4
5.3
4.9
3.9
6.2
4.8
-
-
4.2 Anthropogenic litter
4.2.1 Marine litter
Text by T. Prokhorova, B. E. Grøsvik, R. Klepikovskiy, P. Krivosheya
Figures by P. Krivosheya
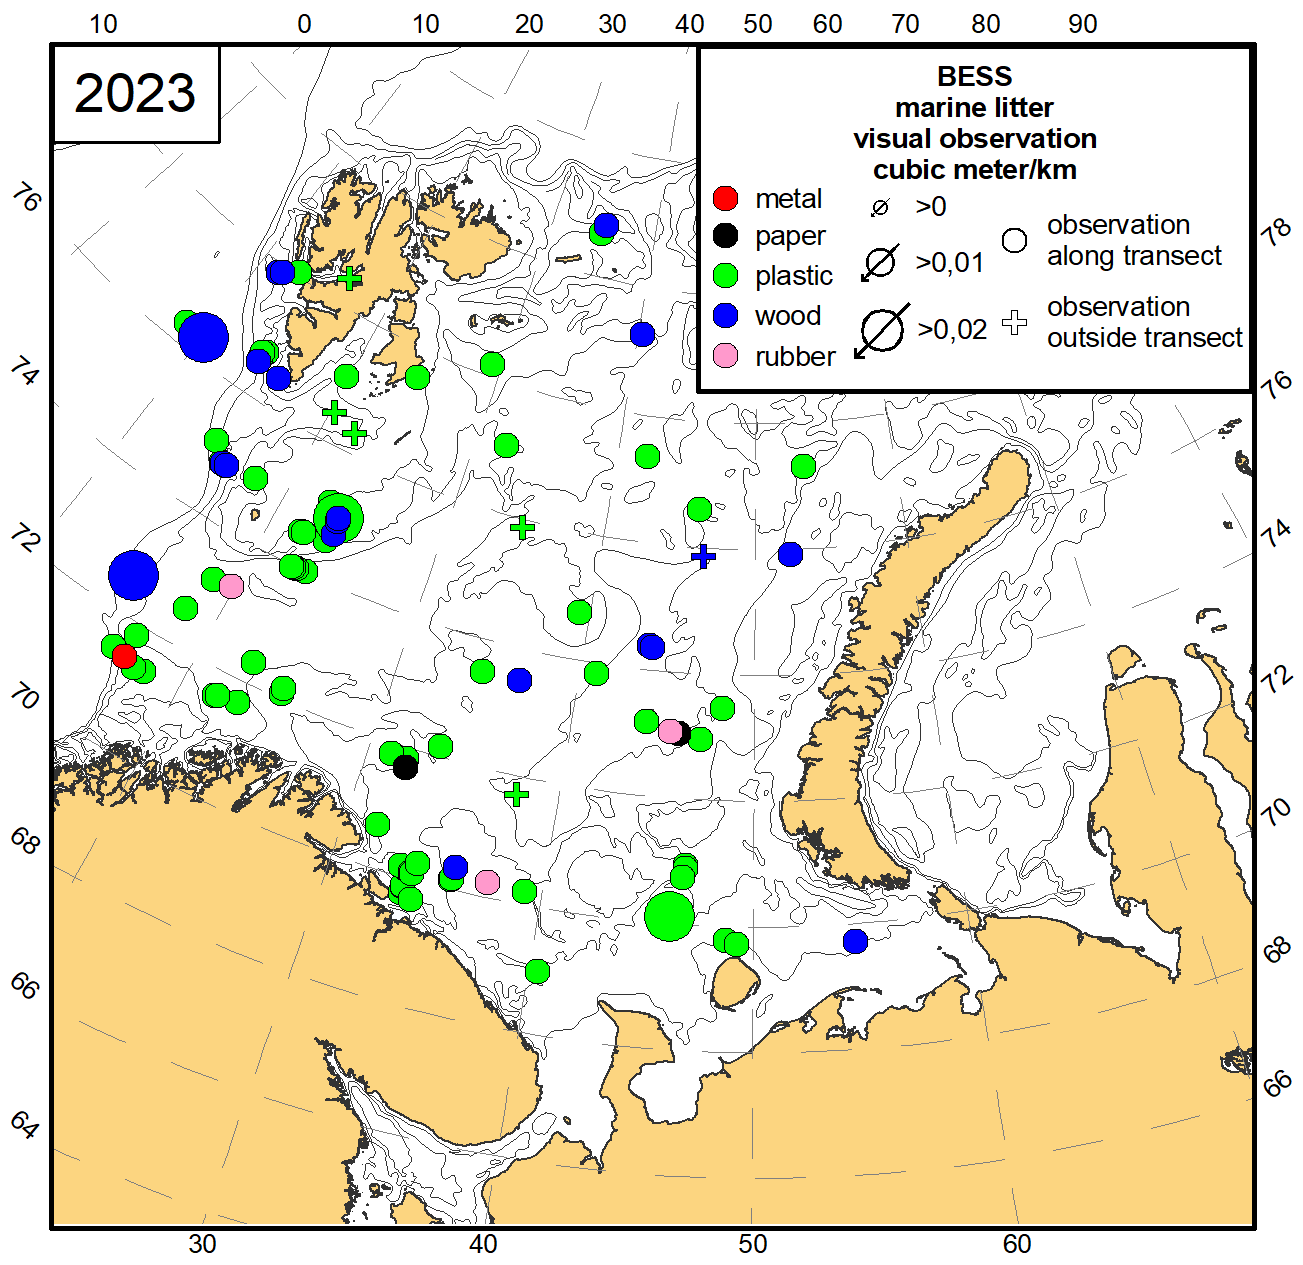
Surface observations were carried out along the transects with marine mammal observations from Norwegian and Russian vessels. Plastic was the most frequent material type of floating litter observation (75.0 % of observations) (Fig. 4.2.1.1). The maximum surface observation of plastic litter was 0.04 m3/km (a part of a fishing trawl). The average surface observation of plastic was 0.002 m3/ km. Wood was recorded in 21.0 % of the observations. The maximum surface observation of wood was 0.05 m3/km, with the average of 0.009 m3/km. Metal, paper and rubber were observed singularly (1.0-2.0 % of the observations).
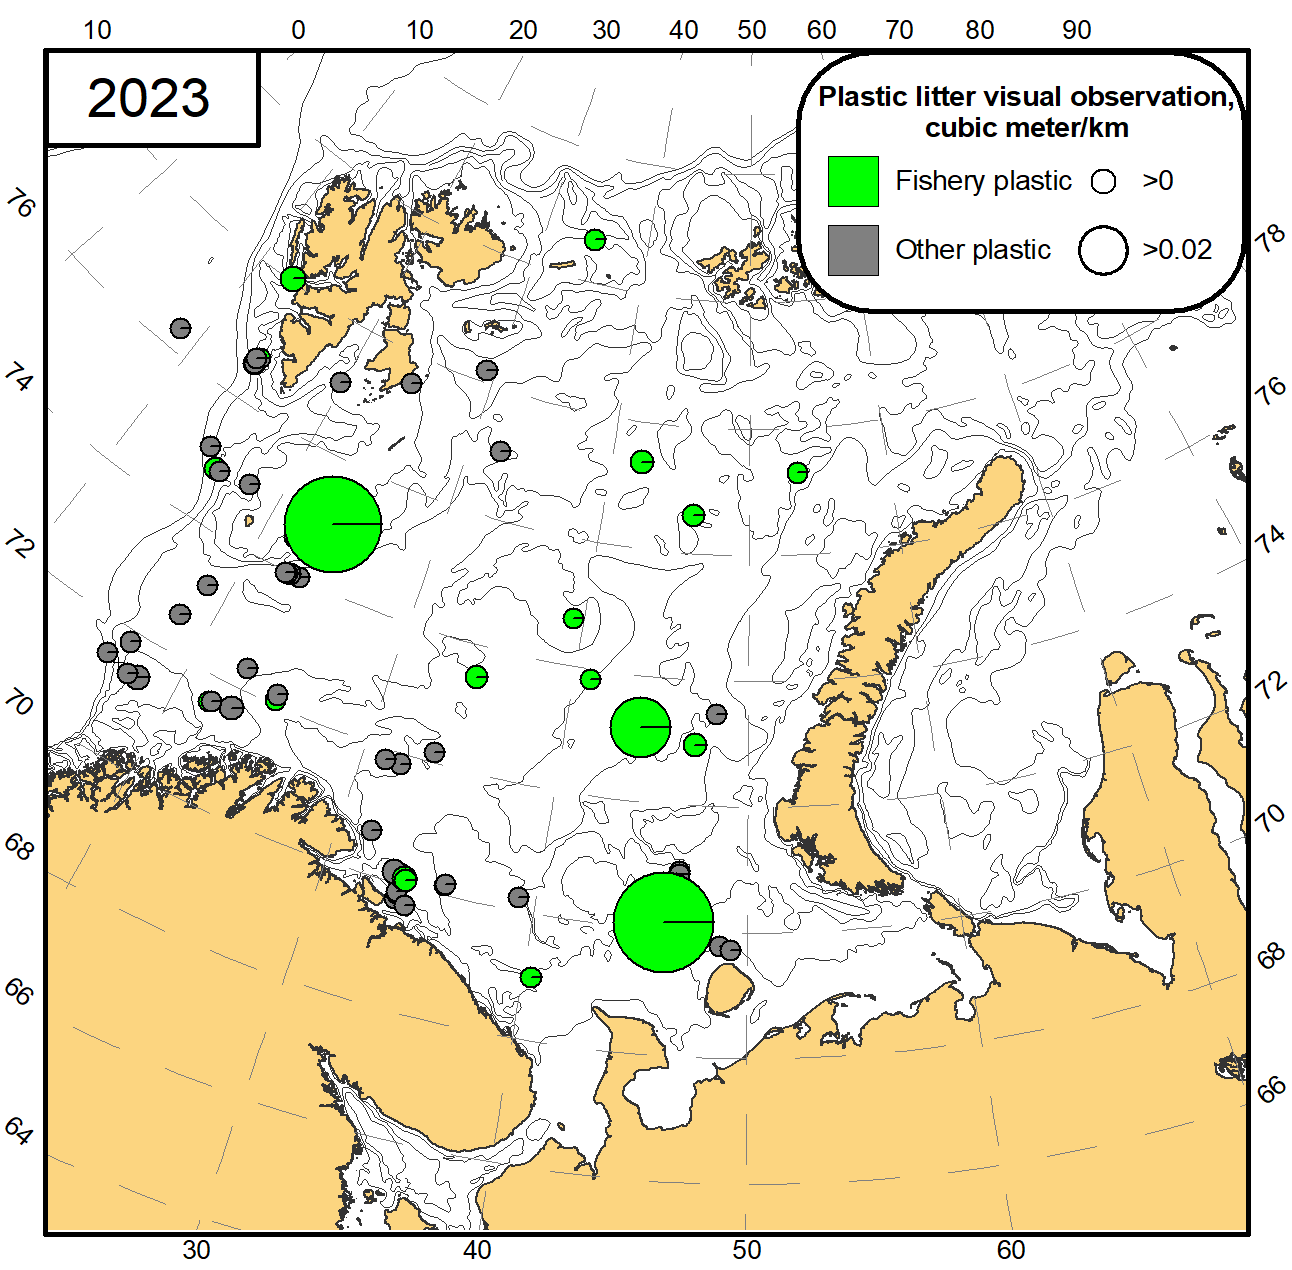
Fishery related litter was recorded in 32.0 % of plastic litter observations at the surface (Fig. 4.2.1.2). Fishery related litter was represented by ropes (OSPAR code 31, 32), pieces of net (OSPAR code 115, 116) and floats/buoys (OSPAR code 37). Fishery plastic (maximum and average observations of 0.04 m3/km and 0.005 m3/ km, respectively) was larger than non-fishery plastic (maximum and average observations of 0.002 m3/ km and 0.0002 m3/ km, respectively).
Figure 4.2.1.1 Type of observed anthropogenic litter at the surface in the BESS 2023 (m3/ km, observations outside transect – m3).
Figure 4.2.1.2 Litter observations of plastic at the surface indicated as fishery related and other litter in the BESS 2023 (m3/ km).
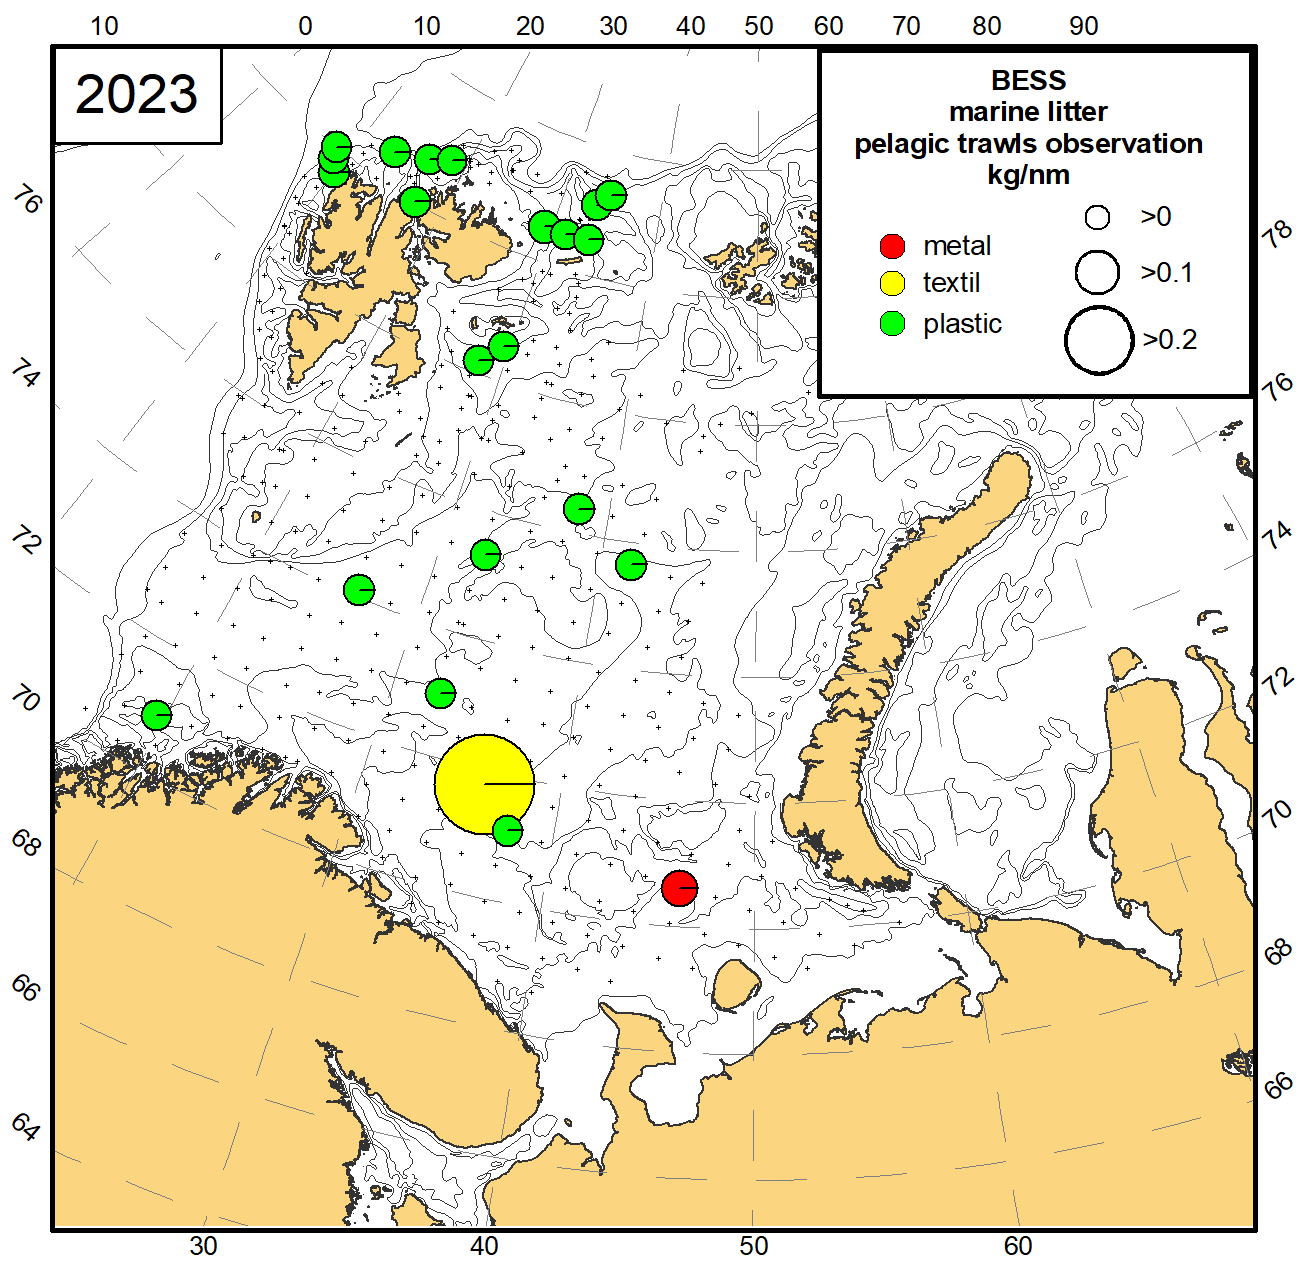
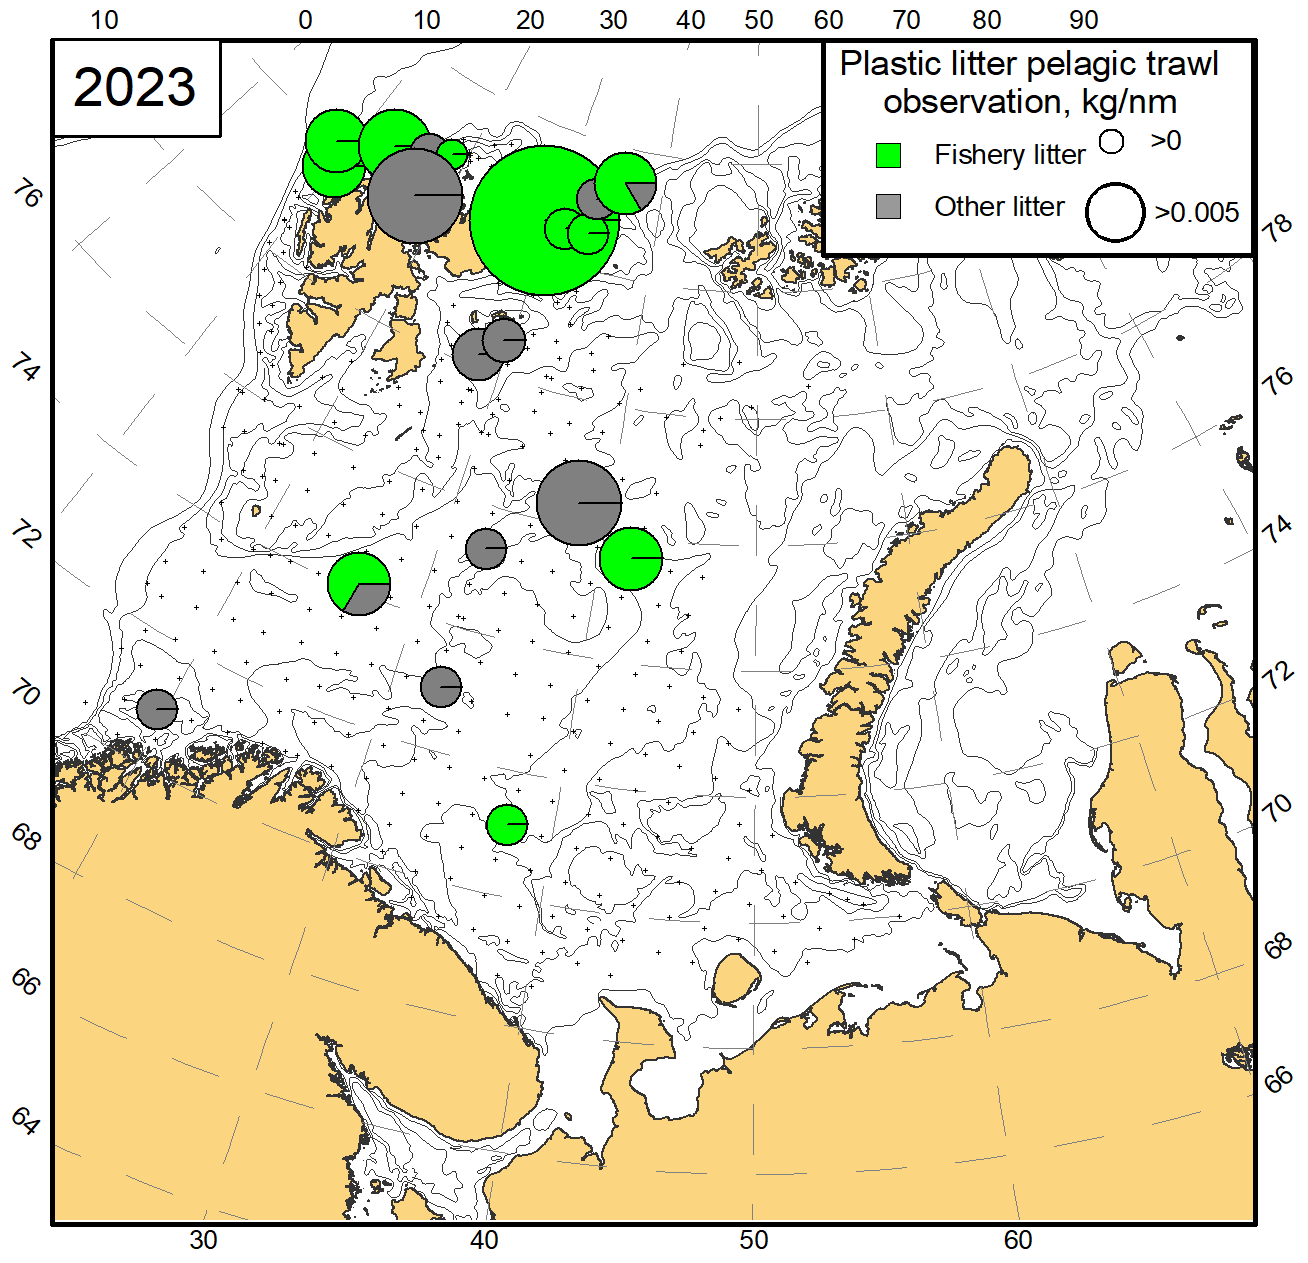
Anthropogenic litter was observed in 6.5 % of pelagic trawl stations (Fig. 4.2.1.3). Plastic was the most frequent material type observed in pelagic trawls and constituted 91.3 % of the observations. Weight of plastic litter from pelagic trawls varied from 0.0001 kg/nm to 0.011 kg/nm, with an average of 0.003 kg/nm. Considering the low catchability by pelagic trawl for low-density polymers, the total amount could be much higher. From two stations either textile or metal were observed.
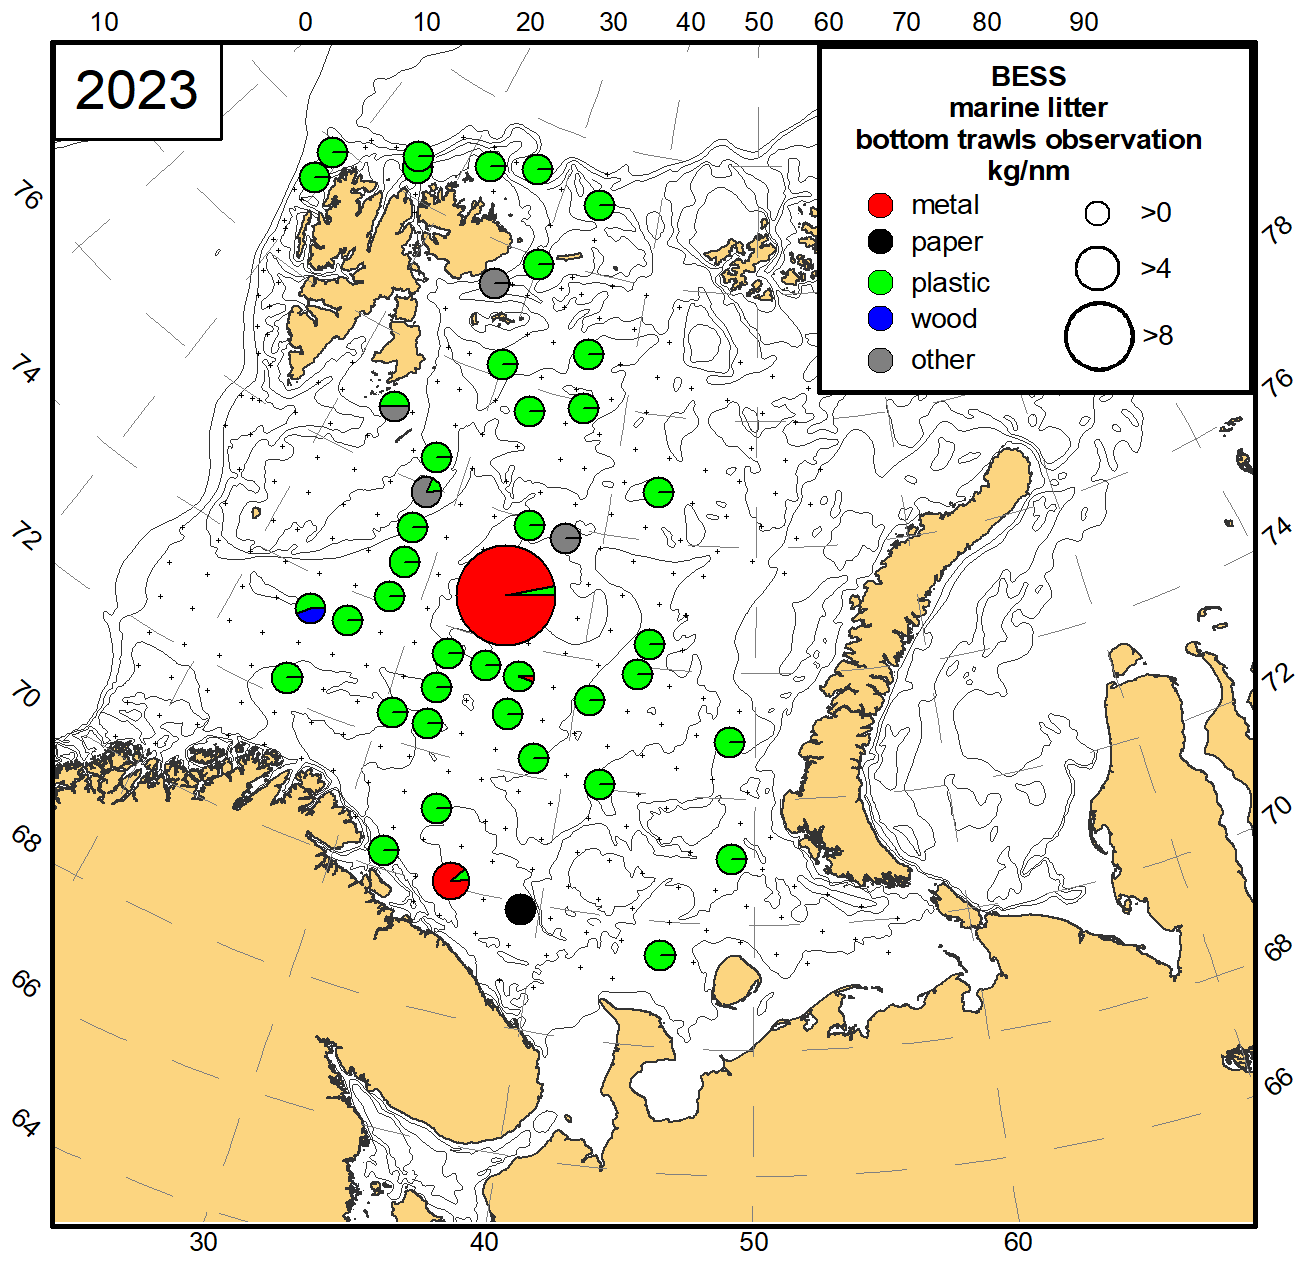
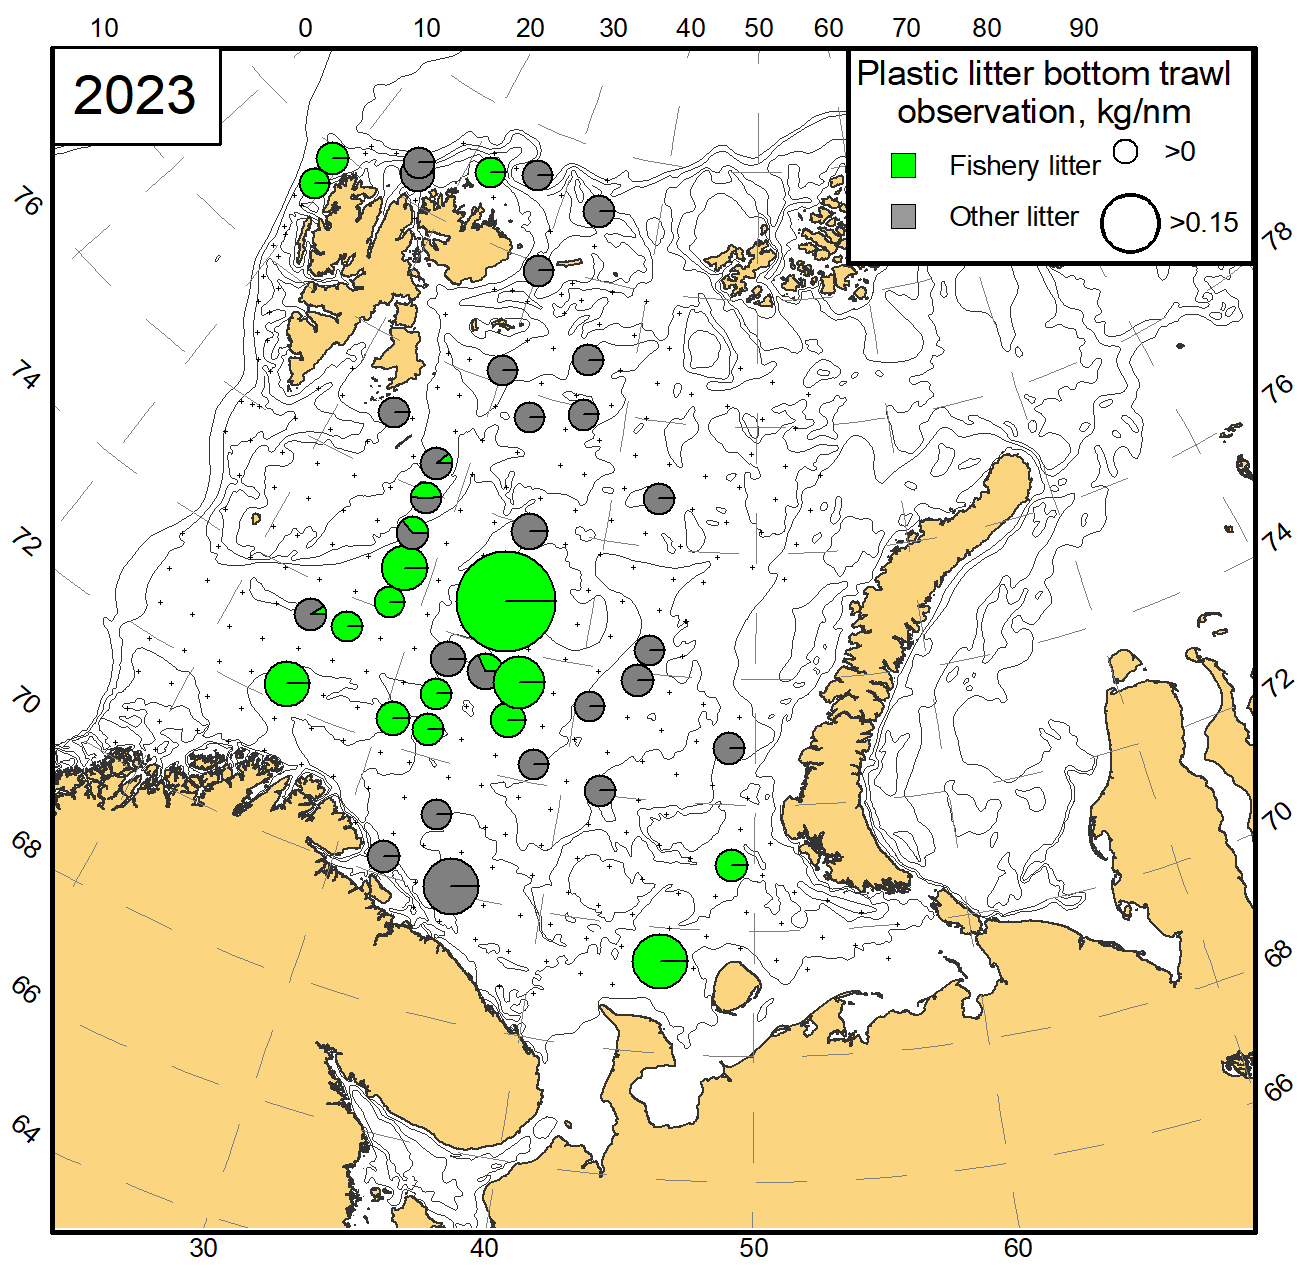
From the bottom trawls, 14.2 % of the stations contained l (Fig. 4.2.1.4). Plastic was the most frequently observed material in the bottom trawls (93.5 % of stations with observed litter). Weight of plastic litter in bottom trawls varied from 0.001 kg/nm to 0.365 kg/nm, with an average of 0.03 kg/nm. Other material types of litter (processed wood, paper and metal) were observed singularly.
Fishery related litter constituted 57.1 % of registrations from pelagic trawls and 48.8 % of registrations from bottom trawls (Fig. 4.2.1.5).
Figure 4.2.1.3 Type of anthropogenic litter collected in the pelagic trawls (kg/nm) in the BESS 2023 (crosses – pelagic trawl stations).
Figure 4.2.1.4 Type of anthropogenic litter collected in the bottom trawls (kg/nm) in the BESS 2023 (crosses – bottom trawl stations).
Figure 4.2.1.5 Fishery related plastic observation versus other plastic litter collected in the pelagic (the upper figure) and bottom trawls (the lower figure) in the BESS 2023 (kg/nm, crosses – trawl stations).
5 Plankton Community
Author(s):
Espen Bagøien
(IMR) and Irina Prokopchuk (VNIRO-PINRO)
5.5 Mesozooplankton biomass and geographic distribution
Figures by E. Bagøien
Mesozooplankton sampling stations during the joint Norwegian-Russian Barents Sea ecosystem cruise in 2023 are shown in Figure 5.5.1. In the Norwegian sector the WP2 net (opening area ~ 0.25 m2) was applied, while in the Russian sector the Juday net (opening area ~ 0.11 m2) was used. Both gears were rigged with nets of mesh-size 180 µm and hauled vertically from near the bottom to the surface. The WP2 and Juday nets provide roughly comparable results with respect to mesozooplankton biomass and species composition (Skjoldal et al., 2019). The Norwegian biomass samples are dried before weighing, while the Russian samples are preserved in 4% formalin and their wet weight determined. Dry-weight is then estimated by dividing the wet-weight with a factor of 5.
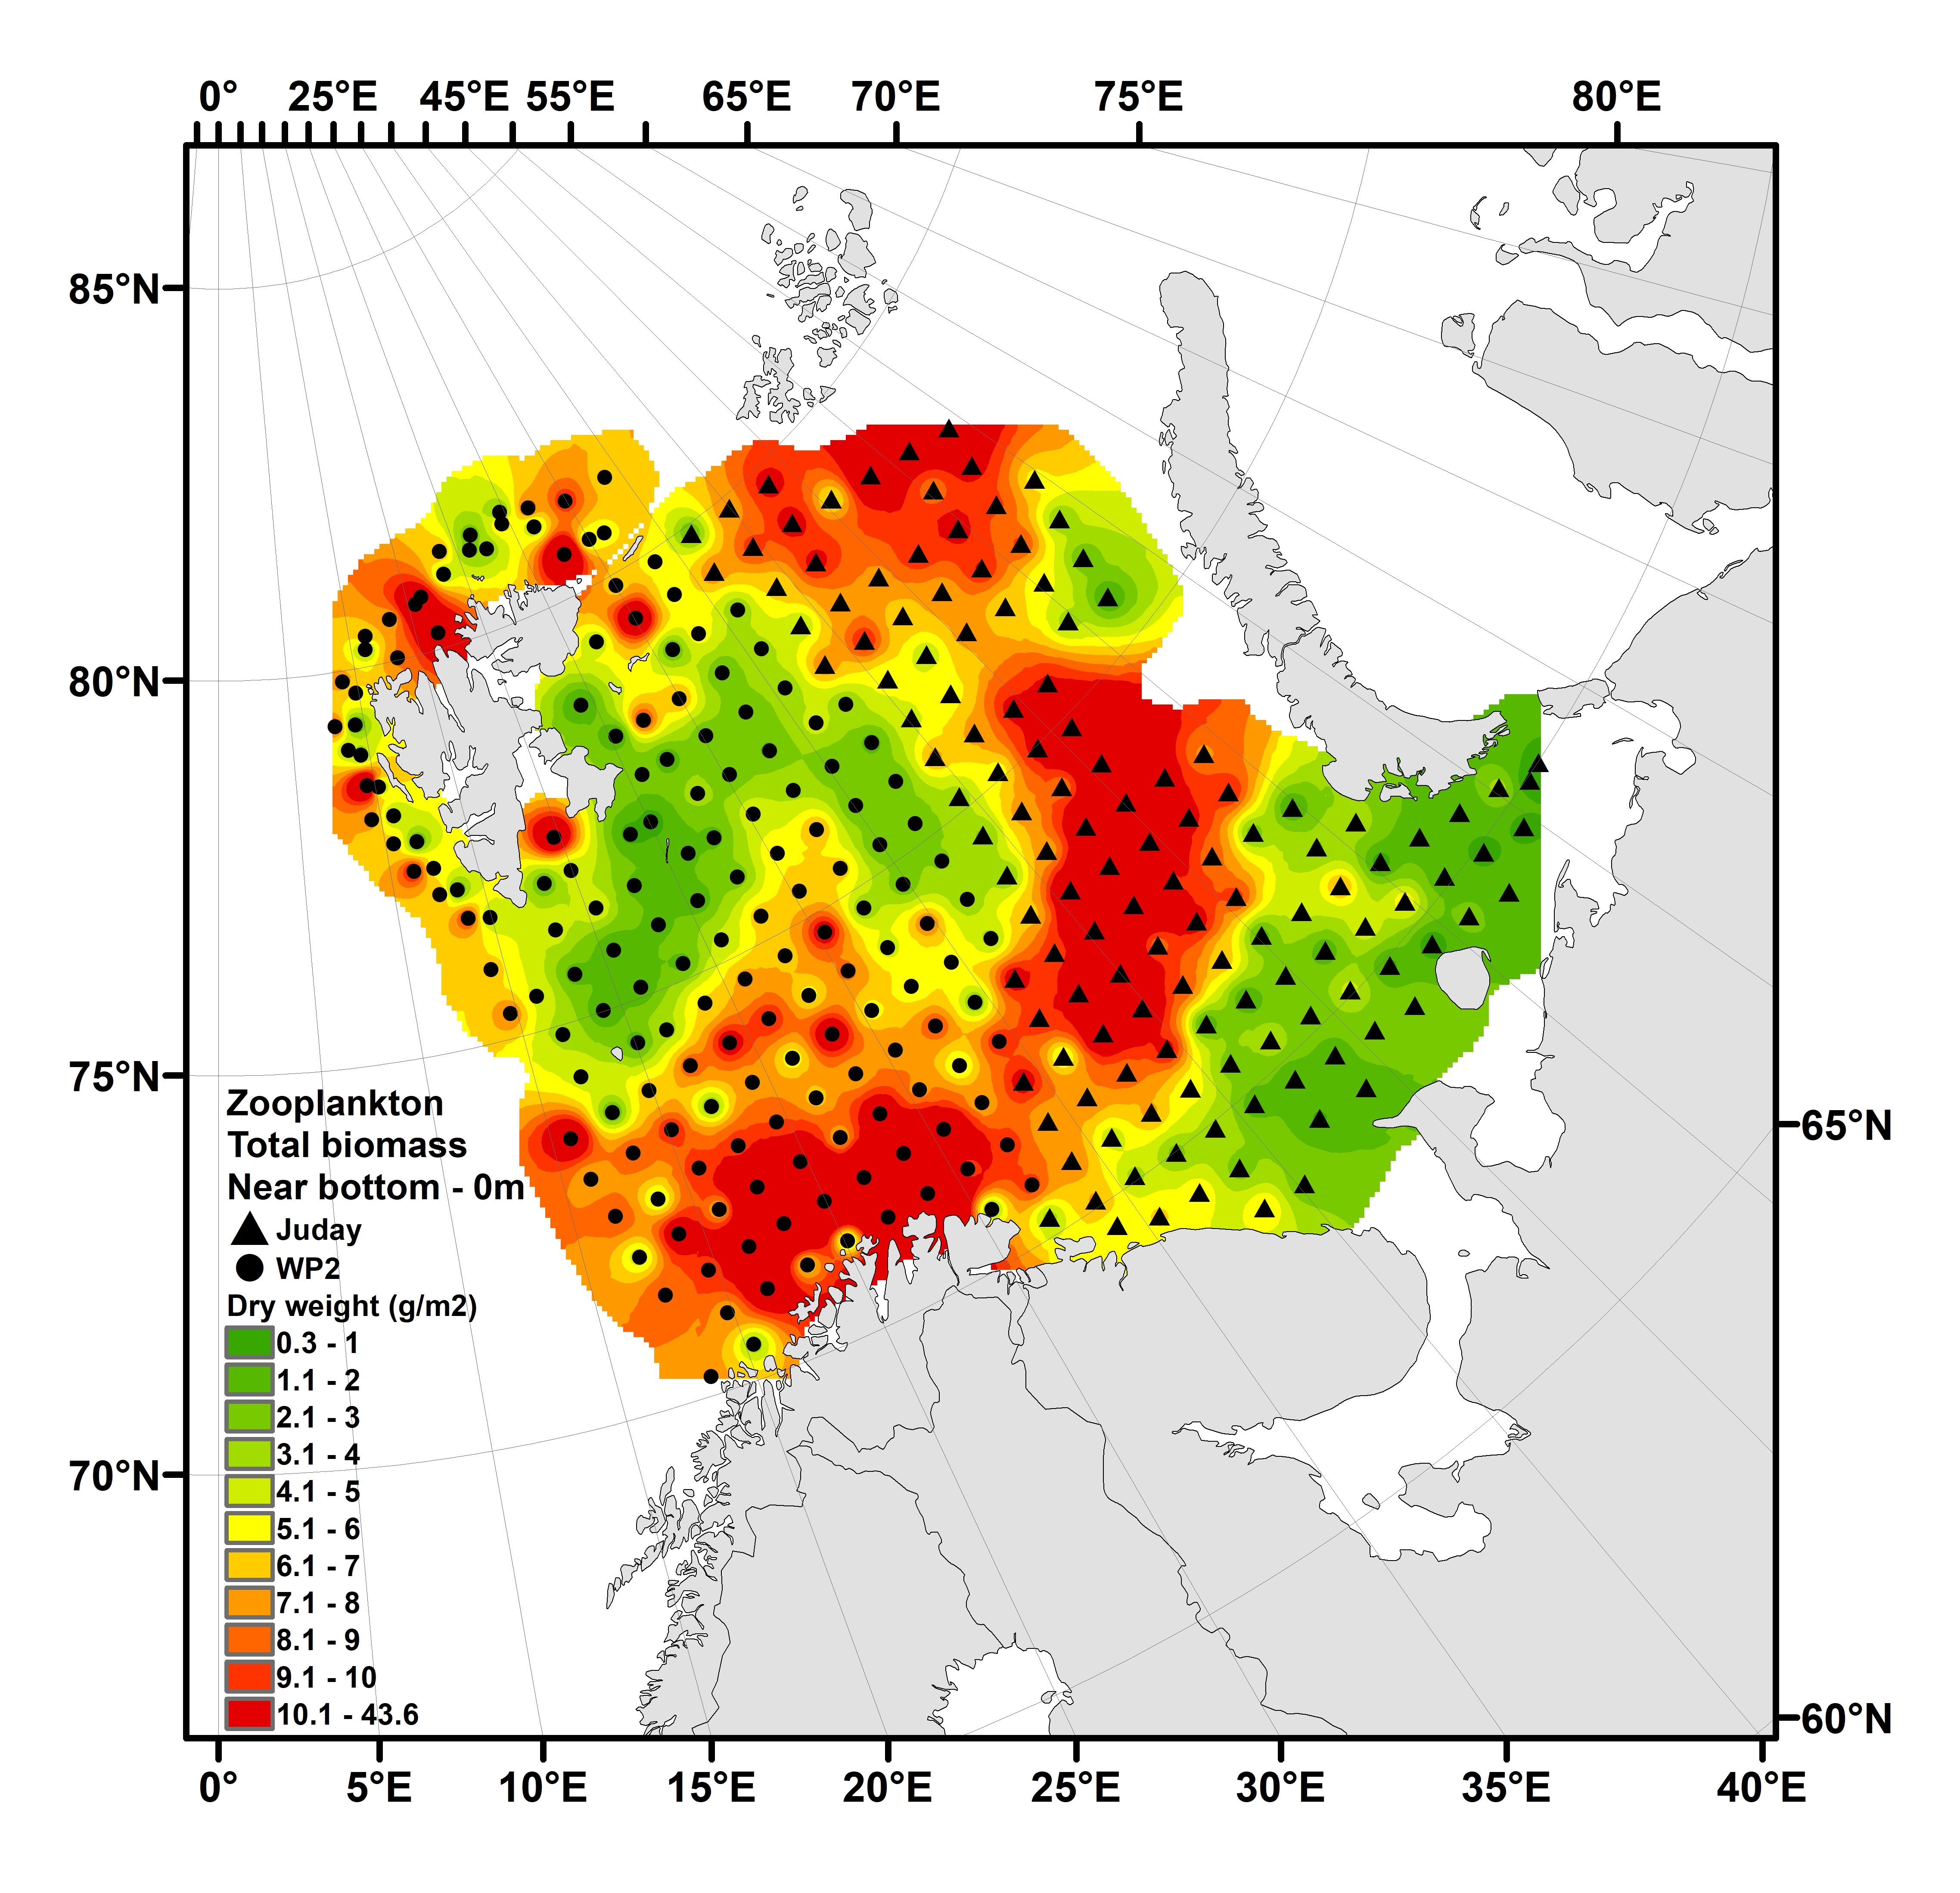
The spatial distribution of total mesozooplankton biomass shown in Figure 5.5.1 is based on a total of 308 stations, of which 172 were located in the Norwegian sector and 136 in the Russian sector. Within the Norwegian sector, the average biomass was 6.5 (± 5.4 SD) g dry-weight m-2. The average zooplankton biomass for the samples within the Russian sector was 6.6 (± 4.3 SD) g dry-weight m-2. All stations shown in Figure 5.5.1 are included in the 2023 biomass averages here presented. Note that 16 stations in the central Barents Sea were sampled both by IMR and PINRO (not shown). In these specific cases the IMR data were excluded from Figure 5.5.1 as well as the calculations of biomass given above.
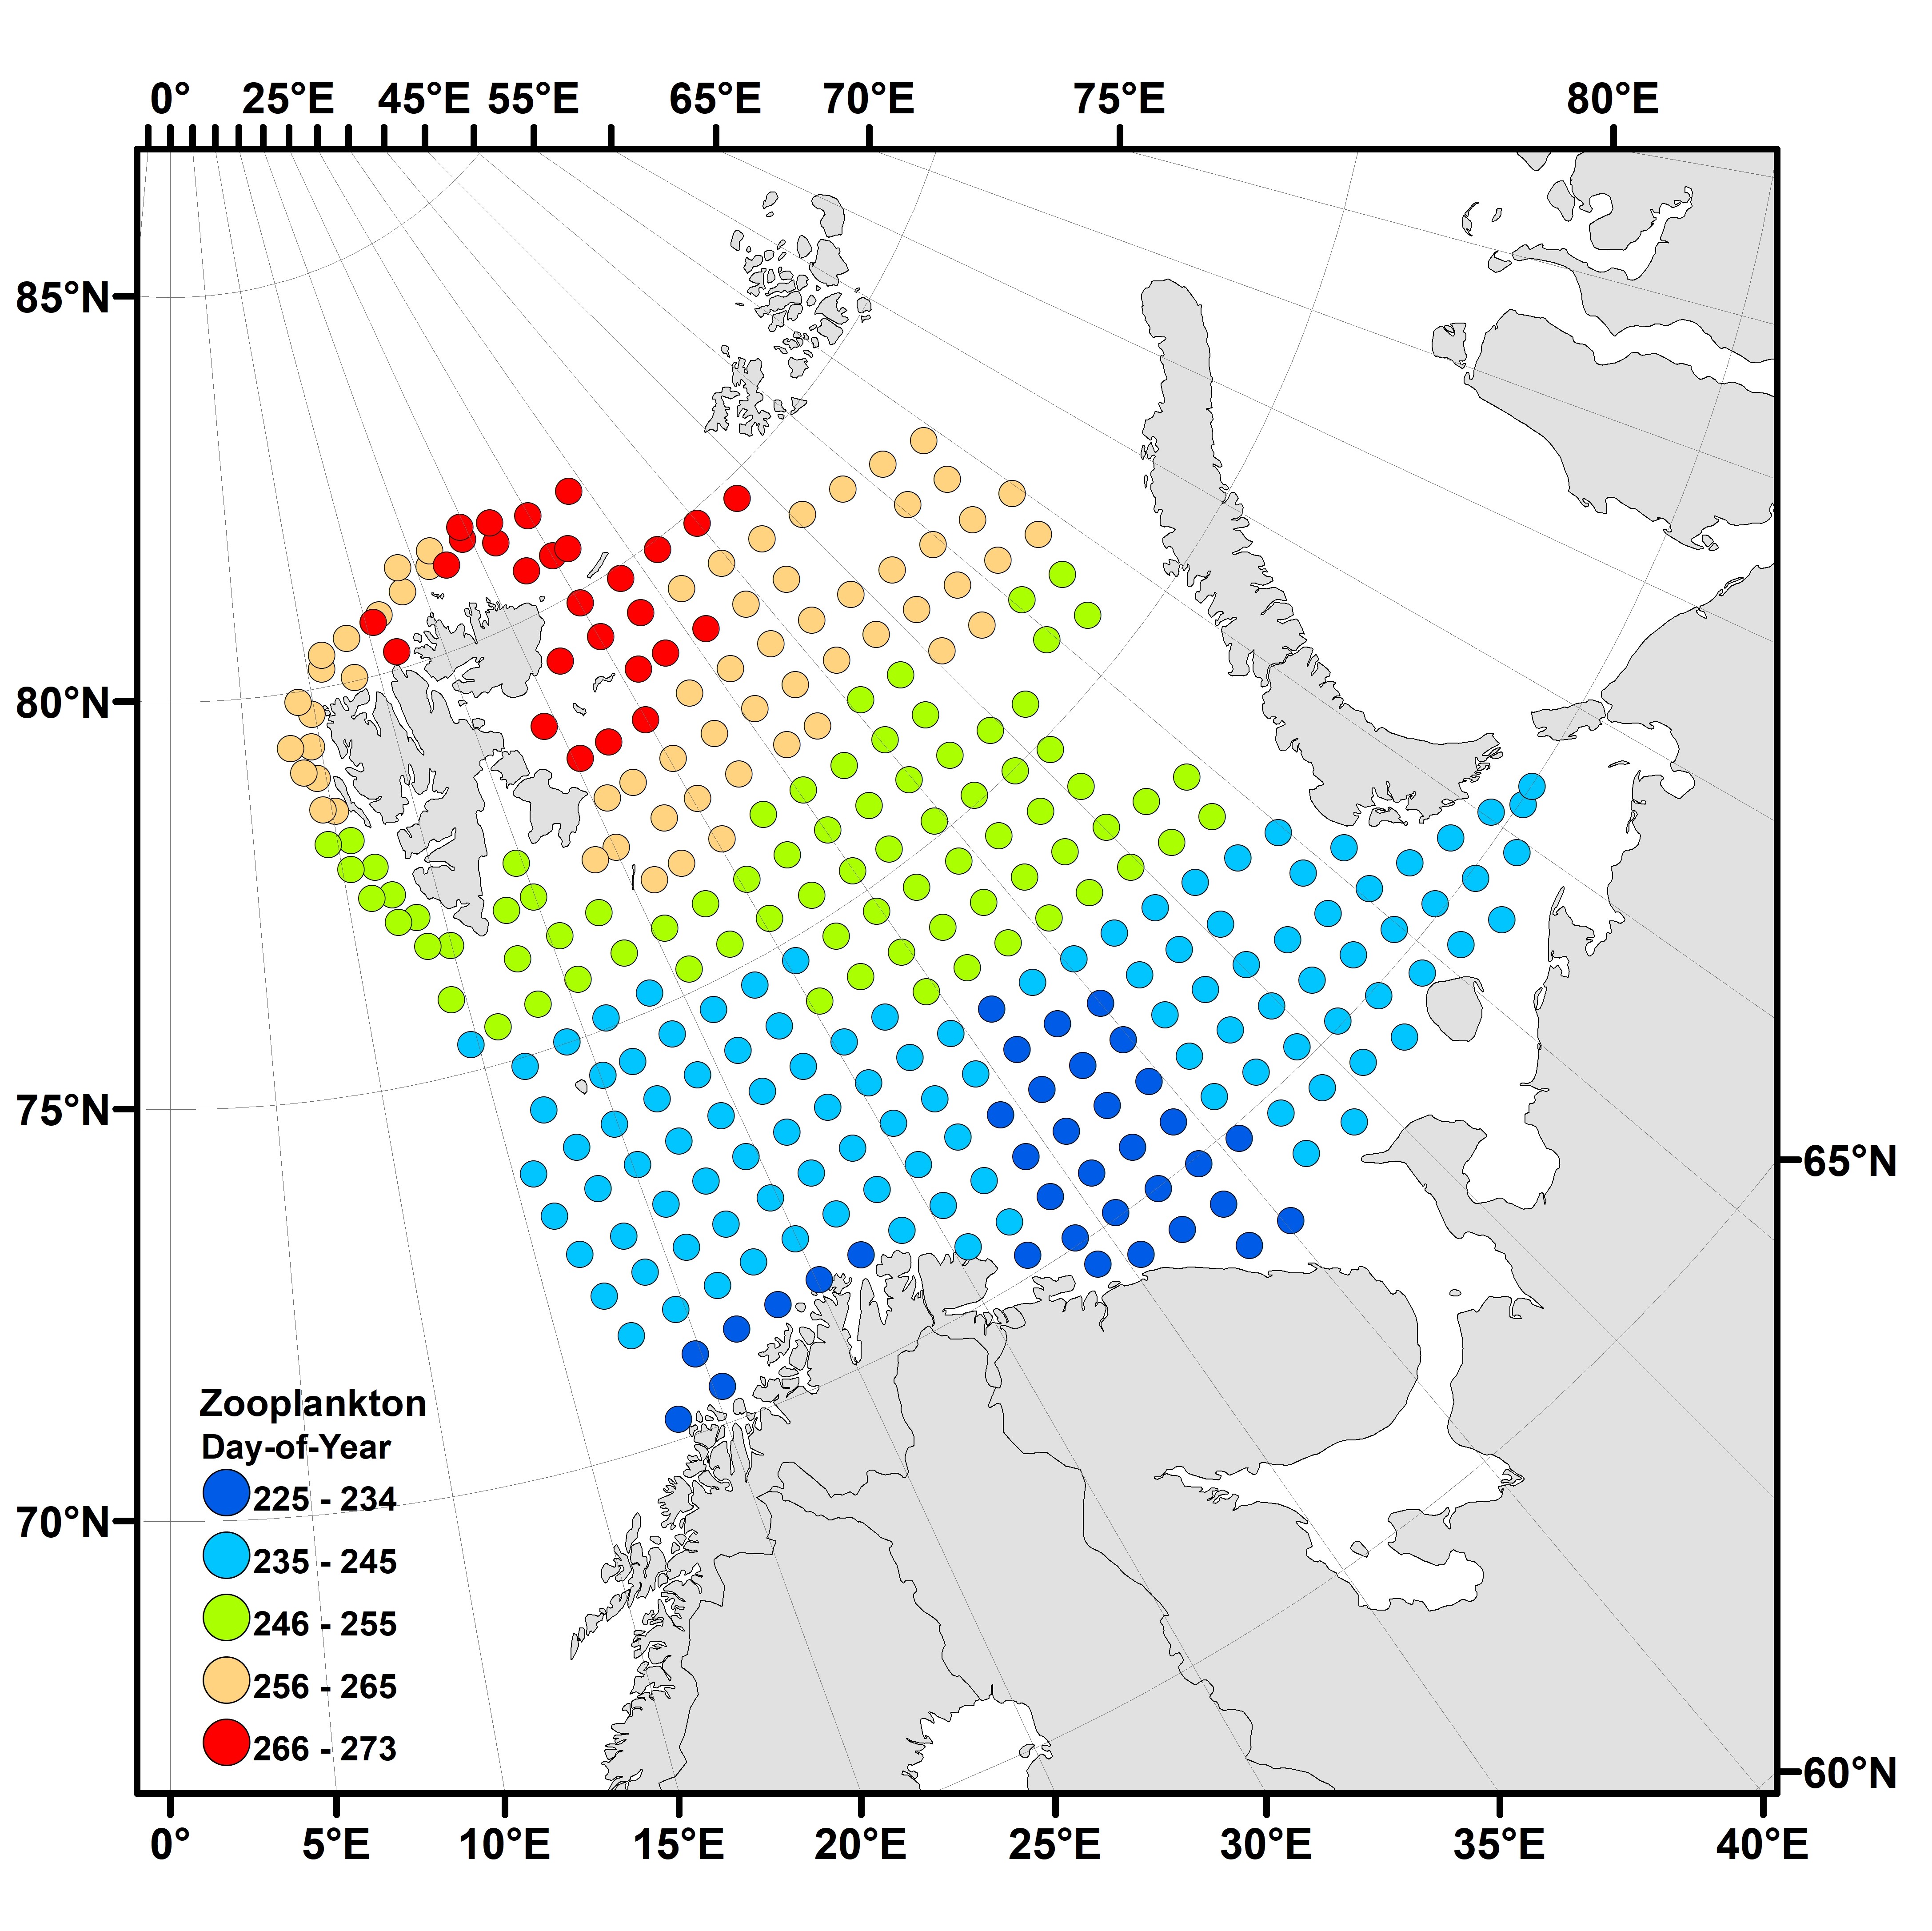
The time-periods for sampling in the Russian (13. Aug - 24. Sep 2023) and Norwegian (20. Aug – 30. Sep 2023) sectors were similar this year (Figure 5.5.2). Comparison of average biomasses across years is vulnerable to differing area coverages. Challenges in covering the same area over a series of years are inherent in such large-scale monitoring programs, and interannual variation in ice-cover and logistical issues are two of several reasons for this. To improve the regularity of the sampling grid across the survey area in 2023, most stations belonging to the Hinlopen Section north of Svalbard/Spitzbergen as well as the Vardø-North Section were omitted when calculating average biomass (excluded from Figure 5.5.1). Differences in spatial coverage among years, as well as spatial variability in station density within the survey region will impact biomass estimates, and particularly so in an environment characterized by large-scale patterns in biomass distribution.
The overall distribution patterns show similarities across years, although some interannual variability is apparent. In 2023 we observed the familiar pattern of comparatively high biomasses in the southwestern region, and north and north-east of Svalbard/Spitsbergen, as well as the deeper part of the southeastern region. The biomasses were relatively low in the central regions including the bank areas, and very low in the southeastern corner of the Barents Sea and near Novaja Zemlja (Figure 5.5.1).
Figure 5.5.1. Distribution of total zooplankton biomass (g dry-weight m-2) from near-bottom to surface in the Barents Sea during BESS 2023 - based on a total of 308 stations. The data visualized were collected by WP2 and Juday nets with mesh-size 180 µm. Interpolation was made in ArcGIS v.10.8, module Spatial Analyst, using inverse distance weighting (IDW).
Such challenges fall outside the scope of this cruise-report, but are addressed in other fora, for instance by analysing time-series within spatially consistent sub-areas.
Figure 5.5.2. Day-number in the year for sampling of mesozooplankton with WP2 and Juday nets in the Barents Sea during BESS 2023. Visualization made in ArcGIS v.10.8. Note that the largest differences in sampling-time followed the south-north gradient.
6 Fish Recruitment of the Year (BESS report Part 1)
Indices calculated from the ecosystem survey data (not shown here) are used in annual assessments of cod, haddock, the deep-water redfish and Greenland halibut. Data from the ecosystem survey is currently evaluated as part of the process of establishing an assessment model for the wolffish species.
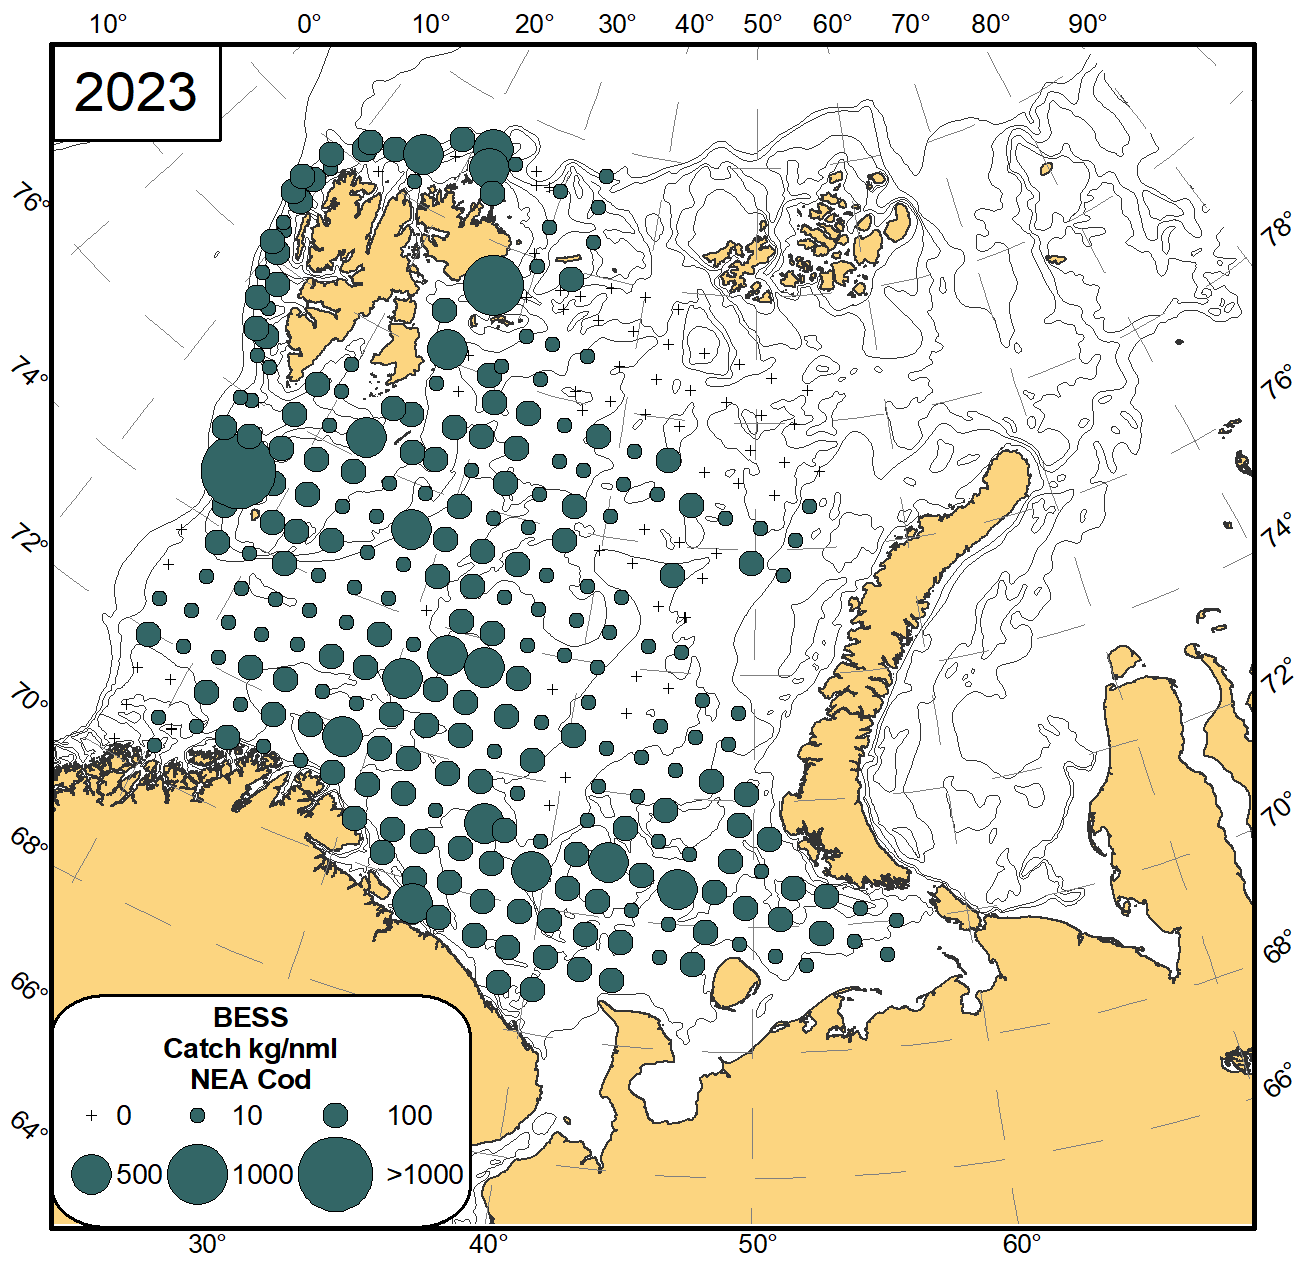
8.1 Cod (Gadus morhua)
At the time of survey cod usually reaches the northern and eastern limits of its feeding area. In general, the cod was distributed almost over the entire area surveyed (Figure 8.1) .
Figure 8.1 Distribution of cod (Gadus morhua), August-November 2023.
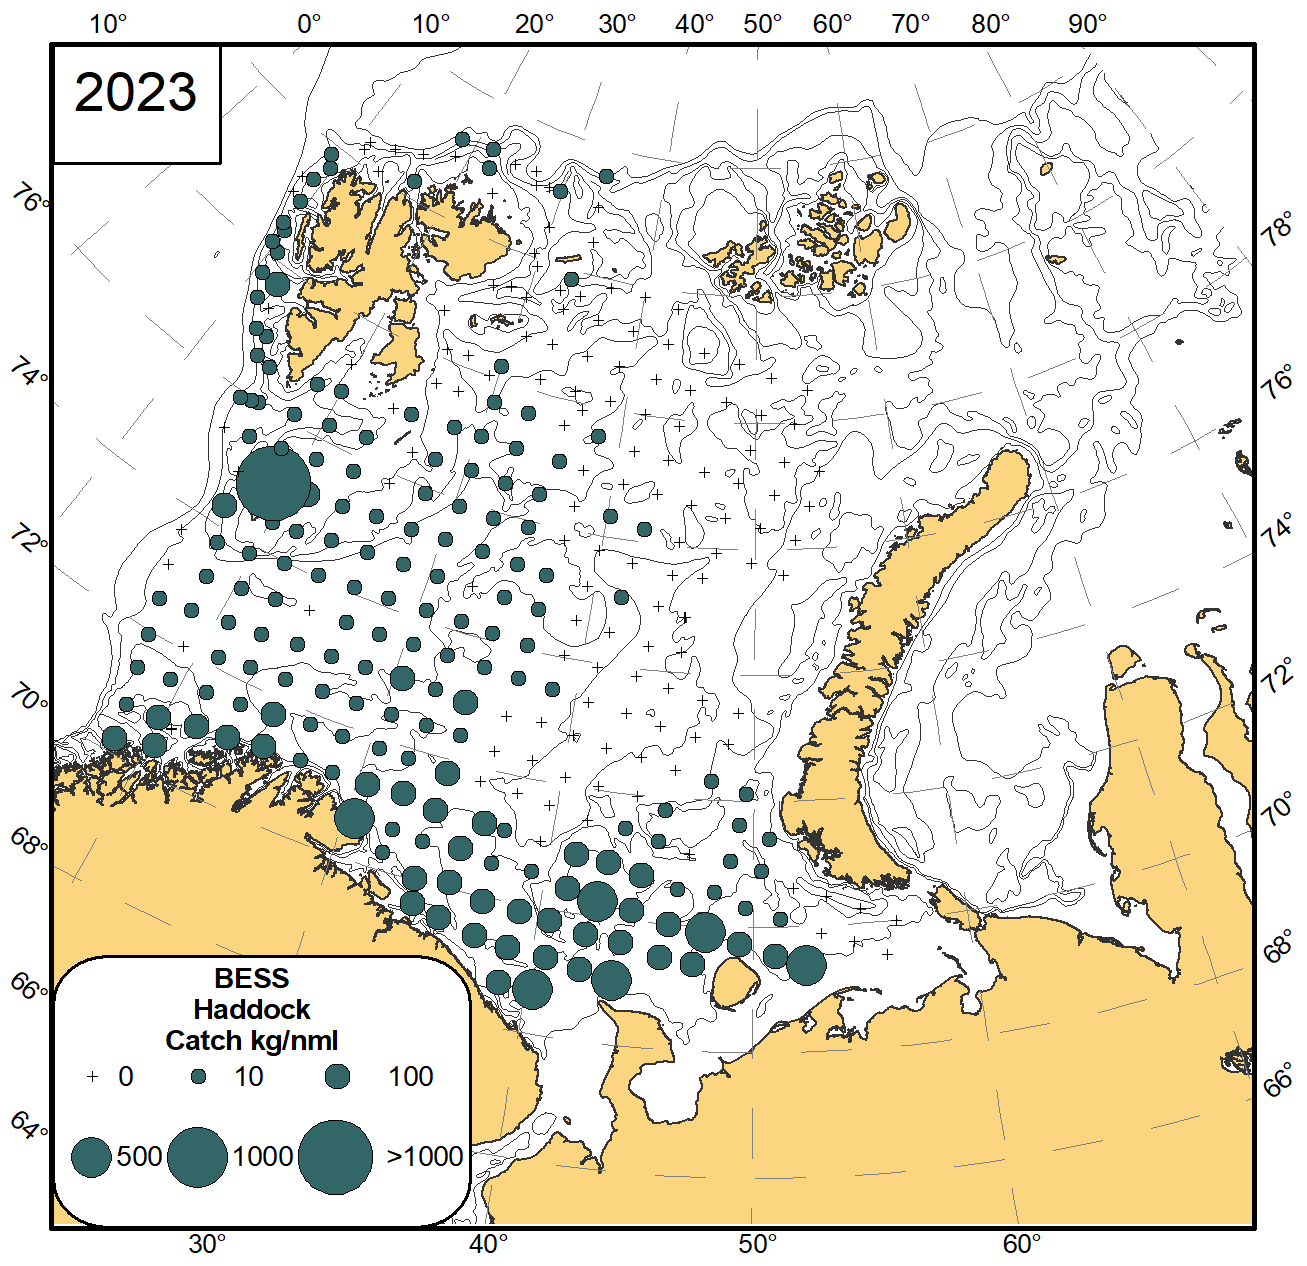
8.2 Haddock (Melanogrammus aeglefinus)
Main concentrations of haddock were found along the along Finnmark and Murman coasts, and in the south-eastern Barents Sea (Figure 8.2). There was a large catch of haddock close to Bjørnøya (Bear Island).
Figure 8.2 Distribution of haddock (Melanogrammus aeglefinus), August-November 2023.
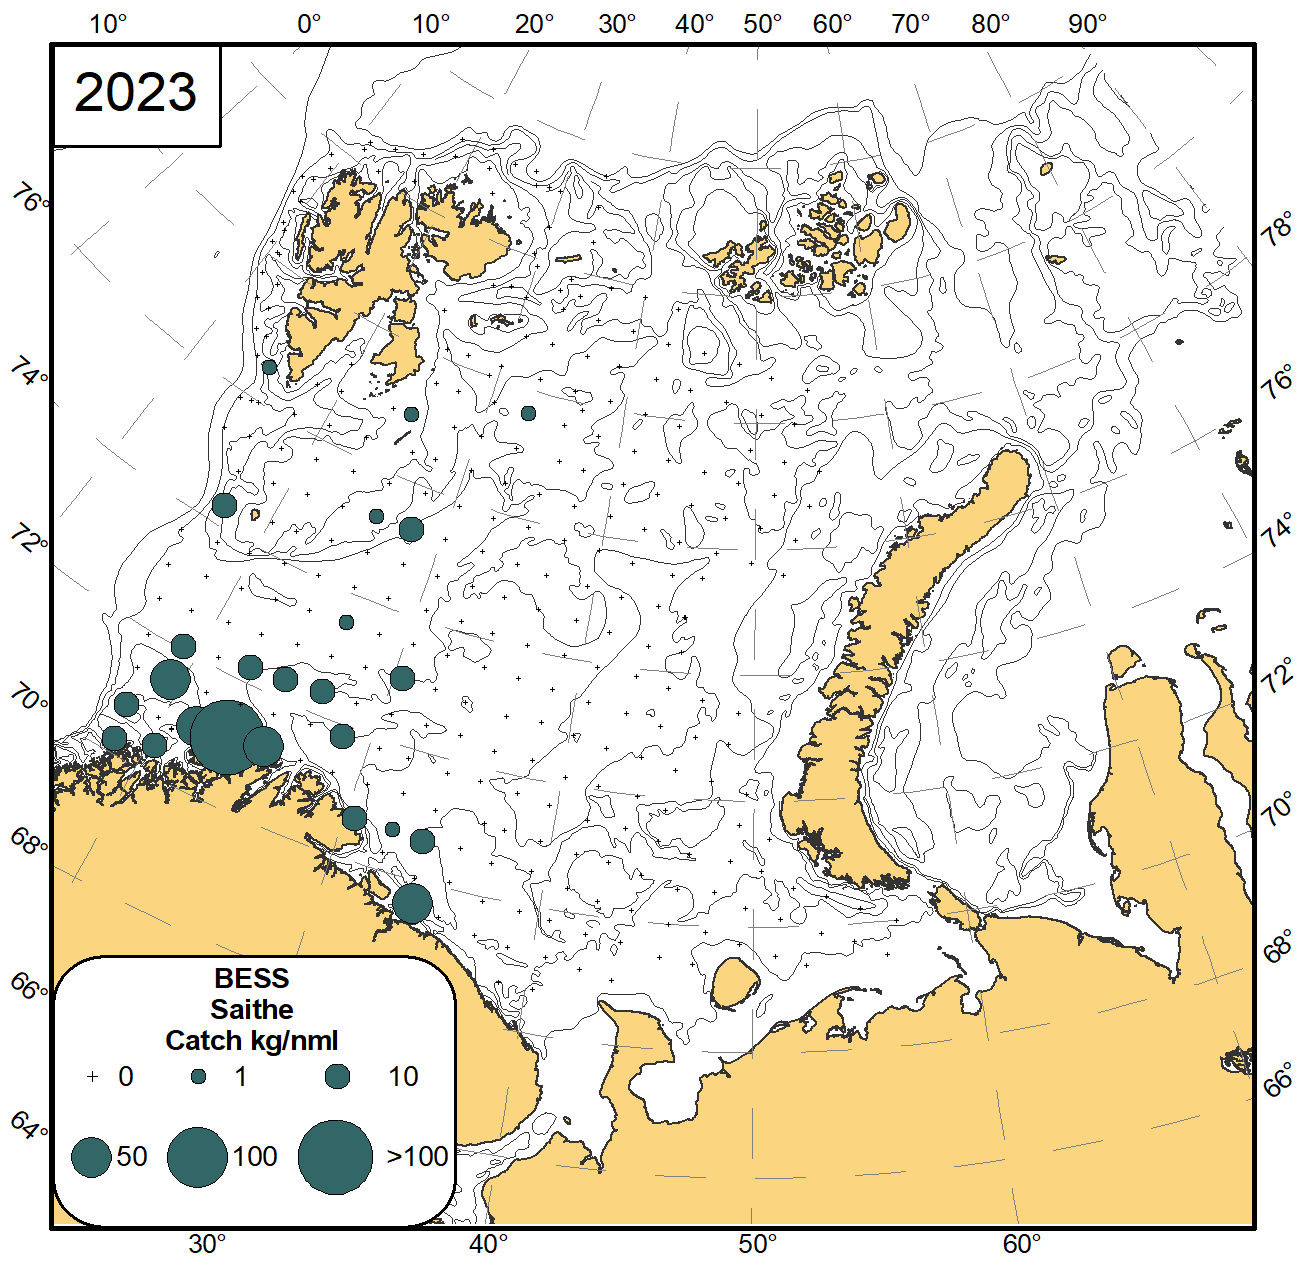
8.3 Saithe (Pollachius virens)
The ecosystem survey only covers a small part of the distribution of saithe and the data is not used for stock assessment. As in previous years, the highest catches were in the south-west and along the Norwegian coast (Figure 8.3), but there were also some scattered catches close to Svalbard/Spitsbergen.
Figure 8.3 Distribution of saithe (Pollachius virens), August-November 2023.
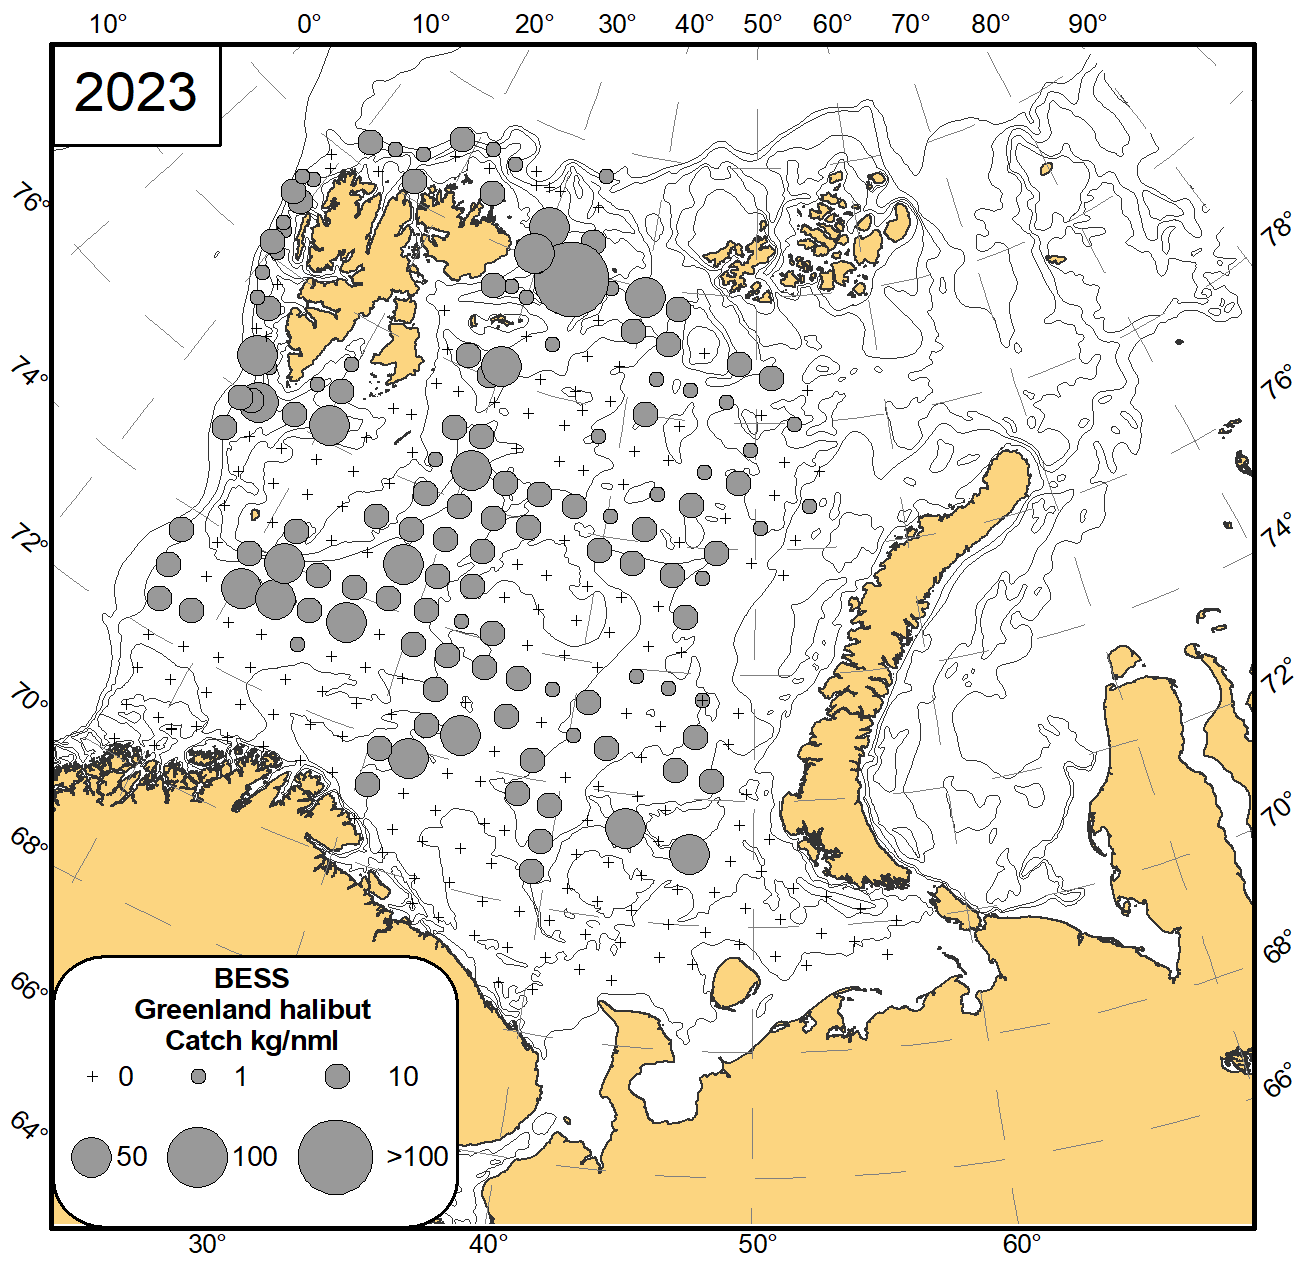
BESS covers mainly an area where young Greenland halibut is found, including nursery areas in the northernmost part. However, in recent years larger Greenland halibut has increasingly been registered in the deep-water central parts of Barents Sea. This affects the stock indices when expressed in biomass. The BESS registrations results in three indices, each divided by sex; one for fish up to 17 cm, one for fish between 18 and 27 cm, and one for fish above 28 cm. Moreover, two trawl indices from surveys that cover deeper waters than BESS, at the continental slope, are also used.
As in previous years, the Greenland halibut was observed in almost all catches in the deep areas of the Barents Sea (Figure 8.4). Compared to last year the distribution pattern was similar. The main concentrations of G. halibut were observed around Svalbard/Spitsbergen, to the west of Franz Josef Land, and in the Bear Island Trench.
Figure 8.4 Distribution of Greenland halibut (Reinhardtius hippoglossoides), August-November 2023.
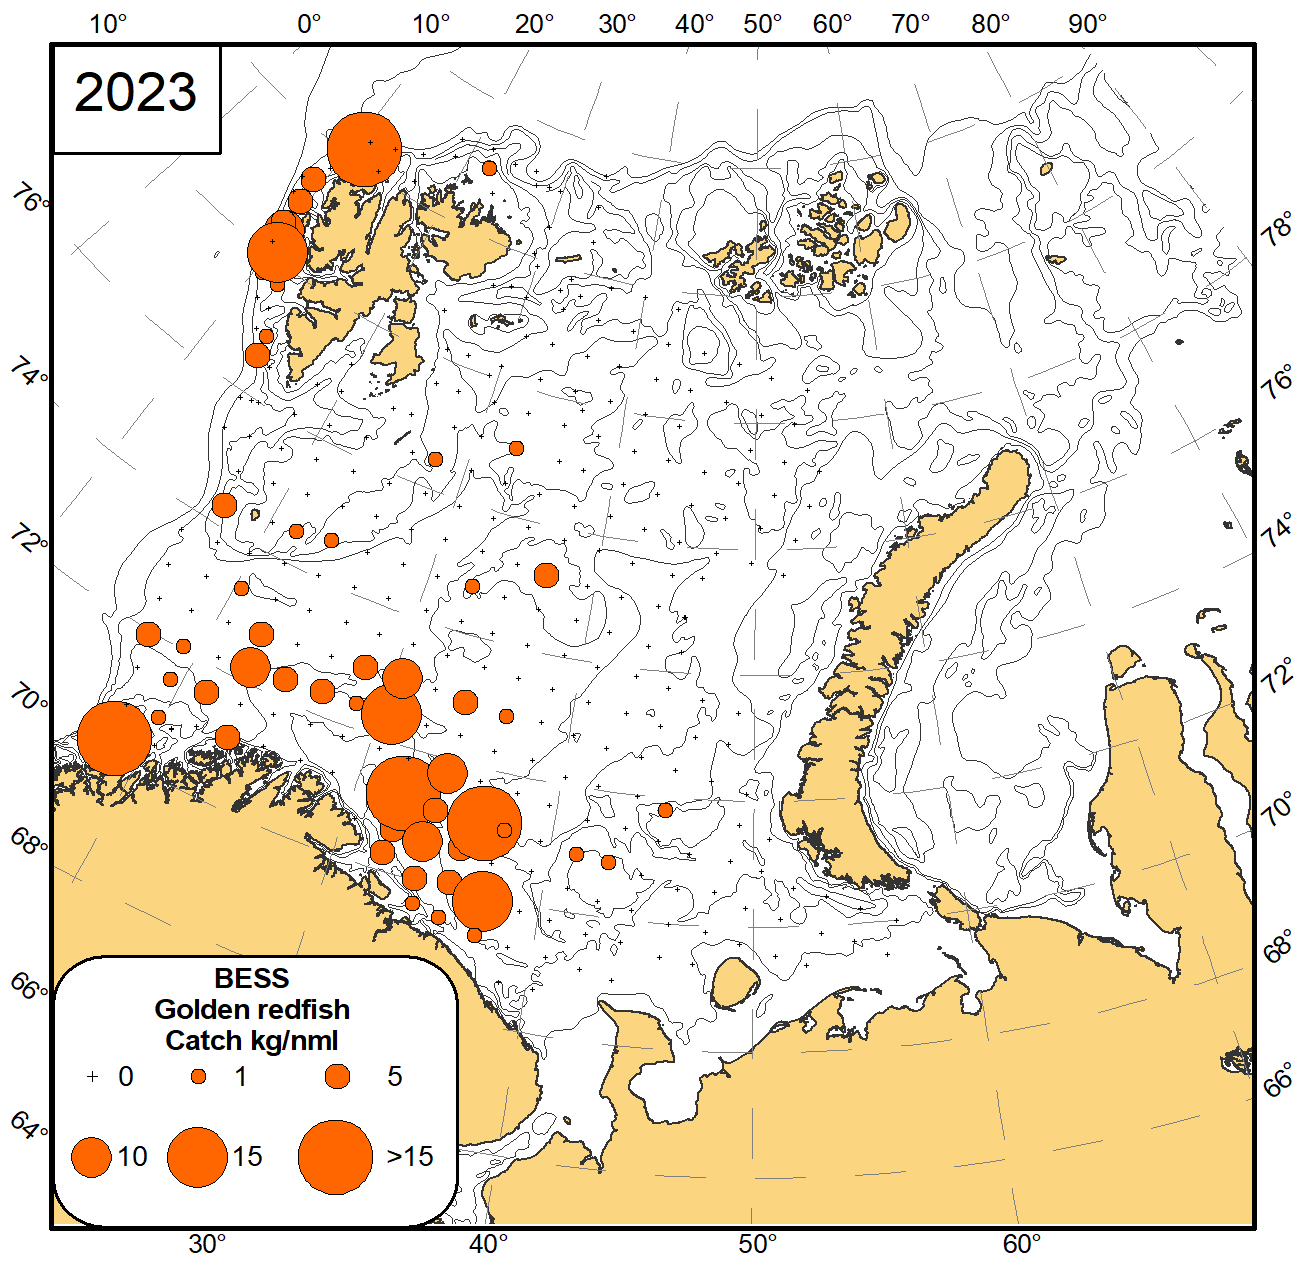
8.5 Golden redfish (Sebastes norvegicus)
Data from the ecosystem survey is not used in the assessment of golden redfish. In 2023, centres of abundance for golden redfish were observed along the coast of the Troms region in Norway and along the Murman coast, with the highest catches in the latter region (Figure 8.5). The distribution north and west of Svalbard was very similar to 2021 and as in earlier years observations in the eastern Barents Sea, were few and of low abundance.
Figure 8.5 Distribution of golden redfish (Sebastes norvegicus), August-November 2023.
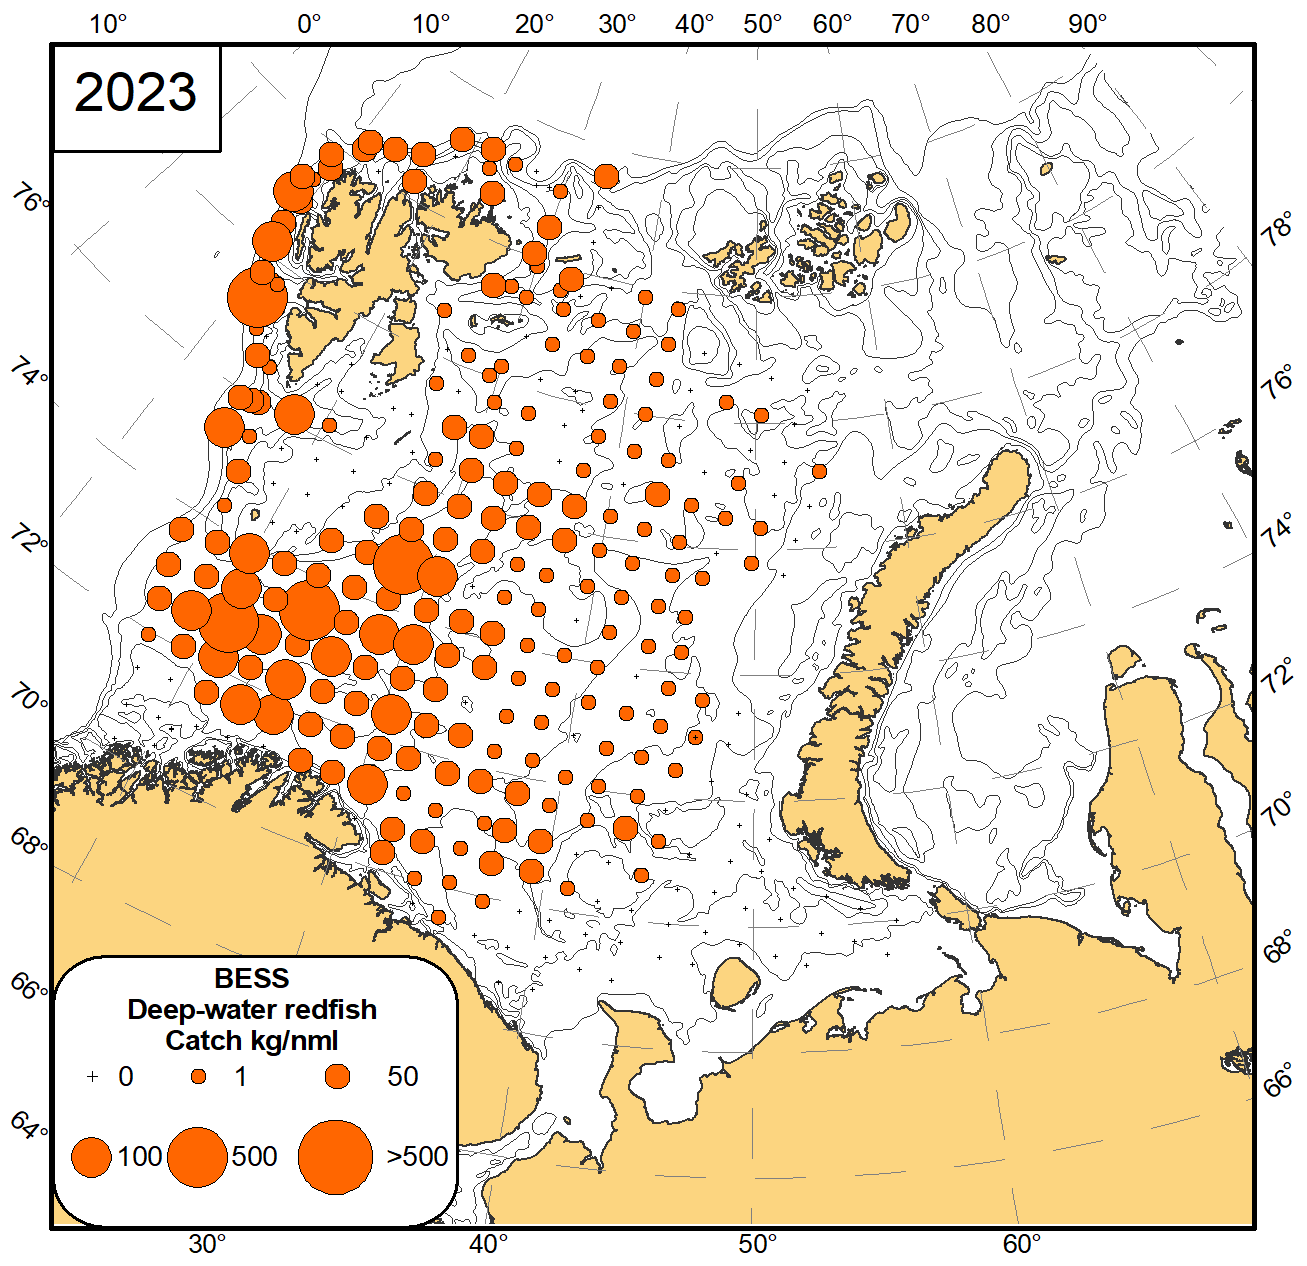
8.6 Beaked redfish (Sebastes mentella)
Data from BESS are used in the assessment of beaked redfish. As in previous years, beaked redfish were only absent from an area north of Bear Island and in the south-eastern part of the Barents Sea (Figure 8.6). The highest catches of beaked redfishwere concentrated in the area south and southeast of Bear Island, particularly along the Bear Island Trench. Moreover, high catches were recorded along the shelf break north of Bear Island and up to Svalbard/Spitsbergen. Catch weight decreased towards the eastern Barents Sea.
Figure 8.6 Distribution of beaked redfish (Sebastes mentella), August-November 2023.
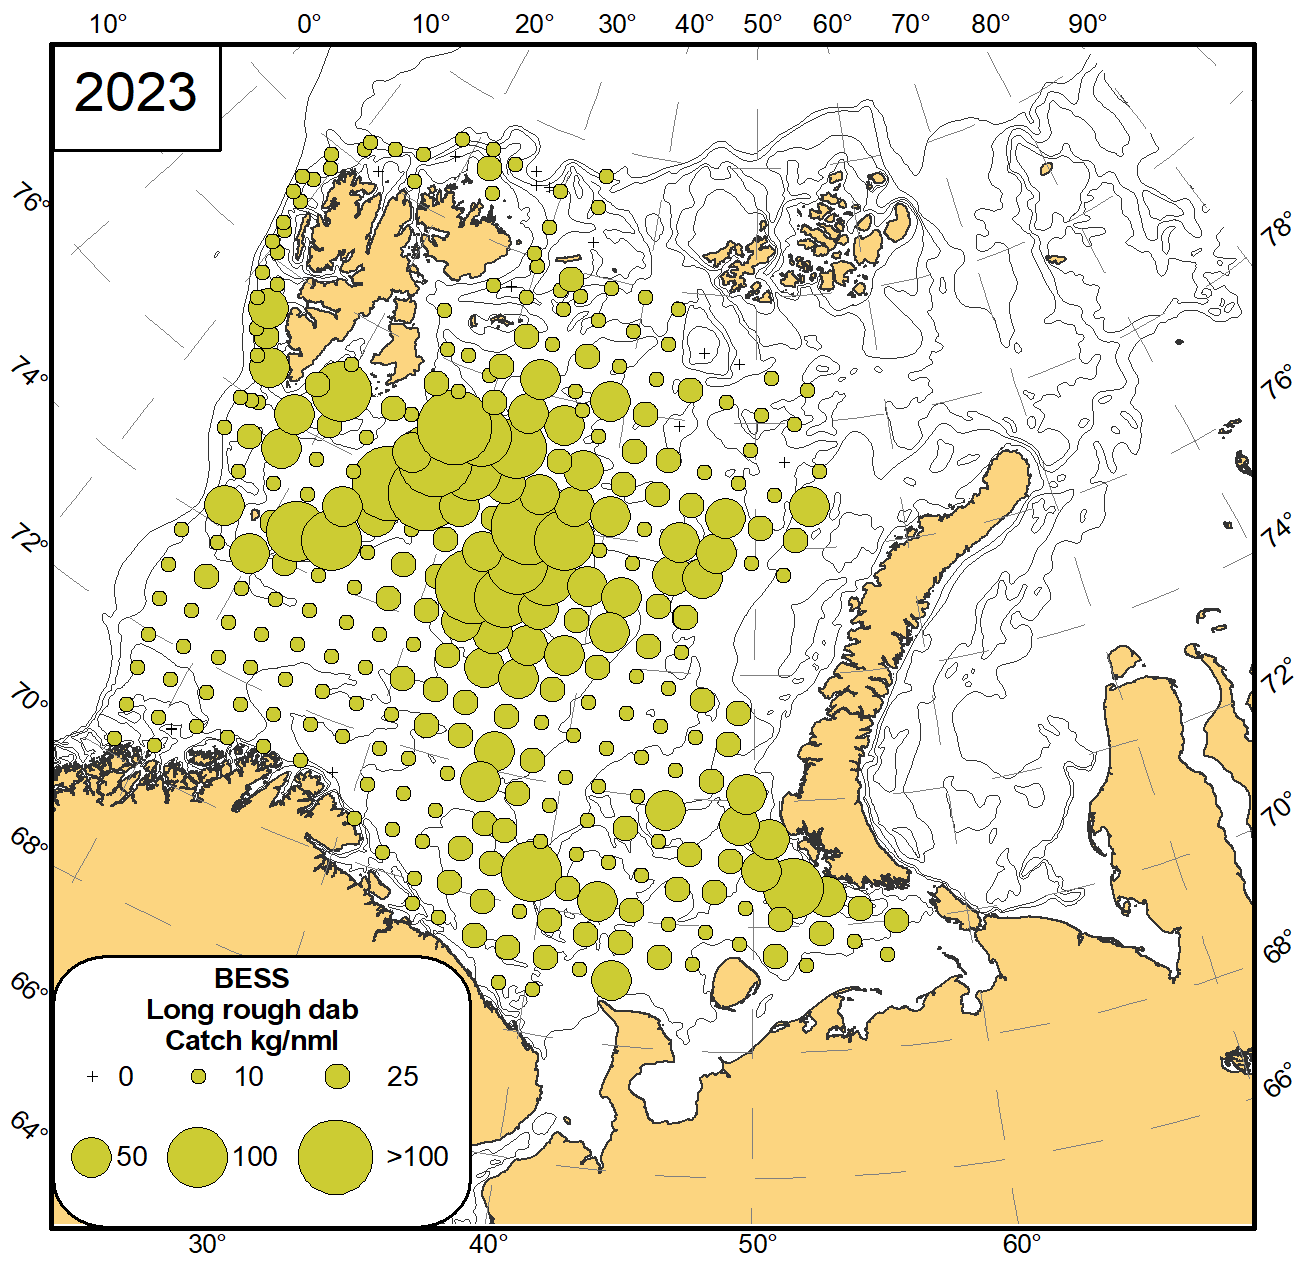
8.7 Long rough dab (Hippoglossoides platessoides)
As usual, long rough dab were found in the entire area surveyed (Figure 8.7). The highest catches were along the slopes of the Svalbard/Spitsbergen and Central Banks.
Figure 8.7 Distribution of long rough dab (Hippoglossoides platessoides), August-November 2023.
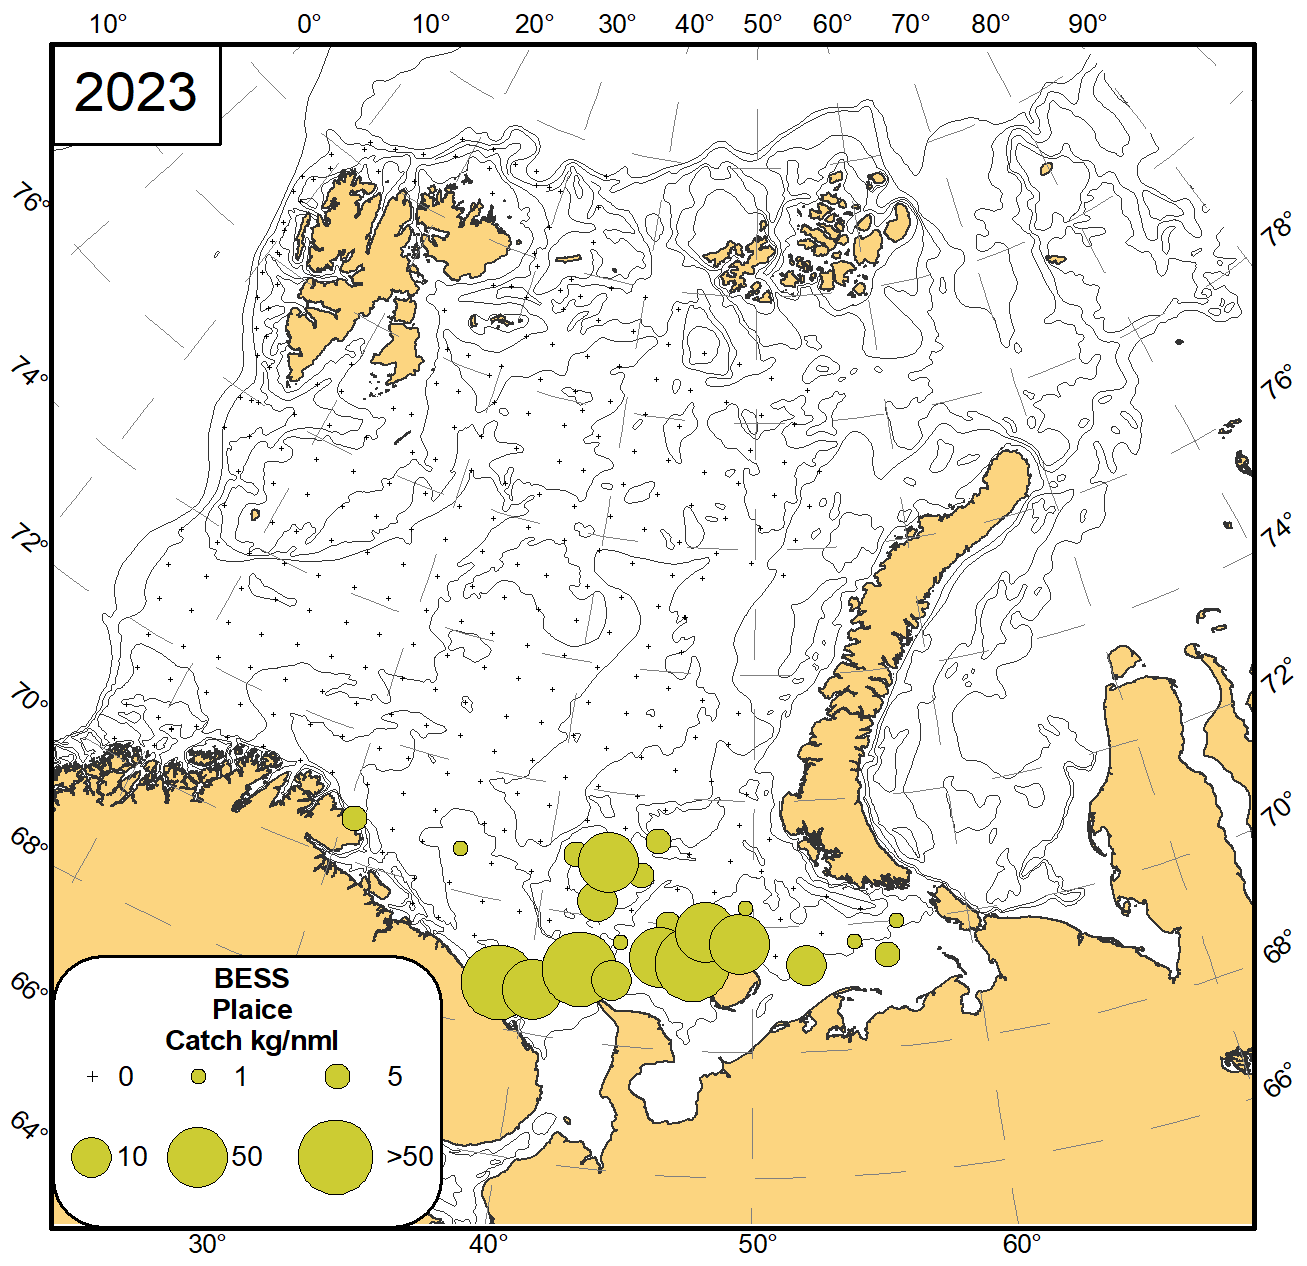
8.8 Plaice (Pleuronectes platessa)
Plaice is mainly found in the southeastern Barents Sea from the coast of Murman to Kolguev Island. (Figure 8.8).
Figure 8.8 Distribution of plaice (Pleuronectes platessa), August-November 2023.
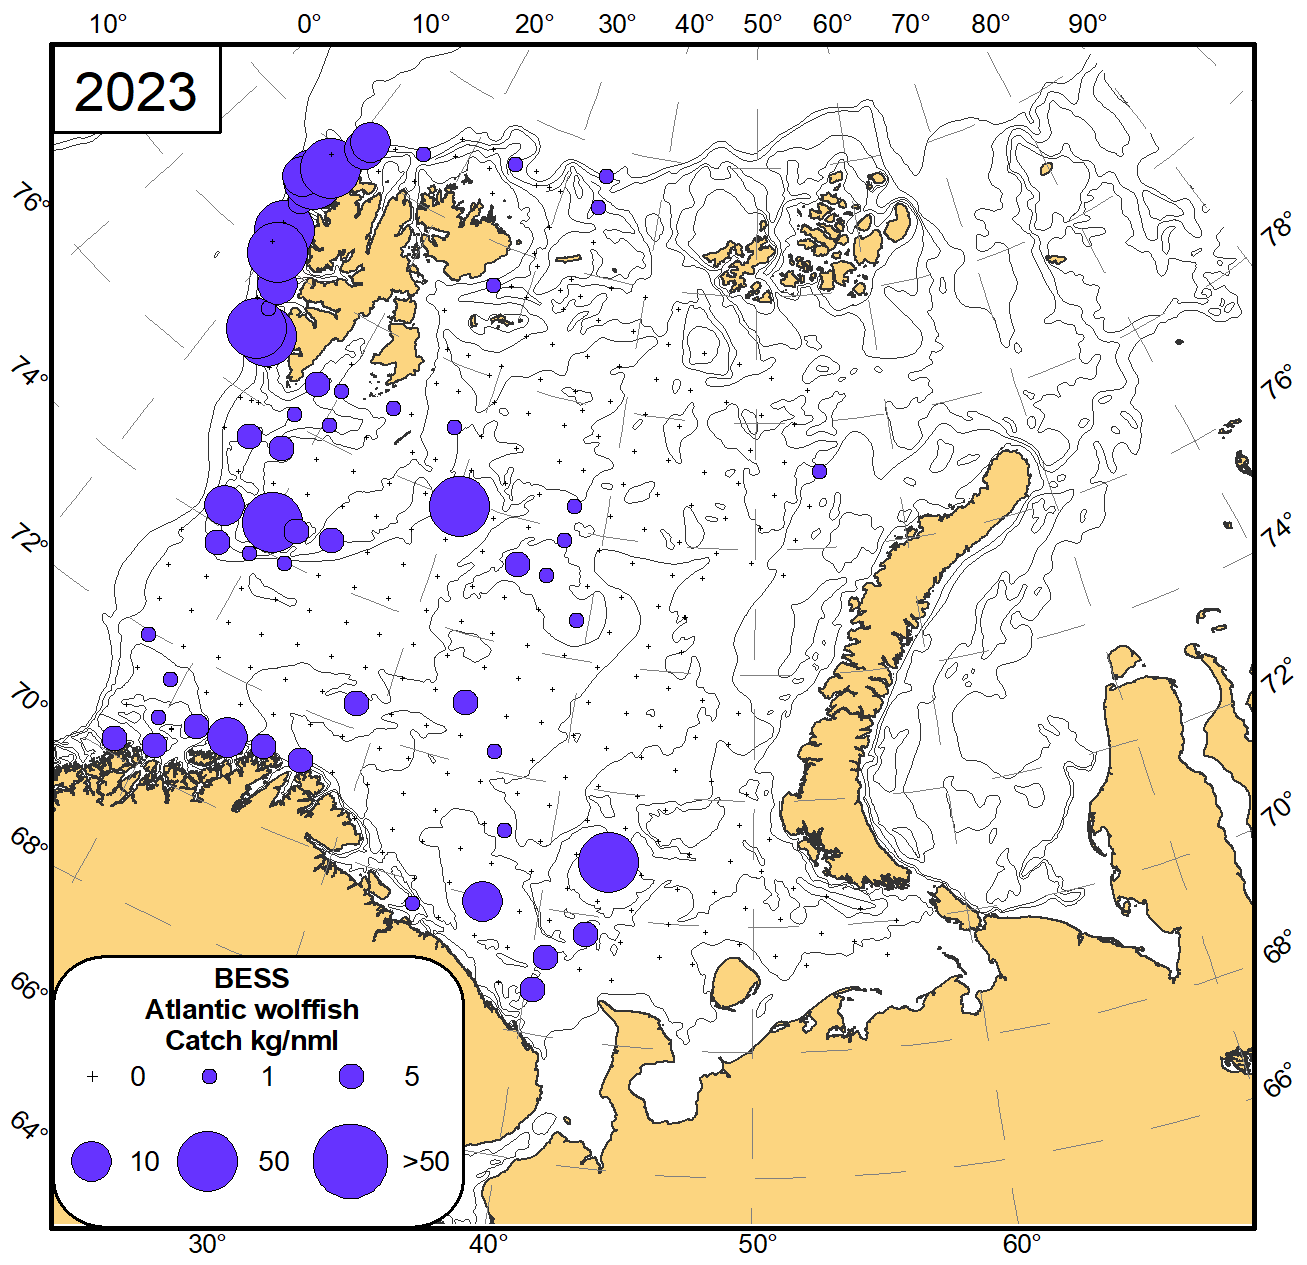
8.9 Atlantic wolffish (Anarhichas lupus)
Atlantic wolffish is the most numerous of the three species of wolffishes inhabiting the Barents Sea, while due to its smaller size has the lowest biomass of the three species. Atlantic wolffish was mainly found in Atlantic water along the western coast of Svalbard/Spitsbergen (Figure 8.9).
Figure 8.9 Distribution of Atlantic wolffish (Anarhichas lupus), August-November 2023.
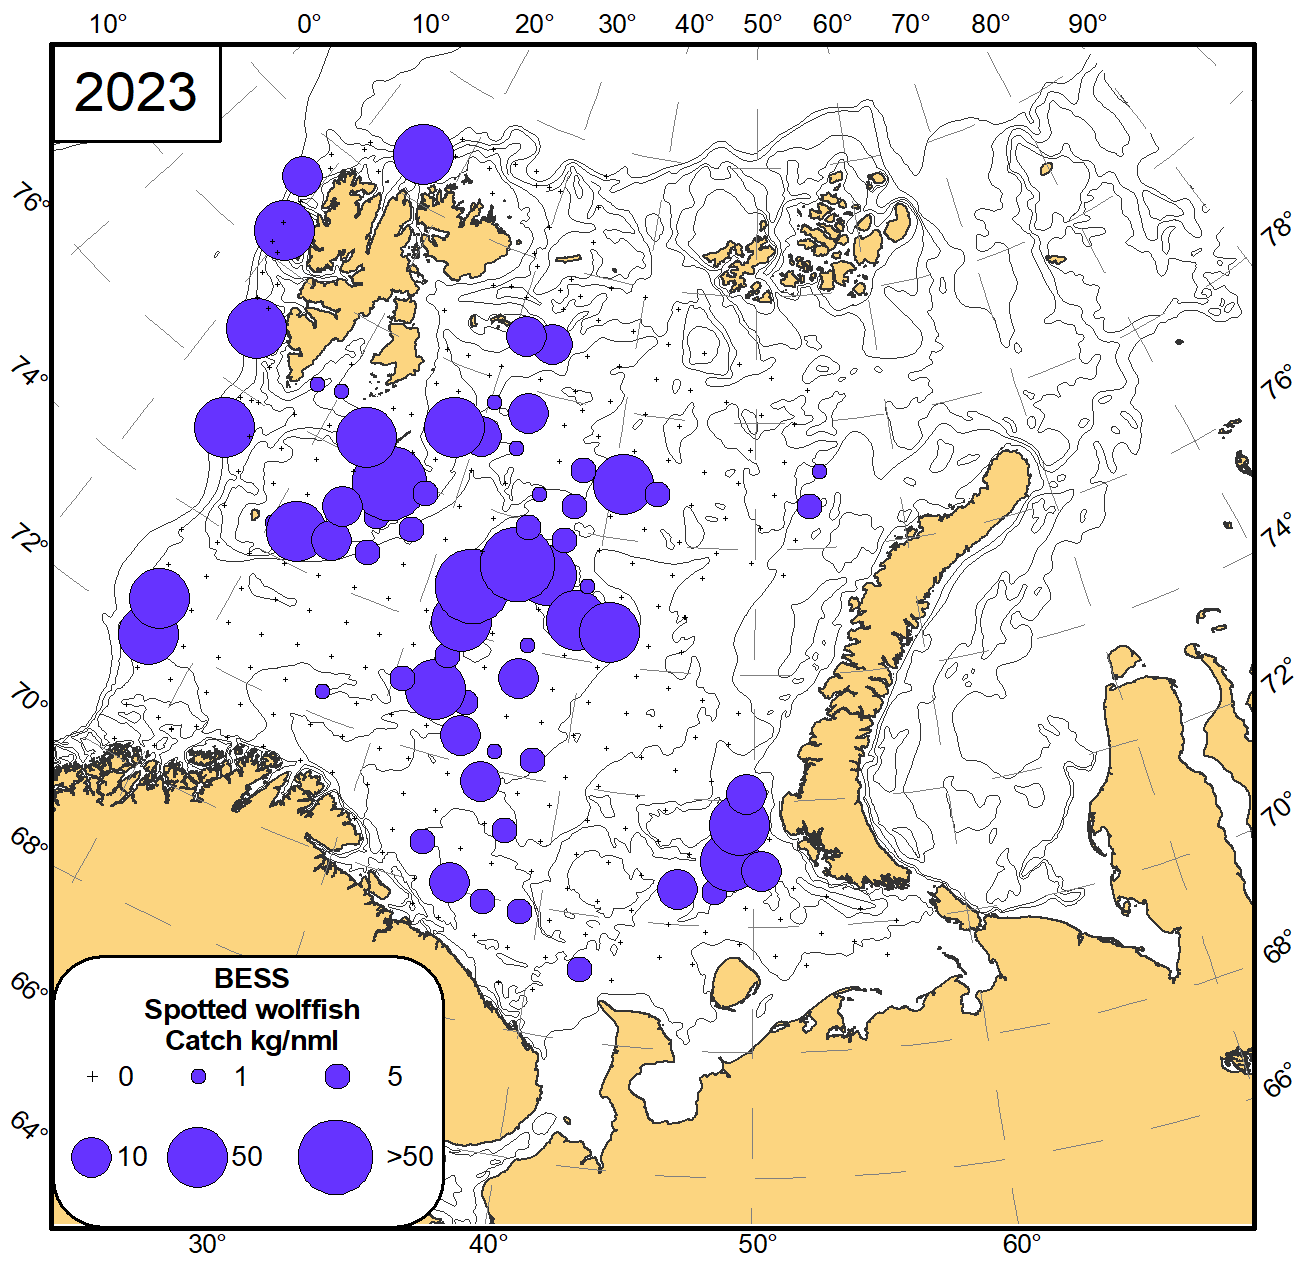
8.10 Spotted wolffish (Anarhichas minor)
In 2023 the spotted wolffish was found over a wide area, from the coast to the central part of the sea, but the main densities were along the slopes of the Svalbard/Spitsbergen and Central Banks (Figure 8.10).
Figure 8.10 Distribution of spotted wolffish (Anarhichas minor), August-November 2023.
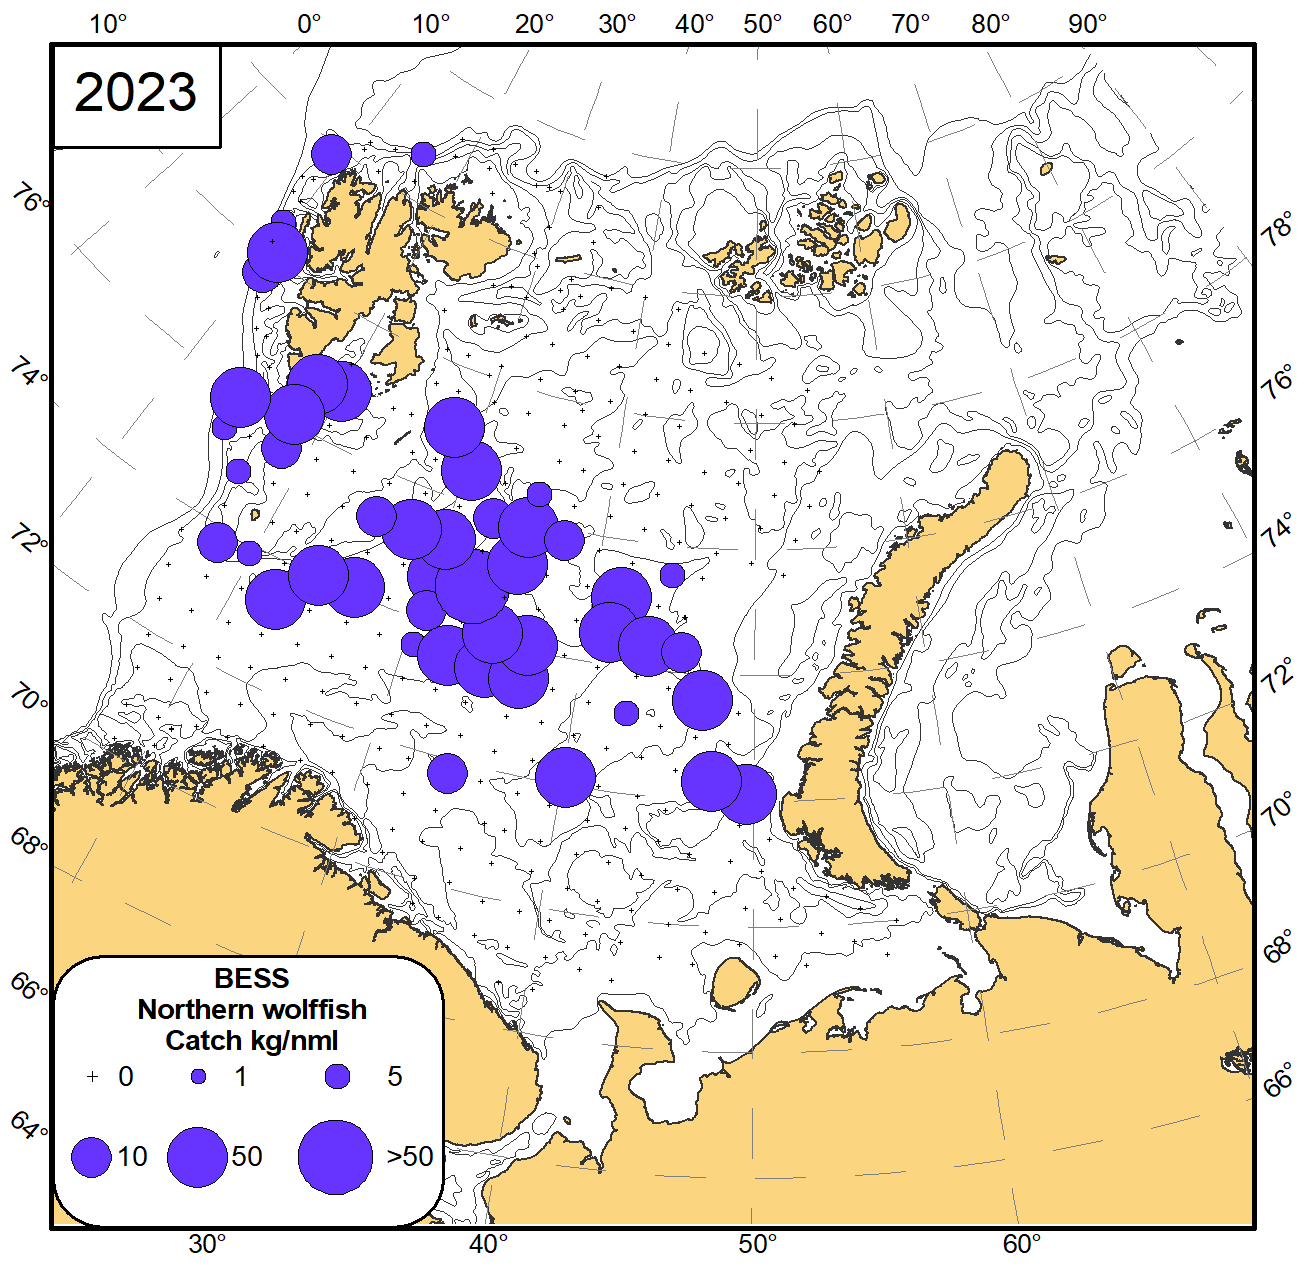
8.11 Northern wolffish (Anarhichas denticulatus)
In 2023 Northern wolffish was distributed along the slopes of west of Svalbard/Spitsbergen, along the slopes of Hopen Trench extending into the slopes of the Central Basin in the eastern Barents Sea (Figure 8.11).
Figure 8.11 Distribution of northern wolffish (Anarhichas denticulatus), August-November 2023.
In 2022 the eastern area was surveyed three and a half months later then the western area so the lack of synoptic coverage does not allow us to compare distribution and abundance data from 2023 and 2022. Thus, here only a description of 2023 data without comparative analysis is presented.
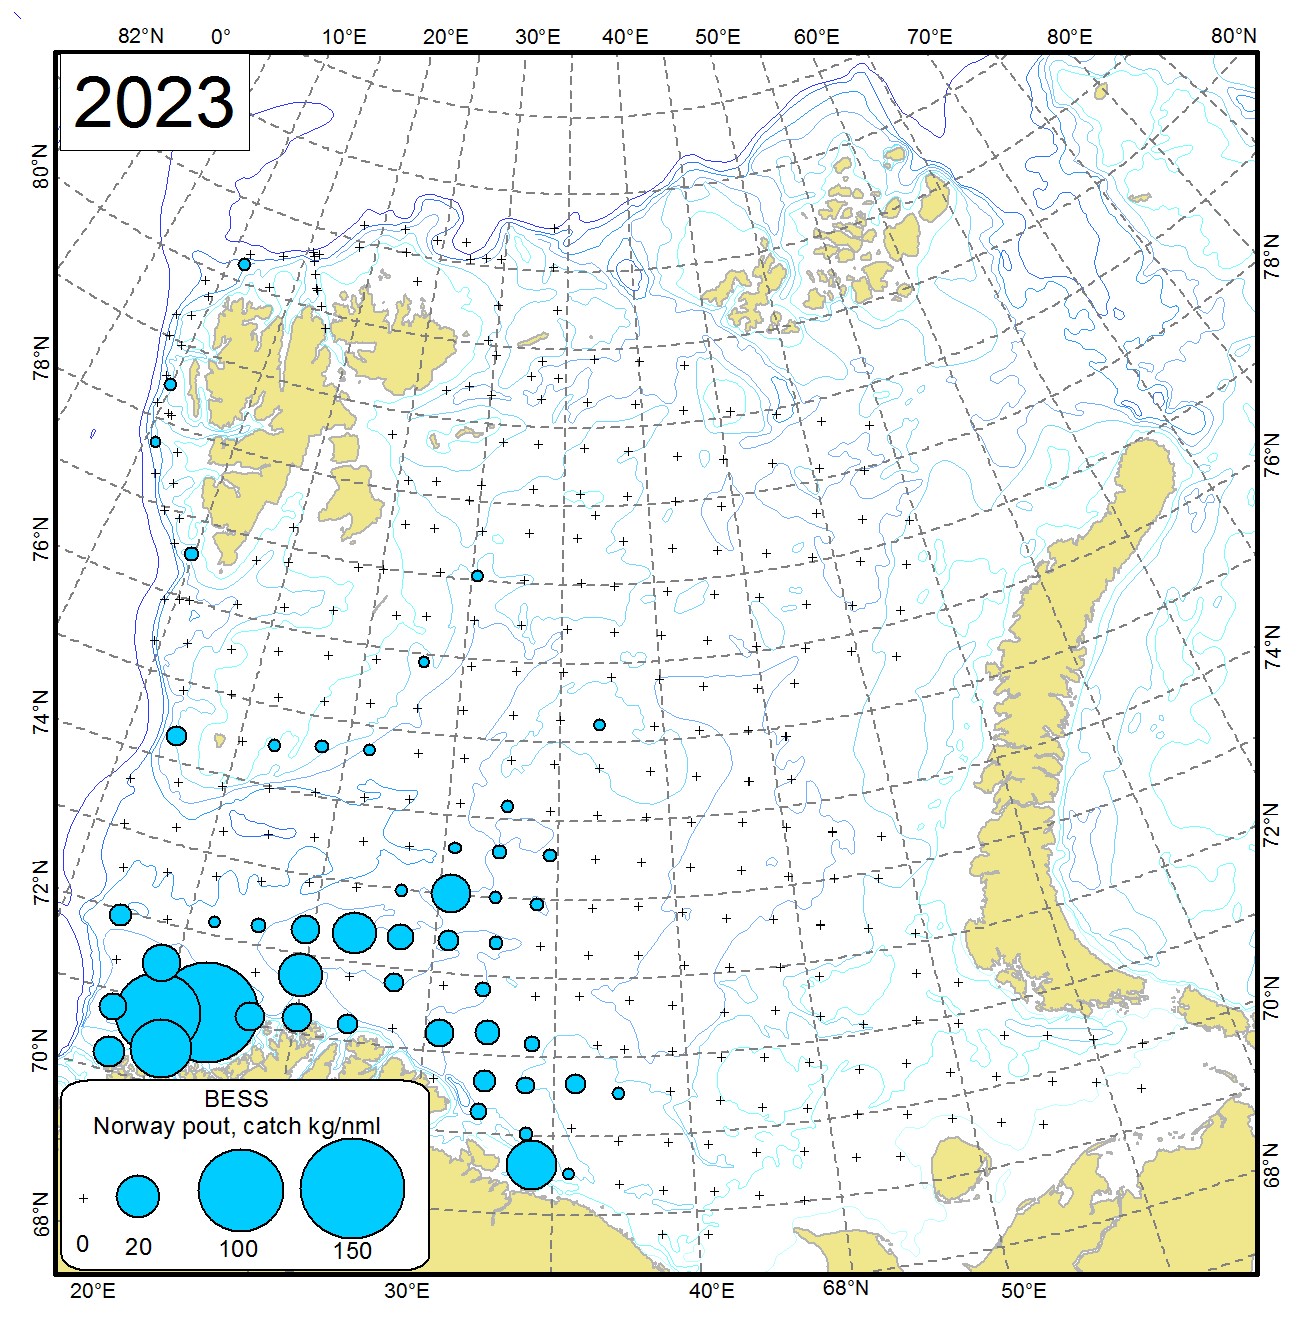
Norway pout (Trisopterus esmarkii).
The highest concentrations of this species were as traditionally found in the south-western part of the Barents Sea in 2023 (Figure 9.2.1). The maximum catch of Norway pout in 2023 was 153.9 kg/nautical mile, and the average catch - 1.4 kg/nautical mile. Total abundance and biomass were 1067.8 million individuals and 36.1 thousand tonnes (Table 9.2.1).
Figure 9.2.1 Distribution of Norway pout (Trisopterus esmarkii), August-September 2023.
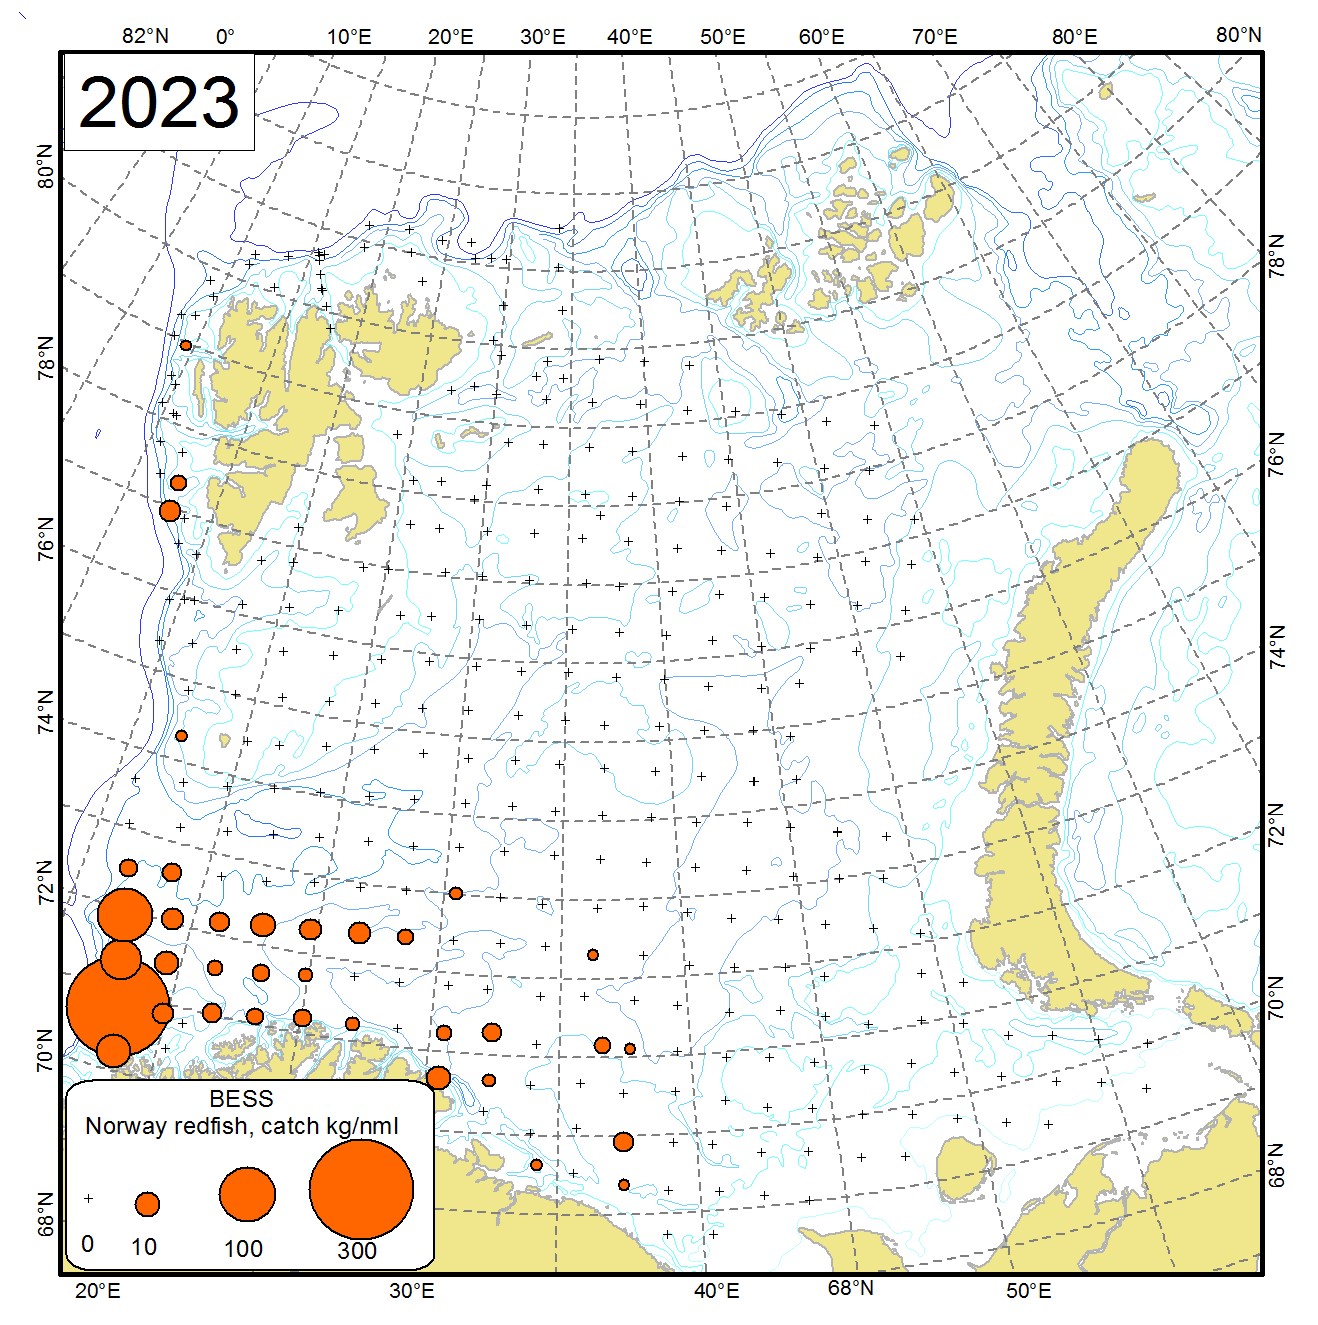
Norway redfish (Sebastes viviparus).
This species occurred in the south-western area of the survey along the Norwegian coast and in the south-western and western part of Svalbard/Spitsbergen Archipelago (Figure 9.2.2). The maximum catch of Norway redfish in 2023 was 330.7 kg/nautical mile, and the average catch – 1.6 kg/nautical mile. Total abundance of this species in 2023 was 189.6 million individuals, and the total biomass was 28.9 thousand tonnes, which is the highest biomass of the Norway redfish since the start of this times series in 2006 (Table 9.2.1).
Figure 9.2.2. Distribution of Norway redfish (Sebastes viviparus), August-September 2023.
Table 9.2.1. Total abundance (N, million individuals) and biomass (B, thousand tonnes) of Norway pout and Norway redfish in the Barents Sea in August-September 2006-2023 based on demersal trawls (not including 0-group).
Species
Year
Norway pout
Norway redfish
N
B
N
B
2006
1838
32
219
19
2007
2065
61
64
10
2008
3579
97
24
4
2009
3841
131
17
2
2010
3530
103
26
2
2011
5976
68
83
9
2012
3089
105
114
12
2013
2267
40
233
25
2014
1254
37
105
6
2015
943
33
168
20
2016
797
28
125
13
2017
1260.6
21.6
133.7
14.3
2018
1687.2
50.8
202.9
25.3
2019
1949.2
51.1
142.5
15.5
2020
515.2
14.6
155.7
22.6
2021
330.6
11.6
131.6
19.1
2023*
1067.8
36.1
189.6
28.9
* – 2022 is not included due to the lack of synoptic coverage
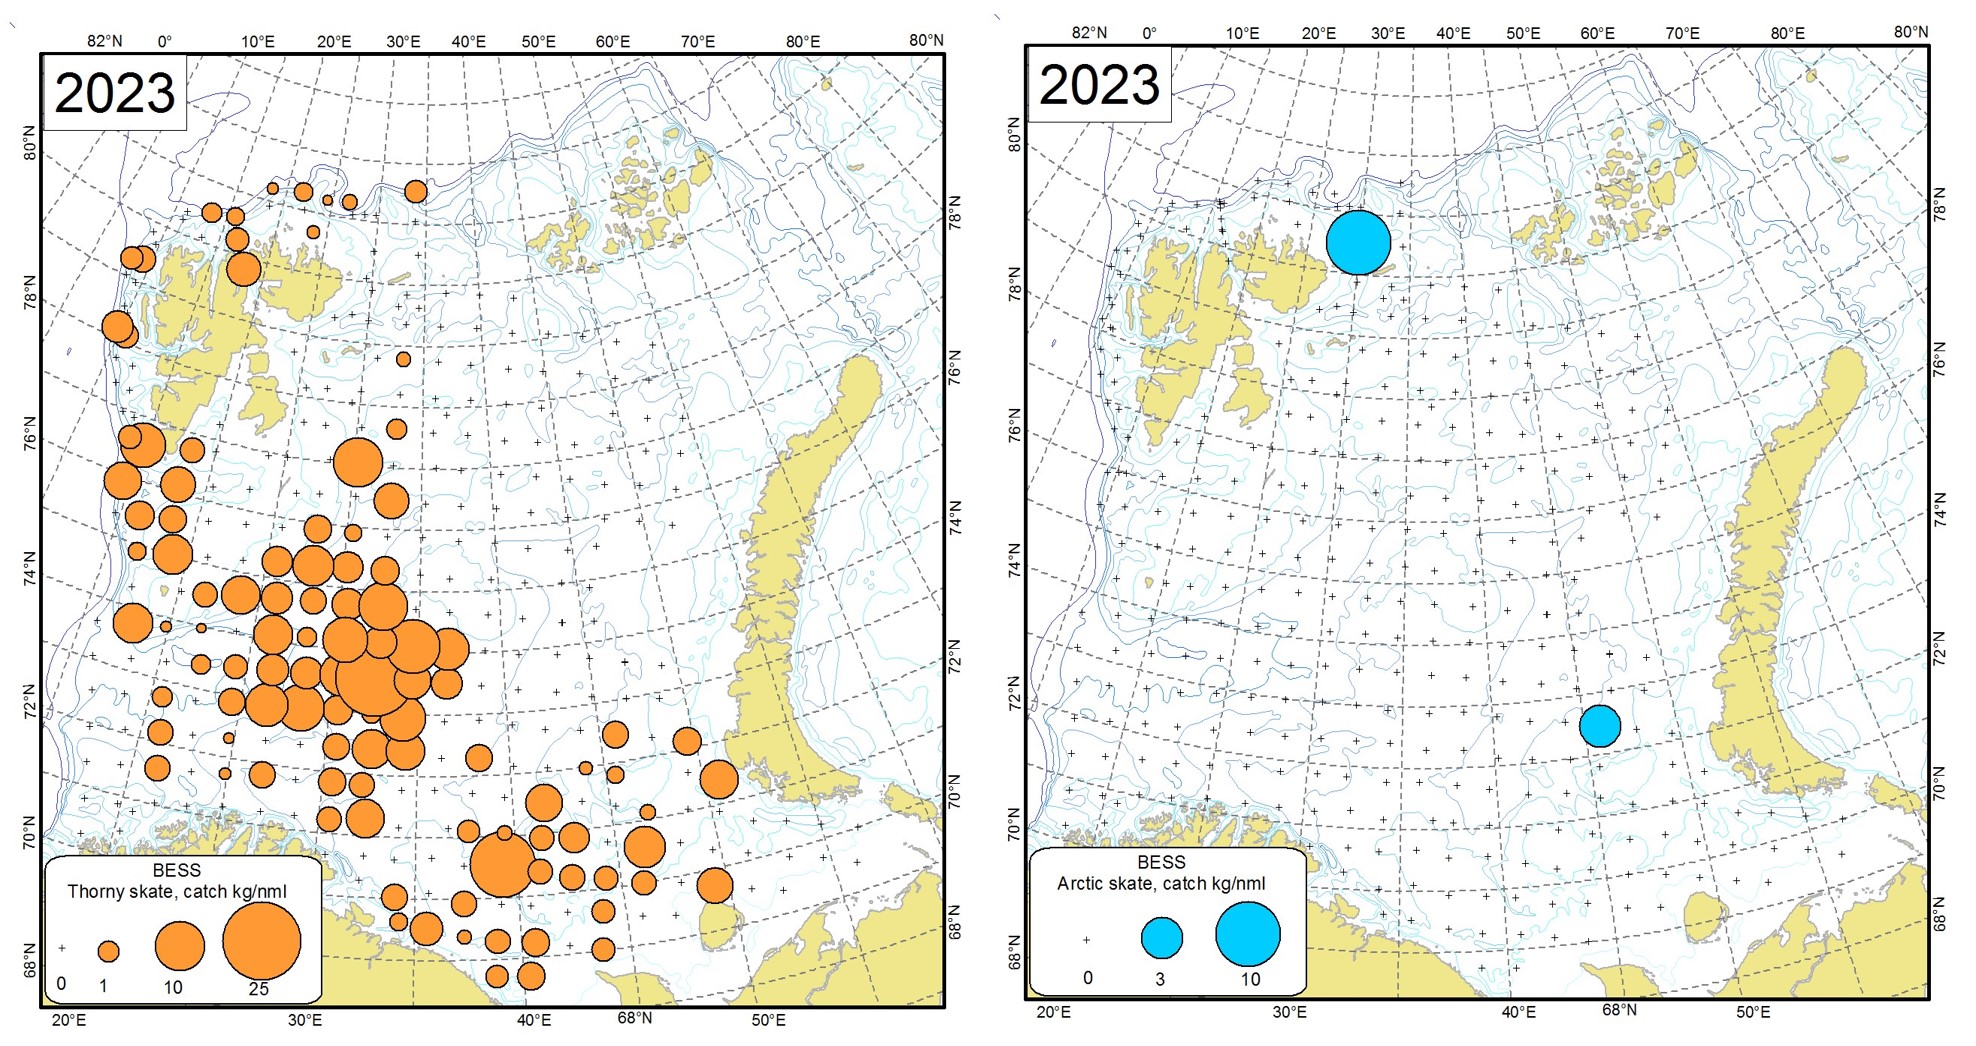
Thorny skate (Amblyraja radiata) and Arctic skate (Amblyraja hyperborea) were selected as indicator species to study how ecologically similar fishes from different zoogeographic groups respond to changes of their environment. Thorny skate belongs to the mainly boreal zoogeographic group and is widely distributed in the Barents Sea except the most north-eastern areas, while Arctic skate belongs to the Arctic zoogeographic group and is found in the cold waters of the northern area.
In 2023 thorny skate was distributed in the wide area from the north-western to the south-western and south-eastern Barents Sea where warm Atlantic and Coastal Waters dominated (Figure 9.2.3). Thorny skate was observed in 32.7 % of the bottom stations. Thorny skate was distributed within a depth of 47-471 m, and the highest biomass occurred at depth 200-299 m (49.6 % of total biomass). The average catches (in terms of abundance and biomass) in 2023 were 1.1 individuals per nautical mile and 0.9 kg per nautical mile (Table 9.2.3). The estimated total abundance and biomass of thorny skate in 2023 was 32.3 million individuals and 28.0 thousand tonnes (Table 9.2.1).
Figure 9.2.3 Distribution of thorny skate (Amblyraja radiata)(left) and Arctic skate (Amblyraja hyperborea)(right), August-September 2023.
Table 9.2.2. Average catches (abundance N, individuals per nautical mile and biomass (B, kg per nautical mile) and total abundance (N, million individuals) and biomass (B, thousand tonnes) of thorny skate during BESS 2014-2023.
Year
Average catch
Total abundance
N
B
N
B
2014
0.2
0.3
3.7
6.7
2015
0.07
0.1
1.6
1.9
2016
0.2
0.2
8.6
4.0
2017
0.3
0.3
4.9
4.4
2019*
0.07
0.09
2.0
2.3
2020
0.12
0.11
1.8
1.8
2021
0.02
0.01
0.7
0.6
2023**
0.02
0.03
0.3
0.4
* – 2018 is not included due to the poor survey coverage
** – 2022 is not included due to the lack of synoptic coverage
Arctic skate was observed in only two bottom stations in 2023 (Figure 9.2.3). This species was distributed at depth of 270 m in the Central Trough (1 individual) and 498 m off the north-eastern part of the Svalbard/Spitsbergen Archipelago (7 individuals). The average catch (in terms of abundance and biomass) of Arctic skate in 2023 were 0.02 individuals per nautical mile and 0.03 kg per nautical mile (Table 9.2.3). The estimated total abundance and biomass of Arctic skate in 2023 (0.3 million individuals and 0.4 thousand tonnes) was the lowest since the start of this time series in 2014 (Table 9.2.3).
Table 9.2.3. Average catches (abundance N, individuals per nautical mile and biomass (B, kg per nautical mile) and total abundance (N, million individuals) and biomass (B, thousand tonnes) of Arctic skate during BESS 2014-2023.
Average catch
Total abundance
Year
N
B
N
B
2014
1.4
1.2
34.4
30.0
2015
1.1
1.0
31.8
30.5
2016
1.0
0.9
30.7
28.2
2017
1.8
1.3
52.0
39.7
2019*
2.0
1.4
57.0
41.3
2020
0.8
0.7
31.7
31.1
2021
0.6
0.4
30.7
27.6
2023**
1.1
0.9
32.3
28.0
* – 2018 was not included due to the poor survey coverage
** – 2022 is not included due to the lack of synoptic coverage
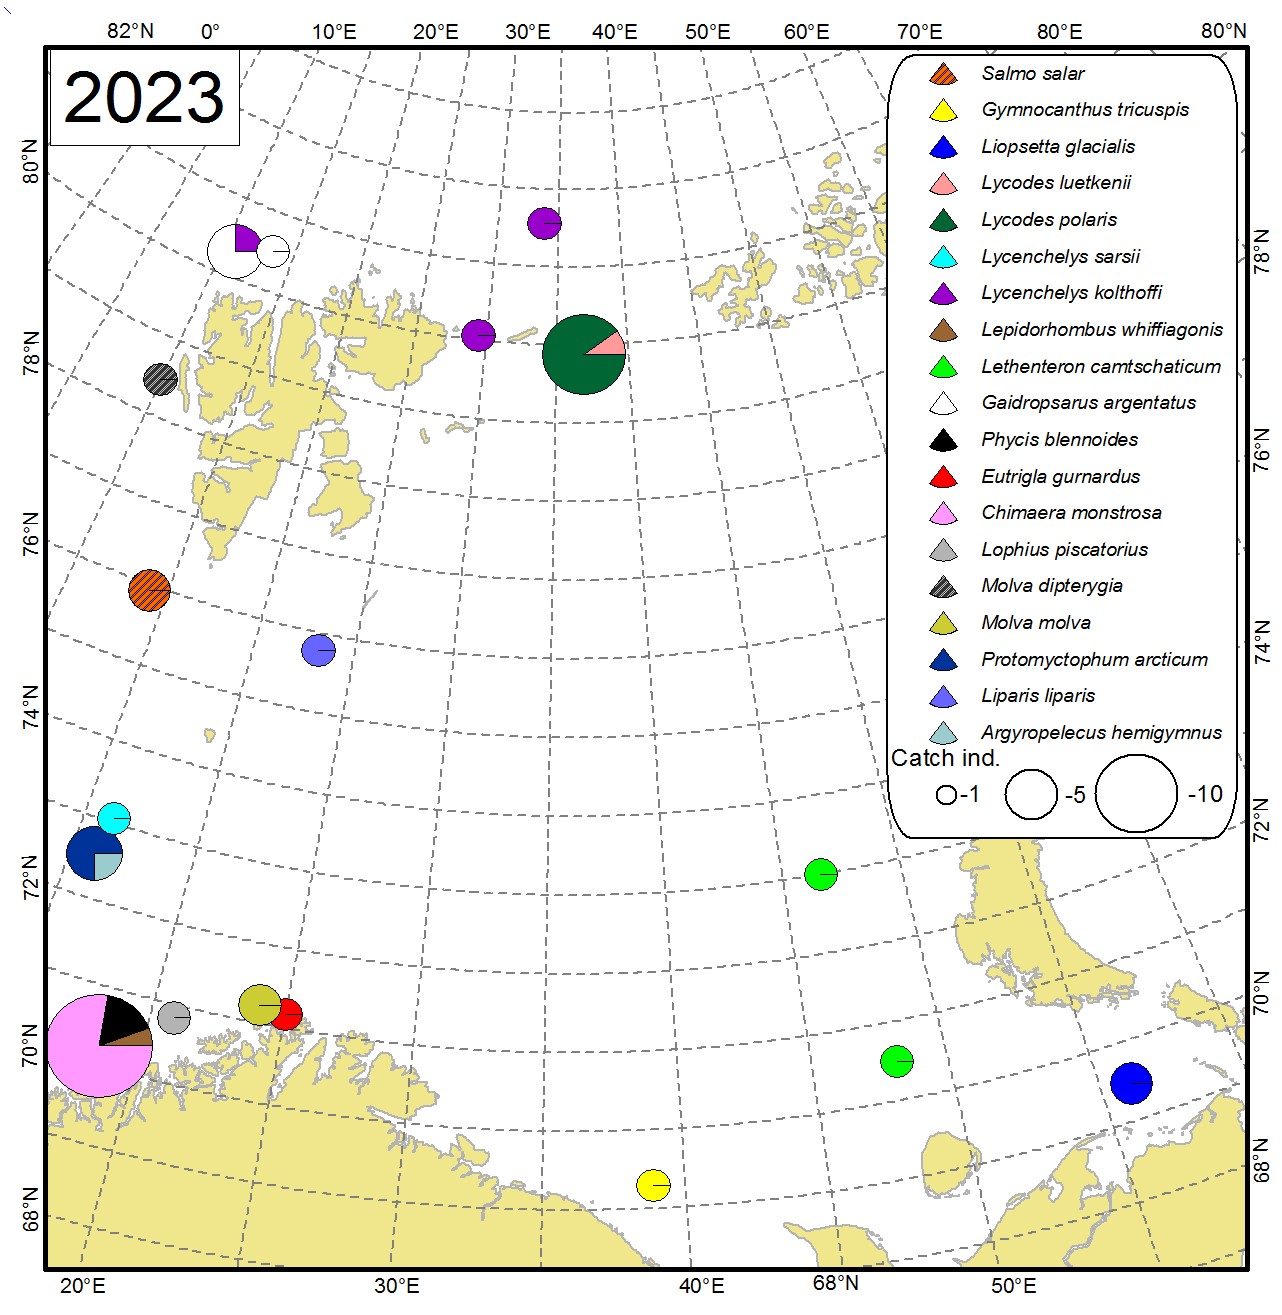
9.3 Uncommon and Rare Species
Rare or uncommon species are either species that are not caught at the Barents Sea ecosystem survey every year (e.g. half-naked hatchetfish (Argyropelecus hemigymnus) – circumglobal in tropical to temperate seas, but uncommon in the Arctic region), or caught most years but in low numbers and with limited occurrence (e.g. checkered wolf eel (Lycenchelys kolthoffi), known from the Kara Sea to Greenland and the western North Atlantic, in the BESS found mainly north of 77° N), or species with specific way of life (e.g. anadromous species Arctic lamprey (Lethenteron camtschaticum) – parasite on some fishes). Most of these species usually occur in areas adjacent to the Barents Sea and were therefore found mainly along the border of the surveyed area.
Some uncommon species were also observed in the Barents Sea during the ecosystem survey in 2023 (Figure 9.3.1).
Figure 9.3.1. Distribution of rare and uncommon fish species in the Barents Sea in August-September 2023. The size of circles corresponds to total abundance (individuals per trawl station, both pelagic and bottom trawl stations were used, both pelagic and demersal species are included.
9.4 Zoogeographic groups
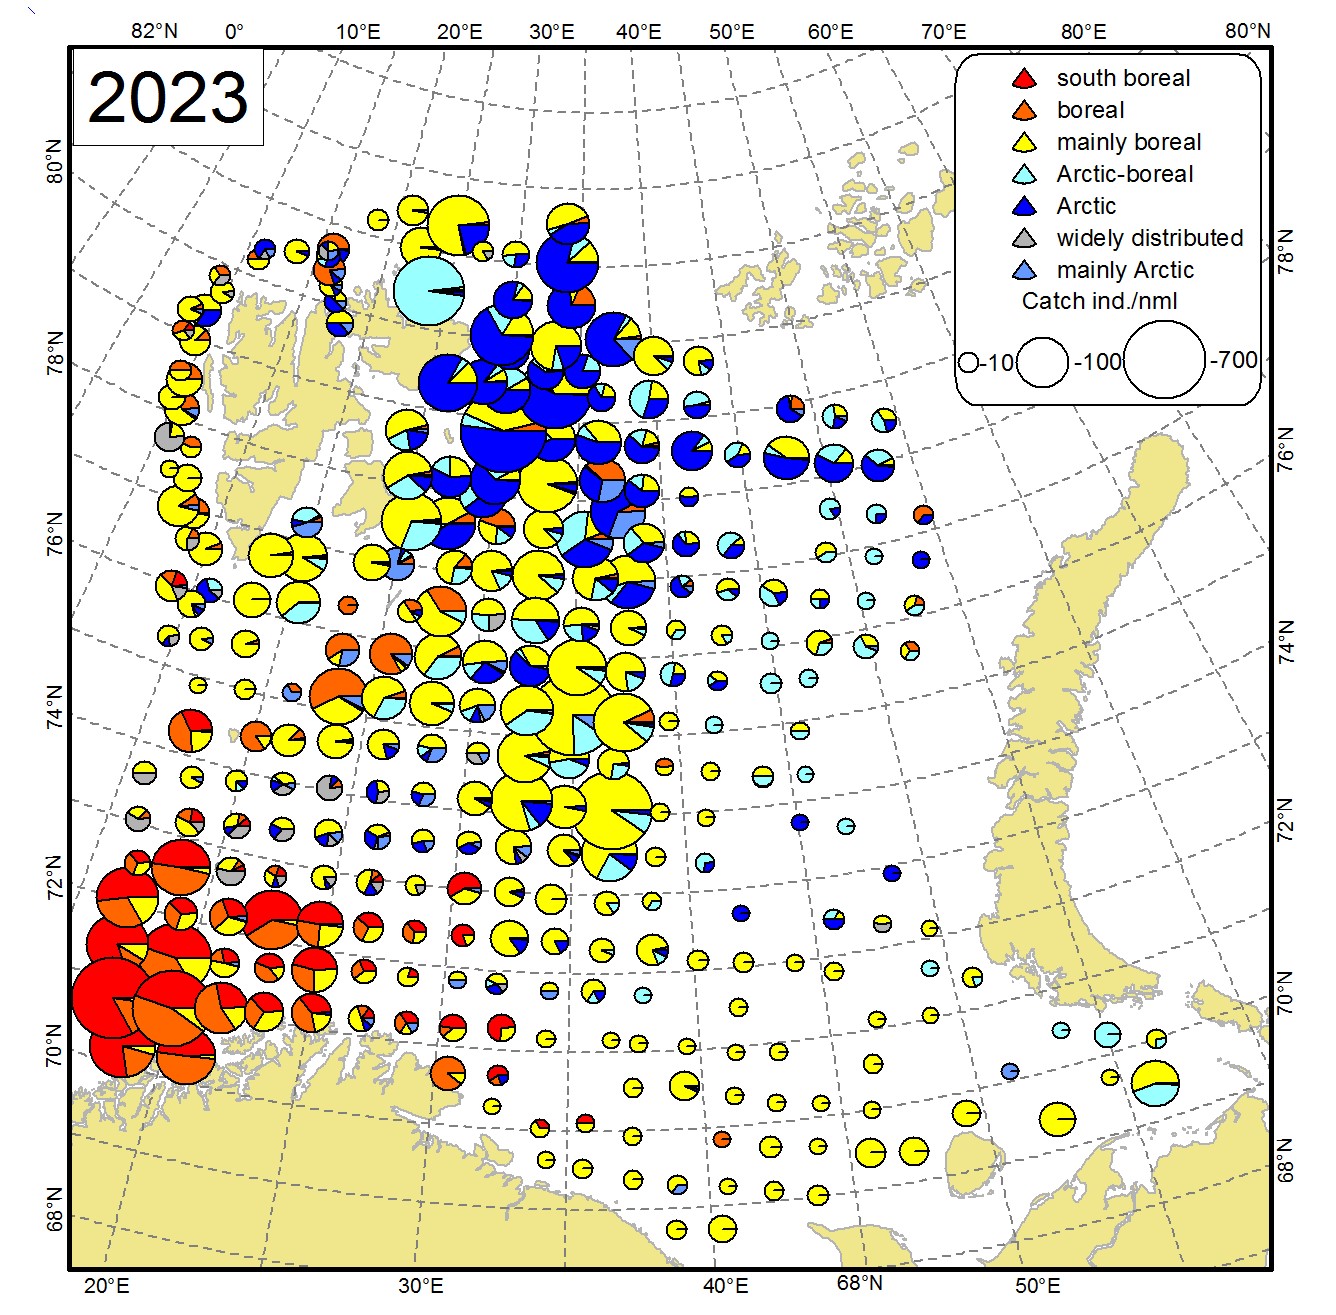
During the 2023 ecosystem survey in total 85 fish species from 29 families were recorded in the catches. Some specimens were only identified to genus or family level, especially from the families Liparidae, where genus Careproctus includes different species difficult to identify onboard. The highest number of species belongs to the families Zoarcidae (12 species), Gadidae (9 species) and Cottidae (8 species). All recorded species belonged to the 7 zoogeographic groups: widely distributed, south boreal, boreal, mainly boreal, Arctic-boreal, mainly Arctic and Arctic as defined by Andriashev and Chernova (1994). Mecklenburg et al. (2018) in the recent “Marine Fishes of the Arctic Region” reclassified some of the species and geographical categorisation comprises six groups: widely distributed, boreal, mainly boreal, Arctic-boreal, mainly Arctic and Arctic. We use Andriashev and Chernova classification here due to the lack of comparative studies of the old and new classification applied to the Barents Sea. Only bottom trawl data were used, and only non-commercial species were included into the analysis, both demersal (including bentho-pelagic) and pelagic (neritopelagic, epipelagic, bathypelagic) species (Andriashev and Chernova, 1994, Parin, 1968, 1988). Among the analyzed species most belong to the Arctic (20.0 %), mainly boreal (17.6 %) and boreal (15.3 %) zoogeographic groups.
The median and maximum catches of non-commercial fish from different zoogeographic groups are shown in Tables 9.4.1, 9.4.2 (differences in spatial survey coverage each year are not accounted).
Widely distributed (only ribbon barracudina (Arctozenus risso) represents this group), south boreal (e.g. grey gurnard (Eutrigla gurnardus), silvery pout (Gadiculus argenteus), greater forkbeard (Phycis blennoides)) and boreal (e.g. lemon sole (Microstomus kitt), stout eelblenny (Anisarchus medius), silvery lightfish (Maurolicus muelleri)) species were mostly found in the central, south-western and western part of the survey area where warm Atlantic and Coastal Waters dominate (Figure 9.4.1). The median catches of species of the widely distributed and south boreal zoogeographic group in 2023 were the highest since the start of this times series in 2013, but of the boreal group were at the level of 2013-2015 (Table 9.4.1).
Mainly boreal species (e.g. lesser sandeel (Ammodytes marinus), snakeblenny (Lumpenus lampretaeformis), greater eelpout (Lycodes esmarkii)) were widely found throughout the survey area (Figure 4.2.1). The median catches of species from the mainly boreal group in 2023 were similar to the previous year’s level (Table 9.4.1). The maximum catches were approximately at the same level as in 2020-2021 (Table 9.4.2).
Arctic-boreal species (e.g. Atlantic poacher (Leptagonus decagonus), ribbed sculpin (Triglops pingelii)) were found in the central, northern and south-eastern part of the Barents Sea (Figure 9.4.1). The median catches of species of the Arctic-boreal zoogeographic group in 2023 were were approximately at the same level as in 2020-2021 (Table 9.4.1).
Mainly Arctic (e.g. Arctic flounder (Liopsetta glacialis), Atlantic spiny lumpsucker (Eumicrotremus spinosus), nebulous snailfish (Liparis bathyarcticus)) and Arctic (e.g. Arctic rockling (Gaidopsarus argentatus), pale eelpout (Lycodes pallidus), leatherfin lumpsucker (Eumicrotremus derjugini)) species were mainly found on the northern part of the Barents Sea (Figure 9.4.1). Species of these groups mostly occur in areas influenced by cold Arctic Water, Spitsbergen Bank Water and Novaya Zemlya Coastal Water. Median and maximum catches of mainly Arctic species in 2021 were lower than in 2020 (Table 9.4.1). Median catches of species of the mainly Arctic zoogeographic group in 2023 were at the 2020-2021 level, and the maximum catches were the lowest since 2016 (Table 9.4.1, 9.4.2). Median and maximum catches of species of the Arctic zoogeographic group in 2023 were the lowest since 2014 (Table 9.4.1, 9.4.2).
Figure 9.4.1. Distribution of non-commercial fish species from different zoogeographic groups during the ecosystem survey 2023. The size of circles corresponds to total abundance (individuals per nautical mile, only bottom trawl stations were used, both pelagic and demersal species are included).
Table 9.4.1. Median catch (individuals per nautical mile) of non-commercial fish from different zoogeographic groups (only bottom trawl data were used, both pelagic and demersal species are included).
Year
Widely distributed
South boreal
Boreal
Mainly boreal
Arctic-boreal
Mainly Arctic
Arctic
2013
0.2
0.8
7.1
48.9
25.4
10.2
70.8
20141
0.1
0.9
8.7
36.4
8.6
1.7
7.4
2015
0.09
1.2
8.7
71.4
14
1.9
31.5
20162
0.5
1.4
18.3
55.3
8.8
3.3
29.1
2017
0.2
3.2
15
53.7
19.3
4.9
78.5
20193
0.02
2.6
14.2
54.3
15
7.2
108.5
2020
0.1
2.7
17.9
23.7
8.9
1.9
93.7
2021
0.06
1.3
23.0
47.7
7.5
1.7
70.1
20234
0.6
8.8
8.2
31.3
8.1
1.8
13.3
1 – Coverage in the northern Barents Sea was highly restricted
2 – The survey started in the north
3 – 2018 is not included due to the poor coverage of the Russian Zone
4 – 2022 is not included due to the lack of synoptic coverage
Table 9.4.2. Maximum catch (individuals per nautical mile) of non-commercial fish from different zoogeographic groups (only bottom trawl data were used, both pelagic and demersal species are included).
Year
Widely distributed
South boreal
Boreal
Mainly boreal
Arctic-boreal
Mainly Arctic
Arctic
2013
17.1
171.4
230.0
982.5
3326.9
656.3
3013.8
20141
14.3
105.7
478.6
3841.4
371.6
60.9
386.4
2015
10.0
216.3
660.0
1587.1
1502.4
53.8
832.2
20162
36.7
135.0
743.8
2962.5
283.8
123.2
808.6
2017
7.5
372.9
792.9
2945.0
571.3
282.5
2731.1
20193
1.3
312.0
735.6
1406.1
297.5
828.8
2968.8
2020
11.0
357.0
1646.1
464.8
573.1
156.2
6770.6
2021
9.9
71.3
1788.2
751.3
268.0
80.8
2178.3
20234
29.9
595.1
282.0
614.8
476.0
74.5
402.5
1 – Coverage in the northern Barents Sea was highly restricted
2 – The survey started in the north
3 – 2018 is not included due to the poor coverage of the Russian Zone
4 – 2022 is not included due to the lack of synoptic coverage
10 Commercial Shellfish
10.1 Northen shrimp (Pandalus borealis)
Text by: S. Bakanev, F. Zimmermann
Figures by: Y. Zhak
During the survey in 2023, 320 trawl hauls were completed and 253 of them contained Northern shrimp. The biomass of shrimp varied from several grams to 852.1 kg/nm with an average catch of 10.7 kg/nm (Table 10.1.1).
Table 10.1.1. The catch characteristics of the Northern shrimp (include SEM) during BESS in 2004-2023.
Year
Total number of stations
Number of stations with shrimp
Mean catch, ind./nml
Mean catch, kg/nml
2004
586
385
1272
8.0
2005
602
420
1493
12.9
2006
635
469
1947
11.4
2007
528
407
1849
10.5
2008
387
293
1272
6.8
2009
357
262
1253
6.1
2010
320
241
1600
9.4
2011
379
301
1710
8.7
2012
429
328
1727
9.0
2013
416
336
1484
8.1
2014
294
211
1211
6.4
2015
325
244
1050
5.6
2016
292
197
896
4.7
2017
321
222
1408
8.0
2018
216
171
1413
8.2
2019
314
251
1503
8.6
2020
417
314
806
4.8
2021
333
252
1155
6.3
2022
287
238
1210
6.8
2023
320
253
1880
10.7
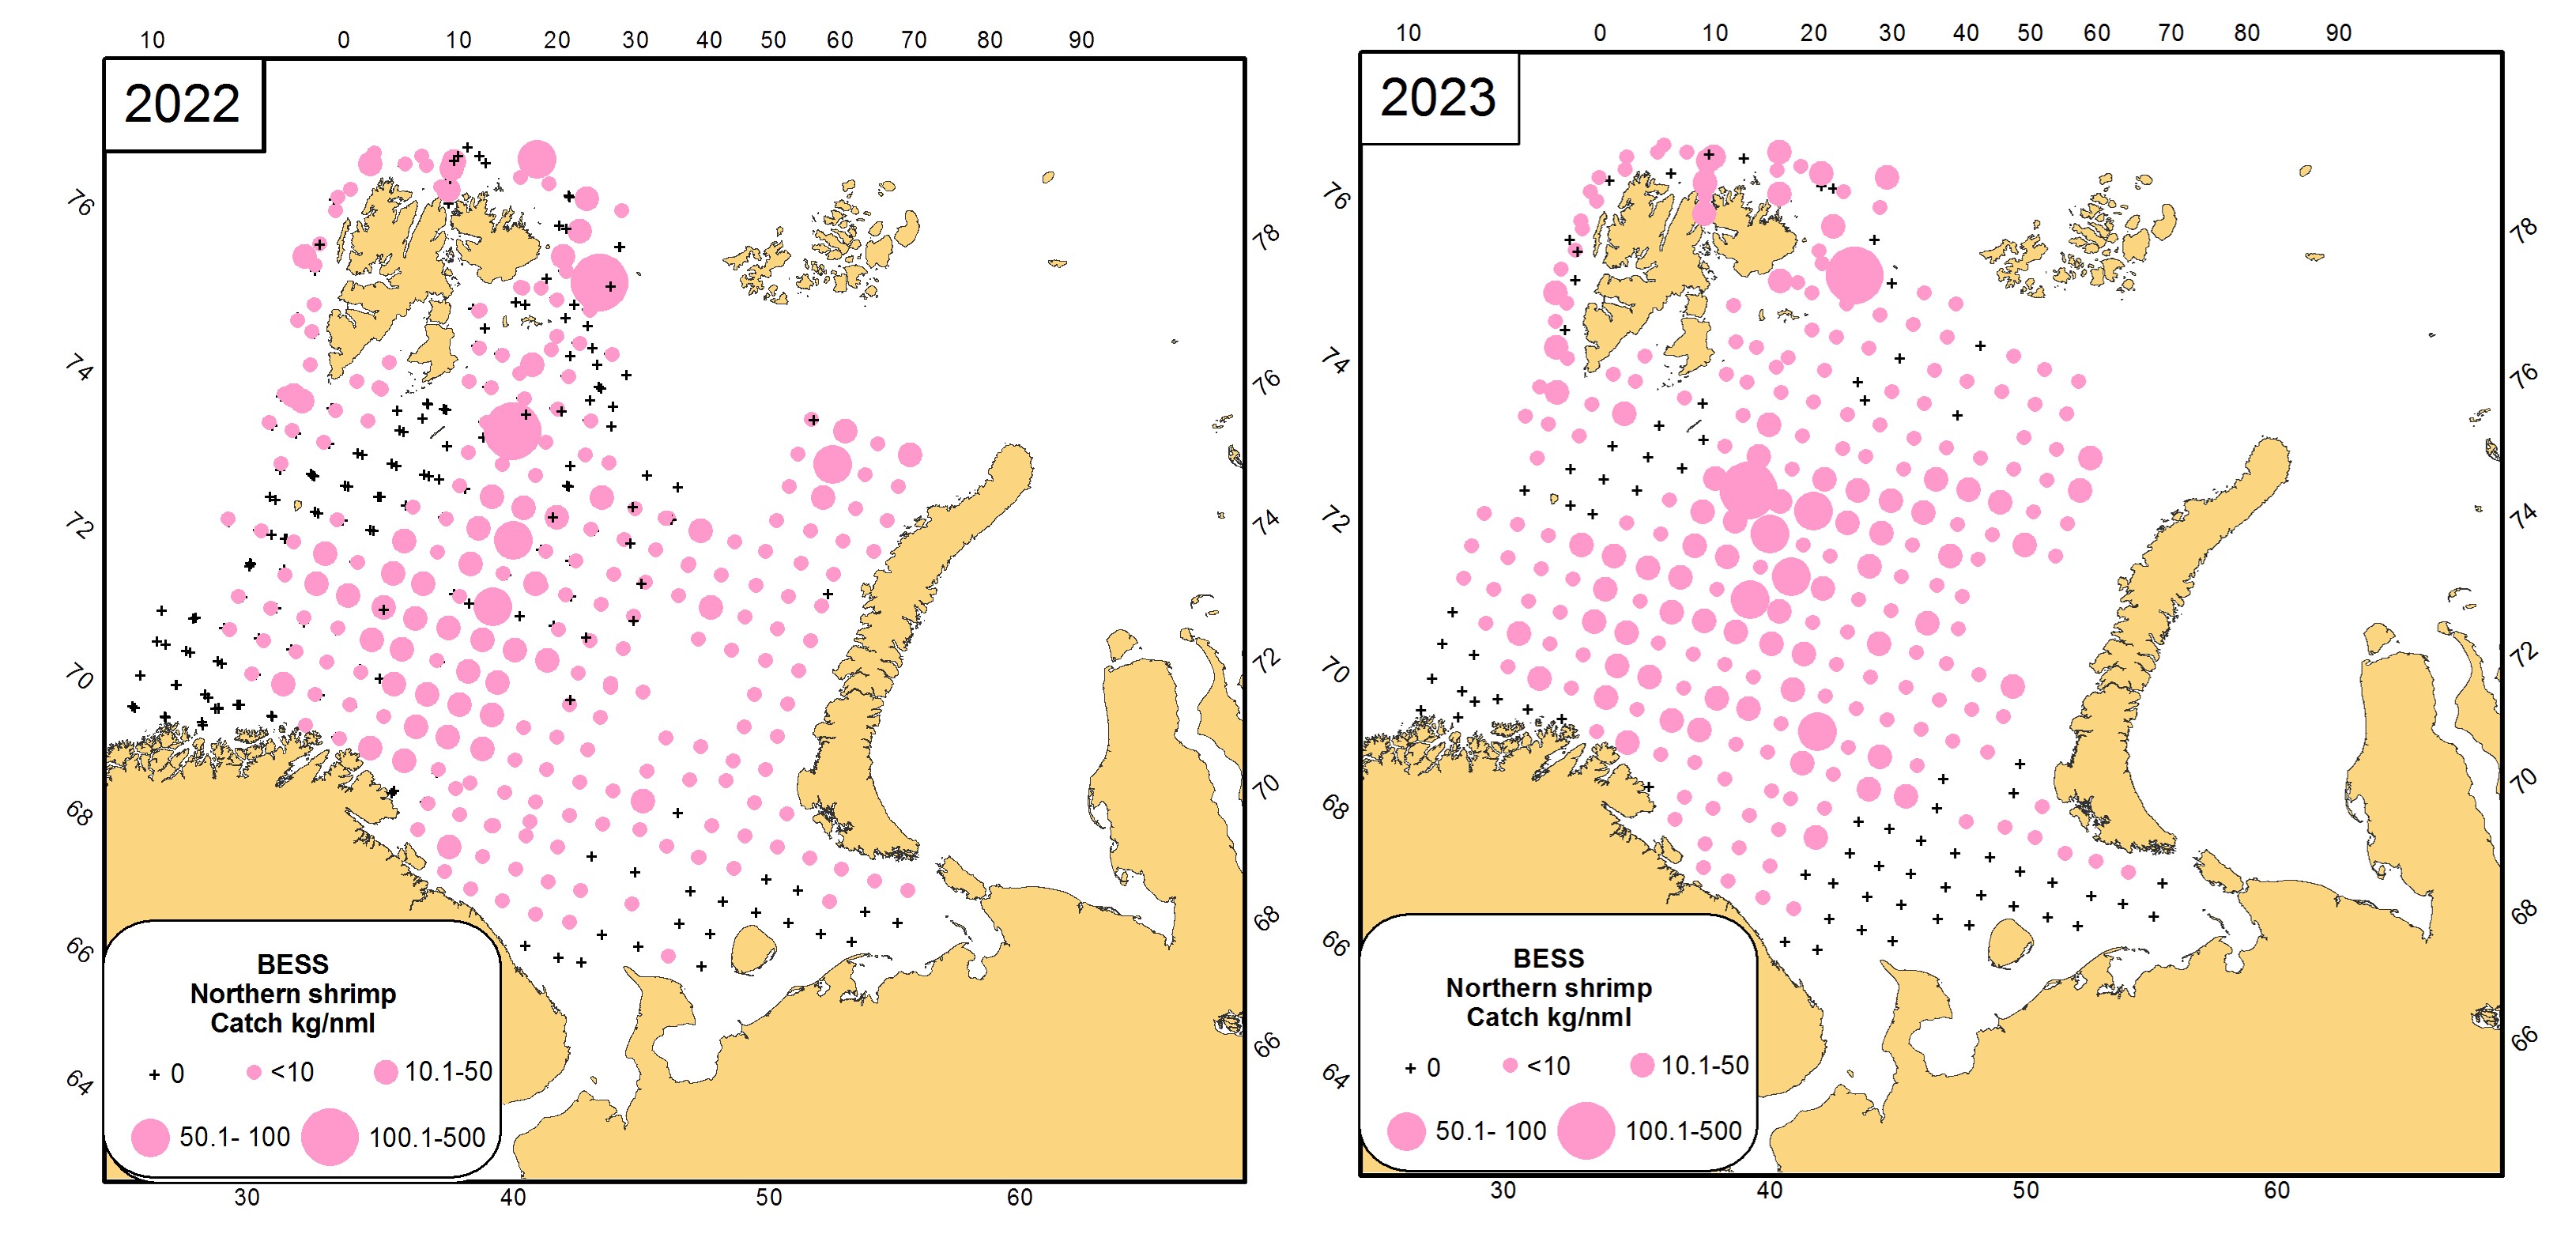
As in previous years, the densest concentrations of shrimp were registered in the central part of the Barents Sea and around Svalbard/Spitsbergen (Figure 10.1.1).
Figure 10.1.1 Distribution of the Northern shrimp (Pandalus borealis) in the Barents Sea, in the Barents Sea in August-September 2022-2023.
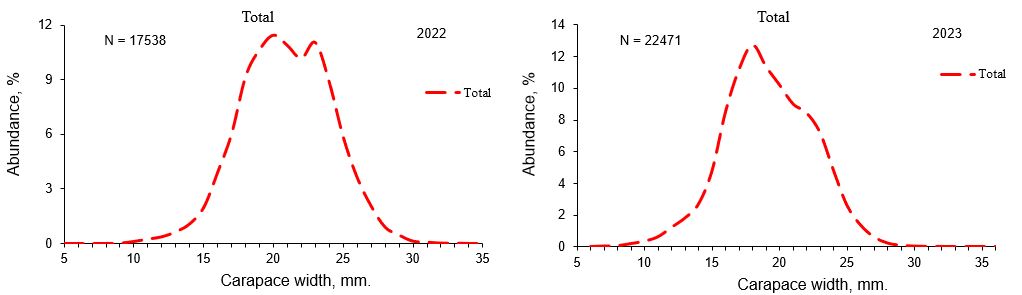
Biological analysis of the Northern shrimp was conducted in 2023 by registering carapace length and developmental stage. As in 2022, the bulk of the population of the Barents Sea shrimp was made up of smaller individuals with a carapace length of 15-25 mm (Figure 10.1.2). Information on stages and, thus, the proportion of males and females in 2023 was too limited and is therefore not presented.
Figure 10.1.2. Size structure of catches of the Northern shrimp (Pandalus borealis) in the eastern Barents Sea 2022-2023.
11.2 Red king crab (Paralithodes camtschaticus)
Text by: A. Stesko, A.M Hjelset, H.E.H. Danielsen
Figures by: J. Zhak
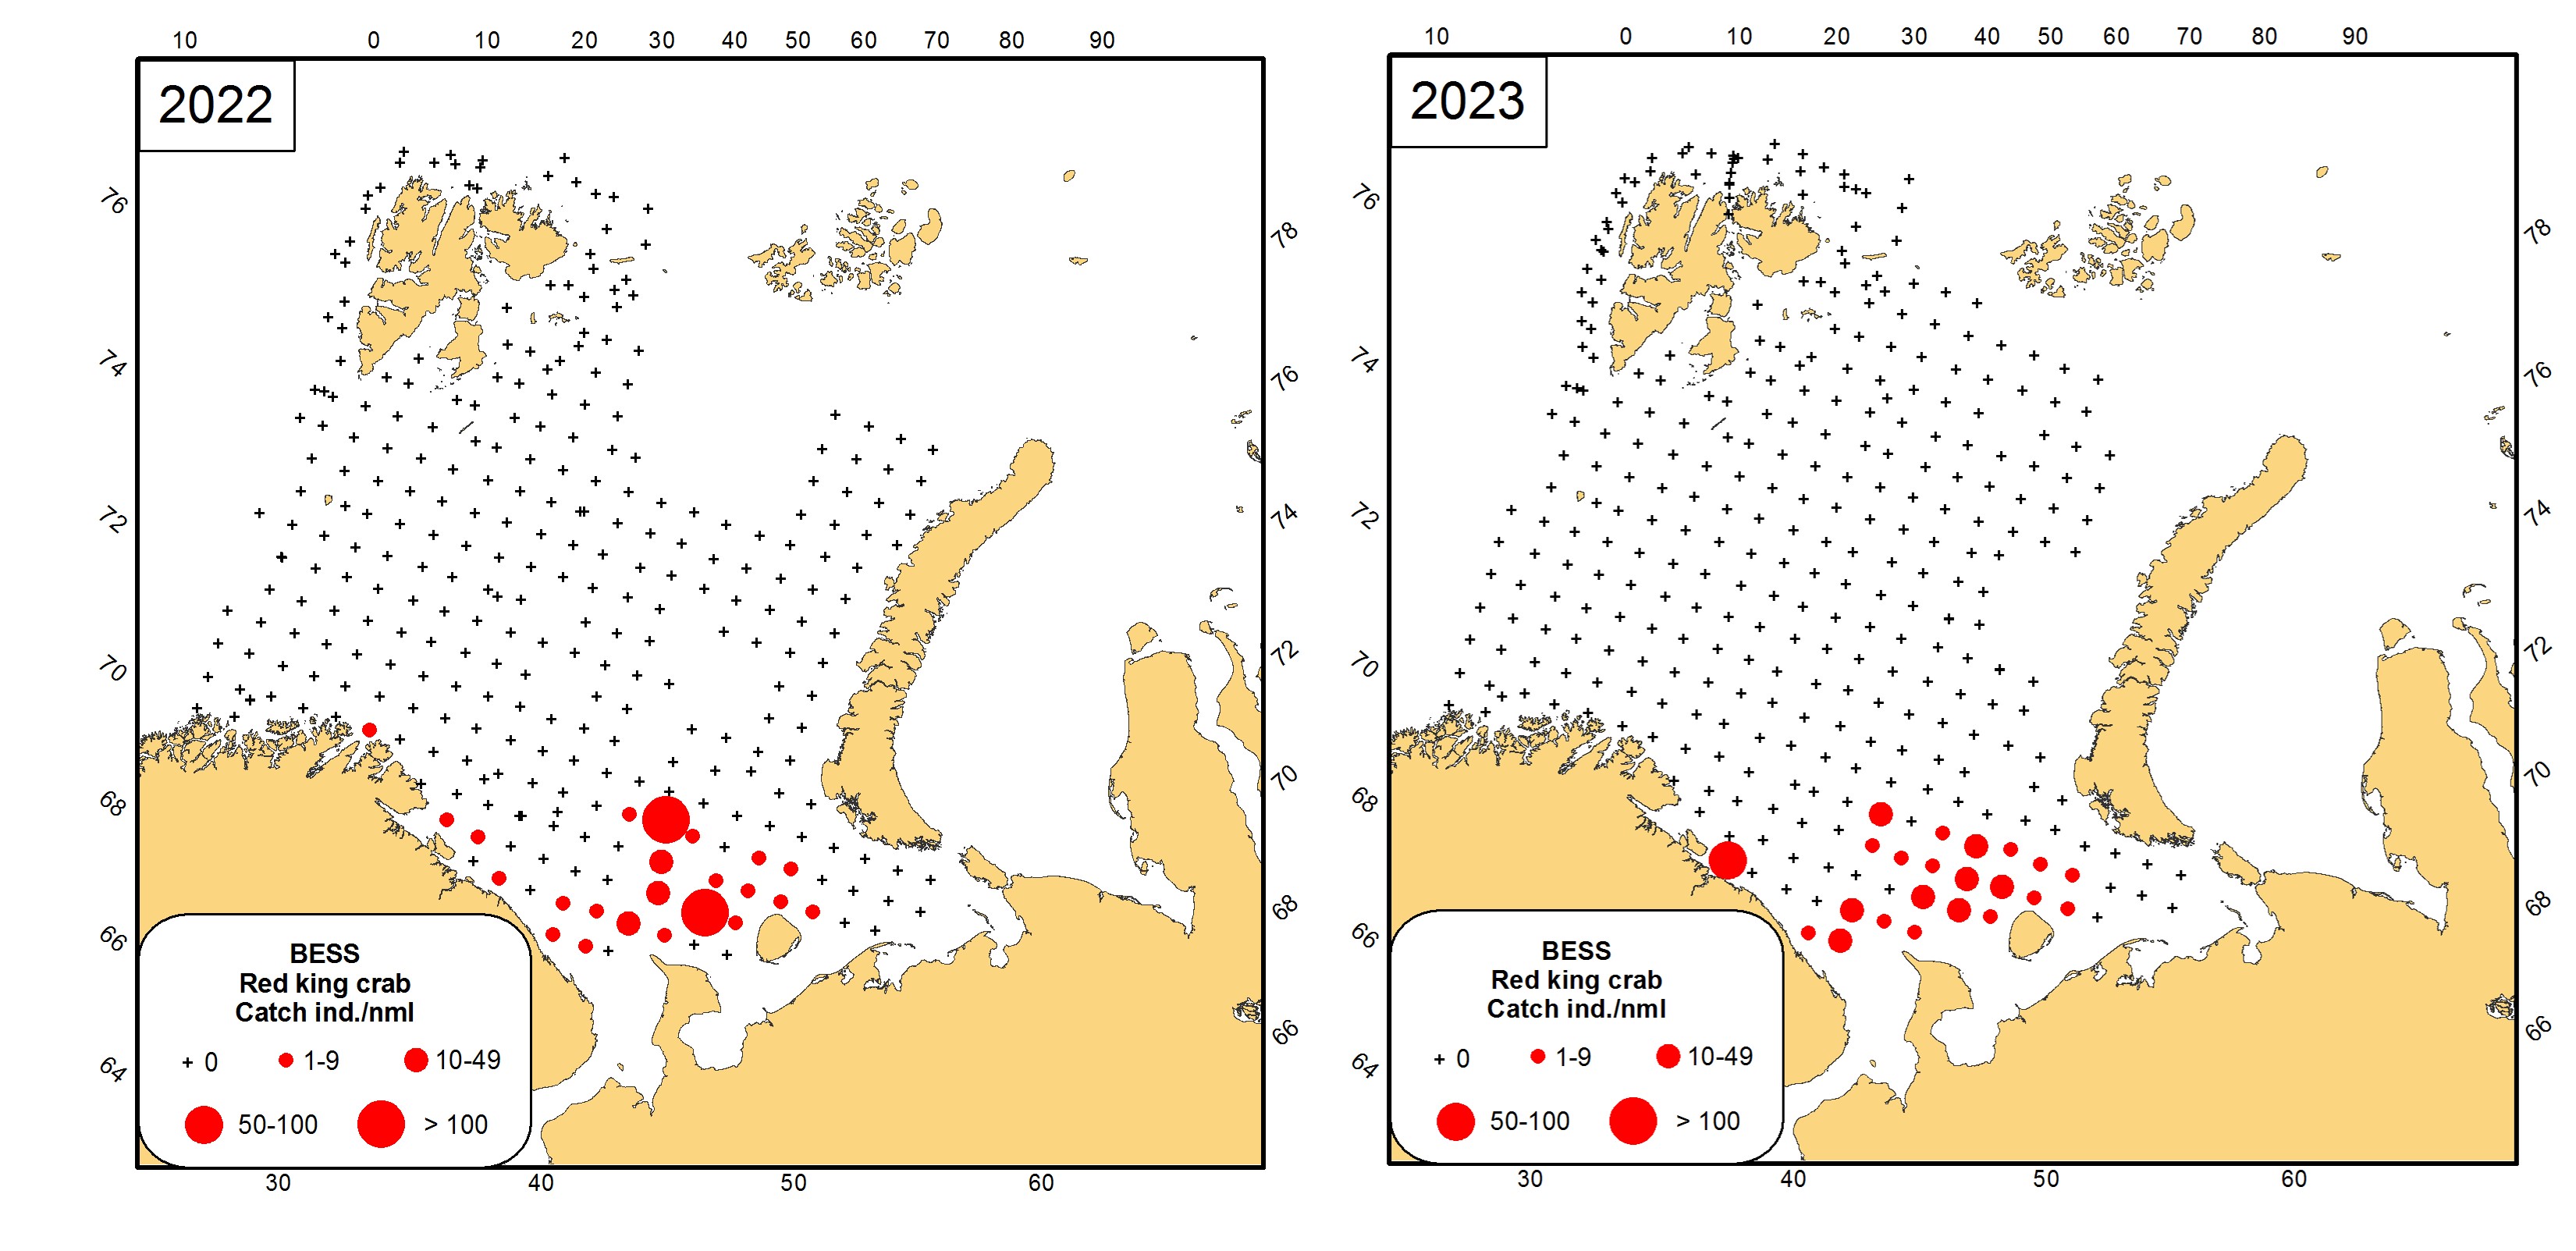
During BESS-2023 the Red king crab were recorded in 22 of 320 trawl catches, all stations with king crab were in Russian part of the survey area. Compared to previous years, in 2023 there was not recorded any expansion of Red king crab range to north or east (Figure 10.2.1).
Despite the identical coverage of the Red king crab area by stations in 2023 compared to 2022, both the number of recording and the total catch were significantly lower (Table 10.2.1, Figure 10.2.1). Moreover, no trawl catches with crabs of more than 100 ind. were detected in the eastern part of the Barents Sea, it had been observed only near Kola Bay.
Table 10.2.1. The total catches of the Red king crab during BESS 2004-2023.
Year
Total number
of stations
Number of stations
with Red king crab
Total catch,
ind.
Total catch,
kg
2004
586
9
385
1293
2005
602
11
100
296
2006
635
67
1180
3340
2007
528
13
310
1100
2008
390
10
127
93
2009
357
6
14
23
2010
320
6
12
25
2011
379
4
40
22
2012
429
9
126
308
2013
416
10
272
437
2014
295
11
168
403
2015
325
11
252
508
2016
293
10
201
496
2017
322
13
299
687
2018*
217
5
73
175
2019
314
33
970
1687
2020
417
21
229
531
2021
333
26
373
1186
2022
287
23
306
1035
2023
320
22
238
751
* reduced coverage of the Red king crab area
Figure 10.2.1 Distribution of the Red king crab (Paralithodes camtschaticus) in the Barents Sea in August-September 2022-2023.
The biomass of Red king crab catches in 2023 varied from 2.9 to 157.2 kg/nm compared with 4.8 to 548.4 kg/nm in 2022. The average biomass was 42.04±9.23 kg/nm compared with 54.3±27.5 kg/nm in 2022.
The abundance of crab in 2023 ranged from 1.2 to 58.0 ind./nm given an average crab abundance of 13.3±3.2 ind./nm compared with 1.2-149.4 ind./nm and 16.1±7.6 ind./nm in 2022.
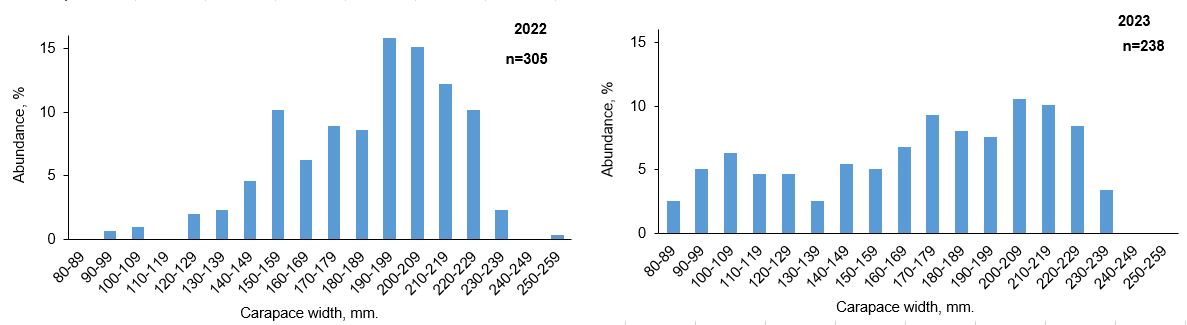
The size structure of the Red king crab population in 2023 is characterized by two size groups of crabs with carapace width 90-130 and 170-230 mm. (Figure 10.2.2).
Figure 10.2.2 Length distribution of the Red king crab in the Barents Sea in August-September 2022- 2023.
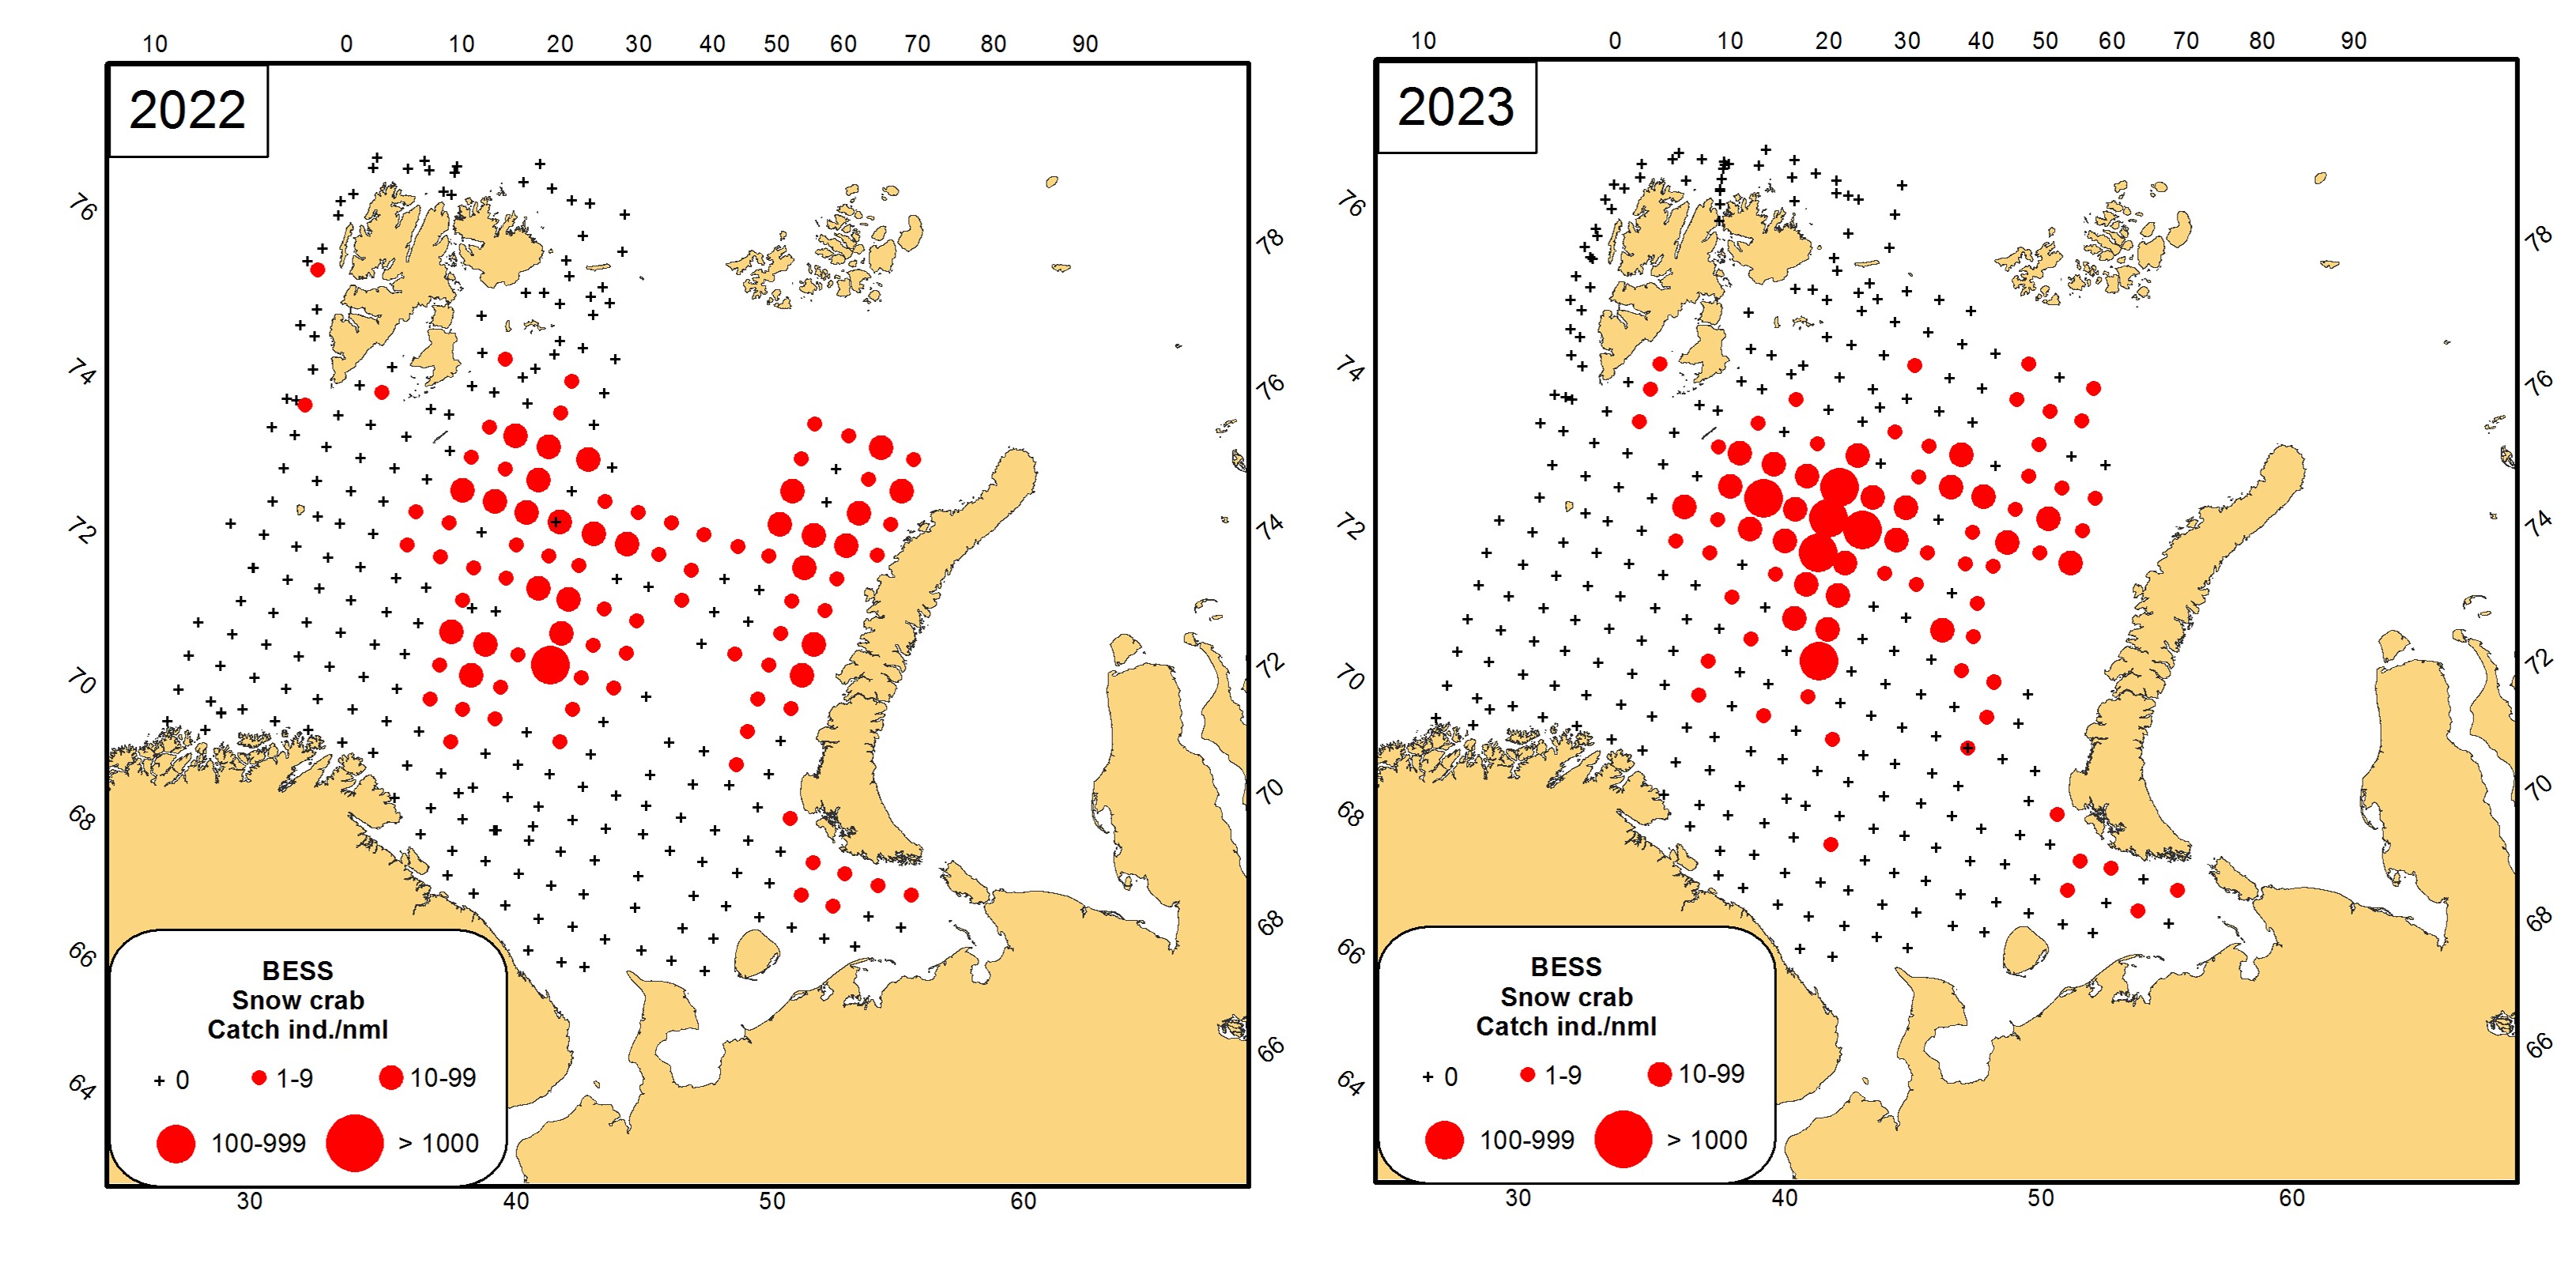
11.3 Snowcrab (Chionoecetes opilio)
Text by: S. Bakanev, A. Stesko, A.M. Hjelset, H.E.H Danielsen
Figures by: J. Zhak
In 2023, Snow crabs were recorded in 83 out of 320 trawl catches. Abundance of Snow crab was higher than in 2022, although still significantly lower than the top years between 2017 and 2020 (Table 10.3.1).
During the sampling period, there have been single observations of Snow crab outside central Barents Sea. In 2017 the Snow crab was for the first-time recorded northwest of Svalbard/Spitsbergen. In 2018 one small male (CW= 34 mm) and weight 12 g was caught south-west of South Cap of Spitsbergen at 350 m. In 2019 and 2020 Snow crab was not recorded in the water around Svalbard/Spitsbergen, however in 2021-2022 specimens were caught in South and the South-eastern part of Svalbard/Spitsbergen area, but no more than 9 ind./nm. Snow crab has been observed in Storfjorden in the Svalbard archipelago. In 2023, the highest number of observations was found in central parts of the Barents Sea.
Within the survey area and stations with catches of Snow crab, the biomass per station varied from 0.001 to 40.2 kg/nm with an average 2.3±0.7 kg/nm compared with 0.001 to 6.6 kg/nm with an average 0.67±0.1 kg/nm in 2022 (Fig. 10.3.1, Table 10.3.1).
The abundance in 2023 ranged from 1 to 281 ind./nm with an average of 22±4.8 ind./nm compared with 1-382 ind./nm and 12.0±3.9 ind./nm in 2022 (Fig. 10.3.1, Table 10.3.1).
Table 10.3.1. The total and mean (per nautical mile) catches of Nnow crab during BESS in 2004-2023
Year
Total number of stations
Number of stations with Snow crab
Total catch, ind.
Total catch, kg
Mean abundance, ind./nm
Mean biomass,
kg/nm
2004
586
7
7
2
1
0.2
2005
602
12
16
4
2
0.3
2006
635
21
39
10
3
0.6
2007
528
45
115
14
3
0.4
2008
387
65
600
56
12
1.1
2009
357
49
212
37
5
0.9
2010
320
57
396
25
9
0.6
2011
379
84
6658
162
98
2.4
2012
429
114
34798
1 179
377
12.8
2013
416
112
13253
1 086
153
12.4
2014
294
83
10580
677
157
10.0
2015
325
87
1787
258
24
3.5
2016
292
57
1070
103
24
2.3
2017
321
116
20132
1 351
208
14.0
2018*
216
61
9816
764
201
15.7
2019*
314
104
6591
386
77
4.5
2020
417
130
4050
382
33
3.1
2021
333
105
1705
110
20
1.3
2022
287
94
891
50
12
0.7
2023
320
83
1430
151
19
2.0
* Some stations in the Snow crab area were not surveyed in 2018 and 2019
Figure 10.3.1 Distribution of the Snow crab (Chionoecetes opilio) in the Barents Sea in August-September 2022-2023.
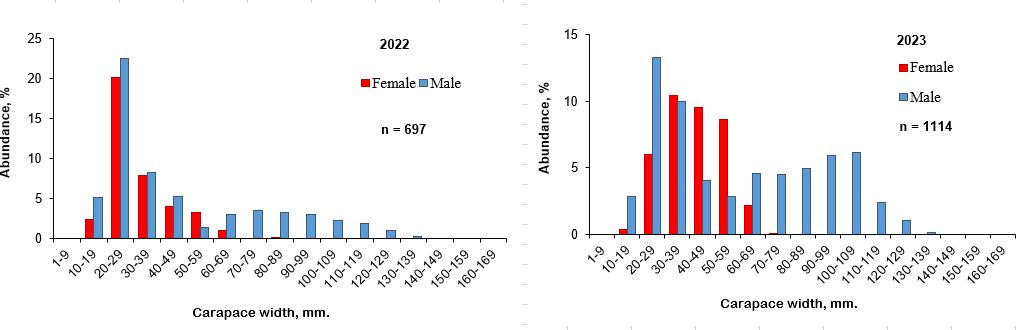
The measured catch of Snow crabs caught in 2023 were dominated by females within the size range 30-60 mm carapace width and the male size composition was dominated of two groups with carapace width around 30-40 and 70-110 mm (Figure 10.3.2 B).
Figure 10.3.2 Size and sex structure of the Snow crab in the Barents Sea in August-September 2022-2023.
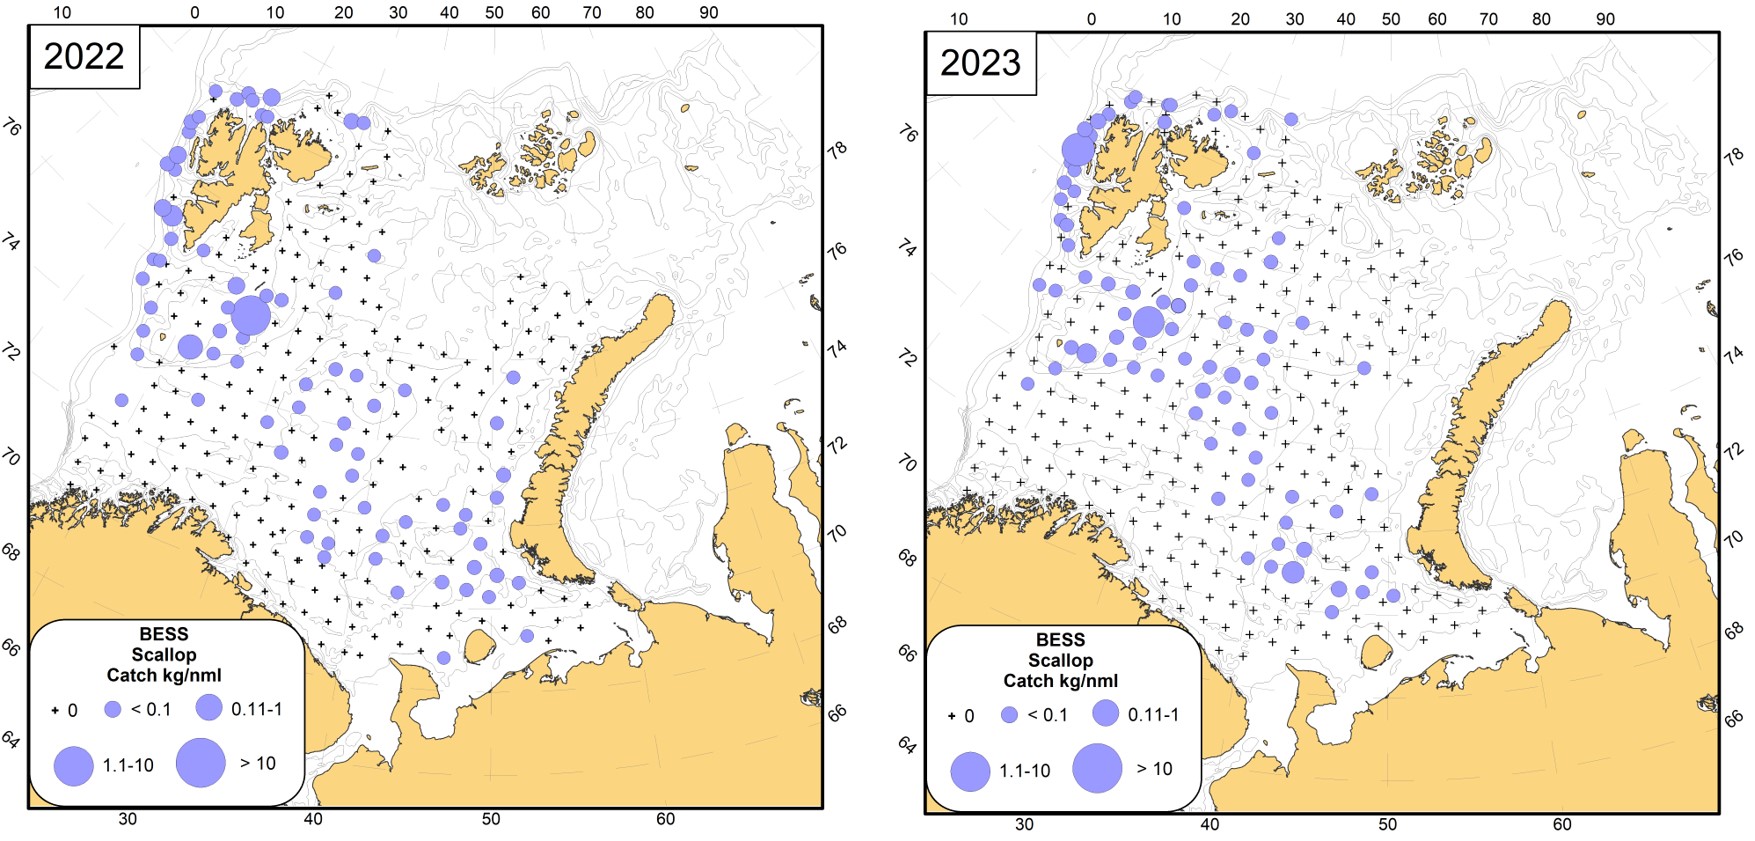
10.4. Iceland scallop (Chlamys islandica)
Text by: D.Y. Blinova, L.L. Jørgensen
Figures by: D. Blinova
The Iceland scallop were recorded in 82 of 317 trawl catches in 2023. The survey showed a wide distribution of scallops in the Barents Sea. The deepest record in 2023 was at 495 m, but the most abundant catches were recorded in the shallow banks and elevations of the bottom is Spitsbergen Bank (Figure 10.4.1).
Figure 10.4.1 Distribution of the Iceland scallop (Chlamys islandica) in the Barents Sea, in the Barents Sea in August-September 2022-2023.
The biomass of scallops in 2023 varied from 1.5 to 1381 g/haul (1.9-1832 g/nml). The average biomass is 87.2±25.1 g/haul (108.1±31.9 g/nml) (table 10.4.1). The abundance ranged from 1 to 251 ind./haul (1-333 ind./nml). The average abundance of scallops is 11±3 ind./haul (14±4 ind./nml).
Table 10.4.1 Annual parameters of scallop population in the Barents Sea.
Year
Stations (% of total)
Abundance, ind./nml
Biomass, g/nml
2012
146 (33)
62±7
1580±195
2013
131 (27)
115±17
8378±1359
2014*
50 (36)
29±4
812±121
2015
103 (31)
13±1
264±32
2016*
76 (24)
18±2
268±38
2017
125 (33)
82±11
1486±198
2018*
65 (30)
31±4
537±91
2019*
112 (35)
42±11
1039±334
2020
97 (23)
15±5
146±40
2021*
88 (35)
20±6
225±51
2022*
77 (27)
34±6
224.8±39.9
2023*
82 (26)
14±4
108.1±31.9
* - survey area was not complete
11 Benthic Invertebrate Community
Author(s):
Natalia Strelkova (VNIRO-PINRO), Lis lindal Jørgensen
(IMR) and Alexandra Kudryashova (VNIRO-PINRO)
Figures by Strelkova N.
The benthic experts onboard Russian and Norwegian RVs are mentioned in Ch. 1, Table 1.
In 2023, bycatch records of megabenthos were made from 316 bottom trawl hauls across four R/Vs during the BESS. Megabenthos was processed to the closest possible taxon with abundance and biomass recorded on all four vessels. This was done by two benthic experts from “VNIRO”, and by nine experts from IMR.
11.1 Species diversity
The total number of megabenthic taxa identified from the trawl-catch across all vessels is presented in Table 11.1. Detailed information about the taxonomic processing onboard the vessels is given in Table 11.2.
A total of 682 invertebrate taxa (453 identified to species level) was recorded in 2023, which is 21 % (19 %) more than in 2022 and the largest number for the entire period of ecosystem surveys (Table 11.1).
In 2023 66.4 % of benthic invertebrate taxa were recorded in species level versus 68.0 % in previous year. In separate cruises the percentage of species identification was not less than 67.5 % and on average amounted to 71.1±2.1 % (Table 11.2).
Table 11.1. The measures obtained in BESS since 2005-2023. Pelagobenthic Pandalus borealis (Northern shrimp) are excluded from abundance and biomass values.
Year
Number of stations
Total
Average abundance, ind./n.ml
Average biomass, kg/n.ml
Number
abundance, ind.
biomass, t
species
taxa
2005
224
83077
2.1
522.5
12.7
142
218
2006
637
779454
20.7
1576 .0
42.1
261
388
2007
551
526263
18.2
1240.2
44.6
222
351
2008
431
757334
12.2
2183.7
35.7
157
244
2009
378
653918
12.3
2056.4
42.2
283
391
2010
319
239282
6.8
900 .0
27.3
273
360
2011
391
1089586
10.8
3411.4
34.3
282
442
2012
443
3521820
42.6
9832.1
125.5
354
513
2013
487
1573121
27.6
3885.0
71.7
362
538
2014
165
390444
5.3
2806.7
36.7
220
333
2015
334
481602
5.3
1815.1
19.9
398
599
2016
317
1116405
6.8
4230.1
36.3
266
423
2017
339
1073697
16.2
3769.4
58.6
319
500
2018
217
852613
15.4
4887.8
89.2
404
574
2019
305
1292902
19.0
4239.0
62.5
427
62 1
2020
4 29
898168
10.7
1719.1
30.4
401
611
2021
254
212931
10.2
1076.6
50.6
384
572
2022
28 7
426850
5.8
2 101 . 2
3 1.3
382
562
2023
316
342433
7 . 0
1318.6
30.5
453
682
Total:
866
1362
Long-term average*:
3 69 ± 29
772786 ± 97169
1 2 . 7 ±1.6
261 8 ±319
44.6± 4.5
31 7 ± 19
4 72 ±2 8
Table 11.2. Statistics of megabenthos bycatch processing and assessment of the quality of taxonomic processing of invertebrates in the BESS 2023.
Research vessels
G.O. Sars
Part 1
G.O. Sars
Part 2
Johan Hjort
Part 1
Johan Hjort
Part 2
Kronprins
Haakon
Vilnyus
Total
Number of processed hauls
38
28
52
26
30
142
316
Phylum
11
11
13
15
12
13
16
Class
26
27
30
30
30
26
36
Order
87
77
91
79
86
70
117
Family
157
135
197
156
165
117
267
Species
195
153
294
191
199
171
453
Total number of taxa
282
217
416
283
295
210
682
Percentage of species identification*
69.1
70.5
70.7
67.5
67.5
81.4
66.4
* calculated as quotient from division of total number of identifications till species to total number of identifications, %
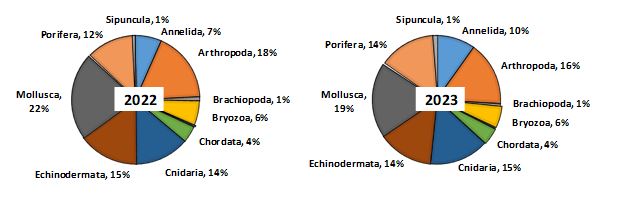
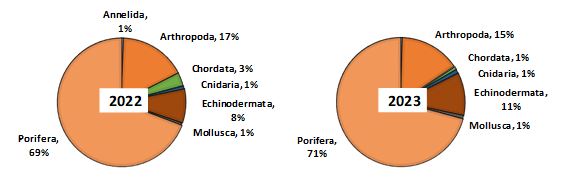
The taxonomical structure of the Barents Sea megafauna is almost identical between 2022 and 2023 (Figure 11.1.1), despite the different interannual area coverage (Figure 11.1.2). Mollusca had the highest number of taxa (128 taxa) followed by Arthropoda (109 taxa), Cnidaria (101 taxa), Porifera (96 taxa), and Echinodermata (94 taxa). Among the mollusks, 72 % of taxa belonged to Gastropoda (72 taxa), 30 % – to Bivalvia (38 taxa), 9 % to Cephalopoda (12 taxa) and the remaining 5 % were distributed between Solenogastres, Polyplacophora, and Caudofoveata. The Arthropoda phylum was primarily presented by Malacostraca (80 taxa) and Pycnogonida (21 taxa); only 6 taxa belong to Thecostraca. Among the Cnidaria 69 % of taxa belonged to Hydrozoa (68 taxa), and 31% to Anthozoa (31 taxa). Among the Echinoderms the most diverse groups were Asteroidea (44 % of taxa), Ophiuroidea (25 % of taxa) and Holothuroidea (17 % of taxa).
Figure 11.1.1 The number of taxa given as the % distribution among megabenthic phyla in the Barents Sea, August-September 2022 and 2023. The groups with the number of taxa less than 1 % are not shown in the diagrams.
The species density in the terms of the number of taxa in standard trawl catches ranged from 1 to 88 with an average of 31.1±1.3 taxa per trawl-catch (versus 30,3±1.4 taxa per trawl-catch in 2022). The differences between 2022 and 2023 data are statistically insignificant at the α-level of 0.05 (p = 0.15).
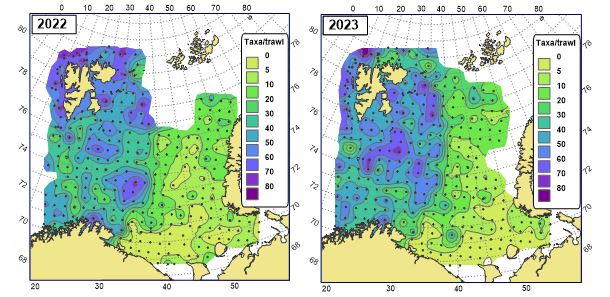
Traditionally, in 2023 the western part of the survey shows a higher level of species diversity than the eastern part of the sea (Figure 11.1.2). The elevated diversity was recorded in water around Svalbard/Spitsbergen, in Spitsbergen and Persey Banks, and in the Central Plateau area. The highest number of taxa in haul (88 taxa) was recorded on the slope north of Svalbard/Spitsbergen at 477 m depth. The lowest level of diversity (1-5 taxa per haul) was recorded in the south-eastern part of the survey area.
Figure 11.1.2 The number of megabenthic taxa per trawl-catch in the Barents Sea in the periods August-September 2022 and 2023.
The ten most frequently species taken by trawl in the investigated part of the Barents Sea in 2023 were the decapod crustaceans Sabinea septemcarinata (taken by 68 % of the trawl-hauls), sea stars Ctenodiscus crispatus (64 %), Pontaster tenuispinus (46 %), and Henricia species (41 %), the brittle stars Ophiopholis aculeate (55 %), Ophiacantha bidentata (54 %), and Ophiura sarsii (51 %), soft coral Gersemia rubiformis (38 %), polychaetes Spiochaetopterus typicus (37 %), and sea spider Nymphon hirtipes (36 %). The lists of the ten most frequently found species in 2022 and 2023 are almost identical except for the absence of sea star Urasterias linckii and the inclusion of sea spider Nymphon hirtipes in 2023.
New species records
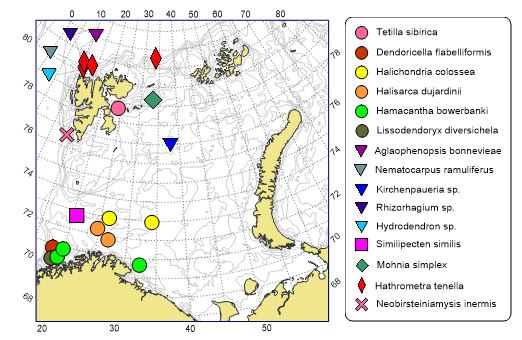
During the BESS 2023 in the Norwegian part of the Barents Sea fifteen new taxa was recorded for the first time since 2005 when the ecosystem surveys started: sponges Tetilla sibirica, Dendoricella flabelliformis, Halichondria (Halichondria) colossea, Halisarca dujardinii, Hamacantha (Vomerula) bowerbanki, and Lissodendoryx (Ectyodoryx) diversichela, hydroids Aglaophenopsis bonnevieae, Nematocarpus ramuliferus, Kirchenpaueria sp., Rhizorhagium sp., Hydrodendron sp., bivalve mollusk Similipecten similis, gastropods mollusk Mohnia simplex, sea lily Hathrometra tenella, and mysids crustacean Neobirsteiniamysis inermis (Figure 11.1.3).
Figure 11.1.3 Sites of finding of megabenthic species that has been named for the first time in 2023 in the Barents Sea and adjacent water since the beginning of the BESS (year 2005).
The record high number (six) of warm water species in the southwest part of the Barents Sea (H. bowerbanki, L. diversichela, D. flabelliformis, H. colossea, H, dujardinii, and Similipecten similis) may be a result of their spreading to the east and north due to the long warming period.
The other new species are previously recorded from the Barents Sea and adjacent shelf areas for surveys other than the BESS and can be a result of a more detailed and/or qualified species identification made by the benthos expert onboard.
11.2 Abundance
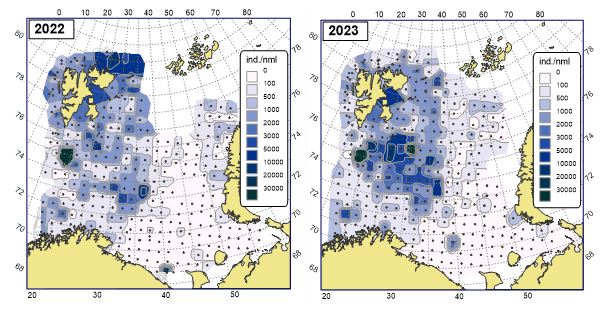
The number of megabenthos individuals in the trawl-catches in 2023 (excluding the pelago-benthic species Pandalus borealis) ranged from 0 to 73854 (0-90841 ind./n.ml) with an average of 1084±266 ind. per trawl-catch (1319±328 ind./n.ml). This is 37 % less than in year 2022 (Table 11.1), what can be caused by interannual variation and difference in station coverage (Figure 11.2.1). The differences between 2022 and 2023 data are statistically insignificant at the α-level of 0.05 (p = 0.50).
The abundance distribution in 2023 was very close to the pattern of previous year (Figure 11.2.1). The largest catch in number of individuals (73854 ind./trawl-catch), mainly consisted of the sea-squirt (Ascidiacea) Rhizomolgula globularis (69760 ind./ trawl-catch) and of the sea barnacle Balanus balanus (2119 ind./ trawl-catch). These catches were obtained in the western part of the Barents Sea near Bear Island (75.00° N, 19.00° E) at the depth of 60 m (Figure 11.2.1). Similar trawl hauls with very high numbers of individuals of the sea-squirt Rhizomolgula globularis were recorded in 2021 and 2022 within the precise same position and depth. As in previous year, the lowest abundances (less than 50-100 ind. per haul) was recorded in the south-eastern part of the sea within the Russian part of the survey.
Figure 11.2.1 Abundance (ind./n.ml) of megabenthos (excluding Pandalus borealis) in the Barents Sea in August-September 2022 and 2023.
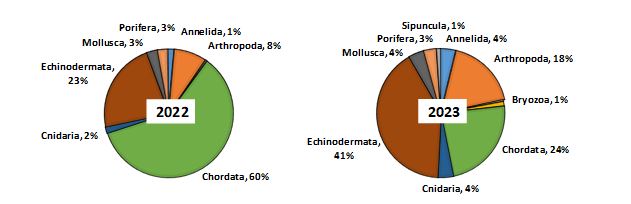
In 2023, the abundance distribution across the main megabenthic groups (%, excluding Pandalus borealis) in the Barents Sea was dominated by Echinodermata, Chordata (due to high local concentration of sea-squirt Rhizomolgula globularis), and Arthropoda (Crustacea makes up the main part). This is in accordance with the long-term pattern (Figure 11.2.2).
Figure 11.2.2 The distribution of abundance (excluding Pandalus borealis) across the main megabenthic groups (%) in the Barents Sea, August-September 2022 and 2023. The groups with number of individuals less than 1 % of total are not shown in the diagrams.
The ten most abundant species (in the term of total number of individuals caught during the BESS 2023) were the sea star Ctenodiscus crispatus (20.7 % of total abundance), sea-squirts Rhizomolgula globularis (20.4 %) and Kukenthalia borealis (2,7 %), shrimp Sabinea septemcarinata (6,3 %), the brittle stars Ophiacantha bidentata (4,1 %), Ophiopholis aculeata (2,7 %), and Ophiura sarsii (1.9 %), sea urchins of genera Strongylocentrotus (in the main S. pallidus) (6,5 %), bivalve Bathyarca glacialis (1.7 %) and barnacle Balanus balanus (4,7 %).
11.3 Biomass
As in previous years in 2023, Sponges, Echinoderms, and Crustaceans made up the main part of the total megabenthic biomass (97 %) (Figure 11.3.1).
Figure 11.3.1 The distribution of biomass (excluding Pandalus borealis) across the main megabenthic groups (%) in the Barents Sea, August-September 2022 and 2023. The groups with the biomass less than 1 % of total are not shown in the diagrams.
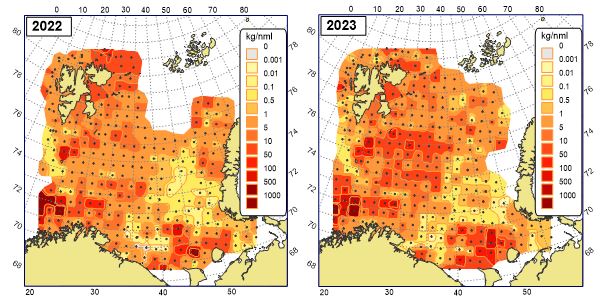
The megabenthos biomass taken by the trawl (excluding the semi-pelagic species Pandalus borealis) in 2023 varied from 0 to 1663 kg (0-3227 kg/n.ml) with an average of 22.2±6.9 kg per trawl-catch (30.5±11.8 kg/n.ml). This average is 2.5 % less than in the previous year and 31.6 % less than the average long-term value for the period 2006-2022 except the invalid 2012 (Table 11.1). The differences between 2022 and 2023 data are statistically insignificant at the α-level of 0.05 (p = 0.47).
The biomass distribution in 2023 was very close to the pattern of previous years (Figure 11.3.2).
Figure 11.3.2 The biomass distribution of megabenthos (excluding Pandalus borealis) in the Barents Sea in August-September 2022 and 2023.
A trawl catch with biomass larger than 1-t was taken in 2023 at one station in the south-western part of the Barents Sea, from 332 m depth (Figure 11.3.2). This haul was dominated by sponges: Geodia macandrewii (915 kg and 55.0 % of the total station biomass), G. barretti (550 kg; 33.1 %) and G. phlegrae (27,0 kg; 1.6 %), Stelletta rhaphidiophora (95 kg; 5.7 %) and Stryphnus fortis (18.5 kg; 1.1 %). Other stations with biomass more than 100 kg per trawling was recorded in nearest area in south-western part of the sea (dominated by Geodia sponges, too), in Spitsbergen Bank at the depth 48 m (dominated by 141 kg of sea cucumber Cucumaria frondosa accounting for up to 85 % of the total biomass in the station), and in the south-eastern part of the sea, north of Kanin Nos peninsula at the depth 85-100 m (103-130 kg of Paralithodes camtschaticus making up to 99,9 % of the total biomass on the station).
More than half of the megabenthic biomass (65.4 % of the total biomass of by-catches) belonged to the sponges of Geodia genera (G. barretti, G. macandrewii, G. atlandica and G. phlegraei) and associated with its sponges Stelletta rhaphidiophora and Stryphnus fortis. Other top-dominant species in biomass was crabs Paralithodes camtschaticus (10.7 % of the total biomass) and Chionoecetes opilio (2.2 %), sea star Ctenodiscus crispatus (2.1 %), and sea-cucumber Cucumaria frondosa (1.3 %), sea urchin of the genera Strongylocentrotus (1.3 %) and shrimps Sabinea septemcarinata (1.2 %). The contribution of each of the other species did not exceed 1 % of the total biomass of megabenthos bycatches and in sum add up less 10 % of it.
12 Marine Mammals and Seabirds
Author(s):
Roman Klepikovskiy (VNIRO-PINRO), Nils Øien
, Frederike Boehm
(IMR), Per Fauchald (NINA), Victoria Marja Sofia Ollus (NINA), Jonathan Ford (NINA) and Gary Elton (NINA)
12.1 Marine Mammals
Text by Text by R. Klepikovskiy, N. Øien, F. Boehm
Figures by R. Klepikovskiy
Marine mammal observers participated onboard all Norwegian and Russian RVs of BESS 2023. Total search effort added up to 6561 km for Norwegian, and 4917 km for Russian vessels. In total, 758 observations including 2734 individuals of 14 marine mammal species were recorded during BESS, with 205 individuals not identified to species level. Distributions of marine mammals are given by numbers in Table 12.1.1 and locations of selected toothed and baleen whale species in Figures 12.1.1 and 12.1.2.
Table 12.1.1. Number of marine mammal observations and individuals recorded during the BESS in 2023.
Species
Number of
observations
Number of individuals
Average
group size
Minke whale
180
183
1.0
Fin whale
69
96
1.4
Humpback whale
74
116
1.6
Bowhead whale
1
1
1
White-beaked dolphin
301
1805
6.0
Harbour porpoise
12
24
2
Killer whale
2
6
3
Sperm whale
10
13
1.3
White whale
1
200
200
Harp seal
18
73
4.1
Ringed seal
1
1
1
Bearded seal
2
2
1
Walrus
3
7
2.3
Polar bear
2
2
1
Unidentified large whale
34
37
1.1
Unidentified dolphin
44
164
3.7
Unidentified cetacean
1
1
1
Unidentified small cetacean
1
1
1
Unidentified seal
1
1
1
Unident. marine mammal
1
1
1
Totals
758
2734
As in previous years, the most frequently observed and widely distributed species was the white-beaked dolphin (Lagenorhynchus albirostris) with higher numbers north of 74°N.
Other dominant species sighted during the ecosystem survey included the baleen whales minke (Balaenoptera acutorostrata), humpback (Megaptera novaeangliae) and fin (Balaenoptera physalus) whale. Minke whales were distributed mainly in the waters around Svalbard/Spitsbergen along with concentrations of capelin and in the southern regions of the BS with aggregations of herring, sand-eel and juvenile codfishes. Humpback whales were recorded mostly in areas east of Svalbard/Svalbard where they overlap with the traditional capelin concentrations, often together with fin and minke whales. Fin whales were widely distributed in the western survey areas, in greatest abundance in waters east of Spitsbergen.
Among the baleen whales north of Spitsbergen, one bowhead whale (Balaena mysticetus) was also recorded (incidental sighting).
Besides white-beaked dolphins, other toothed whales recorded included sperm whale (Physeter macrocephalus), harbour porpoise (Phocoena phocoena), killer whale (Orcinus orca) and white whale (Delphinapterus leucas). Sperm whales were mainly observed in western areas (west of 20°E) and in deeper waters along the continental slope. while three sperm whale sightings were also recorded east of 30°E off the coast of Norway. Harbour porpoises were found in areas south of 74°N. Killer whales were recorded in waters south and east of Svalbard/Spitsbergen.
A large group of white whales (200 individuals) was sighted incidentally off Longyearbyen, Spitsbergen.
During the survey period, the following pinniped species were observed: Harp seal (Pagophilus groenlandicus), bearded seal (Erignathus barbatus), ringed seal (Pusa hispida) and walrus (Odobenus rosmarus). The main concentrations of these species were found north of 80°N in areas of newly formed ice. Two polar bears (Ursus maritimus) were also observed in this area.
Figure 12.1.1. Distribution of toothed whales in BESS 2023
Figure 12.1.2. Distribution of baleen whales in BESS 2023
12.2 Seabirds
Text by P. Fauchald, R. Klepikovskiy, V.M.S. Ollus, J. Ford, G. Elton
Figures by P. Fauchald
Seabird observations were carried out by standardized strip transect methodology. Birds were counted from the vessel’s bridge while the ship was steaming at a constant speed of ca. 10 knots. All birds seen within an arc of 300 m from directly ahead to 90° to one side of the ship were counted. Counts were done only during daylight and when visibility allowed a complete overview of the transect. On GO Sars and Johan Hjort, birds following the ship i.e. “ship-followers”, were counted as point observations within the sector every ten minutes. Ship-followers included the most common gull species and Northern fulmar. On Vilnus, ship-followers were counted continuously along the transects, and by a point observation at the start of each transect. The ship-followers are attracted to the ship from surrounding areas and individual birds are likely to be counted several times. The numbers of ship-followers are therefore probably grossly overestimated.
The Norwegian sector was covered by GO Sars, Johan Hjort and Kronprins Haakon in the period 19 August to 4 October. The Russian sector was covered by Vilnus in the period from 11. August to 25 September. Total transect length covered by GO Sars, Johan Hjort and Kronprins Haakon was 4360 km. Total transect length covered by Vilnus was 5026 km. A total of 73 119 birds belonging to 39 different species were counted. The distribution of the dominant auk species is shown in Figure 12.11 and the distribution of the most common gull species and Northern fulmar is shown in Figure 2.
Broadly, the distribution of the different species (Figures 12.2.1 and 12.2.2) was similar to the distribution in previous years. For the auks (Figure 12.2.1), high density of little auks (Alle alle) was found north of Svalbard/Spitsbergen. Thick-billed murres (Uria lomvia) were found in the northern part of the Barents Sea with the highest densities east and north of Svalbard/Spitsbergen. Atlantic puffins (Fratercula arctica) were found in the southern and western Barents Sea and common guillemots (Uria aalge) were found in the southern part of the area. Northern fulmar (Fulmarus glacialis) and black-legged kittiwake (Rissa tridactyla) were encountered throughout the Barents Sea but with highest density of fulmars north of Svalbard/Spitsbergen and highest density of kittiwakes in the northeast (Fig 12.2.2). For the large gull species, herring gull (Larus argentatus) and great black-backed gull (Larus marinus) were found along the coast of Kola and Finnmark, while glaucous gull (Larus hyperboreus) was mainly encountered in the southeastern Barents Sea and Pechora Sea but was also present north of Svalbard/Spitsbergen.
As a consequence of the outbreak of highly pathogenic avian influenza (HPAI) thousands of dead seabirds, mostly kittiwakes and fulmars were found dead in or close to the breeding colonies on Svalbard/Spitsbergen and Northern Norway in the summer of 2023. We did not observe a large number of dead birds at sea, in total 22 dead birds, mostly fulmars were observed during the cruise.
Figure 12.2.1. Density of auk species along seabird transects in 2023. White-filled circles are zero density.Figure 12.2.2. Density of the most common gull species and Northern fulmar along seabird transects in 2023. White-filled circles are zero density. Note that because these species are attracted to and tend to follow the ship, densities are systematically over-estimated.