Gå til hovedinnhold
Havforskningsinstituttet
HI
English
<- Tilbake
Søk
Søk
Søk
View page in English
Figur
Fra rapporten:
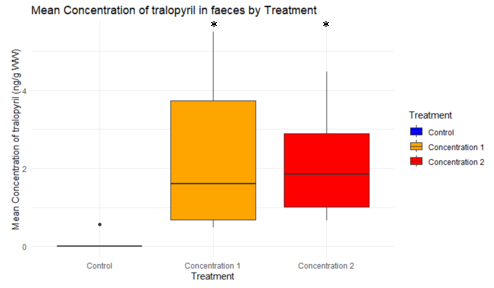
Analysis of uptake of tralopyril and transformation products in salmon exposed to tralopyril coated net pen
Figure 9. Concentrations of tralopyril in faeces by treatment. All measurements were done after 30 days of exposure. N=10 per group. * indicates statistically significant difference in mean from control.