Analyse av opptak av tralopyril og nedbrytingsprodukt av tralopyril i laks som har blitt eksponert for tralopyril impregnert not
Siden 2017 har bruken av Econea eller tralopyril som antigroemiddel i norsk akvakultur vært økende fordi tralopyril har blitt brukt som et erstatningsstoff for Cu2O. I 2022 ble 98 tonn tralopyril brukt til dette formålet. I forhold til mattrygghet og miljøeffekter er det viktig at bruk og skjebne i miljøet for tralopyril og nedbrytingsprodukt er godt dokumentert.
Målet for denne studien har vært å simulere forekomst av tralopyril i merden og dokumentere i hvilken grad tralopyril og potensielle transformasjonsprodukt blir bioakkumulert i laks i et kontrollert laboratorieforsøk. Laks av ca 200 g ble holdt i 1000 L tanker med tralopyril impregnerte sylinderformete notbiter med gjennomstrømmende vann i 30 dager. I eksperimentet brukte vi notbiter med overflate på 71x71 cm impregnerte med coating med 3.0 eller 4.5% tralopyril for å simulerere realistiske forhold.
Den målretta analytiske metoden utviklet ved Havforskningsinstituttet ved bruk av væske kromatografi koblet til trippel quadrupol masse spectrometri (LC-QqQ) gav en kvantifiseringsgrense (LOQ) for tralopyril på 0.061 ng/g i biota eller µg/l i sjøvann.
Vi målte tralopyril > LOQ i sjøvann i tankene eksponert for coating på 4.5% tralopyril, selv om det ble tatt opp i laksemuskel også i tankene med 3 % coating. Vi kunne måle bioakkumulering av tralopyril i laksemuskel > LOQ i 40 til 100 % i tankene med begge coatingkonsentrasjonene ved ulike tidsuttak. Tralopyrilnivå i 30 fisk ble målt per behandling. Den laveste prosentandelen (40 %) ble målt i laksemuskel fra 3% coating i fisk som ble tilsatt karet 24 timer etter at den impregnerte notbiten var tilsatt karet og laksen hadde stått i karet i 24 timer. Den høyeste konsentrasjonen av tralopyril i laksemuskel ble målt til 0.34 ng/g våt vekt (vv) fra en tank med not impregnert med 3% tralopyril etter 24 timers eksponering. Feces og lever ble prøvetatt etter 30 dagers eksponering, 10 fisk per gruppe. De høyeste nivå av tralopyril ble funnet i fekalier, der vi målte konsentrasjoner på 5.5 ng/g vv, og tralopyril ble påvist >LOQ i alle individene fra tankene med både 3.0 % and 4.5 % coating. Lever viste 10-20 prosent forekomst av tralopyril > LOQ i alle gruppene.
Ved bruk av væskekromatografi koblet til høyoppløselig massespektrometri (LC-HRMS), søkte vi etter flere transformasjonsprodukt av tralopyril, men fant bare det de-brominerte produktet av tralopyril, 2-(4-chlorophenyl)-5-hydroxy-4-oxo-5-(trifluoromethyl)-4,5-dihydro-1H-pyrrole-3-carbonitrile (HTFCCP). Målingene av HTFCCP er semikvantitative ved at vi brukte responsfaktor til tralopyril i analysen. Den høyeste estimerte nivået av HTFCCP i både lever og fekalier ble funnet i individ eksponert for 4.5 % tralopyril. Vi fant ingen statistisk evidens for forskjell mellom de to coatingkonsentrasjonene på grunn av lavt antall individ analysert per gruppe, selv om der synest å være en trend av økende konsentrasjon i fekealier i gruppen med 4,5 % coating.
Ingen grenseverdier for kjemikalierester (MRL) er foreløpig satt for tralopyril. Når tralopyril ble godkjent som antigroemiddel av EU kommisjonen ble det framhevet at produktvurdering skulle bli gitt spesiell oppmerksomhet I forhold til eksponering, risiko og effektivitet. Tap og utslipp skulle være minimert og bli samlet opp for gjenbruk og avhending. For produkt som kunne føre til restnivå i mat eller fôr, er det behov for å sette MRL verdier og tilstrekkelige tiltak skal settes for å sikre at disse ikke blir overskredet.
Basert på resultatene fra denne studien med ny og sensitive metode som resulterer i lave LOQ verdier og opptak laksemuskel i 90-100 % av individene og påvisning i fekalier til 100 % av individene etter 30 dagers eksponering, trengs det etablering av MRL verdier for bruk av tralopyril sammen med ny gjennomgang av godkjenningen for tralopyril brukt som antigroemiddel i akvakultur.
Preface
This report is performed on contract with Netkem AS, Norway. NetKem is a manufacturer of antifouling products for aquaculture nets. Experimental set up was discussed with researchers at Institute of Marine Research, Norway beforehand. The exposure experiment and sampling were performed by LetSea AS, Dønna, Norway. Letsea is a research centre for aquaculture. We thank the staff at LetSea AS for excellent performance and high-quality material.
Summary
Since 2017 the use of ECONEA or tralopyril as an antofoulant has been increasing in Norwegian aquaculture as tralopyril has been used as an replacement fro Cu2O. In 2022, 98 tons of tralopyril was used for this purpose in Norway.
In relation to both food safety and environmental effects, it is important that use and environmental fate of tralopyril and its degradation products is well documented.
The aim of this study has been to simulate the occurrence of tralopyril in net pens and its bioaccumulation and potential transformation products in salmon in a controlled laboratory experiment. Salmon of approx. 200 g were kept in 1000 L tanks with tralopyril impregnated cylindrical net pens with flow through water for 30 days. For the experiment we used net pens with surface of 71x71 cm either coated with tralopyril at 3.0% or 4.5% to simulate realistic conditions.
The targeted analytical method developed at Institute of marine Research (IMR) using liquid chromatography coupled to triple quadruple mass spectrometry (LC-QqQ) gave a limit of quantification (LOQ) of tralopyril of 0.061 ng/g in biota or µg/l in sea water.
In sea water, tralopyril was measured > LOQ only in tanks exposed to nets coated with a concentration of 4.5% tralopyril, although it was taken up is salmon muscle also in the tank with 3 % coating. Levels < LOQ in the tanks with 3 % coating is probably due to dilution when using flow through water (water exchange rate was 3000 l/hour) and short half life (9-16 hours) of tralopyril in sea water. We were able to measure bioaccumulation of tralopyril to salmon muscle > LOQ in 40 to 100 % in both treatments at different time points. 30 fish were masured per treatment group. The lowest percentage (40 %) was measured in muscle of salmon from the low dose (3.0%) introduced to tanks 24 hours after coated net pens were added and sampled after 24 hours. The highest concentration of tralopyril in salmon muscle was measured to 0.34 ng/g wet weight (ww) from a tank with net coated with 3.0 % after 24 hours. Faeces and liver were sampled after 30 days of exposure, 10 fish per group. The highest levels of tralopyril were found in faeces, measuring up to 5.5 ng/g ww, and tralopyril was detected at levels >LOQ in all individuals from both the 3.0 % and 4.5 % tanks. Liver showed 10-20 percent occurrence of tralopyril > LOQ in all groups.
Using liquid chromatography coupled to high resolution mass spectrometry (LC-HRMS), several transformation products of tralopyril were screened. However, we only detected the de-brominated product of tralopyril, 2-(4-chlorophenyl)-5-hydroxy-4-oxo-5-(trifluoromethyl)-4,5-dihydro-1H-pyrrole-3-carbonitrile (HTFCCP), and its concentration was semi quantified using tralopyril response factor. The highest estimated levels of HTFCCP in both liver and faeces were found in individuals exposed to 4.5 % tralopyril. There were no statistical evidence of differences between the treatment groups, due to the low number of individuals analyzed per group. Though, there appears to be a trend of increasing concentration found faeces in the 4.5% tralopyril coating.
No maximum residue levels (MRLs) are at present set for tralopyril. When tralopyril was approved as as antofouling product by the Commission it was emphasized that the product assessment should pay particular attention to the exposures, the risks and the efficacy linked to any uses covered by an application. Losses and emissions to the environment should be minimised and any losses or waste containing tralopyril should be collected for reuse or disposal. For products that may lead to residues in food or feed, the need to set new or to amend existing MRLs should be verified, and any appropriate risk mitigation measures should be taken to ensure that the applicable MRLs were not exceeded.
Based on the results of this study with highly sensitive detection methods resulting in low LOQ and uptake > LOQ in salmon muscle in 90-100 % of the individuals and occurrence > LOQ in faeces of 100 % of salmon after 30 days of exposure, the need to set MRLs from use of tralopyril are emphasized together with a need for reassessment of tralopyril used as antifouling agent for aquaculture.
1 - Introduction
Fouling is a challenge for aquaculture in open net pens, and copper (Cu2 O) has been the dominating antifouling compound used in Norwegian aquaculture until recently. Due to increasing focus on negative environmental effects from use of copper, its use has decreased since the maximum in 2019 (Grøsvik et al., 2022), mainly replaced by tralopyril, also named ECONEA (Janssen PMP, 2024). In this period the use of tralopyril in Norwegian aquaculture has increased from 0 tons in 2016 to 98 tons in 2022 (Miljødirektoratet.no).
ECONEA or tralopyril (4-bromo-2-(4-chlorophenyl)-5-(trifluoromethyl)-1H-pyrrole-3-carbonitrile) is the main photolysis degradation product of the insecticide Chlorfenapyr (EFSA, 2023). Tralopyril has been approved for use as a new active substance for use in biocidal products for product type 21 antifouling products in 2014 (European Commission, 2014). The mode of action of tralopyril is to uncouple mitochondrial oxidative phosphorylation and is therefore a broad spectrum antifoulant, although some companies also use zink- or copperpyrithione together with tralopyril, as the latter may be more effective towards algae growth (Dahllof et al., 2005). There are several conditions to the approval of tralopyril as to prevent losses and minimize emissions to the environment, and that any losses or waste containing tralopyril shall be collected for reuse or disposal. Tralopyril has been introduced as a more environmental friendly alternative to Cu2O as it has a short half life in sea water of approx. 16 hours at 9 ° C by Janssen (2024), although we still lack knowledge of its fate and impact related to its use and discharge.
At present there are no set maximum residue levels (MRLs) for tralopyril (EFSA, 2023). For products that may lead to residues in food or feed, the approval state the need to set MRLs in accordance with Regulation (EC) No 470/2009 of the European Parliament and of the Council or Regulation (EC) No 396/2005 of the European Parliament and of the Council, and any appropriate risk mitigation measures shall be taken to ensure that the applicable MRLs are not exceeded (European Commission, 2009; European Commission, 2005) .
When no MRLs have been set for tralopyril in food or livestock, it is difficult to perform risk assessments. For chlorfenapyr, the lack of MRL has lead to setting maximum levels to levels of quantification (LOQ). LOQ for chlorfenapyr in food has been set to 0.01 mg/kg and in tea to 0.8 mg/kg (EFSA, 2023). When doing risk assessments, tralopyril has been given a 10 times higher potency factor for toxicity compared with chlorfenapyr (EFSA, 2023).
Environmental quality standard (EQS) for tralopyril is not yet suggested for sea water due to lack of data, but for fresh water EQS is suggested to 2 ng/l (Martins et al. 2018).
It is important that tralopyril and its degradation products are well documented both for assessments of food safety and environmental effects. The aim of this study was to investigate the potential leakage of tralopyril from impregnated net pens into surrounding water, its uptake by farmed salmon, and its possible biotransformation and excretion through faeces. The experiment tested salmon in tanks which contained cylindrical net pens of 71x71 cm either coated with tralopyril at 3% or 4.5 % (% weight). The experiment lasted for 30 days and samples of water, muscle, faeces and liver were taken.
2 - Material and methods
2.1 - Exposure experiment
Nine glass fiber tanks of 2000 L were used during the trial. These were equipped with a 24 h mechanical band feeders. Each tank was equipped with a ceramic gas diffuser for oxygen distribution. The water derived from the main saltwater system at LetSeas facility at Bjørn, Dønna, Norway. The water was pumped up from 140 m debt and UV filtered before entering the tanks, ensuring clean saltwater of stable temperatures at 7-8 degrees Celsius. Water exchange rate was 3000 l/hour (1.5 times total volume pr. hour).
Exposed tanks were equipped with a piece of net (71cm x 71 cm) coated with either 3.0 % tralopyril or 4.5 % tralopyril which are options of fouling concentrations used for net pens. The area of coated net pen was used to simulate realistic water volume to net area. The exposure experiment and sampling of material were performed by LetSea during August 2023 as shown in Table 1. Experiment was performed with smolt of 211±81 g (10-90 fish per tank) in triplicates (LetSea 2023).
Date
Activity
01.08.2023
- T0 sampled - 10 fish added to each of the trial tanks - Coated nets added to the system (Figure 1)
02.08.2023
- The 10 fish from each tank were culled, weighed and sampled according to sampling protocol (24 (I) hours exposure) - 90 new fish were weighed into the tanks
03.08.2023
- 10 fish from each tank were culled, weighed and sampled according to sampling protocol (24 (II) hours exposure)
09.08.2023
- 10 fish from each tank were sampled (one week)
30.08.2023
- 10 fish sampled
31.08.2023
- All remaining fish were culled and weighed
Table 1. Trial set up and dates for sampling.
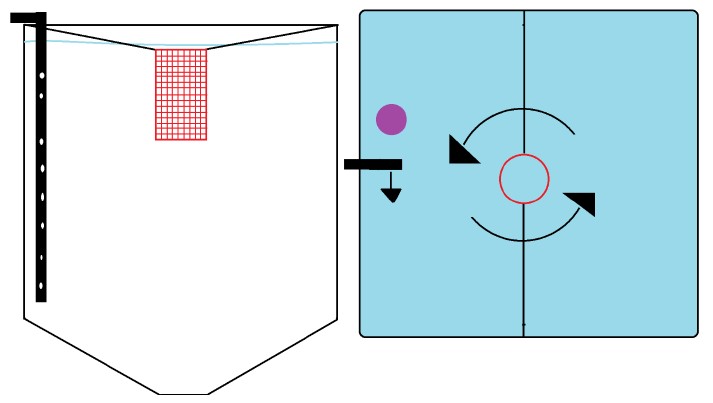
Figure 1. Tank overview. Left part shows cylindrical coated net pen. Right part shows water current and sampling point for water sampling (LetSea 2023).
2.2 - Sampling
Sea water was sampled 1 min, 1 hour, 3 hours, 24 hours, 48 hours, 7 days and 30 days after exposure start. Muscle (Norwegian quality cut NQC), liver, faeces and water samples were frozen at – 20°C. NQC samples were filleted, and the muscle tissues were homogenized using a kitchen bench mixer (Braun GmbH, Kronberg, Germany). Liver samples were homogenized using a Polytron PT 2100 benchtop homogenizer. All equipment was washed between each individual sample to hinder contamination between samples.
2.3 - Sample preparation (fish muscle, liver, and faeces)
Samples were weighed into 50 ml tubes, at 3g for muscle tissues, 2g for liver tissues, and 1g for faeces. Samples were spiked with 100µL of M8PFOSA (100 ng/ml) prepared in isopropanol as internal standard. Four mL of MilliQ water was added and the samples were vortexed (Labnet VX 100 vortex mixer) for 10 seconds before adding 5mL of LC/MS grade Acetonitrile (Fisher Scientific). The samples were then shaken for 10 minutes, before adding extraction salts (SupelTM QuE Non-buffered Tube 2). Each sample was shaken vigorously directly after adding to hinder dimerization. All samples were then vortexed for 30 seconds.
Samples were centrifuged at 2500 rpm for 5 minutes (Eppendorf 5810) before transferring the top 4 mL of supernatants into 15 mL tubes. The supernatants were subjected to further clean-up by performing dispersive solid phase extractions, SupelTM QuE PSA/ENVI-Carb TM Tube 3 was added into the tubes and vortex mixed for 10 minutes before repeating the centrifuge program. Finally, 1mL of supernatants from each sample was pipetted into 2mL vials and taken to the triple quadrupole instrument for analysis.
1 mL sea water from each tank was spiked with 100 µl internal standard (M8PFOSA) and mixed before analysis. The injection volume for each sample was 20 µl.
2.4 - Quantification of tralopyril using liquid chromatography triple quadrupole tandem mass spectrometry (LC-QqQ)
Tralopyril was separated using Zorbax Eclipse Plus C18 Rapid Resolution HT (4.6x100 mm, 1.8 µm) maintained at 25°C using an Agilent 1290 series HPLC (Agilent Technologies, Waldbronn, Germany). Tralopyril and the internal standard used (M8FOSA) were both detected as negative ions with the multiple reaction monitoring shown in Table 2.
Liquid chromatography triple quadrupole tandem mass spectrometer (LC-QqQ) Agilent 6495 (Agilent Technologies, Santa Clara, CA, USA) equipped with an electrospray ionization (ESI) interface and iFunnel ionization was used for separation. The mobile phase was mixture of 5 mM ammonium acetate in water (C) and 5 mM ammonium acetate in methanol (D) pumped at a flow rate of 0.3 ml/min for 15 min as shown in Table 3. The ESI parameters were gas temperature (250°C), gas flow rate (11L/min), nebulizer pressure (25 psi), sheath gas temperature (375°C), sheath gas flow (11L/min), capillary voltage (2500 V) and nozzle voltage (1500V). MassHunter Qualitative Navigator software (version 8.0) was used for data processing.
Compound Name
Precursor Ion
MS1 Res
Product Ion
MS2 Res
Dwell
Fragmentor
Collision Energy
Cell Accelerator Voltage
Polarity
Tralopyril
348.9
Unit
270.099
Unit
50
380
30
4
Negative
Tralopyril
348.9
Unit
131.1
Unit
50
380
50
4
Negative
Tralopyril
346.9
Unit
78.9
Unit
50
380
50
4
Negative
M8FOSA
506
Unit
78
Unit
50
380
36
4
Negative
Table 2. Monitored ion transitions and their individual instrument settings.
Time (min)
A (%)
B (%)
C (%)
D (%)
Flow (ml/min)
Max. Pressure Limit (Bar)
0.00
0.00
0.00
40.00
60.00
0.300
600.00
1.00
0.00
0.00
40.00
60.00
0.300
600.00
1.01
0.00
0.00
0.00
100.00
0.300
600.00
6.00
0.00
0.00
0.00
100.00
0.300
600.00
6.01
0.00
0.00
40.00
60.00
0.300
600.00
15.00
0.00
0.00
40.00
60.00
0.300
600.00
Table 3. Mobile phase gradient used in LC-QqQ.
2.5 - Determination of tralopyril transformation products by high-resolution accurate-mass (LC-HRMS)
The transformation of products of tralopyril were screened using ultrahigh performance liquid chromatography (Vanquish Flex UHPLC system, Thermo Fisher Scientific, USA) coupled with Thermo Scientific™ Orbitrap Exploris™ 120 high-resolution mass spectrometer equipped with a heated electrospray ionization source (H-ESI) (UHPLC-Q-Orbitrap HRMS). Analytes were separated chromatographically on ZORBAX Extend plus C18 column (RRHD 2.1 × 100 mm, 1.8 μm, Agilent Technologies, USA). MS parameters are depicted in Table 4. LC-HRMS raw data obtained from both methods were processed using Thermo Scientific™ TraceFinder™ 5.1 software using a library including a list of target analytes which includes molecular formula, adduct, retention time, and fragments. Mass error for both target MS1 and MS2 was set to 5 ppm and the isotopic profile match to 70%.
Parameter
Value
Scan Type
data-dependent acquisition (DDA)
Ionization Mode
H-ESI negative
Spray voltage (V)
3000
Sheat gas (Arb)
40
Aux gas (Arb)
10
Sweep gas (Arb)
1
Ion Transfer Tube Temperature (°C)
300
Orbitrap Resolution
60 000 @ m/z 200
Scan Range (m/z)
400-600
RF Lens (%)
70
HCD Collision Energies (V)
20, 60, 100
Orbitrap Resolution
30 000@ m/z 200
Table 4: HRAMS parameters.
2.6 - Quality Control
Empty tubes (n=3) were used as procedure blanks and were treated in the same manner as real samples. To control the carryover effect, acetonitrile was injected with every 10 samples. No significant carryover effect was observed. Concentrations that were above the limit of detection (LOD) and below the limit of quantitation (LOQ) were unchanged. The LOD and LOQ were calculated using the standard deviation of the response and the slope as recommended by the international conference on harmonization (ICH) and the values are given in Table 5. To assess the method accuracy performance in terms of trueness (as recovery) and precision (as repeatability), control samples were fortified with 0.5 and 5 ng of tralopyril in addition to unfortified control samples, the recovery is shown in Table 5. Due to the lack of its isotopically matched internal standard, tralopyril was quantified in samples using matrix matched calibration curve with M8PFOSA as internal standard (See Figure 2).
LOD (ng/g) (ng/ml)
0.020
LOQ (ng/g) (ng/ml)
0.061
Recovery % (0.25 ng/g, n=4)
119±13.4
Recovery % (2.5 ng/g, n=2)
112±5
Table 5. LOD, LOQ, and recovery % of tralopyril.
Figure 2. Calibration curve of tralopyril.
Figure 3. representative MRM chromatograms for tralopyril (top panel) and internal standard (bottom panel) in standard solution (2.5 ng/mL).
Figure 4 . representative MRM chromatograms for tralopyril (top panel) and internal standard (bottom panel) in selected fish faeces sample.
Figure 5. representative MRM chromatograms for tralopyril (top panel) and internal standard (bottom panel) in selected fish liver sample.
Figure 6. representative MRM chromatograms for tralopyril (top panel) and internal standard (bottom panel) in selected fish muscle sample.
3 - Results and discussion
3.1 - Exposure experiment
Although statistical differences between growth and feed efficiency were not observed between the exposed groups and the control groups, fish in the reference tanks seemed to perform better overall than in the coated tanks. There were no observable differences in the welfare scores between the control groups and the exposed groups. Reasons for variations were explained by intensive sampling regime causing repeated stress in the tanks and thereby varying growth and feed intake responses. This was exacerbated by the relatively short trial duration (LetSea 2023).
3.2 - Sensitivity of chemical analyses
The new method developed at IMR using LC-QqQ gave a LOQ of tralopyril to 0.061 ng/g and satisfying recovery (Table 5). For results on the transformation product 2-(4-chlorophenyl)-5-hydroxy-4-oxo-5-(trifluoromethyl)-4,5-dihydro-1H-pyrrole-3-carbonitrile (HTFCCP) analysed by LC-HRMS, we did not have access to a reference standard and the results of HTFCCP quantification are semi-quantitative.
3.3 - Concentration of tralopyril in water
Measurements of water concentration demonstrated 0 levels in tank with control and nets coated with 3.0% tralopyril. In tank with net pen coated with 4.5% tralopyril we measured levels from 0 – 0.105 µg/l. The highest concentration of tralopyril was measured 3 hours after exposure start (Table 6). Levels in tanks from control and net with 3.0 % coating was < LOQ, and levels measured after 7 and 30 days from tank with 4.5 % coating were <LOQ.
Time
Control (µg/l)
3.0 % coating (µg/l)
4.5 % coating (µg/l)
1 min
0
0
0
1 t
0
0
0
3 t
0
0
0.105
24 t
0
0
0.089
7 d
0
0
<LOQ
30 d
0
0
<LOQ
Table 6. Water concentrations of tralopyril with different treatments and times after addition of coated net pens.
3.4 - Uptake of tralopyril in salmon muscle
Despite levels of tralopyril in water of the tank with 3.0 % coating were < LOQ, levels were taken up in salmon muscle from both coating concentrations. The number of salmon muscle analysed per group were 30. Percentage of samples with tralopyril levels > LOQ for the whole experiment is shown in Table 7. From the exposed groups 40-100 % of salmon had tralopyril levels > LOQ. Lowest levels (40 %) were observed in the tank “Muscle -24(2) hours”. This included salmon added to the tanks 24 hours after the coated net pens were added (Table 7).
Number of samples analyzed per group
% of samples with tralopyril in control >LOQ
% of samples with tralopyril in 3% tralopyril coating >LOQ
% of samples with tralopyril in 4.5 % tralopyril coating >LOQ
Muscle – T0
10
0
0
0
Muscle – 24 (1) hrs
30
0
80%
60%
Muscle – 24 (2) hrs
30
0
40%
70%
Muscle – 7D
30
0
80%
80%
Muscle – 30 D
30
0
90%
100%
Water samples (1min, 1hr, 3hr)
3x3
0
0
33.3%
Water samples (24hr, 7D, 30D)
3x3
0
0
33.3%
Faeces (30 D)
10
10%
100%
100%
Liver samples (30 D)
10
20%
10%
10%
Table 7. Information on number of samples included in the experiment and % of samples with tralopyril > LOQ in the different analyses.
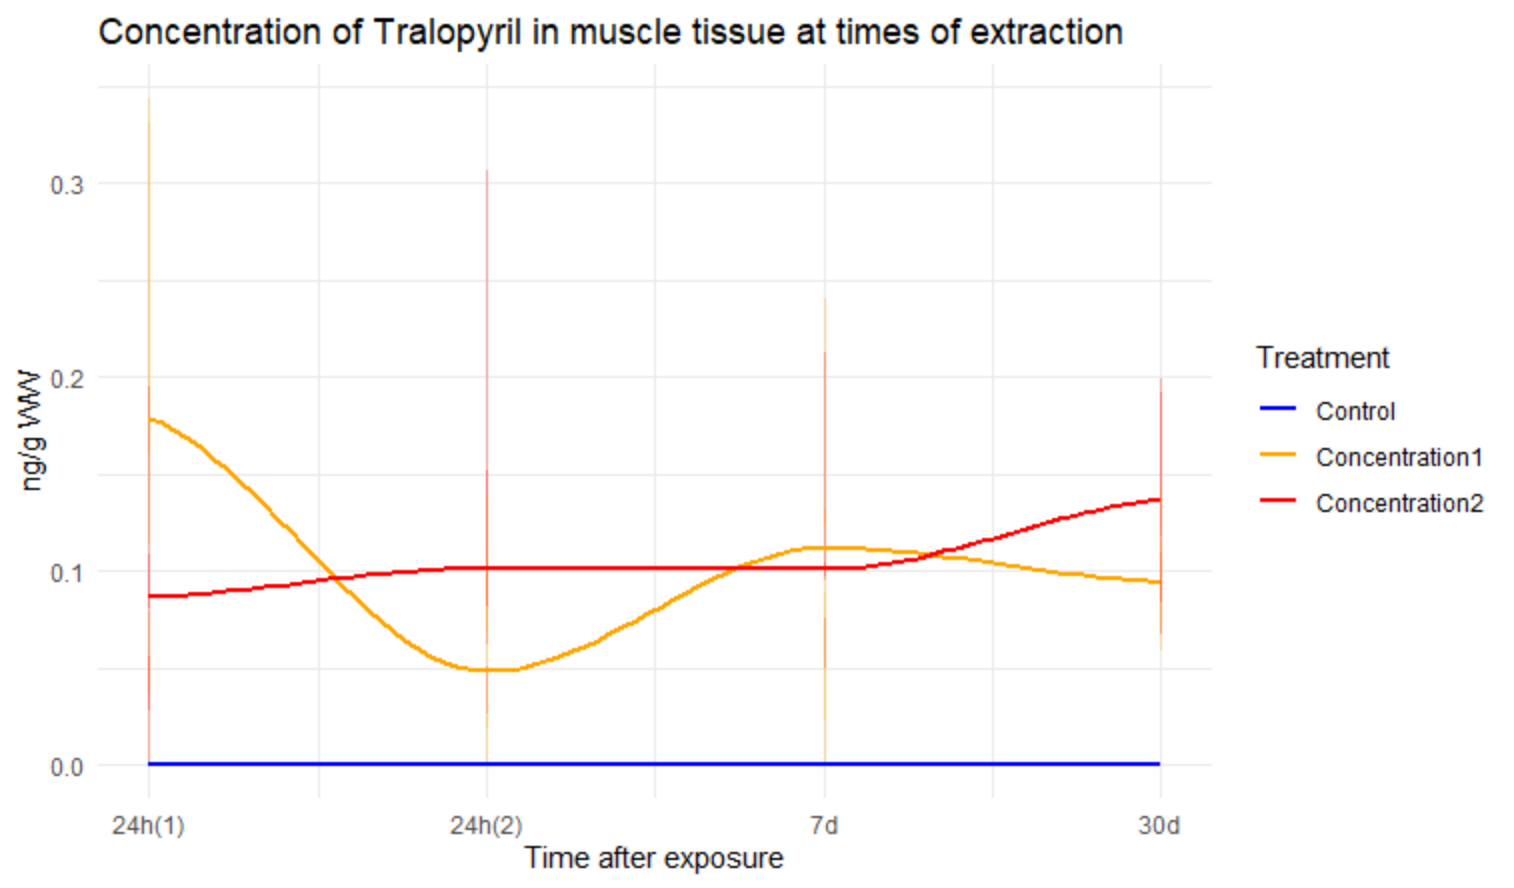
Average trends of concentration over time in salmon muscle from the different time points are shown in Figure 7. Highest levels were found in individuals exposed to concentration 1 after 24 hours, with the highest level measured to be 0.34 ng/g ww.
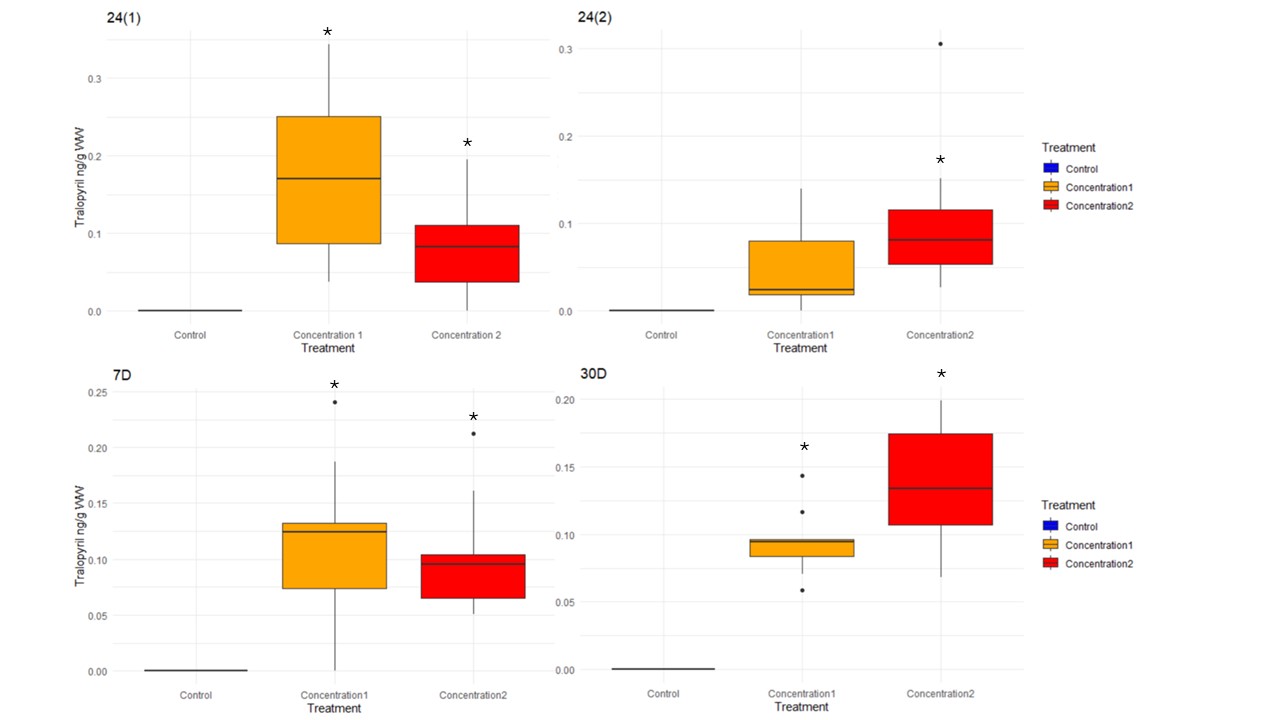
This time of extraction and treatment had also highest mean concentration of 0.178 ng/g ww tralopyril (Figure 8). All treated groups were significantly different from controls (p< 0.05) except 3.0% tralopyril after 24(2) hrs. No significant differences were detected between the treated groups except the above mentioned 3.0% tralopyril coating at time point 24(2) hrs.
Figure 7. Average concentration of tralopyril in muscle tissue at times of extraction. Concentration 1 (3.0% tralopyril), Concentration 2 (4.5% tralopyril).
Figure 8. Box plot of tralopyril in salmon muscle. Box indicate 50 % of measurements, line: median value, whisker show ranges and dots outliers. Concentration 1 (3.0% tralopyril), Concentration 2 (4.5% tralopyril). N=10 per group. * indicates statistically significant difference compared with control.
3.5 - Levels of tralopyril in salmon faeces
As seen from Table 7, 100 % of salmon from tanks with treated net pens had levels of tralopyril in faeces > LOQ, although we could also detect tralopyril in faeces of one salmon in the control group.
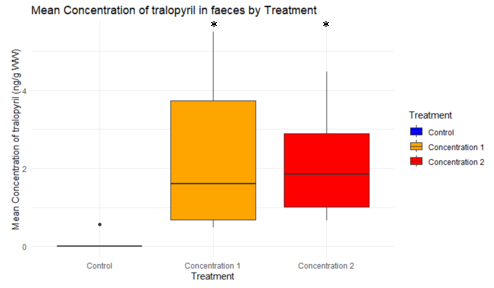
The highest levels of tralopyril were measured in faeces (5.5 ng/g ww) of an individual exposed to the 3.0% coating after 30 days. Mean concentrations in faeces are shown in Figure 9. There was no statistically significant difference in concentrations between salmon exposed to 3.0% and 4.5% coating, though concentrations of these are both significantly different to the control.
Figure 9. Concentrations of tralopyril in faeces by treatment. All measurements were done after 30 days of exposure. N=10 per group. * indicates statistically significant difference in mean from control.
3.6 - Levels of tralopyril in salmon liver
Tralopyril was detected in four of the liver samples only, one from each treatment group and two from control tank 1. The levels detected ranged from 0.146 to 3.357 ng/g, with the highest recorded level found in an individual exposed to 3.0% tralopyril coating (Table 8). Mesurements of tralopyril in two liver samples of control fish were not as expected. A likely explaination to these results, as quality control confirms no contamination or carryover, is that there has been a mix up in marking of the individuals originating from tank 1.
Tralopyril was not found in the faeces samples of the same individuals from the control tanks, however, tralopyril was detected in the faeces on the same individuals from 3.0% coating and 4.5% coating in table 8.
Treatment
Tank of origin
Conc (ng/g ww)
Control
T 1
1.071
Control
T 1
0.685
3.0% coating
T 2
3.357
4.5% coating
T 3
0.146
Table 8. Detected levels of tralopyril in salmon liver tissues. Tralopyril was not detected in other analysed samples (26).
3.7 - Transformation product detected in salmon
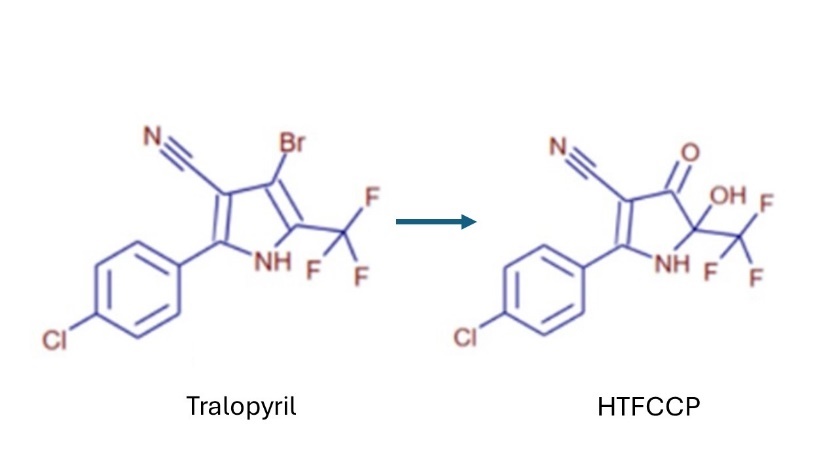
The de-brominated transformation product of tralopyril, 2-(4-chlorophenyl)-5-hydroxy-4-oxo-5-(trifluoromethyl)-4,5-dihydro-1H-pyrrole-3-carbonitrile (HTFCCP), was detected in the salmon exposed to tralopyril coated net pens (Figure 10). As we do not have a standard for this chemical, the quantification is semiquantitative. HTFCCP or CL322195 is also listed as the most relevant degradation from a study with rat (EFSA 2023), although not according to Janssen (2024) who lists the defluorinated product CL322250 as the major degradation product.
Figure 10. Tralopyril and its de-brominated transformation product 2 -(4-chlorophenyl)-5-hydroxy-4-oxo-5-(trifluoromethyl)-4,5-dihydro-1H-pyrrole-3-carbonitrile (HTFCCP).
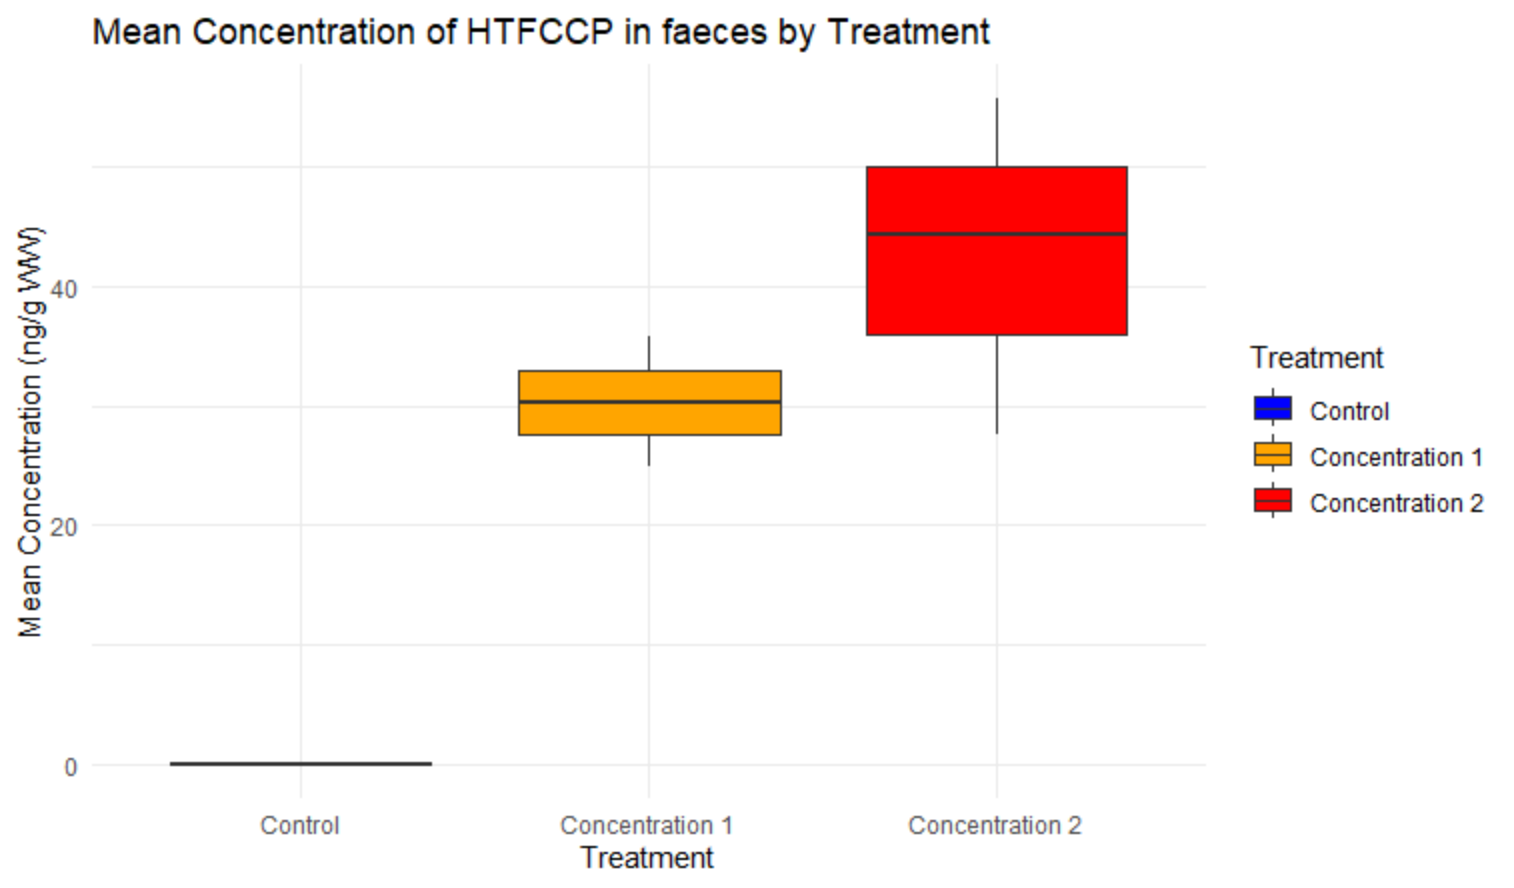
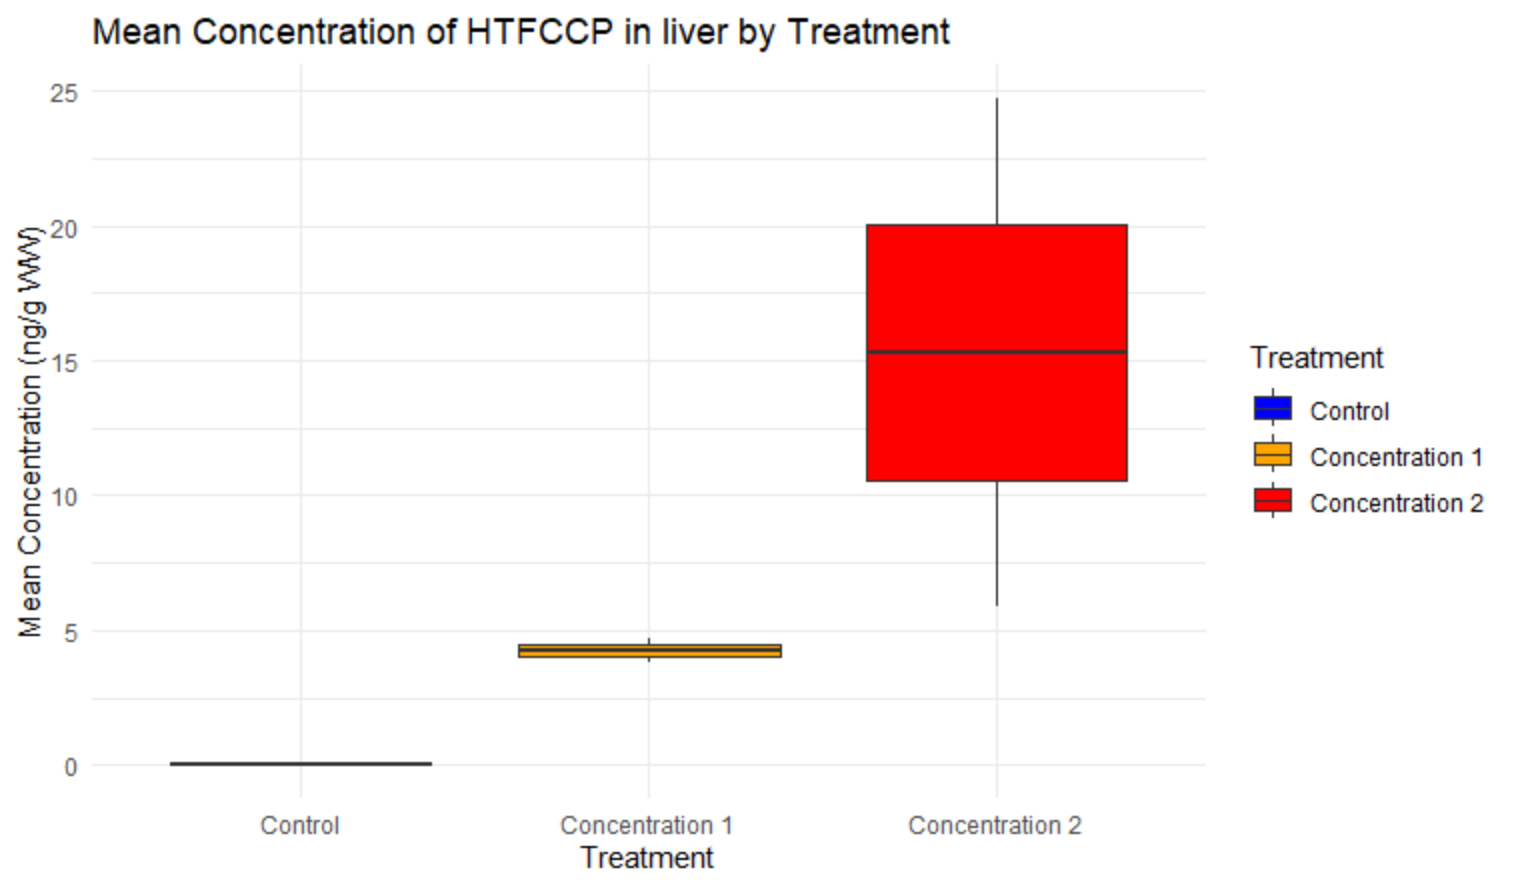
The highest estimated levels of HTFCCP in both faeces (Figure 11) and liver (Figure 12) were found in individuals exposed to nets coated with 4.5% tralopyril. Though there were no statistical evidence of differences between the treatment groups, due to the low number of individuals analyzed per group, there appeared to be a trend of increasing concentration found in faeces of individuals exposed to 4.5% tralopyril coating.
Figure 11. Box plot of the transformation product HTFCCP in faeces of salmon. N=3 per group. The levels on the y-axis are semi-quantitative.
Figure 12. Box plot of the transformation product HTFCCP in the liver of salmon. N=2 per group. The levels on the y-axis are semi-quantitative.
4 - Conclusion
The results simulating realistic exposure tralopyril coated net pens of salmon held in tanks with 1500 l/ min (1.5 time total volume per hour) demonstrated that tralopril was taken up by the salmon and found in salmon muscle > LOQ of 90-100 % of the salmon after 30 days of exposure as well as in 100 % of the faeces of the same individuals.
As no MRLs are at present set for tralopyril and tralopyril was approved from the Commission with condition to set MRLs, the results of this study emphasize the need for such threshold values to be set together with a reassessment of the risk related to food safety and discharge to the environment.
5 - References
Dahllof I, Grunnet K, Haller R, Hjorth M, Maraldo K, Petersen DM. 2005. Analysis, Fate and Toxicity of Zinc- and Copper Pyrithione in the Marine Environment. TemaNord 2005:550. Nordic Council of Ministers, Copenhagen 2005. ISBN 92-893-1183-5. Pp 33.
EFSA (European Food Safety Authority), Bellisai, G., Bernasconi, G., Binaglia, M., Carrasco Cabrera, L., Castellan, I., Castoldi, A. F., Chiusolo, A., Chukwubike, K., Crivellente, F., Del Aguila, M., Ferreira, L., Giner Santonja, G., Greco, L., Istace, F., Jarrah, S., Lanzoni, A., Leuschner, R., Mangas, I., … Verani, A. (2023). Targeted review of maximum residue levels (MRLs) for chlorfenapyr. EFSA Journal , 21 (12), e8444. https://doi.org/10.2903/j.efsa.2023.8444
European Commission 2009. Regulation (EC) No 470/2009 of the European Parliament and of the Council of 6 May 2009 laying down Community procedures for the establishment of residue limits of pharmacologically active substances in foodstuffs of animal origin, repealing Council Regulation (EEC) No 2377/90 and amending Directive 2001/82/EC of the European Parliament and of the Council and Regulation (EC) No 726/2004 of the European Parliament and of the Council (OJ L 152, 16.6.2009, p. 11).
European Commission 2005. Regulation (EC) No 396/2005 of the European Parliament and of the Council of 23 February 2005 on maximum residue levels of pesticides in or on food and feed of plant and animal origin and amending Council Directive 91/414/EEC (OJ L 70, 16.3.2005, p. 1).
Janssen PMP. 2024. How to reconcile clean aquaculture nets and fish welfare with a clean environment. Need for holistic approach. The biofouling problem in mariculture of finfish and possible approaches. White paper. Tony Kempen and Don McKenzie, February 2024. Pp 23.
LetSea. 2023. End report 2306-Elion. Documentation of new product for fish-net coating. Pp 13.
Martins SE, Fillmann G, Lillicrap A & Thomas KV. 2018. Review: Ecotoxicity of organic and organo-metallic antifouling co-biocides and implications for environmental hazard and risk assessments in aquatic ecosystems, Biofouling, 34:1, 34-52, DOI:10.1080/08927014.2017.1404036