Gå til hovedinnhold
Havforskningsinstituttet
HI
English
<- Tilbake
Søk
Søk
Søk
View page in English
Figur
Fra rapporten:
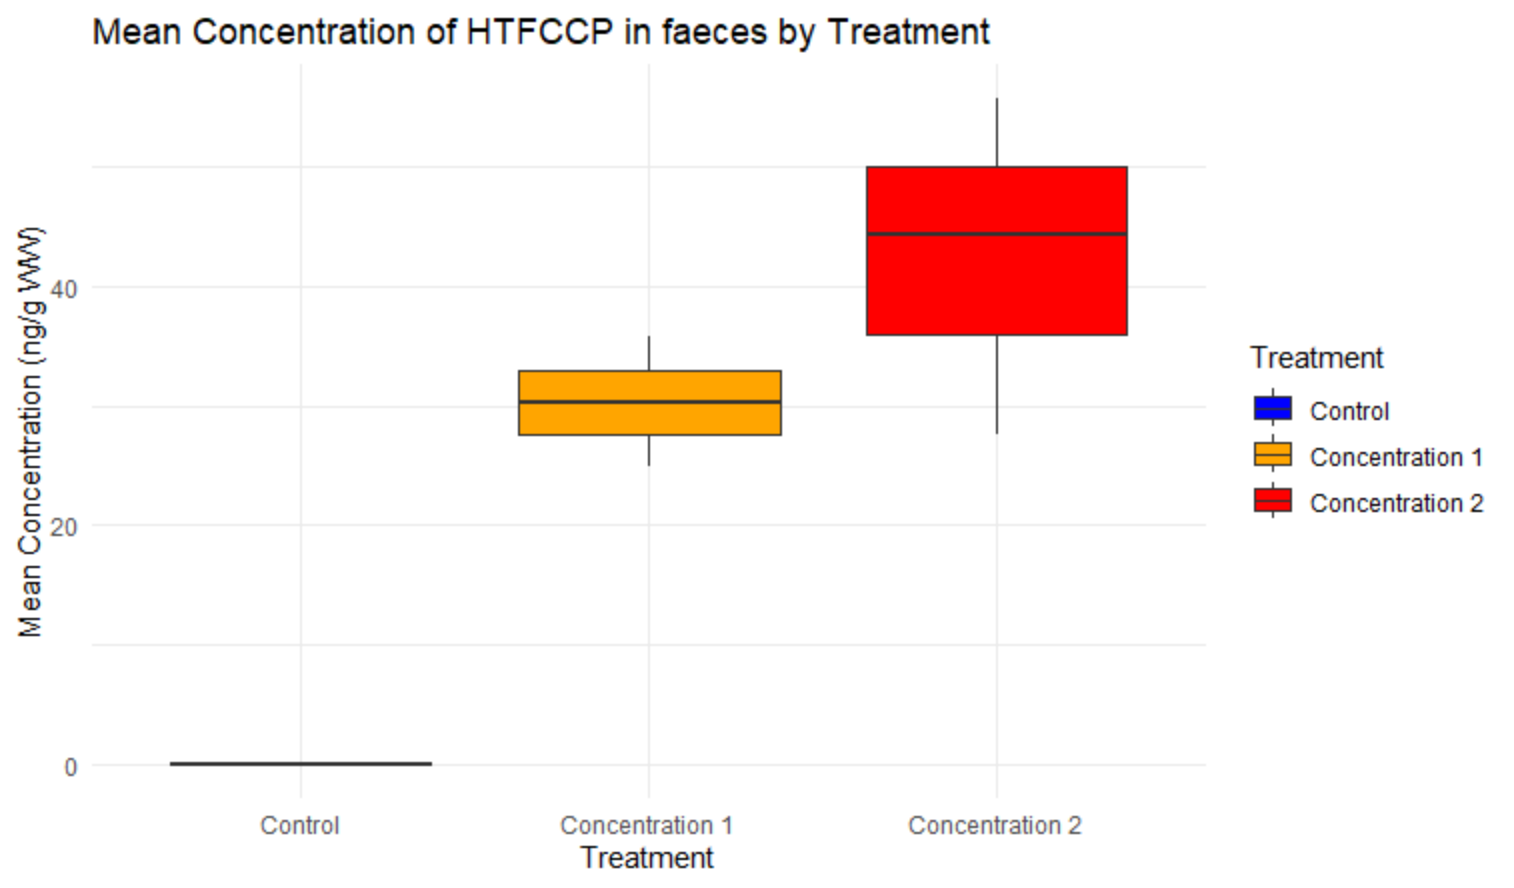
Analysis of uptake of tralopyril and transformation products in salmon exposed to tralopyril coated net pen
Figure 11. Box plot of the transformation product HTFCCP in faeces of salmon. N=3 per group. The levels on the y-axis are semi-quantitative.