Figur
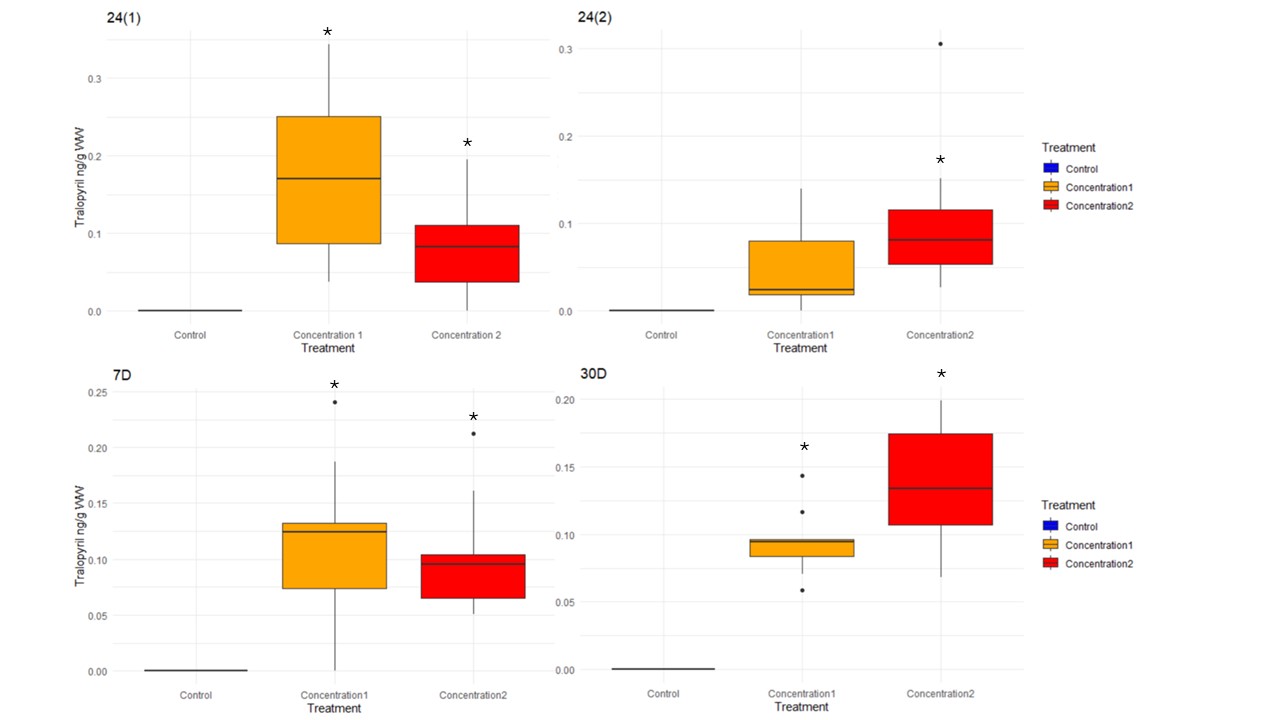
Figure 8. Box plot of tralopyril in salmon muscle. Box indicate 50 % of measurements, line: median value, whisker show ranges and dots outliers. Concentration 1 (3.0% tralopyril), Concentration 2 (4.5% tralopyril). N=10 per group. * indicates statistically significant difference compared with control.