7 - COMMERCIAL PELAGIC FISH
Text by G. Skaret, D. Prozorkevich
Figures by S. Karlson, F. Rist, G. Skaret
7.1 Capelin (Mallotus villosus)
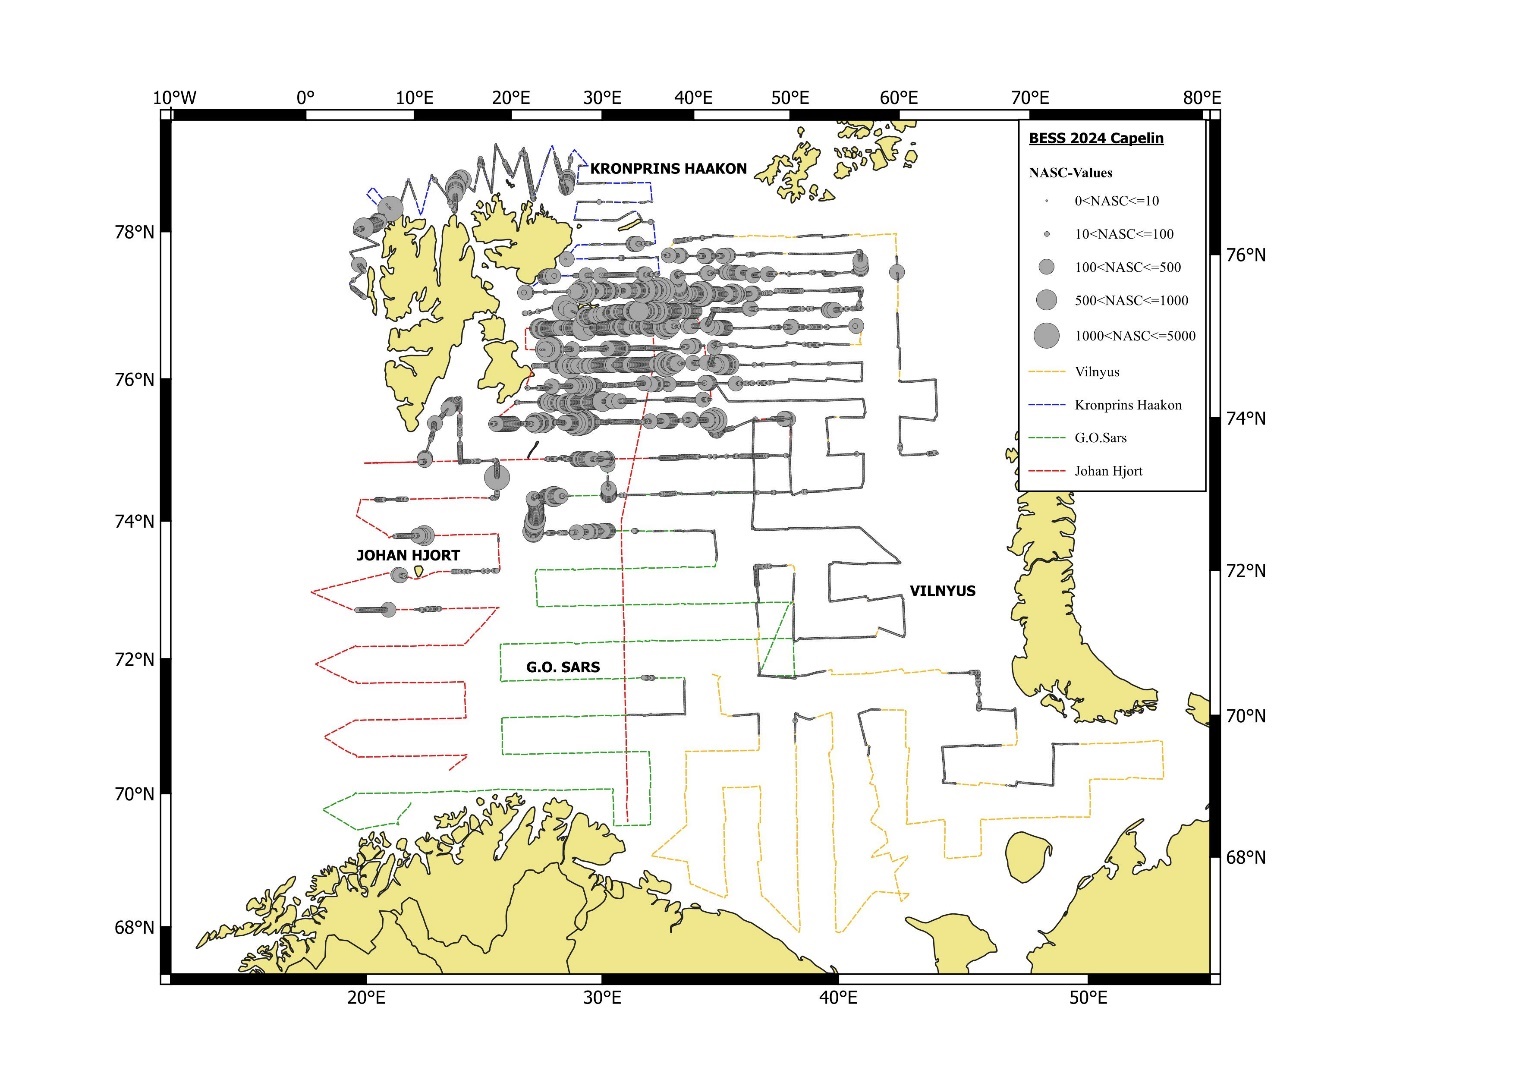
The coverage of the capelin distribution was synoptic with very high effort allocated to the important bank areas. The capelin coverage was considered to be close to complete for 2024 (see Figure 7.1.1.1), even though the south-western part of the shelf west of Svalbard (Spitsbergen) was not covered. This west shelf is normally not an area with important amounts of capelin. A summary of the capelin stock assessment for 2024 is given in Barents Sea capelin advice sheet 2024 with more details provided in Barents Sea capelin assessment report 2024.
7.1.1 Geographical distribution
The geographical distribution of capelin recorded acoustically is shown in Figure 7.1.1.1. The capelin was distributed quite far north, but not as far north as in 2023 when the population size was much higher. The main distribution area was the Great Bank which is the normal core area at this time of the year. Some recordings were also made north of Svalbard (Spitsbergen) which was also observed in 2023.
7.1.2 Abundance by size and age
A detailed summary of the acoustic stock estimate is given in Table 7.1.2.1, and the time series of abundance estimates is summarized in Table 7.1.2.2. A comparison between the estimates in 2024 and 2023 is given in table 7.1.2.3 with the 2023 estimate shown on a shaded background.
The total stock in the covered area was estimated to about 887 thousand tons, which is only about a third of the long-term average level (2.79 million tons). About 60 % (534 thousand tons) of the 2024 stock had length above 14 cm and was therefore considered to be maturing. In terms of biomass, the contribution to the total was quite equal from both 1, 2, 3 and 4-year-olds (table 7.1.2.1). The abundance of 1 and 3 year-olds was less than a third of the long term average and 2-year-olds less than a sixth of the long term average. Only the abundance of 4-year-olds (2020-yearclass) and 5-year-olds (2019-yearclass) were stronger than the long-term average.
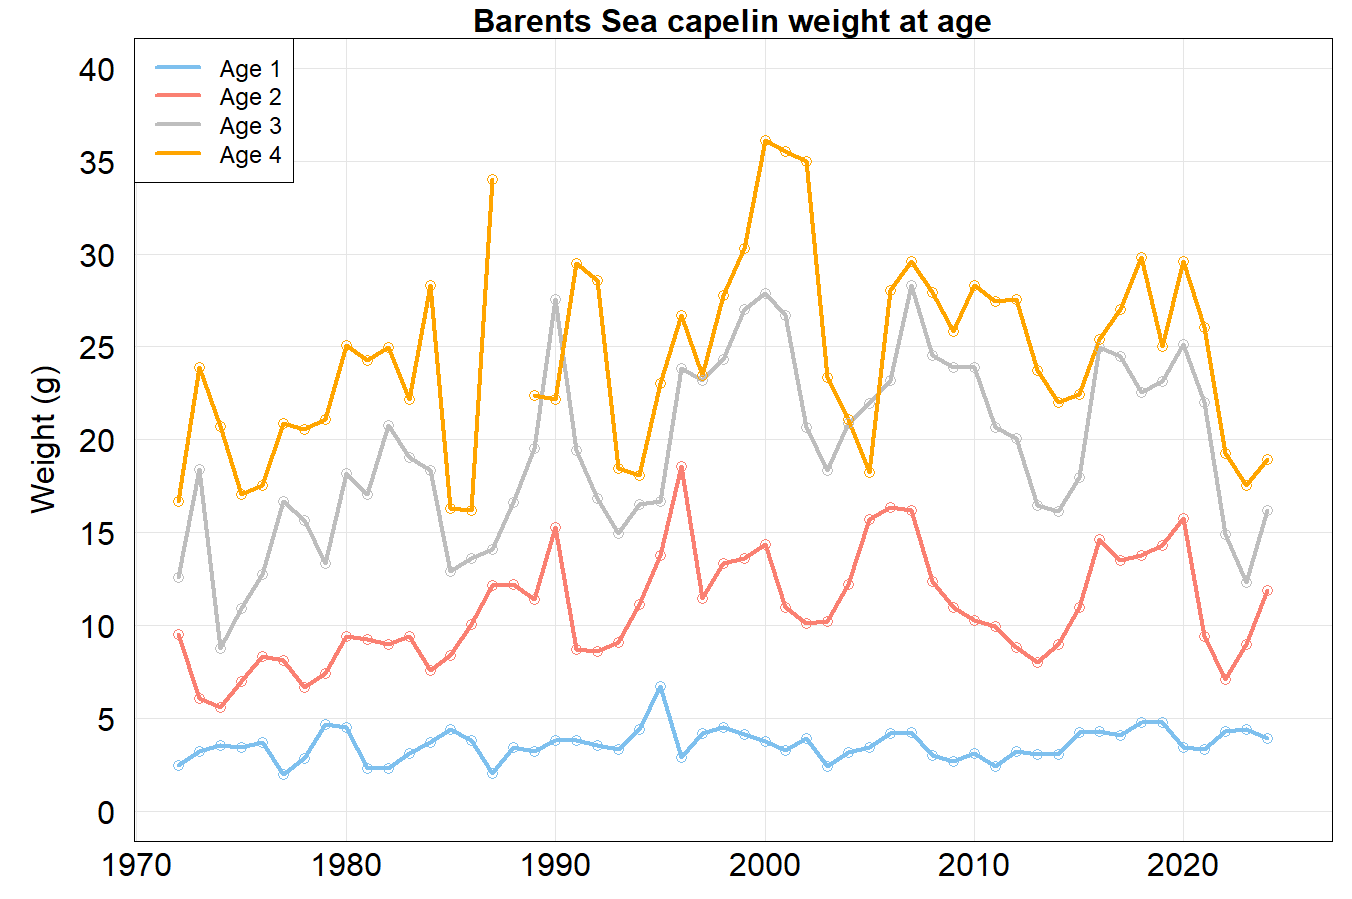
Average weight at age increased compared to 2023 for the age groups 2-4. For 3- and 4-year-olds it was still well below the long term average, whereas it was above the long term average for 1 and 2-year-olds (figure 7.1.2.1 and table 7.1.2.2).
|
Length (cm) |
Age/year class | Sum (109) | Biomass (103 t) | Mean weight (g) | |||||
|---|---|---|---|---|---|---|---|---|---|
| 1 | 2 | 3 | 4 | 5 | 6 | ||||
| 2023 | 2022 | 2021 | 2020 | 2019 | 2018 | ||||
|
6.5-7.0 |
0.434 | 0.434 | 0.099 | 1.25 | |||||
|
7.0-7.5 |
2.008 | 2.008 | 2.131 | 1.26 | |||||
|
7.5-8.0 |
4.859 | 4.859 | 7.281 | 1.74 | |||||
|
8.0-8.5 |
5.469 | 5.469 | 9.720 | 2.11 | |||||
|
8.5-9.0 |
8.887 | 8.887 | 19.094 | 2.54 | |||||
|
9.0-9.5 |
7.793 | 7.793 | 20.755 | 3.11 | |||||
|
9.5-10.0 |
8.836 | 8.837 | 27.217 | 3.64 | |||||
|
10.0-10.5 |
7.589 | 0.052 | 7.641 | 32.441 | 4.33 | ||||
|
10.5-11.0 |
5.493 | 0.086 | 5.578 | 27.135 | 4.89 | ||||
|
11.0-11.5 |
3.902 | 0.117 | 4.019 | 22.483 | 5.70 | ||||
|
11.5-12.0 |
2.241 | 0.793 | 3.034 | 20.655 | 6.87 | ||||
|
12.0-12.5 |
0.390 | 1.407 | 0.051 | 1.848 | 14.581 | 7.94 | |||
|
12.5-13.0 |
0.599 | 2.671 | 0.066 | 3.336 | 29.409 | 8.90 | |||
|
13.0-13.5 |
0.058 | 4.534 | 0.346 | 0.127 | 5.066 | 52.743 | 10.37 | ||
|
13.5-14.0 |
3.947 | 1.255 | 0.527 | 5.729 | 67.374 | 11.74 | |||
|
14.0-14.5 |
2.136 | 1.896 | 0.828 | 0.211 | 5.071 | 66.915 | 13.24 | ||
|
14.5-15.0 |
2.067 | 2.725 | 2.205 | 0.091 | 7.089 | 105.034 | 14.85 | ||
|
15.0-15.5 |
1.218 | 3.310 | 2.210 | 0.342 | 0.023 | 7.103 | 119.925 | 16.83 | |
|
15.5-16.0 |
0.515 | 1.638 | 1.575 | 0.161 | 3.889 | 74.262 | 19.29 | ||
|
16.0-16.5 |
0.207 | 1.233 | 1.179 | 0.391 | 3.010 | 62.802 | 20.99 | ||
|
16.5-17.0 |
0.066 | 0.421 | 1.041 | 0.090 | 0.001 | 1.618 | 40.243 | 24.91 | |
|
17.0-17.5 |
0.022 | 0.281 | 0.744 | 0.158 | 1.205 | 33.617 | 27.84 | ||
|
17.5-18.0 |
0.172 | 0.396 | 0.069 | 0.637 | 19.946 | 31.48 | |||
|
18.0-18.5 |
0.040 | 0.232 | 0.272 | 9.444 | 35.45 | ||||
|
18.5-19.0 |
0.019 | 0.019 | 0.730 | 39.00 | |||||
|
19.0-19.5 |
0.002 | 0.002 | 0.047 | 31.00 | |||||
|
19.5-20.0 |
|||||||||
|
20.0-20.5 |
0.019 | 0.019 | 0.576 | 31.00 | |||||
|
TSN (109) |
58.560 | 19.837 | 13.434 | 11.084 | 1.534 | 0.024 | 104.473 | ||
|
TSB (103 t) |
190.690 | 233.120 | 220.203 | 212.774 | 29.479 | 0.395 | 886.661 | ||
|
Mean length (cm) |
9.55 | 13.47 | 14.85 | 15.37 | 15.52 | 15.75 | |||
|
Mean weight (g) |
3.96 | 11.90 | 16.19 | 18.97 | 18.04 | 20.33 | 8.49 | ||
|
SSN (109) |
6.230 | 11.716 | 10.430 | 1.534 | 0.024 | 29.933 | |||
|
SSB (103 t) |
97.708 | 201.022 | 204.937 | 29.479 | 0.395 | 533.541 | |||
Estimates based on Target strength (TS) Length (L) relationship : TS= 19.1 log (L) – 74.0
| Year | Age | Sum | |||||||||
|---|---|---|---|---|---|---|---|---|---|---|---|
| 1 | 2 | 3 | 4 | 5 | |||||||
| BM1 | W1 | BM2 | W2 | BM3 | W3 | BM4 | W4 | BM5 | W5 | TSB | |
| 1973 | 1.71 | 3.2 | 2.29 | 6.1 | 0.73 | 18.4 | 0.41 | 23.9 | + | 27.3 | 5.15 |
| 1974 | 1.08 | 3.6 | 3.06 | 5.6 | 1.52 | 8.8 | 0.07 | 20.7 | + | 25.1 | 5.74 |
| 1975 | 0.66 | 3.4 | 2.44 | 7.0 | 3.24 | 10.9 | 1.48 | 17.1 | 0.01 | 28.1 | 7.82 |
| 1976 | 0.79 | 3.7 | 1.95 | 8.4 | 2.08 | 12.8 | 1.34 | 17.5 | 0.26 | 21.3 | 6.42 |
| 1977 | 0.72 | 2.0 | 1.43 | 8.2 | 1.64 | 16.7 | 0.84 | 20.9 | 0.17 | 23.3 | 4.80 |
| 1978 | 0.24 | 2.9 | 2.62 | 6.7 | 1.19 | 15.7 | 0.18 | 20.6 | 0.02 | 25.7 | 4.25 |
| 1979 | 0.06 | 4.7 | 2.48 | 7.4 | 1.52 | 13.3 | 0.10 | 21.1 | + | 24.1 | 4.16 |
| 1980 | 1.22 | 4.5 | 1.84 | 9.4 | 2.82 | 18.2 | 0.83 | 25.1 | 0.01 | 21.8 | 6.72 |
| 1981 | 0.92 | 2.3 | 1.81 | 9.2 | 0.82 | 17.1 | 0.33 | 24.2 | 0.01 | 29.1 | 3.89 |
| 1982 | 1.22 | 2.3 | 1.33 | 9.0 | 1.18 | 20.8 | 0.05 | 25.0 | 3.78 | ||
| 1983 | 1.61 | 3.1 | 1.89 | 9.4 | 0.73 | 19.0 | 0.01 | 22.2 | 4.23 | ||
| 1984 | 0.57 | 3.7 | 1.42 | 7.6 | 0.89 | 18.4 | 0.09 | 28.3 | 2.96 | ||
| 1985 | 0.17 | 4.4 | 0.40 | 8.4 | 0.27 | 12.9 | 0.01 | 16.3 | 0.86 | ||
| 1986 | 0.02 | 3.8 | 0.05 | 10.1 | 0.05 | 13.6 | + | 16.2 | 0.12 | ||
| 1987 | 0.08 | 2.1 | 0.02 | 12.2 | + | 14.1 | + | 34.0 | 0.10 | ||
| 1988 | 0.07 | 3.4 | 0.35 | 12.2 | + | 16.6 | 0.43 | ||||
| 1989 | 0.62 | 3.3 | 0.20 | 11.4 | 0.05 | 19.5 | + | 22.4 | 0.87 | ||
| 1990 | 2.67 | 3.8 | 2.71 | 15.3 | 0.45 | 27.6 | + | 22.2 | 5.84 | ||
| 1991 | 1.53 | 3.8 | 5.07 | 8.7 | 0.64 | 19.4 | 0.04 | 29.5 | 7.28 | ||
| 1992 | 1.25 | 3.6 | 1.70 | 8.6 | 2.17 | 16.8 | 0.04 | 28.6 | 5.16 | ||
| 1993 | 0.01 | 3.4 | 0.49 | 9.1 | 0.26 | 14.9 | 0.04 | 18.5 | 0.80 | ||
| 1994 | 0.09 | 4.4 | 0.04 | 11.1 | 0.07 | 16.5 | + | 18.1 | 0.20 | ||
| 1995 | 0.05 | 6.7 | 0.11 | 13.8 | 0.03 | 16.7 | 0.01 | 23.0 | 0.19 | ||
| 1996 | 0.24 | 2.9 | 0.21 | 18.6 | 0.05 | 23.8 | + | 26.7 | 0.50 | ||
| 1997 | 0.41 | 4.2 | 0.45 | 11.5 | 0.04 | 23.2 | + | 23.5 | 0.91 | ||
| 1998 | 0.81 | 4.5 | 0.97 | 13.3 | 0.26 | 24.3 | 0.02 | 27.8 | + | 29.9 | 2.05 |
| 1999 | 0.65 | 4.2 | 1.38 | 13.6 | 0.72 | 27.0 | 0.03 | 30.3 | 2.77 | ||
| 2000 | 1.71 | 3.8 | 1.59 | 14.3 | 0.95 | 27.9 | 0.03 | 36.1 | + | 20.1 | 4.27 |
| 2001 | 0.38 | 3.3 | 2.40 | 11.0 | 0.81 | 26.7 | 0.04 | 35.5 | + | 41.3 | 3.63 |
| 2002 | 0.23 | 3.9 | 0.92 | 10.1 | 1.04 | 20.7 | 0.02 | 35.0 | 2.21 | ||
| 2003 | 0.20 | 2.4 | 0.10 | 10.2 | 0.20 | 18.3 | 0.03 | 23.3 | 0.53 | ||
| 2004 | 0.20 | 3.2 | 0.21 | 12.2 | 0.09 | 20.9 | 0.01 | 21.1 | + | 25.4 | 0.51 |
| 2005 | 0.08 | 3.4 | 0.33 | 15.7 | 0.08 | 22.0 | 0.01 | 18.2 | + | 19.6 | 0.50 |
| 2006 | 0.24 | 4.2 | 0.27 | 16.4 | 0.12 | 23.2 | + | 28.0 | + | 25.4 | 0.64 |
| 2007 | 0.83 | 4.3 | 0.81 | 16.2 | 0.16 | 28.3 | 0.01 | 29.6 | 1.82 | ||
| 2008 | 0.89 | 3.0 | 2.46 | 12.4 | 0.59 | 24.6 | 0.01 | 27.9 | 3.95 | ||
| 2009 | 0.47 | 2.7 | 1.63 | 11.0 | 1.15 | 23.9 | + | 25.9 | 3.25 | ||
| 2010 | 0.76 | 3.1 | 1.41 | 10.3 | 1.60 | 23.9 | 0.05 | 28.3 | 3.82 | ||
| 2011 | 0.47 | 2.4 | 1.72 | 9.9 | 1.19 | 20.7 | 0.21 | 27.5 | 3.60 | ||
| 2012 | 0.57 | 3.2 | 1.03 | 8.8 | 1.77 | 20.1 | 0.08 | 27.5 | 3.46 | ||
| 2013 | 0.99 | 3.1 | 1.58 | 8.0 | 1.11 | 16.5 | 0.28 | 23.7 | + | 28.7 | 3.97 |
| 2014 | 0.32 | 3.1 | 0.73 | 9.0 | 0.60 | 16.1 | 0.04 | 22.0 | 1.69 | ||
| 2015 | 0.16 | 4.3 | 0.46 | 11.0 | 0.23 | 18.0 | 0.02 | 22.4 | 0.88 | ||
| 2016 | 0.14 | 4.3 | 0.12 | 14.6 | 0.06 | 24.9 | + | 25.4 | 0.32 | ||
| 2017 | 0.47 | 4.1 | 1.61 | 13.5 | 0.34 | 24.5 | 0.01 | 27.0 | 2.43 | ||
| 2018 | 0.28 | 4.8 | 0.84 | 13.8 | 0.51 | 22.6 | 0.01 | 29.8 | + | 34.0 | 1.64 |
| 2019 | 0.09 | 4.8 | 0.14 | 14.3 | 0.16 | 23.2 | 0.03 | 25.0 | + | 18.9 | 0.41 |
| 2020 | 1.27 | 3.4 | 0.49 | 15.8 | 0.10 | 25.1 | 0.02 | 29.6 | + | 23.3 | 1.89 |
| 2021 | 0.75 | 3.4 | 3.07 | 9.4 | 0.16 | 22.0 | + | 26.0 | 3.99 | ||
| 2022 | 0.32 | 4.3 | 0.96 | 7.1 | 0.86 | 14.9 | 0.02 | 19.2 | + | 24.0 | 2.17 |
| 2023 | 0.48 | 4.4 | 0.72 | 9.0 | 1.32 | 12.3 | 0.42 | 17.6 | + | 20.5 | 2.95 |
| 2024 | 0.19 | 4.0 | 0.23 | 11.9 | 0.22 | 16.2 | 0.21 | 19.0 | 0.03 | 18.0 | 0.89 |
| Average | 0.61 | 3.6 | 1.24 | 10.9 | 0.75 | 19.5 | 0.14 | 24.6 | 0.01 | 25.2 | 2.76 |
Note:«+» <0.005*106 tons
| Year class | Age | Numbers (106) | Mean weight (g) | Biomass (103 t) | ||||
|---|---|---|---|---|---|---|---|---|
| 2023 | 2022 | 1 | 58.6 | 108.5 | 3.96 | 4.43 | 190.7 | 480.6 |
| 2022 | 2021 | 2 | 19.8 | 80.3 | 11.90 | 9.01 | 233.1 | 723.4 |
| 2021 | 2020 | 3 | 13.4 | 107.4 | 16.19 | 12.33 | 220.2 | 1324.2 |
| 2020 | 2019 | 4 | 11.1 | 23.9 | 18.97 | 17.56 | 212.8 | 419.4 |
| Total stock in: | ||||||||
| 2024 | 2023 | 1-4 | 104.5 | 320.3 | 8.49 | 9.21 | 886.7 | 2951.7 |
7.2 Polar cod (Boreogadus saida)
7.2.1 Geographical distribution
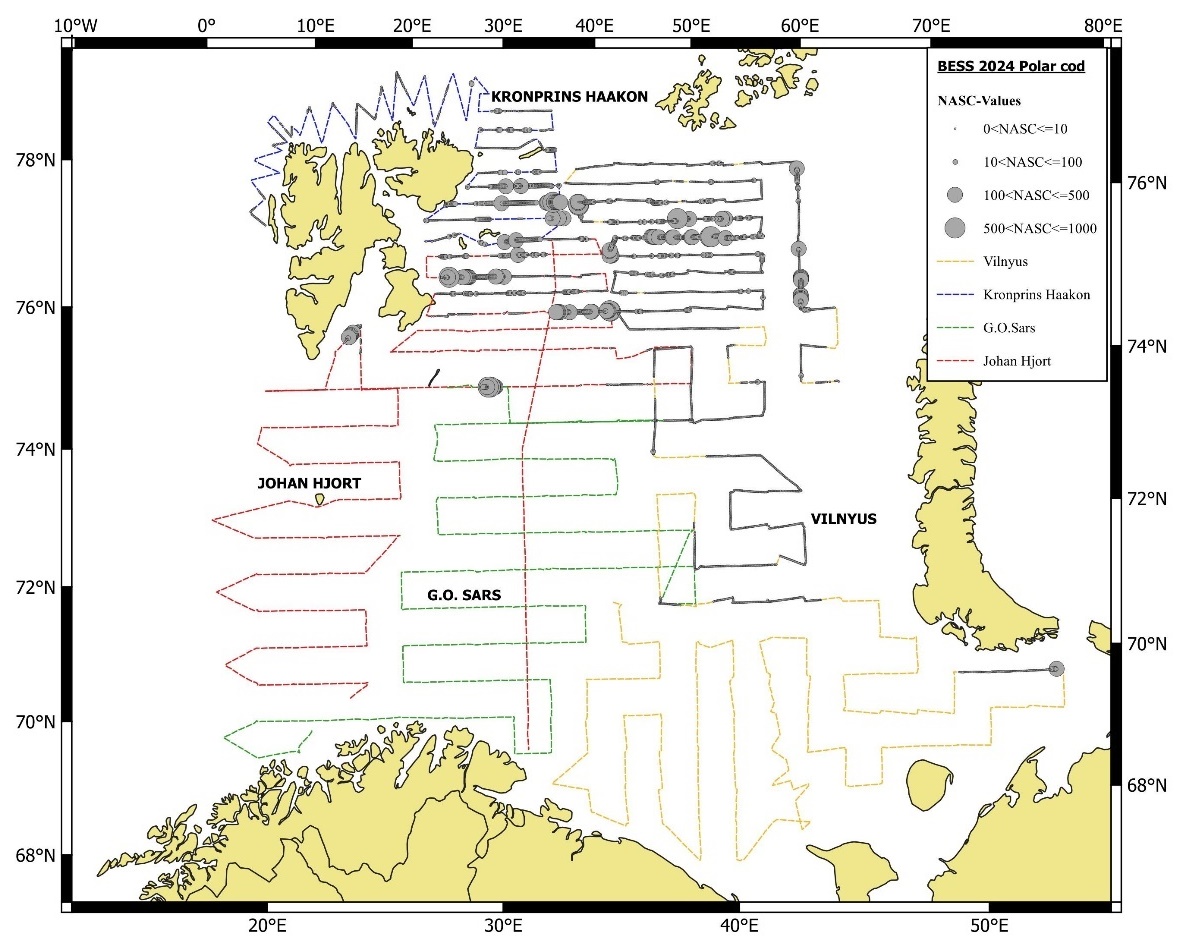
The acoustic recordings of polar cod are shown in Figure 7.2.1.1. There were no areas with really high concentrations of polar cod, but the concentrations adjacent to the Great Bank dominated. Only small concentrations of polar cod were found to the south near the Kara Strait where huge concentrations were found in 2023. There were significant recordings of polar cod along the north-easternmost of transects which indicates that parts of the polar cod stock were distributed east and possibly north of the covered area.
7.2.2. Abundance estimation
The stock abundance estimates of polar cod by age, number and weight in 2024 is given in Table 7.2.2.1 and the time series of abundance estimates is summarized in Table 7.2.2.2. The estimated means are from 500 bootstrap replicas made in StoX 4.1.1.
The total estimated abundance of polar cod in 2024 was low, less than 15% of the estimate from 2023. Age group 1 dominated the abundance while age group 2 dominated biomass, but the abundance of all age groups was well below the levels in 2023.
The north-east part of the Barents Sea where polar cod is often distributed has not been covered since 2020. There are also indications of a northwards distribution change in polar cod, so the survey results must be interpreted with caution. However, the estimates indicate that there has been a very strong dynamic in the Barents Sea polar cod stock abundance during the past decade, especially compared to the period 1991-2013.
| Length (cm) | Age/year class | Sum (109) | Biomass (103 t) | Mean weight (g) | |||||
|---|---|---|---|---|---|---|---|---|---|
| 1 | 2 | 3 | 4 | 5 | 6 | ||||
| 2023 | 2022 | 2021 | 2020 | 2019 | 2018 | ||||
| 7.0-8.0 | 0.001 | 0.001 | 0.002 | 2.12 | |||||
| 8.0-9.0 | 0.093 | 0.093 | 0.375 | 4.17 | |||||
| 9.0-10.0 | 0.089 | 0.089 | 0.518 | 5.83 | |||||
| 10.0-11.0 | 0.307 | 0.006 | 0.313 | 2.489 | 7.87 | ||||
| 11.0-12.0 | 0.644 | 0.019 | 0.663 | 7.111 | 10.75 | ||||
| 12.0-13.0 | 0.379 | 0.038 | 0.005 | 0.422 | 5.780 | 13.54 | |||
| 13.0-14.0 | 0.188 | 0.139 | 0.013 | 0.005 | 0.346 | 6.194 | 17.82 | ||
| 14.0-15.0 | 0.018 | 0.202 | 0.050 | 0.002 | 0.004 | 0.276 | 6.194 | 22.32 | |
| 15.0-16.0 | 0.005 | 0.283 | 0.116 | 0.012 | 0.005 | 0.420 | 11.315 | 26.82 | |
| 16.0-17.0 | 0.230 | 0.062 | 0.023 | 0.002 | 0.317 | 10.158 | 32.03 | ||
| 17.0-18.0 | 0.070 | 0.053 | 0.006 | 0.002 | 0.130 | 4.961 | 38.54 | ||
| 18.0-19.0 | 0.030 | 0.040 | 0.006 | 0.076 | 3.455 | 46.17 | |||
| 19.0-20.0 | 0.005 | 0.037 | 0.004 | 0.046 | 2.381 | 52.71 | |||
| 20.0-21.0 | 0.005 | 0.025 | 0.029 | 1.835 | 62.03 | ||||
| 21.0-22.0 | 0.003 | 0.007 | 0.003 | 0.013 | 0.904 | 77.79 | |||
| 22.0-23.0 | 0.003 | 0.002 | 0.006 | 0.422 | 76.54 | ||||
| 23.0-24.0 | 0.002 | 0.002 | 0.190 | 93.94 | |||||
| 24.0-25.0 | 0.001 | 0.001 | 0.113 | 79.99 | |||||
| 25.0-26.0 | 0.001 | 0.001 | 0.081 | 96.44 | |||||
| TSN (109) | 1.725 | 1.022 | 0.383 | 0.096 | 0.018 | 0.002 | 3.252 | ||
| TSB (103 t) | 19.243 | 26.961 | 12.923 | 4.392 | 0.767 | 0.190 | 64.668 | ||
| Mean length (cm) | 11.13 | 14.88 | 16.09 | 17.93 | 17.59 | 23.00 | 13.79 | ||
| Mean weight (g) | 11.32 | 26.71 | 34.67 | 47.19 | 46.12 | 91.80 | 23.06 | ||
Estimates based on Target strength (TS) Length (L) relationship : TS= 21.8 log (L) – 72.7
| Year | Age 1 | Age 2 | Age 3 | Age 4+ | Total | |||||
|---|---|---|---|---|---|---|---|---|---|---|
| TSN | TSB | TSN | TSB | TSN | TSB | TSN | TSB | TSN | TSB | |
| 1986 | 24.038 | 169.6 | 6.263 | 104.3 | 1.058 | 31.5 | 0.082 | 3.4 | 31.441 | 308.8 |
| 1987 | 15.041 | 125.1 | 10.142 | 184.2 | 3.111 | 72.2 | 0.039 | 1.2 | 28.333 | 382.8 |
| 1988 | 4.314 | 37.1 | 1.469 | 27.1 | 0.727 | 20.1 | 0.052 | 1.7 | 6.562 | 86.0 |
| 1989 | 13.540 | 154.9 | 1.777 | 41.7 | 0.236 | 8.6 | 0.060 | 2.6 | 15.613 | 207.8 |
| 1990 | 3.834 | 39.3 | 2.221 | 56.8 | 0.650 | 25.3 | 0.094 | 6.9 | 6.799 | 127.3 |
| 1991 | 23.670 | 214.2 | 4.159 | 93.8 | 1.922 | 67.0 | 0.152 | 6.4 | 29.903 | 381.5 |
| 1992 | 22.902 | 194.4 | 13.992 | 376.5 | 0.832 | 20.9 | 0.064 | 2.9 | 37.790 | 594.9 |
| 1993 | 16.269 | 131.6 | 18.919 | 367.1 | 2.965 | 103.3 | 0.147 | 7.7 | 38.300 | 609.7 |
| 1994 | 27.466 | 189.7 | 9.297 | 161.0 | 5.044 | 154.0 | 0.790 | 35.8 | 42.597 | 540.5 |
| 1995 | 30.697 | 249.6 | 6.493 | 127.8 | 1.610 | 41.0 | 0.175 | 7.9 | 38.975 | 426.2 |
| 1996 | 19.438 | 144.9 | 10.056 | 230.6 | 3.287 | 103.1 | 0.212 | 8.0 | 33.012 | 487.4 |
| 1997 | 15.848 | 136.7 | 7.755 | 124.5 | 3.139 | 86.4 | 0.992 | 39.3 | 28.012 | 400.7 |
| 1998 | 89.947 | 505.5 | 7.634 | 174.5 | 3.965 | 119.3 | 0.598 | 23.0 | 102.435 | 839.5 |
| 1999 | 59.434 | 399.6 | 22.760 | 426.0 | 8.803 | 286.8 | 0.435 | 25.9 | 91.463 | 1141.9 |
| 2000 | 33.825 | 269.4 | 19.999 | 432.4 | 14.598 | 597.6 | 0.840 | 48.4 | 69.262 | 1347.8 |
| 2001 | 77.144 | 709.0 | 15.694 | 434.5 | 12.499 | 589.3 | 2.271 | 132.1 | 107.713 | 1869.6 |
| 2002 | 8.431 | 56.8 | 34.824 | 875.9 | 6.350 | 282.2 | 2.322 | 143.2 | 52.218 | 1377.2 |
| 2003* | 32.804 | 242.7 | 3.255 | 59.9 | 15.374 | 481.2 | 1.739 | 87.6 | 53.172 | 871.4 |
| 2004 | 99.404 | 627.1 | 22.777 | 404.9 | 2.627 | 82.2 | 0.510 | 32.7 | 125.319 | 1143.8 |
| 2005 | 71.675 | 626.6 | 57.053 | 1028.2 | 3.703 | 120.2 | 0.407 | 28.3 | 132.859 | 1803.0 |
| 2006 | 16.190 | 180.8 | 45.063 | 1277.4 | 12.083 | 445.9 | 0.698 | 37.2 | 74.033 | 1941.2 |
| 2007 | 29.483 | 321.2 | 25.778 | 743.4 | 3.230 | 145.8 | 0.315 | 19.8 | 58.807 | 1230.1 |
| 2008 | 41.693 | 421.8 | 18.114 | 522.0 | 5.905 | 247.8 | 0.415 | 27.8 | 66.127 | 1219.4 |
| 2009 | 13.276 | 100.2 | 22.213 | 492.5 | 8.265 | 280.0 | 0.336 | 16.6 | 44.090 | 889.3 |
| 2010 | 27.285 | 234.2 | 18.257 | 543.1 | 12.982 | 594.6 | 1.253 | 58.6 | 59.777 | 1430.5 |
| 2011 | 34.460 | 282.3 | 14.455 | 304.4 | 4.728 | 237.1 | 0.514 | 36.7 | 54.158 | 860.5 |
| 2012 | 13.521 | 113.6 | 4.696 | 104.3 | 2.121 | 93.0 | 0.119 | 8.0 | 20.457 | 318.9 |
| 2013 | 2.216 | 18.1 | 4.317 | 102.2 | 5.243 | 210.3 | 0.180 | 9.9 | 11.956 | 340.5 |
| 2014 | 0.687 | 6.5 | 4.439 | 110.0 | 3.196 | 121.0 | 0.080 | 5.3 | 8.402 | 243.2 |
| 2015 | 10.866 | 97.1 | 1.995 | 45.1 | 0.167 | 5.3 | 0.008 | 0.5 | 13.036 | 148.0 |
| 2016 | 95.919 | 792.7 | 6.380 | 139.1 | 0.207 | 6.9 | 0.023 | 0.7 | 102.529 | 939.4 |
| 2017 | 13.810 | 121.8 | 8.269 | 200.8 | 1.112 | 34.3 | 0.003 | 0.1 | 23.195 | 357.1 |
| 2018** | 1.900 | 16.4 | 0.980 | 23.1 | 0.240 | 9.4 | 0.014 | 0.6 | 3.124 | 49.6 |
| 2019** | 6.109 | 49.8 | 1.217 | 30.3 | 0.214 | 6.3 | 0.014 | 0.8 | 7.555 | 87.2 |
| 2020 | 115.139 | 988.3 | 20.133 | 386.8 | 8.217 | 299.3 | 0.647 | 42.8 | 144.171 | 1720.8 |
| 2021** | 45.340 | 375.5 | 44.020 | 819.9 | 2.190 | 90.4 | 0.210 | 13.3 | 91.760 | 1299.0 |
| 2022** | No data | |||||||||
| 2023** | 9.640 | 75.9 | 3.465 | 54.9 | 6.240 | 221.9 | 2.983 | 137.7 | 22.328 | 490.4 |
| 2024** | 1.725 | 19.2 | 1.022 | 27.0 | 0.383 | 12.9 | 0.114 | 5.2 | 3.252 | 64.7 |
| Average | 30.760 | 248.4 | 13.720 | 306.8 | 4.450 | 167.2 | 0.520 | 28.1 | 49.490 | 752.0 |
* numbers partly based on VPA estimates
** incomplete survey coverage
7.3 Herring (Clupea harengus)
7.3.1 Geographical distribution
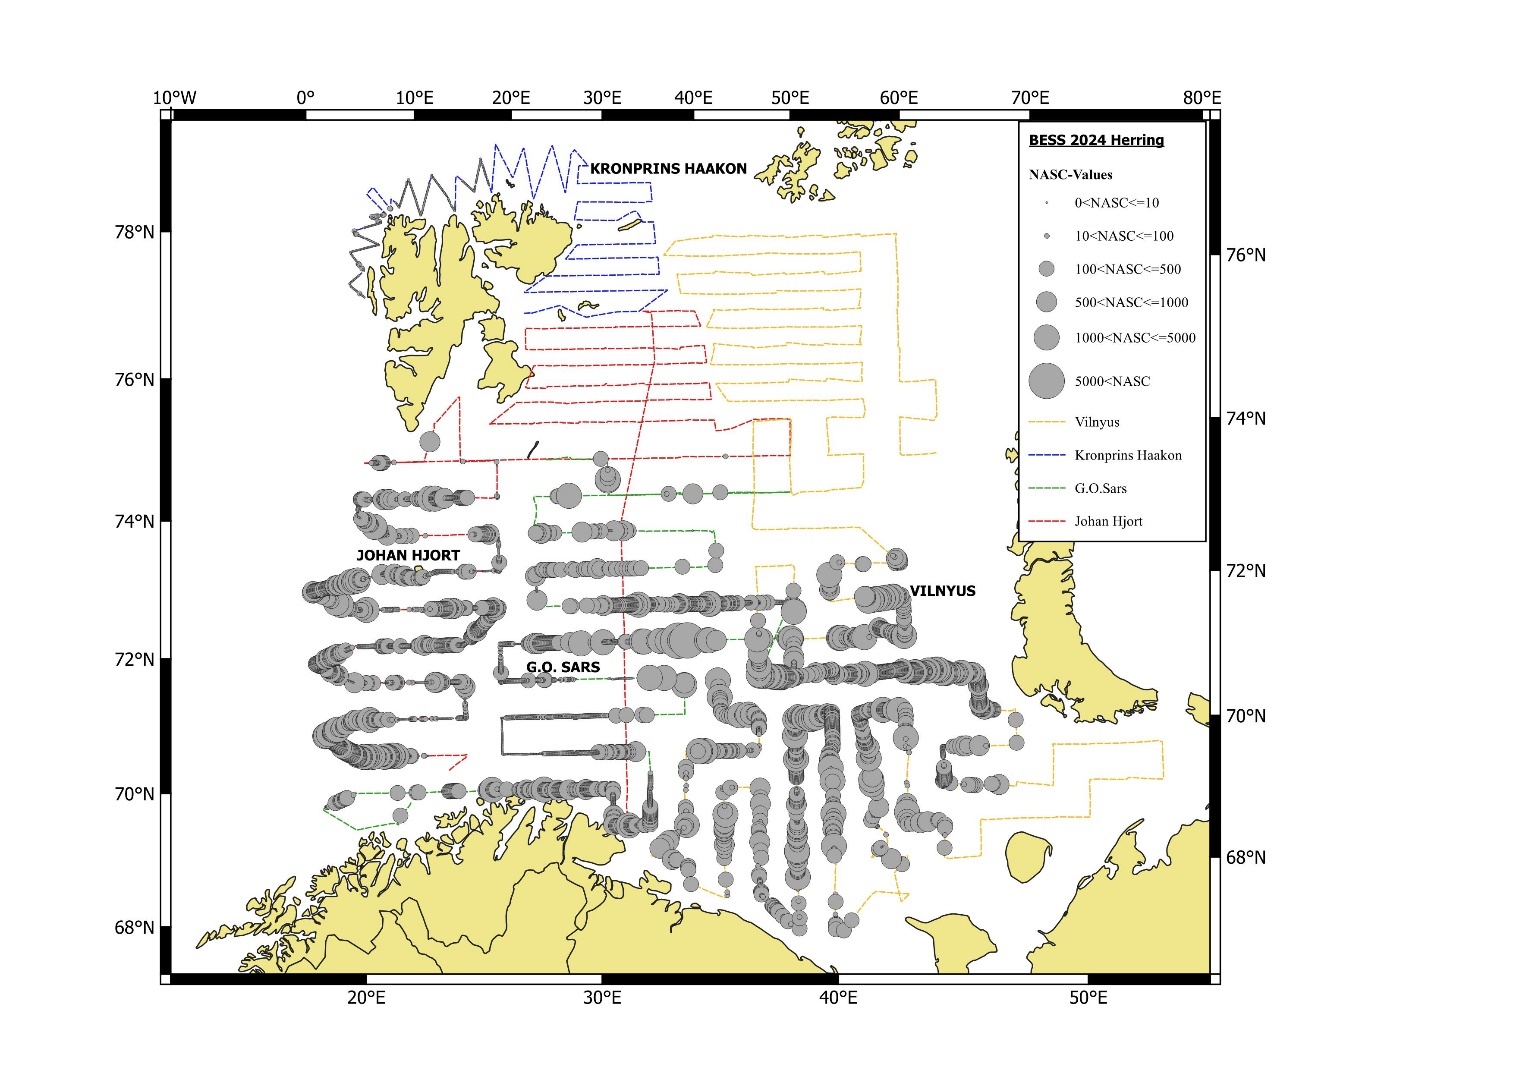
Young Norwegian spring spawning herring (NSSH) was distributed over large parts of the southern Barents Sea (Figure 7.3.1.1).
7.3.2 Abundance estimation
The estimated total number and biomass of NSSH in the Barents Sea in the autumn 2024 is shown in table 7.3.2.1, and the time series of abundance estimates is summarized in Table 7.3.2.2. Total numbers in 2024 was estimated at ca. 72 billion individuals (Table 7.3.2.1). This is the third highest on record and ca. 2.5 times higher than the long-term average (Table 7.3.2.2). Abundance of age group 1 was low, while abundance of age group 2 (2022 year class) was >5 times higher than the long-term average and abundance of age group 3 (2021 year class) was >6 times higher. The abundances of both 2 and 3-year-olds were the highest on record. Also abundance of age group 4+ was above the long-term average. The very high abundances of 2 and 3-year-olds were expected given the very high abundances of 1 and 2-year-olds in 2023. The total biomass of NSS-herring in the Barents Sea which is dominated by biomass of 2 and 3-year-olds is the highest that has been measured since 1999.
| Length (cm) | Age/year class | Sum (10⁹) | Biomass (10³ t) | Mean weight (g) | ||||||||
|---|---|---|---|---|---|---|---|---|---|---|---|---|
| 1 | 2 | 3 | 4 | 5 | 6 | 7 | 8 | 9 | ||||
| 2023 | 2022 | 2021 | 2020 | 2019 | 2018 | 2017 | 2016 | 2015 | ||||
| 10.0-11.0 | 0.004 | 0.004 | 0.028 | 6.83 | ||||||||
| 11.0-12.0 | 0.075 | 0.075 | 0.760 | 9.54 | ||||||||
| 12.0-13.0 | 1.194 | 1.194 | 15.353 | 12.38 | ||||||||
| 13.0-14.0 | 1.020 | 1.020 | 15.317 | 15.29 | ||||||||
| 14.0-15.0 | 0.269 | 0.146 | 0.415 | 7.846 | 18.90 | |||||||
| 15.0-16.0 | 0.080 | 1.577 | 1.657 | 41.317 | 24.92 | |||||||
| 16.0-17.0 | 0.240 | 9.481 | 9.721 | 282.643 | 29.07 | |||||||
| 17.0-18.0 | 0.176 | 10.613 | 10.789 | 374.855 | 34.99 | |||||||
| 18.0-19.0 | 0.039 | 7.451 | 7.490 | 312.536 | 41.99 | |||||||
| 19.0-20.0 | 0.012 | 5.938 | 0.240 | 6.191 | 302.748 | 49.52 | ||||||
| 20.0-21.0 | 3.604 | 0.790 | 4.394 | 255.483 | 58.14 | |||||||
| 21.0-22.0 | 1.898 | 3.099 | 4.997 | 348.415 | 68.75 | |||||||
| 22.0-23.0 | 0.968 | 5.163 | 6.132 | 496.857 | 79.97 | |||||||
| 23.0-24.0 | 1.288 | 5.936 | 7.224 | 659.783 | 91.00 | |||||||
| 24.0-25.0 | 0.485 | 3.535 | 4.020 | 425.111 | 106.75 | |||||||
| 25.0-26.0 | 0.500 | 2.128 | 2.628 | 324.159 | 122.22 | |||||||
| 26.0-27.0 | 0.045 | 0.853 | 0.052 | 0.950 | 132.731 | 138.86 | ||||||
| 27.0-28.0 | 0.262 | 0.047 | 0.309 | 49.073 | 156.65 | |||||||
| 28.0-29.0 | 0.043 | 0.148 | 0.191 | 39.034 | 203.19 | |||||||
| 29.0-30.0 | 0.060 | 0.043 | 0.103 | 22.626 | 217.40 | |||||||
| 30.0-31.0 | 0.117 | 0.117 | 28.084 | 237.69 | ||||||||
| 31.0-32.0 | 0.018 | 0.077 | 0.095 | 26.542 | 278.02 | |||||||
| 32.0-33.0 | 0.021 | 0.180 | 0.059 | 0.414 | 0.674 | 205.013 | 304.32 | |||||
| 33.0-34.0 | 0.143 | 0.061 | 1.024 | 1.229 | 397.241 | 323.00 | ||||||
| 34.0-35.0 | 0.056 | 0.465 | 0.014 | 0.535 | 181.439 | 340.52 | ||||||
| 35.0-36.0 | 0.068 | 0.068 | 24.542 | 357.42 | ||||||||
| TSN (109) | 3.109 | 43.995 | 22.109 | 0.424 | 0.021 | 0.323 | 0.176 | 2.048 | 0.014 | 72.321 | ||
| TSB (103 t) | 53.788 | 1943.005 | 2055.332 | 87.421 | 6.173 | 97.890 | 57.020 | 663.762 | 5.144 | 4984.863 | ||
| Mean length (cm) | 12.50 | 18.70 | 23.12 | 28.42 | 32.00 | 32.46 | 33.06 | 33.08 | 34.00 | 20.14 | ||
| Mean weight (g) | 14.93 | 49.94 | 95.95 | 204.02 | 292.00 | 303.70 | 325.34 | 324.99 | 364.00 | 75.27 | ||
Estimates based on Target strength (TS) Length (L) relationship: TS= 20.0 log (L) – 71.9
| Year | Age 1 | Age 2 | Age 3 | Age 4+ | Total | |||||
|---|---|---|---|---|---|---|---|---|---|---|
| TSN | TSB | TSN | TSB | TSN | TSB | TSN | TSB | TSN | TSB | |
| 1999 | 48.759 | 716.0 | 0.986 | 31.0 | 0.051 | 2.0 | 49.795 | 749.0 | ||
| 2000 | 14.731 | 383.0 | 11.499 | 560.0 | 26.230 | 943.0 | ||||
| 2001 | 0.525 | 12.0 | 10.544 | 604.0 | 1.714 | 160.0 | 12.783 | 776.0 | ||
| 2002 | No data | |||||||||
| 2003 | 99.786 | 3090.0 | 4.336 | 220.0 | 2.476 | 326.0 | 106.597 | 3636.0 | ||
| 2004 | 14.265 | 406.0 | 36.495 | 2725.0 | 0.901 | 107.0 | 51.717 | 3252.0 | ||
| 2005 | 46.380 | 984.0 | 16.167 | 1055.0 | 6.973 | 795.0 | 69.520 | 2833.0 | ||
| 2006 | 1.618 | 34.0 | 5.535 | 398.0 | 1.620 | 211.0 | 8.773 | 643.0 | ||
| 2007 | 3.941 | 148.0 | 2.595 | 218.0 | 6.378 | 810.0 | 0.250 | 46.0 | 13.164 | 1221.0 |
| 2008 | 0.030 | 1.0 | 1.626 | 77.0 | 3.987* | 287* | 3.223* | 373* | 8.866* | 738* |
| 2009 | 1.538 | 48.0 | 0.433 | 52.0 | 1.807 | 287.0 | 1.686 | 393.0 | 5.577 | 815.0 |
| 2010 | 1.047 | 35.0 | 0.315 | 34.0 | 0.234 | 37.0 | 0.428 | 104.0 | 2.025 | 207.0 |
| 2011 | 0.095 | 3.0 | 1.504 | 106.0 | 0.006 | 1.0 | 1.605 | 109.0 | ||
| 2012 | 2.031 | 36.0 | 1.078 | 66.0 | 1.285 | 195.0 | 4.394 | 296.0 | ||
| 2013 | 7.657 | 202.0 | 5.029 | 322.0 | 0.092 | 13.0 | 0.057 | 9.0 | 12.835 | 546.0 |
| 2014 | 4.188 | 62.0 | 1.822 | 126.0 | 6.825 | 842.0 | 0.162 | 25.0 | 13.011 | 1058.0 |
| 2015 | 1.183 | 6.0 | 9.023 | 530.0 | 3.214 | 285.0 | 0.149 | 24.0 | 13.569 | 845.0 |
| 2016 | 7.760 | 131.0 | 1.573 | 126.0 | 3.089 | 389.0 | 0.029 | 6.0 | 12.452 | 652.0 |
| 2017 | 34.950 | 820.0 | 2.138 | 141.0 | 3.465 | 412.0 | 0.982 | 210.0 | 41.537 | 1583.0 |
| 2018** | 0.530 | 22.6 | 6.035 | 526.0 | 1.299 | 165.5 | 0.897 | 171.7 | 1.165 | 482.5 |
| 2019 | 13.650 | 172.0 | 0.209 | 15.1 | 6.000 | 756.0 | 1.600 | 487.0 | 21.460 | 1430.0 |
| 2020 | 0.231 | 13.0 | 1.816 | 189.0 | 11.59* | 2796* | 13.636* | 2998* | ||
| 2021 | 1.410 | 80.8 | 0.120 | 10.1 | 0.360 | 39.5 | 0.720 | 144.7 | 2.610 | 275.1 |
| 2022** | 4.442 | 155.2 | 0.882 | 76.6 | 0.000 | 0.0 | 1.459 | 412.3 | 6.783 | 645.7 |
| 2023 | 64.115 | 925.2 | 32.920 | 1558.1 | 4.443 | 546.7 | 2.458 | 752.9 | 103.935 | 3783.0 |
| 2024 | 3.109 | 53.8 | 43.995 | 1943.0 | 22.109 | 2055.3 | 2.993 | 912.3 | 72.321 | 4984.9 |
| Average | 15.740 | 355.3 | 7.880 | 461.3 | 3.340 | 371.3 | 1.790 | 429.2 | 27.050 | 1420.0 |
*in mix with Kanin herring in the south-eastern part of the coverage area
**survey coverage only on Norwegian (western) side
7.4 Blue whiting (Micromesistius poutassou)
7.4.1 Geographical distribution
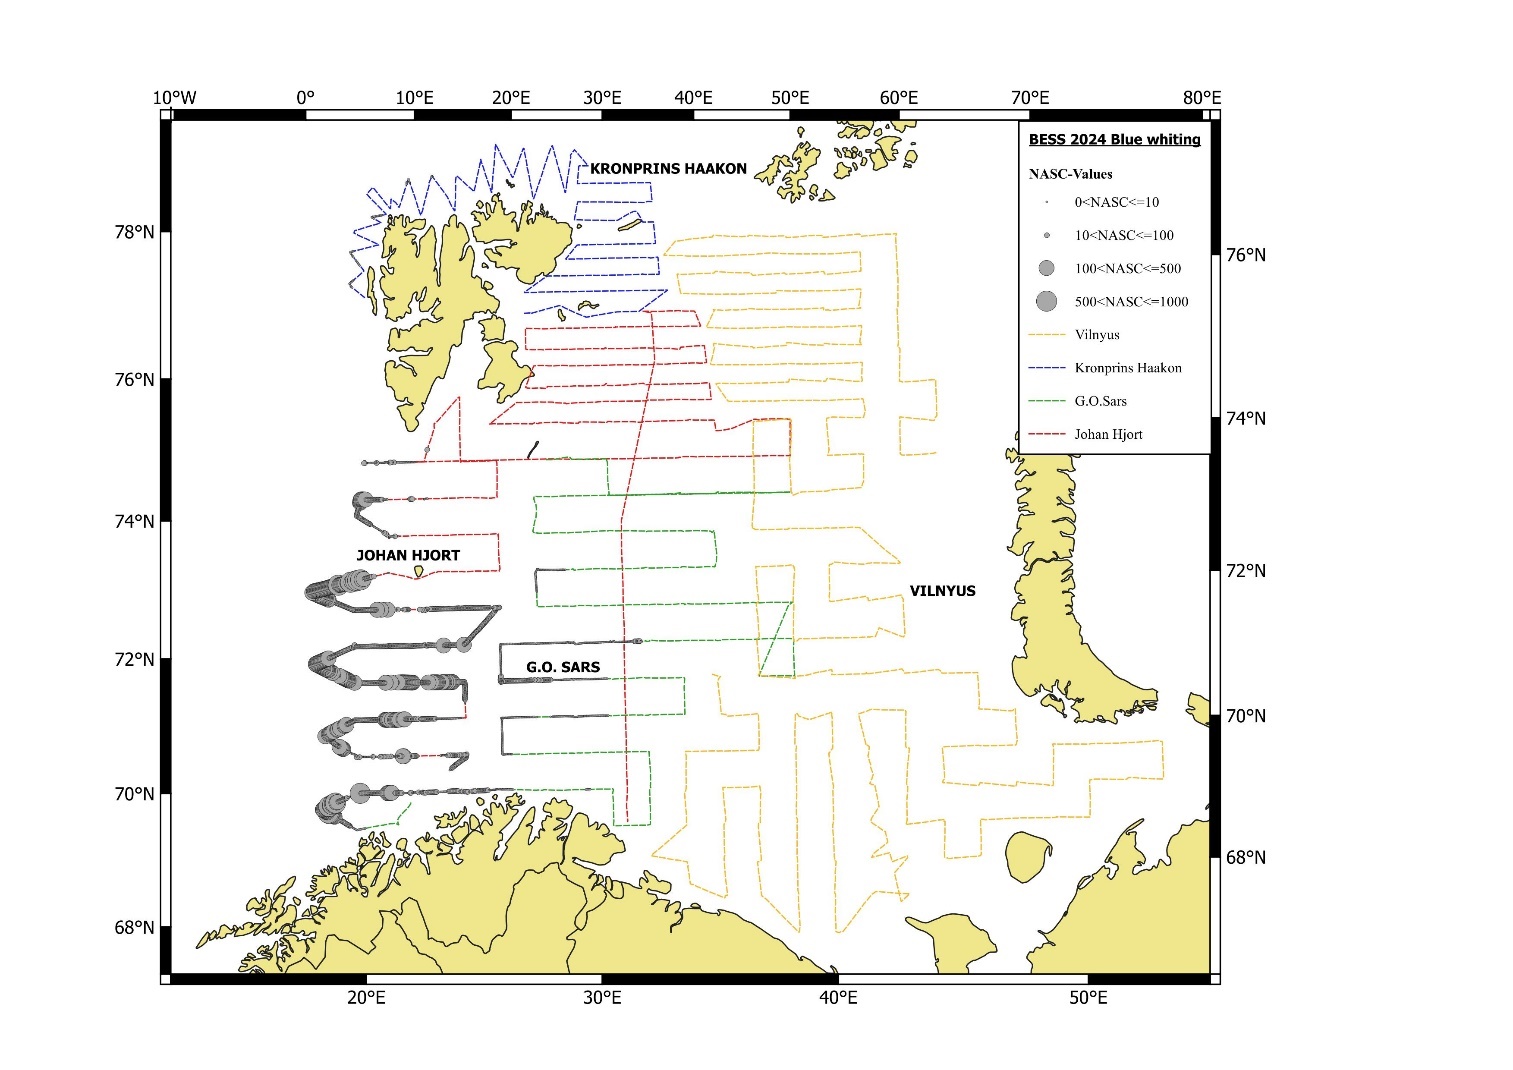
Blue whiting contributes to make up the mid-trophic pelagic component in the south-western part of the Barents Sea ecosystem. The Barents Sea is on the border of the distribution area for the blue whiting, but with incoming strong year-classes, increased abundance of young blue whiting in the Barents Sea is normally observed. The distribution of blue whiting from the BESS 2024 is shown in Figure 7.4.1.1. The distribution in 2024 was similar to 2023 following the shelf edge north to Svalbard (Spitsbergen) and with some recordings stretching north of Svalbard (Spitsbergen).
7.4.2 Abundance by size and age
The estimated total number and biomass of blue whiting in the Barents Sea in the autumn 2024 is shown in table 7.4.2.1, and the time series of abundance estimates is summarized in Table 7.4.2.2.
The total abundance and biomass are higher than in 2023 but below the long-term average (Table 7.4.2.2). The 3 and 4-year-olds (2021 and 2020 year classes) dominate both the abundance and biomass (Table 7.4.2.1).
| Length (cm) | Age/year class | Sum (10⁶) | Biomass (10³ t) | Mean weight (g) | ||||||||||||
|---|---|---|---|---|---|---|---|---|---|---|---|---|---|---|---|---|
| 1 | 2 | 3 | 4 | 5 | 6 | 7 | 8 | 9 | 10 | 11 | 12 | 15 | ||||
| 2023 | 2022 | 2021 | 2020 | 2019 | 2018 | 2017 | 2016 | 2015 | 2014 | 2013 | 2012 | 2009 | ||||
| 20.0-21.0 | 0.6 | 0.6 | 0.0 | 44.33 | ||||||||||||
| 21.0-22.0 | 2.5 | 2.5 | 0.1 | 54.96 | ||||||||||||
| 22.0-23.0 | 3.6 | 5.8 | 9.4 | 0.6 | 62.12 | |||||||||||
| 23.0-24.0 | 14.2 | 0.7 | 0.9 | 15.9 | 1.1 | 73.05 | ||||||||||
| 24.0-25.0 | 1.1 | 5.2 | 3.4 | 0.7 | 10.4 | 0.9 | 86.04 | |||||||||
| 25.0-26.0 | 19.4 | 19.4 | 2.0 | 101.47 | ||||||||||||
| 26.0-27.0 | 2.4 | 19.0 | 15.3 | 36.7 | 4.1 | 112.29 | ||||||||||
| 27.0-28.0 | 36.8 | 25.1 | 9.9 | 71.7 | 9.0 | 126.09 | ||||||||||
| 28.0-29.0 | 32.3 | 54.9 | 6.9 | 94.0 | 13.4 | 142.51 | ||||||||||
| 29.0-30.0 | 1.0 | 19.2 | 7.5 | 27.0 | 54.7 | 8.5 | 156.99 | |||||||||
| 30.0-31.0 | 11.2 | 22.0 | 8.9 | 11.0 | 5.5 | 3.9 | 62.3 | 10.7 | 170.68 | |||||||
| 31.0-32.0 | 2.9 | 5.9 | 8.2 | 1.8 | 1.7 | 1.8 | 22.3 | 4.2 | 189.94 | |||||||
| 32.0-33.0 | 3.7 | 6.9 | 5.8 | 2.8 | 3.3 | 3.9 | 26.3 | 5.2 | 199.15 | |||||||
| 33.0-34.0 | 4.1 | 5.4 | 9.5 | 2.1 | 220.59 | |||||||||||
| 34.0-35.0 | 3.2 | 4.0 | 3.6 | 3.1 | 13.8 | 3.5 | 250.26 | |||||||||
| 35.0-36.0 | 3.6 | 1.4 | 3.4 | 1.5 | 1.9 | 11.9 | 3.3 | 270.30 | ||||||||
| 36.0-37.0 | 0.1 | 4.0 | 0.1 | 4.3 | 1.3 | 300.24 | ||||||||||
| 37.0-38.0 | 0.2 | 0.2 | 0.1 | 243.00 | ||||||||||||
| 38.0-39.0 | ||||||||||||||||
| 39.0-40.0 | ||||||||||||||||
| 40.0-41.0 | ||||||||||||||||
| 41.0-42.0 | ||||||||||||||||
| 42.0-43.0 | 0.1 | 0.1 | 0.0 | 402.00 | ||||||||||||
| 43.0-44.0 | ||||||||||||||||
| TSN (106) | 22.0 | 15.2 | 144.9 | 139.2 | 67.6 | 17.8 | 18.6 | 15.5 | 3.3 | 9.4 | 9.2 | 3.1 | 0.1 | 499.0 | ||
| TSB (103 t) | 1.5 | 1.3 | 19.1 | 20.2 | 10.9 | 3.9 | 3.9 | 3.8 | 0.8 | 1.9 | 2.0 | 0.8 | 0.0 | 70.8 | ||
| Mean length (cm) | 22.30 | 24.50 | 27.10 | 28.20 | 29.10 | 31.10 | 32.20 | 33.10 | 33.00 | 32.10 | 32.50 | 34.00 | 42.00 | 28.00 | ||
| Mean weight (g) | 66.70 | 92.60 | 128.90 | 143.90 | 159.00 | 202.20 | 214.20 | 224.00 | 217.80 | 196.30 | 216.60 | 257.20 | 402.00 | 143.77 | ||
Estimates based on Target strength (TS) Length (L) relationship: TS= 20 log (L) - 65.2
| Year | Age 1 | Age 2 | Age 3 | Age 4+ | Total | |||||
|---|---|---|---|---|---|---|---|---|---|---|
| TSN | TSB | TSN | TSB | TSN | TSB | TSN | TSB | TSN | TSB | |
| 2004 | 669 | 26 | 439 | 33 | 1056 | 98 | 1211 | 159 | 3575 | 327 |
| 2005 | 649 | 20 | 523 | 36 | 1051 | 86 | 809 | 102 | 3039 | 244 |
| 2006 | 47 | 2 | 478 | 34 | 730 | 70 | 922 | 129 | 2177 | 235 |
| 2007 | + | + | 116 | 11 | 892 | 92 | 743 | 107 | 1757 | 210 |
| 2008 | + | + | + | + | 10 | 1 | 238 | 36 | 247 | 37 |
| 2009 | 1 | + | + | + | 6 | 1 | 359 | 637 | 366 | 65 |
| 2010 | 2 | 5 | 1 | 155 | 31 | 163 | 33 | |||
| 2011 | 2 | + | 2 | + | 13 | 2 | 93 | 22 | 109 | 25 |
| 2012 | 583 | 27 | 64 | 8 | 58 | 9 | 321 | 77 | 1025 | 121 |
| 2013 | 1 | 349 | 28 | 135 | 13 | 175 | 42 | 664 | 84 | |
| 2014 | 111 | 5 | 19 | 2 | 185 | 20 | 127 | 28 | 443 | 55 |
| 2015 | 1768 | 71 | 340 | 29 | 134 | 15 | 286 | 44 | 2529 | 159 |
| 2016 | 277 | 13 | 1224 | 82 | 588 | 48 | 216 | 36 | 2351 | 188 |
| 2017 | 43 | 2 | 253 | 22 | 503 | 49 | 269 | 38 | 1143 | 115 |
| 2018 | 18 | 1 | 74 | 8 | 215 | 29 | 332 | 40 | ||
| 2019 | 54 | 2 | 64 | 5 | 66 | 8 | 162 | 27 | 347 | 43 |
| 2020 | 110 | 5 | 19 | 2 | 11 | 1 | 56 | 11 | 196 | 18 |
| 2021 | 406 | 17 | 58 | 5 | 39 | 5 | 67 | 13 | 584 | 40 |
| 2022 | 195 | 8 | 143 | 12 | 41 | 4 | 58 | 10 | 437 | 34 |
| 2023 | 29 | 2 | 61 | 5 | 84 | 10 | 100 | 17 | 275 | 34 |
| 2024 | 22 | 1 | 15 | 1 | 145 | 19 | 284 | 48 | 499 | 71 |
| Average | 292 | 14 | 220 | 19 | 277 | 27 | 327 | 78 | 1060 | 104 |
Estimates based on Target strength (TS) Length (L) relationship : TS = 20 log (L) - 65.2 (Recalculation by Åge Høines, IMR 2017)
Note:«+» <0.5
| Year class | Age | Numbers (106) | Mean weight (g) | Biomass (103 t) | ||||
|---|---|---|---|---|---|---|---|---|
| 2023 | 2022 | 1 | 22.0 | 29.3 | 66.73 | 56.52 | 1.5 | 1.7 |
| 2022 | 2021 | 2 | 15.2 | 61.3 | 92.61 | 88.57 | 1.3 | 5.4 |
| 2021 | 2020 | 3 | 144.9 | 84.0 | 128.93 | 118.40 | 19.1 | 9.9 |
| 2020 | 2019 | 4+ | 283.8 | 100.2 | 166.41 | 136.44 | 48.1 | 17.4 |
| Total stock in: | ||||||||
| 2024 | 2023 | Total | 499.0 | 274.8 | 143.77 | 125.37 | 70.8 | 34.5 |