AKES («Antarctic Krill and Ecosystem Studies», 2008-2011) var et HI-prosjekt med primært fokus på kartlegging av forekomst og fordeling av Antarktisk krill (Euphausia superba) i de sentrale og østlige deler av den Atlantiske sektor i Sørishavet. Ved gjennomføringen av prosjektet har HI bidratt med en betydelig mengde ny kunnskap og vitenskapelige data til forvaltning av økosystemressursene i ansvarsområdet til CCAMLR («Commission for the Conservation of Marine Living Resources»). Den todelte ekspedisjonen ble gjennomført i løpet av den Australske sommeren i 2008. I store deler av nevnte havområde er kunnskapen om økosystemet begrenset og mangelfullt beskrevet. Denne rapporten presenterer resultater fra det taksonomiske arbeidet utført på fisk som ble opparbeidet fra trålfangster tatt i de øvre ~750 m av vannsøylen. Taksonomisk identifikasjon er basert på morfologiske karakteristika og bruk av tilgjengelige og oppdaterte identifikasjonsnøkler. Denne rapporten gir en systematisk fremstilling av artssammensetning, antall, utbredelse og størrelsesfordelte data. Dette arbeidet har stor nytteverdi ved fremtidige undersøkelser i denne delen av Sørishavet, særlig i forhold til komparative analyser av økosystem endringer, forvaltningshensyn i forhold til fiskerier og bifangst, samt funksjonalitet og design av fremtidige marine verneområder (MPA’er). For ytterligere dokumentasjon av survey design, metodikk, trålredskap og assosierte undersøkelser, vises til beskrivelser presentert i Iversen et al. (2008) og Krafft et al. (2010).
Fish Atlas of the Southern Ocean, based on the AKES 2008 expedition
Report series:
Rapport fra havforskningen 2024-62
ISSN: 1893-4536
Published: 17.12.2024
Updated: 21.07.2025
Project No.: 15208
On request by: Institute of Marine Research
Research group(s):
Pelagisk fisk
,
Plankton
,
Økosystemprosesser
,
Fiskeridynamikk
,
Norsk marint datasenter (NMD)
Program:
Marine prosesser og menneskelig påvirkning
Research group leader(s):
Espen Johnsen (Pelagisk fisk)
Approved by:
Research Director(s):
Geir Huse
Program leader(s):
Ann-Lisbeth Agnalt
Norsk sammendrag
Summary
AKES (“Antarctic Krill and Ecosystem Studies”, 2008-2011) was an IMR project that focused on mapping the abundance and distribution of Antarctic krill (Euphausia superba) in the central to eastern parts of the Atlantic sector of the Southern Ocean. Through the project IMR has contributed with highly relevant science and new knowledge to the management of ecosystem resources within the management area of CCAMLR (“Commission for the Conservation of Marine Living Resources”). The expedition was conducted during two consecutive surveys carried out during the Austral summer of 2008. In these areas, detailed knowledge of the ecosystem is limited and poorly described. This report presents results from taxonomic analyses performed on fish worked up from trawl catches in the upper ~750 m of the water column. Taxonomic identifications are based on morphological characteristics using the most updated identification keys. Following identification, each species or genus is illustrated by an image, while its distribution and numbers caught are presented in associated figures and tables. This work is important for future surveys in the Southern Atlantic when assessing ecosystem change, bycatch related to ongoing and new fisheries, management as well as the functionality and design of future marine protected areas (MPA’s). For further descriptions of relevant survey design, methodology, trawl gear and associated investigations, see descriptions in Iversen et al. (2008) and Krafft et al. (2010).
1 - Background
AKES 2008-2011 (Antarctic Krill and Ecosystem Studies) was an IMR (Institute of Marine Research) project primarily aimed to investigate the abundance and distribution of Antarctic krill (Euphausia superba) in a region of the Atlantic sector of the Southern Ocean (Figure 1), where knowledge about the ecosystem is limited. The expedition consisting of two survey legs carried out during the Austral summer of 2008 (4 January to 28 March) in the CCAMLR (Convention on the Conservation of Antarctic Marine Living Resources) area.
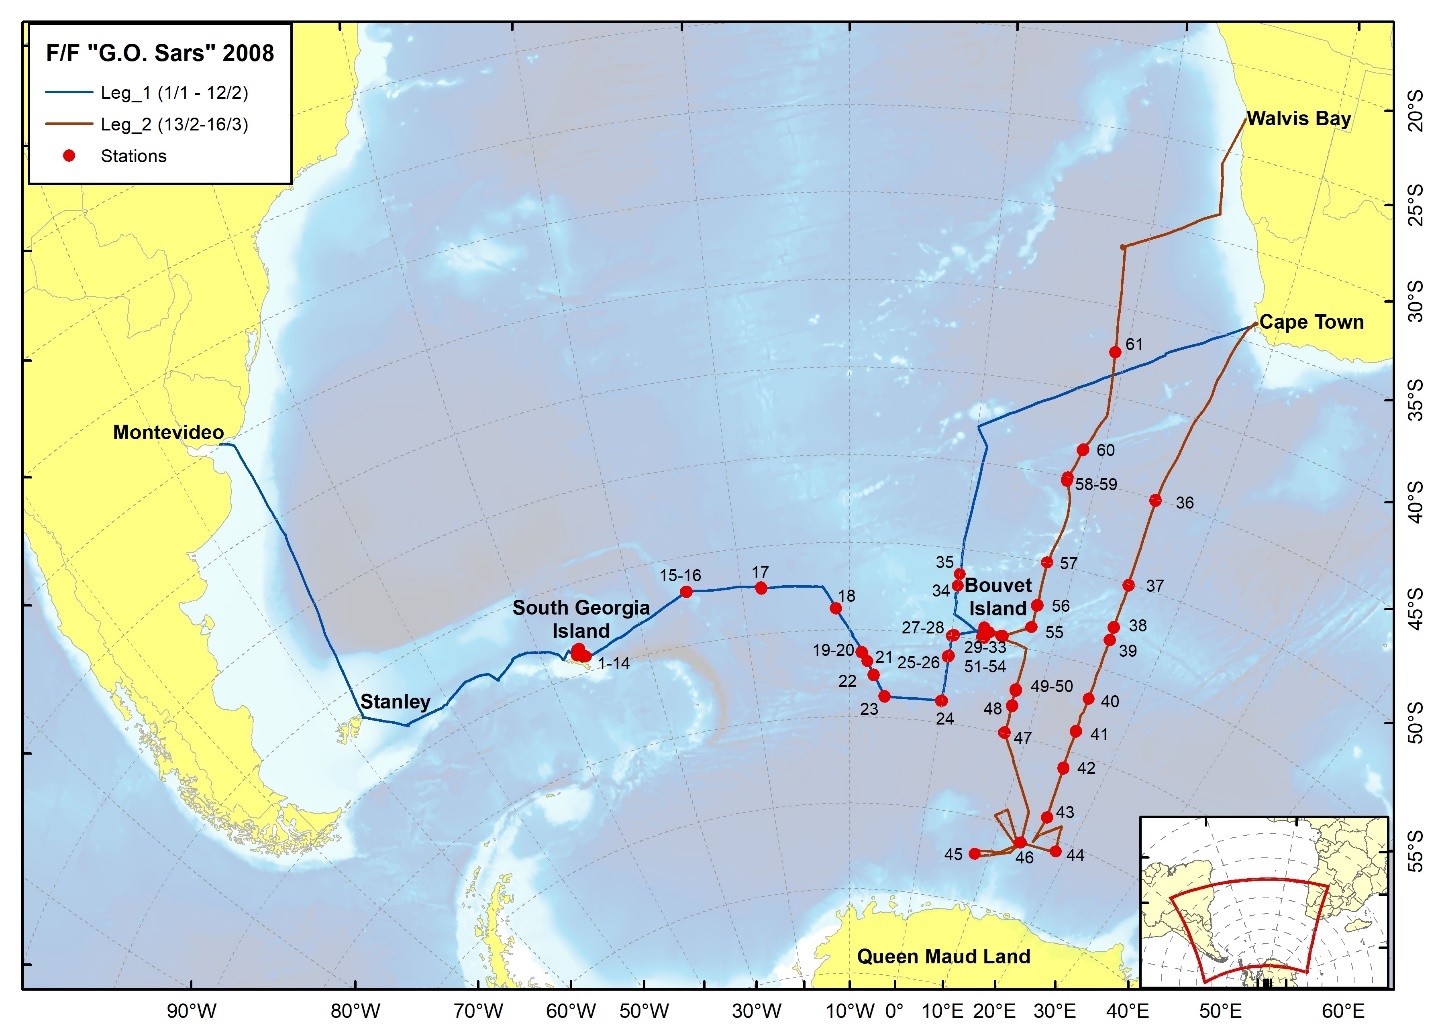
Trawling was carried out throughout the area to a maximum of ~750 m depth to the surface. For description of the survey design, methodology and trawl gear, see Krafft et al. (2010).
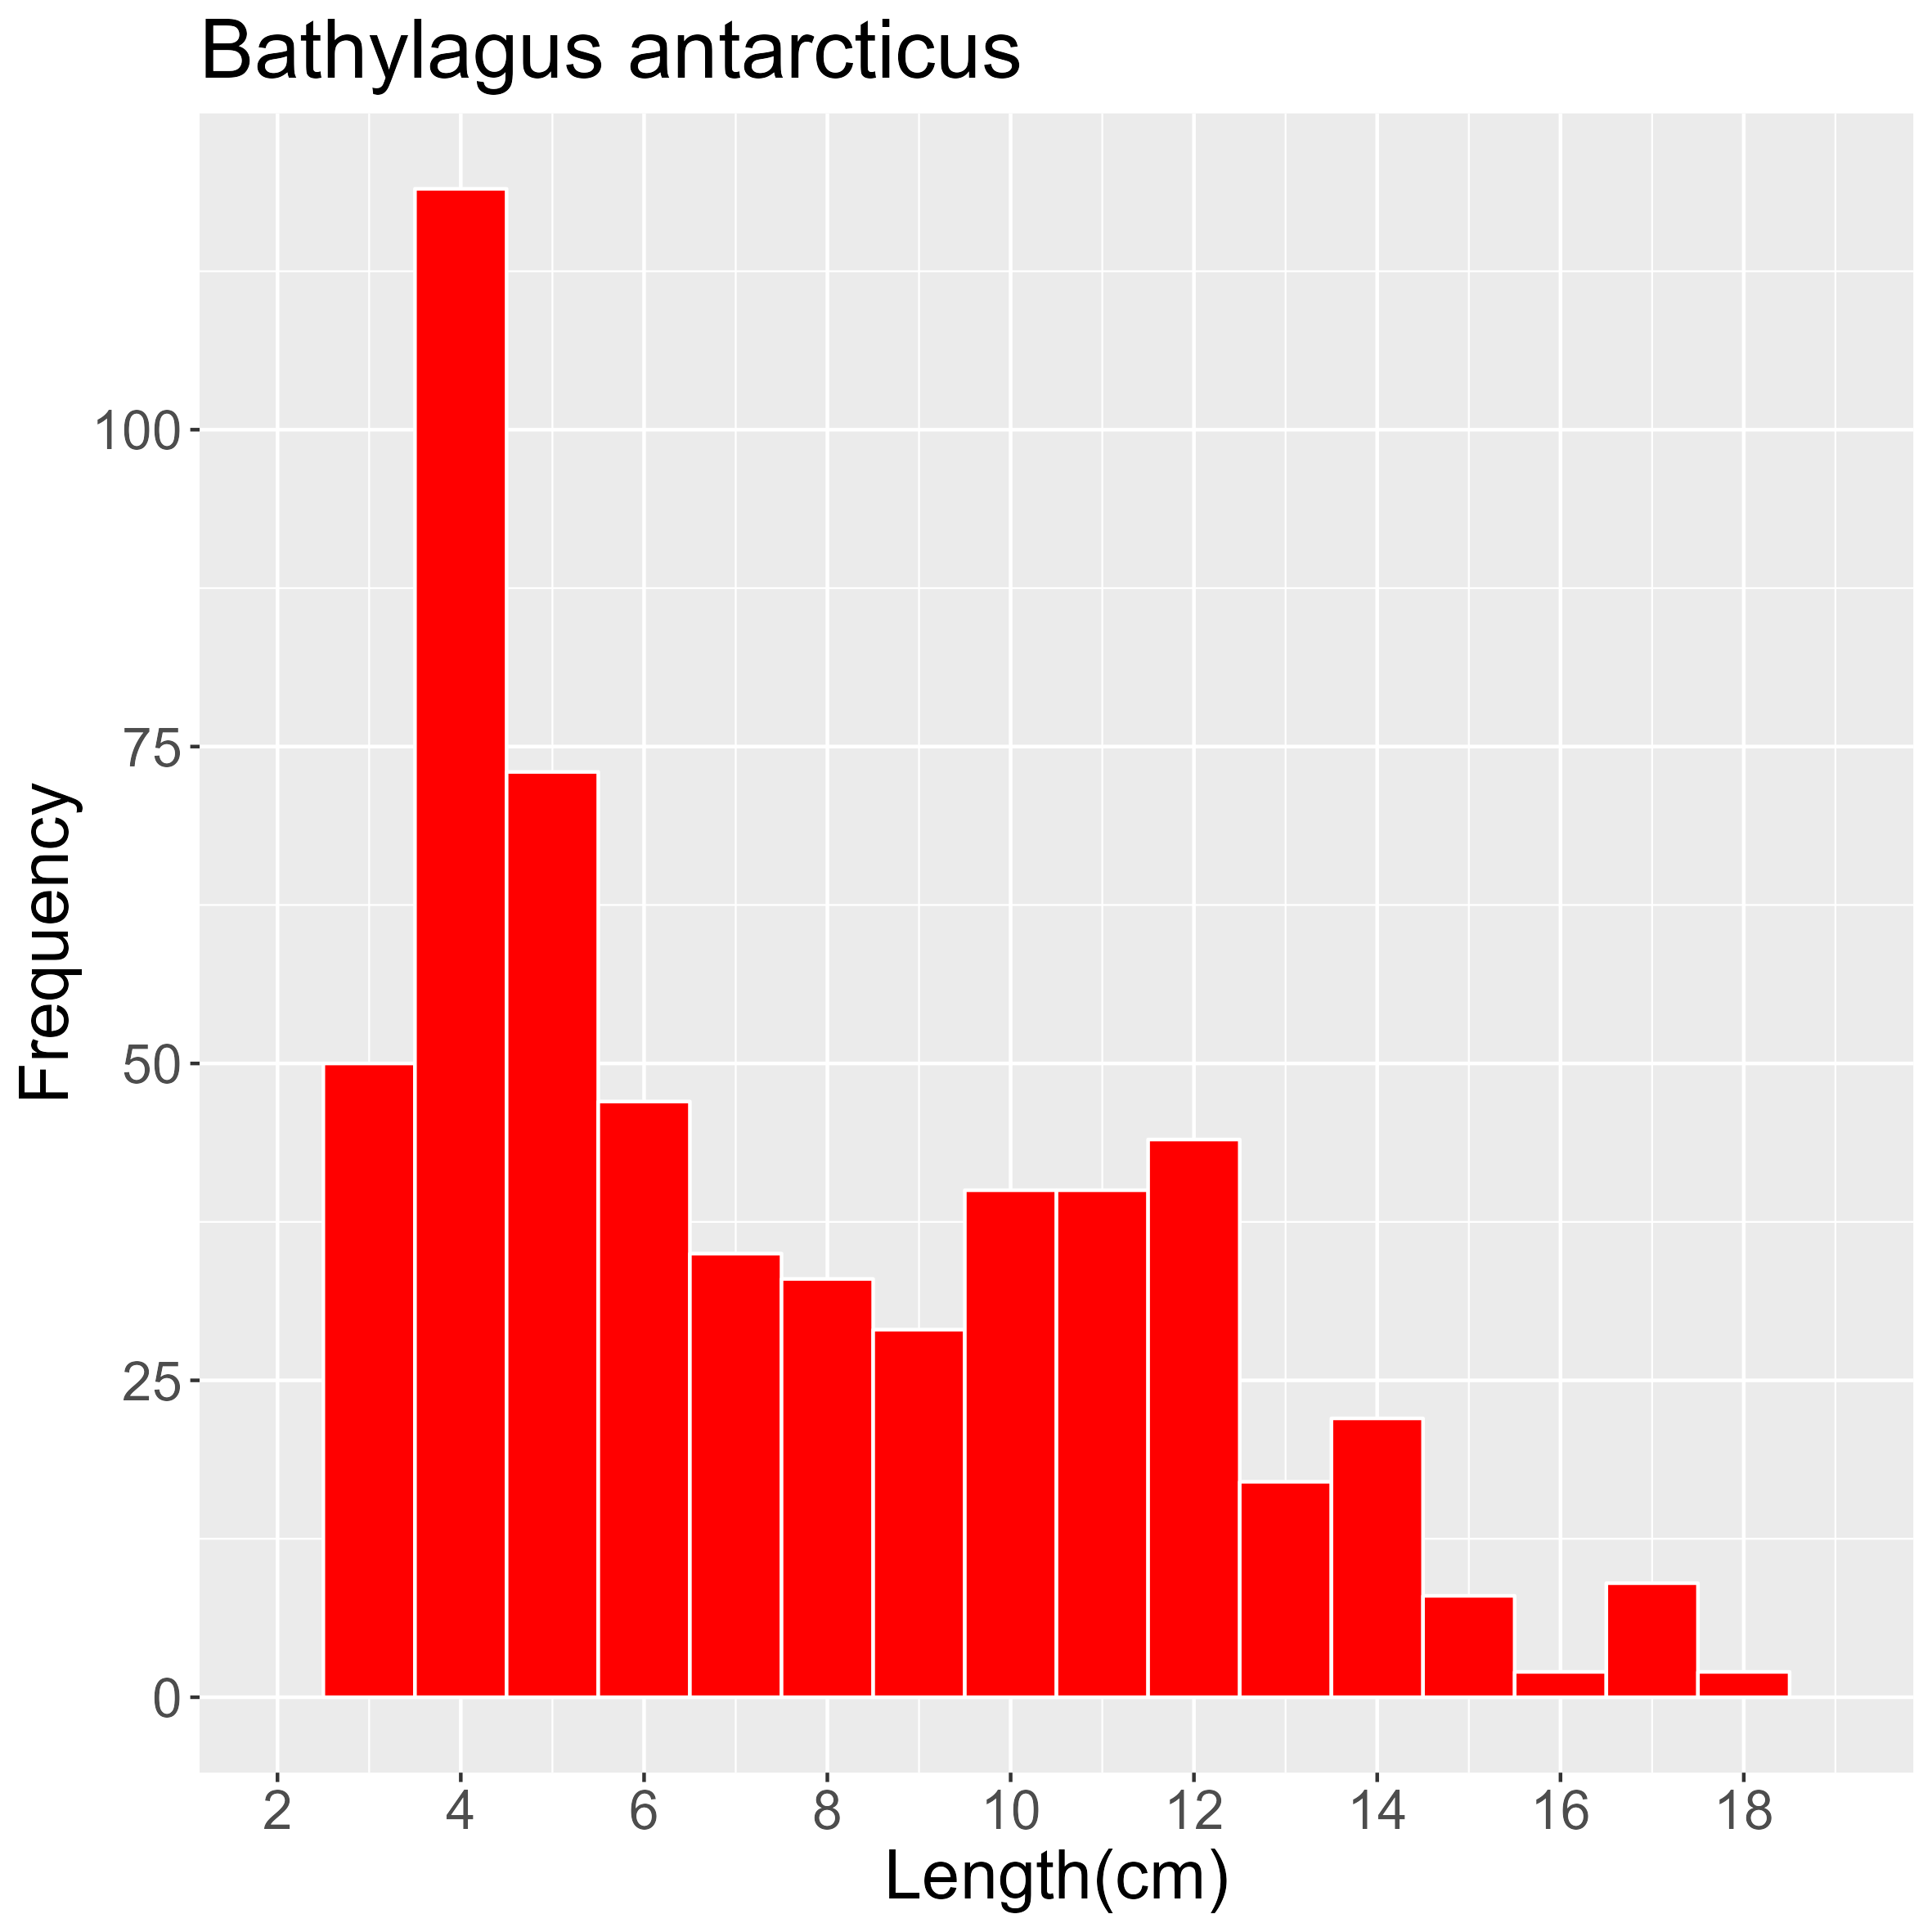
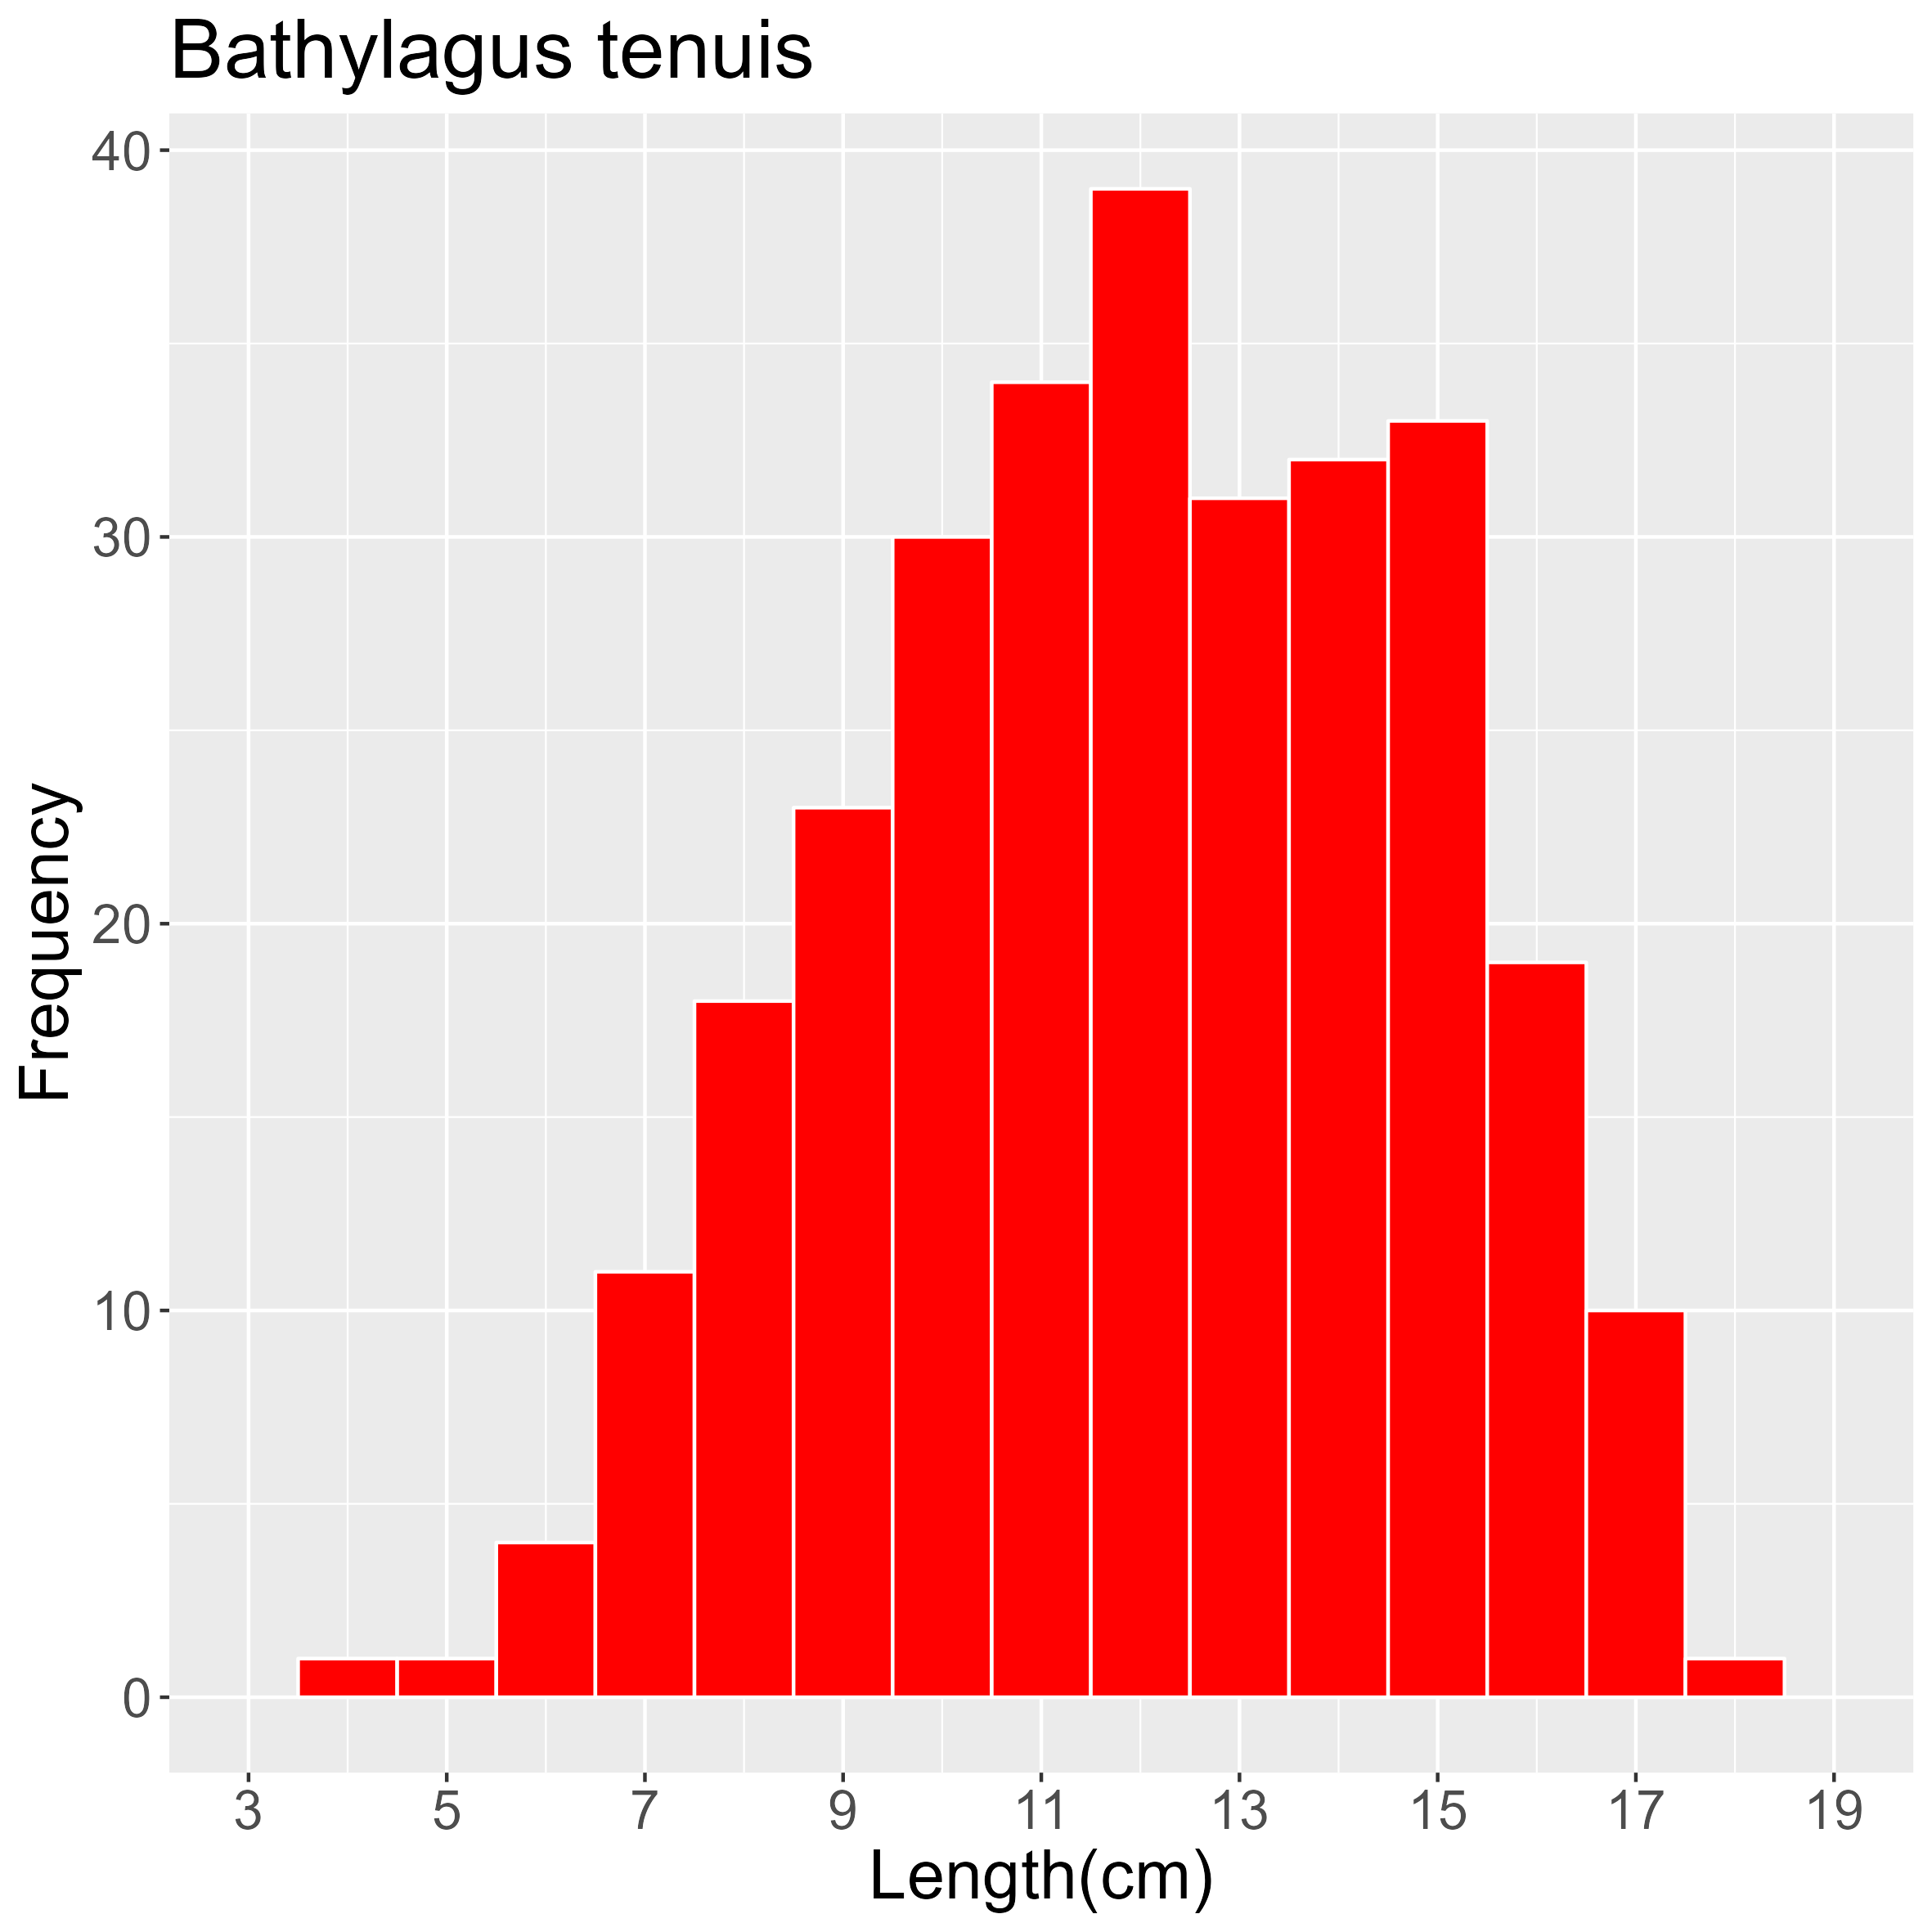
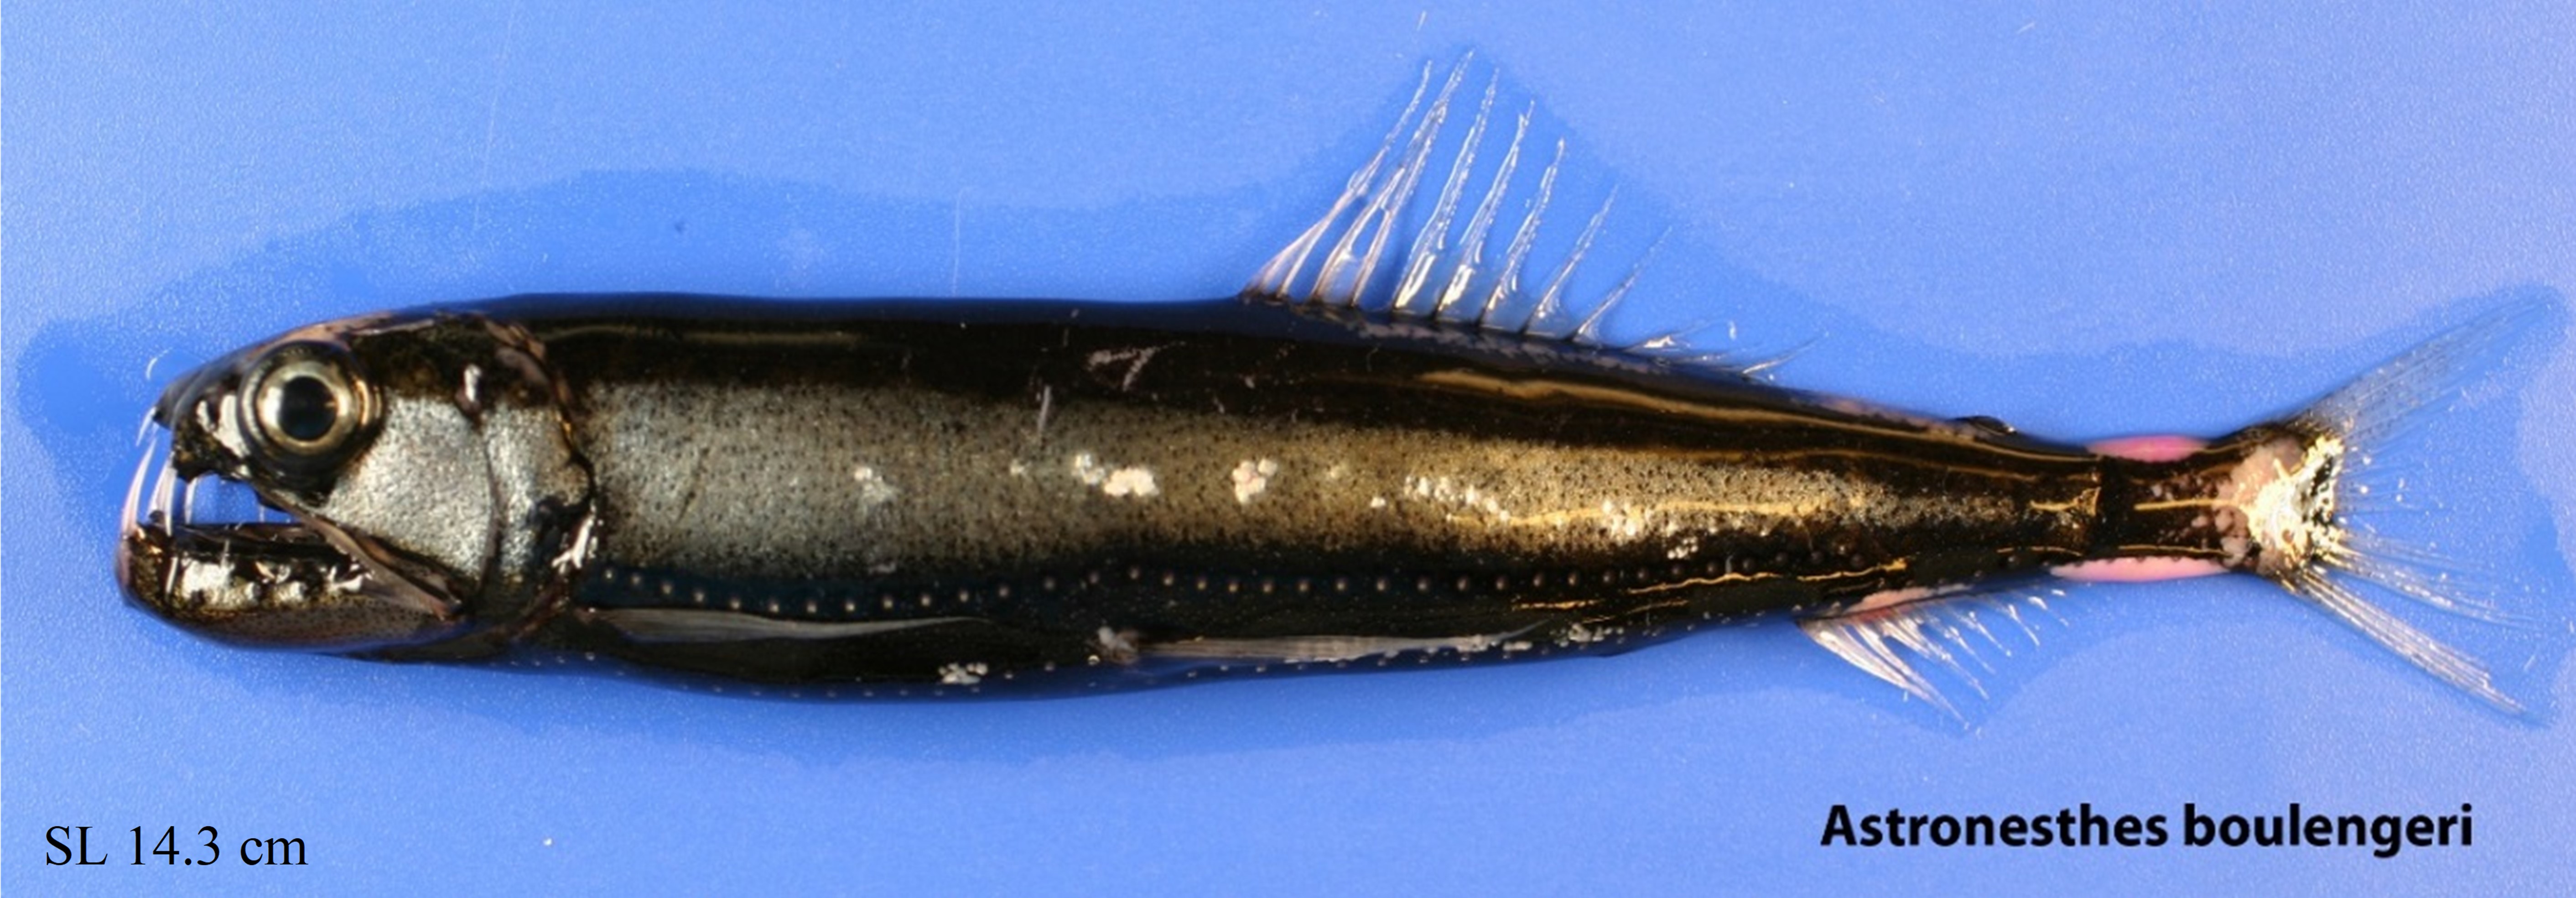
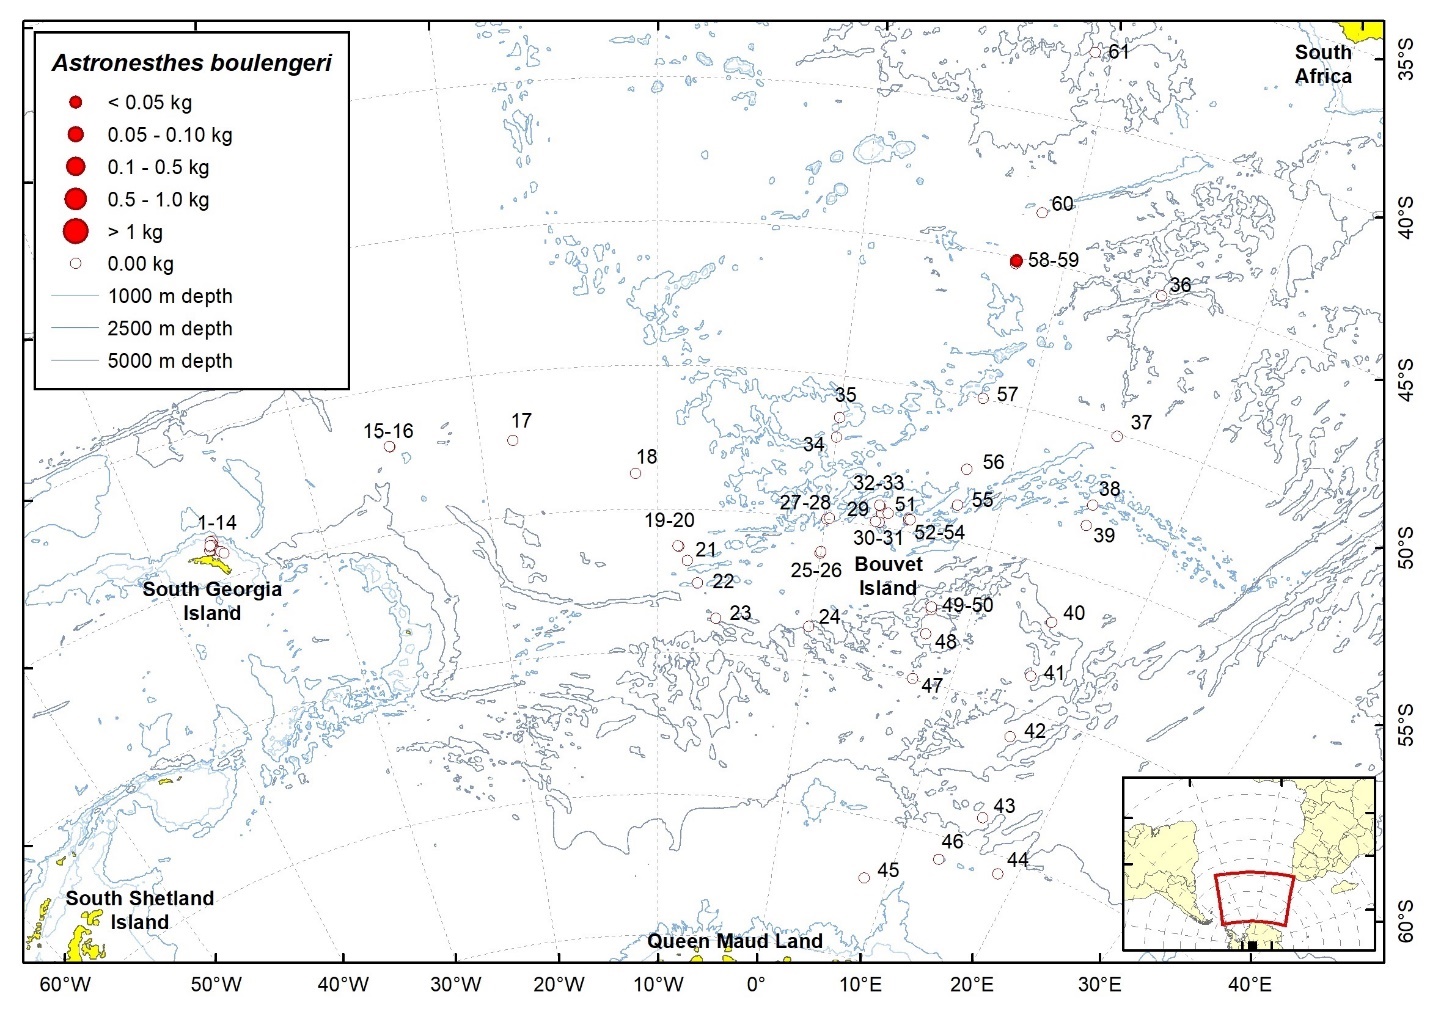
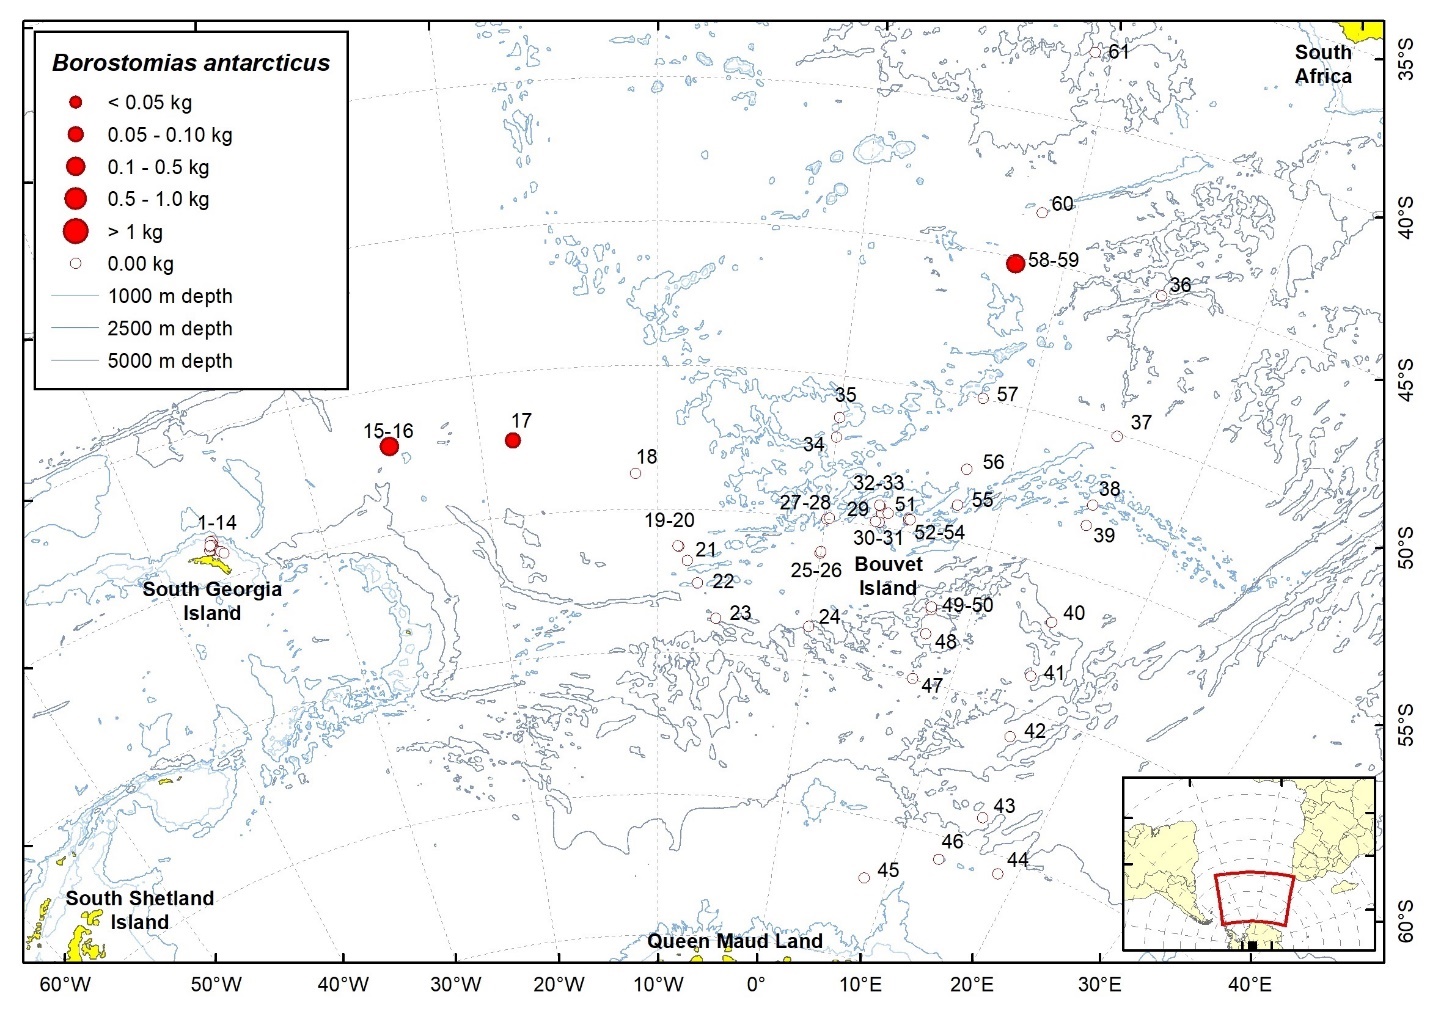
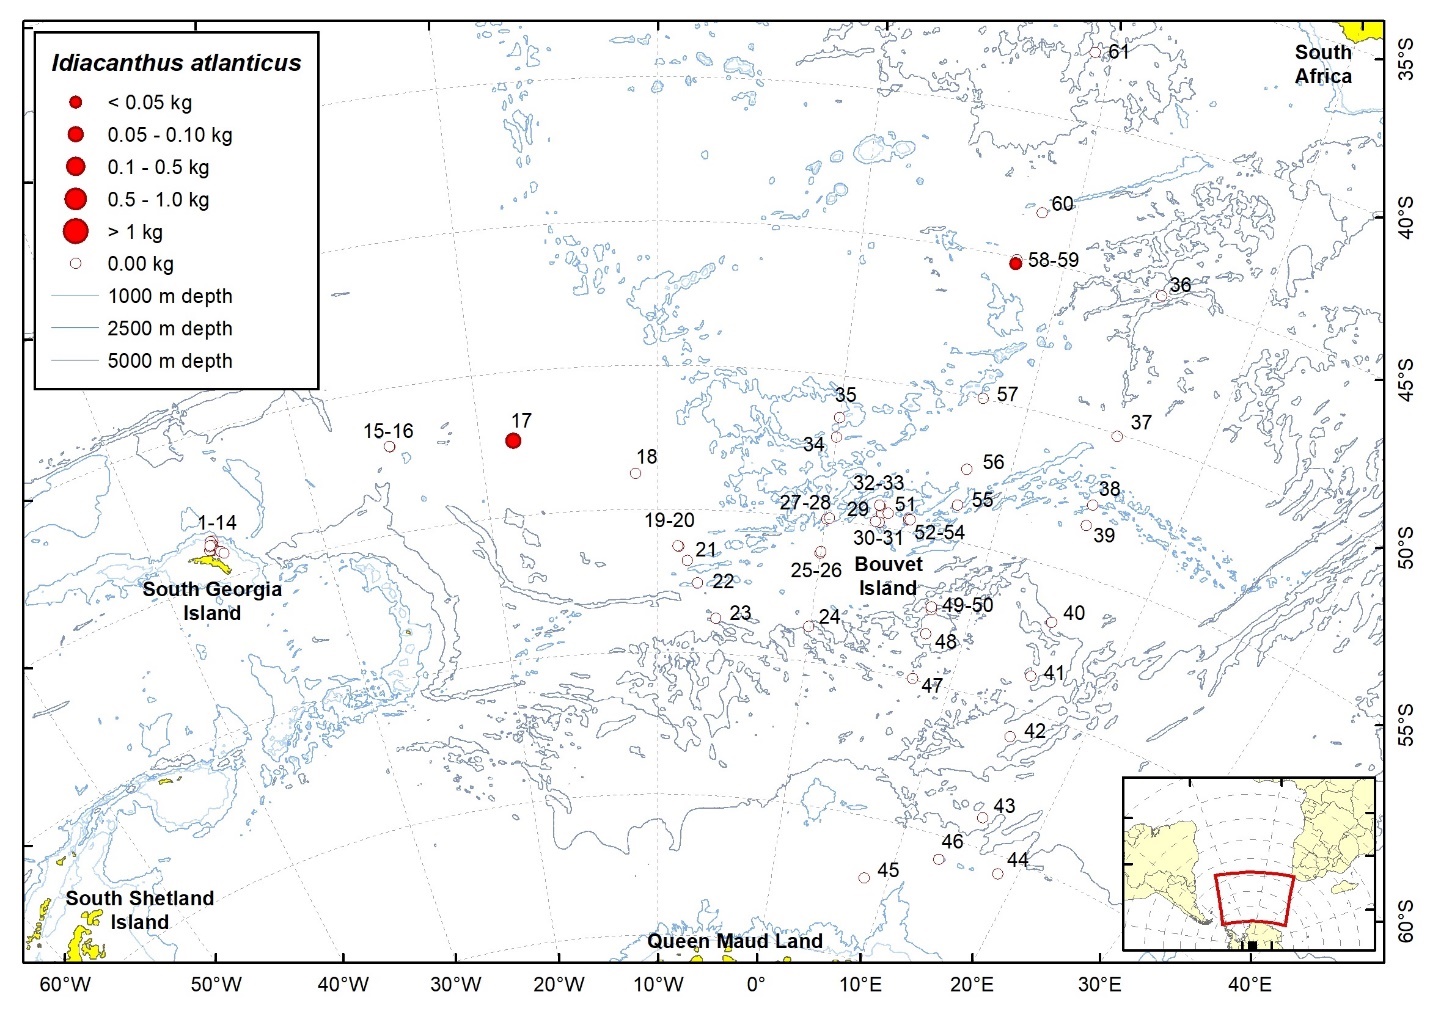
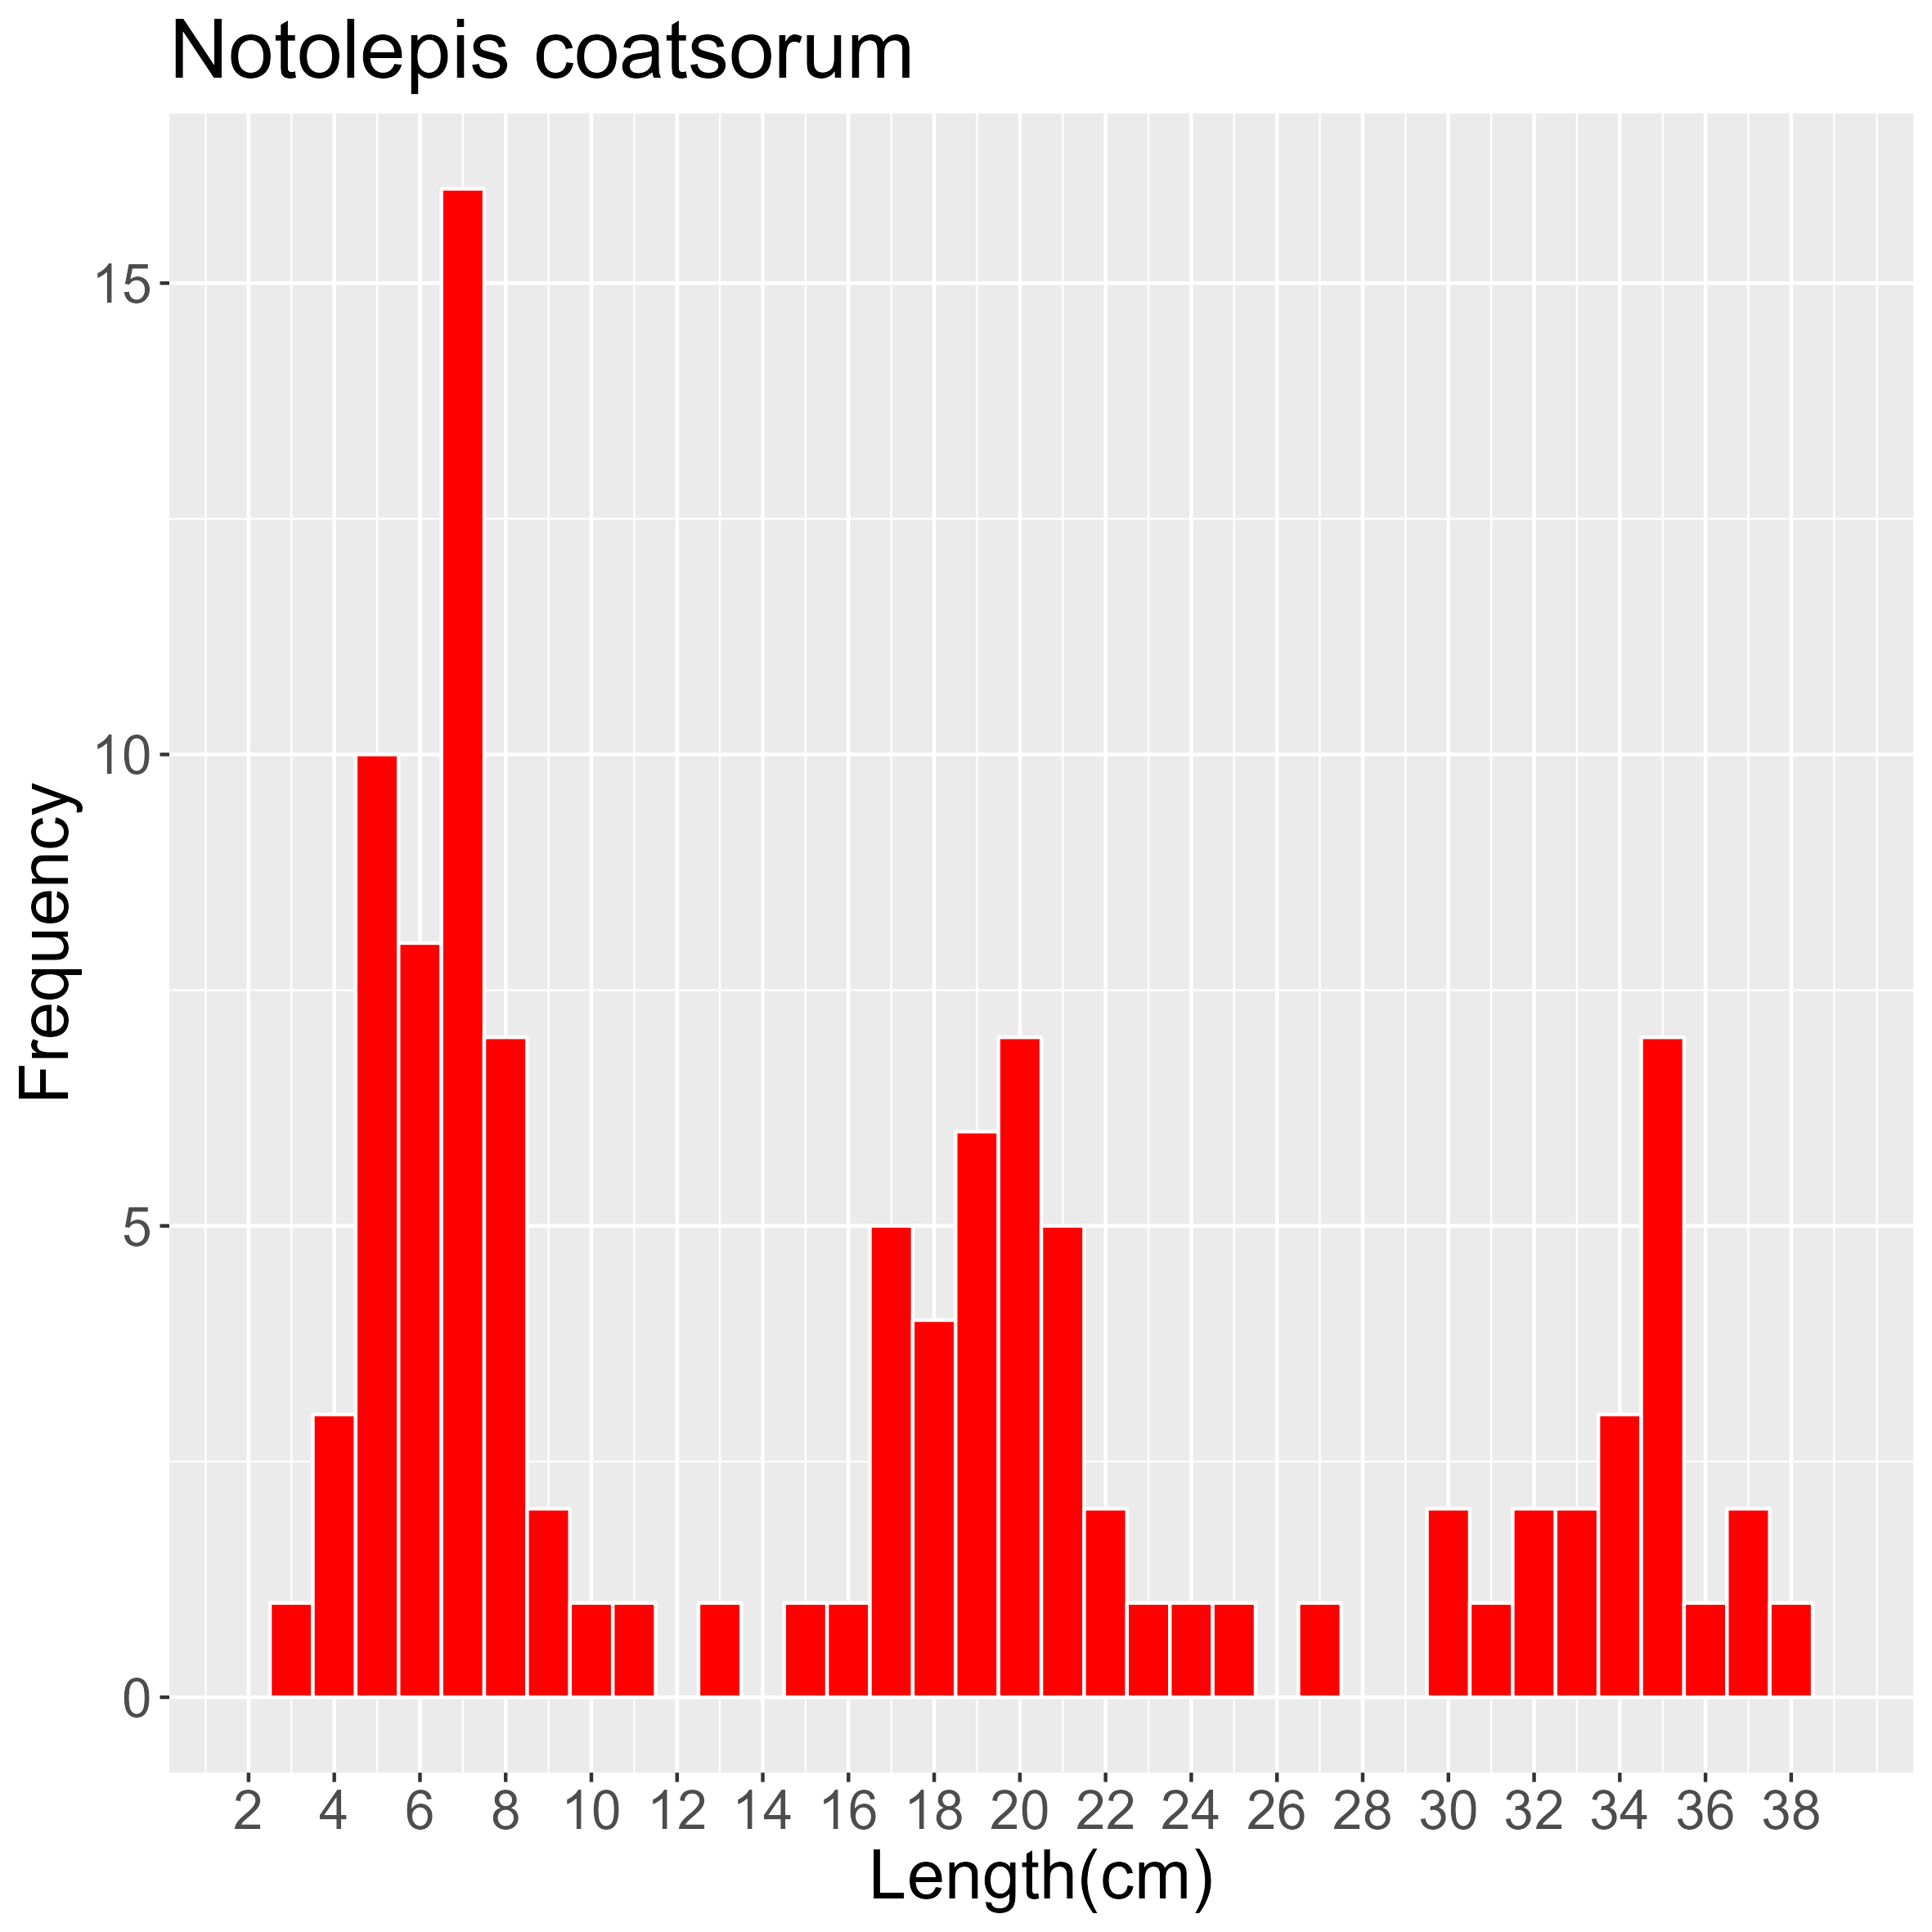
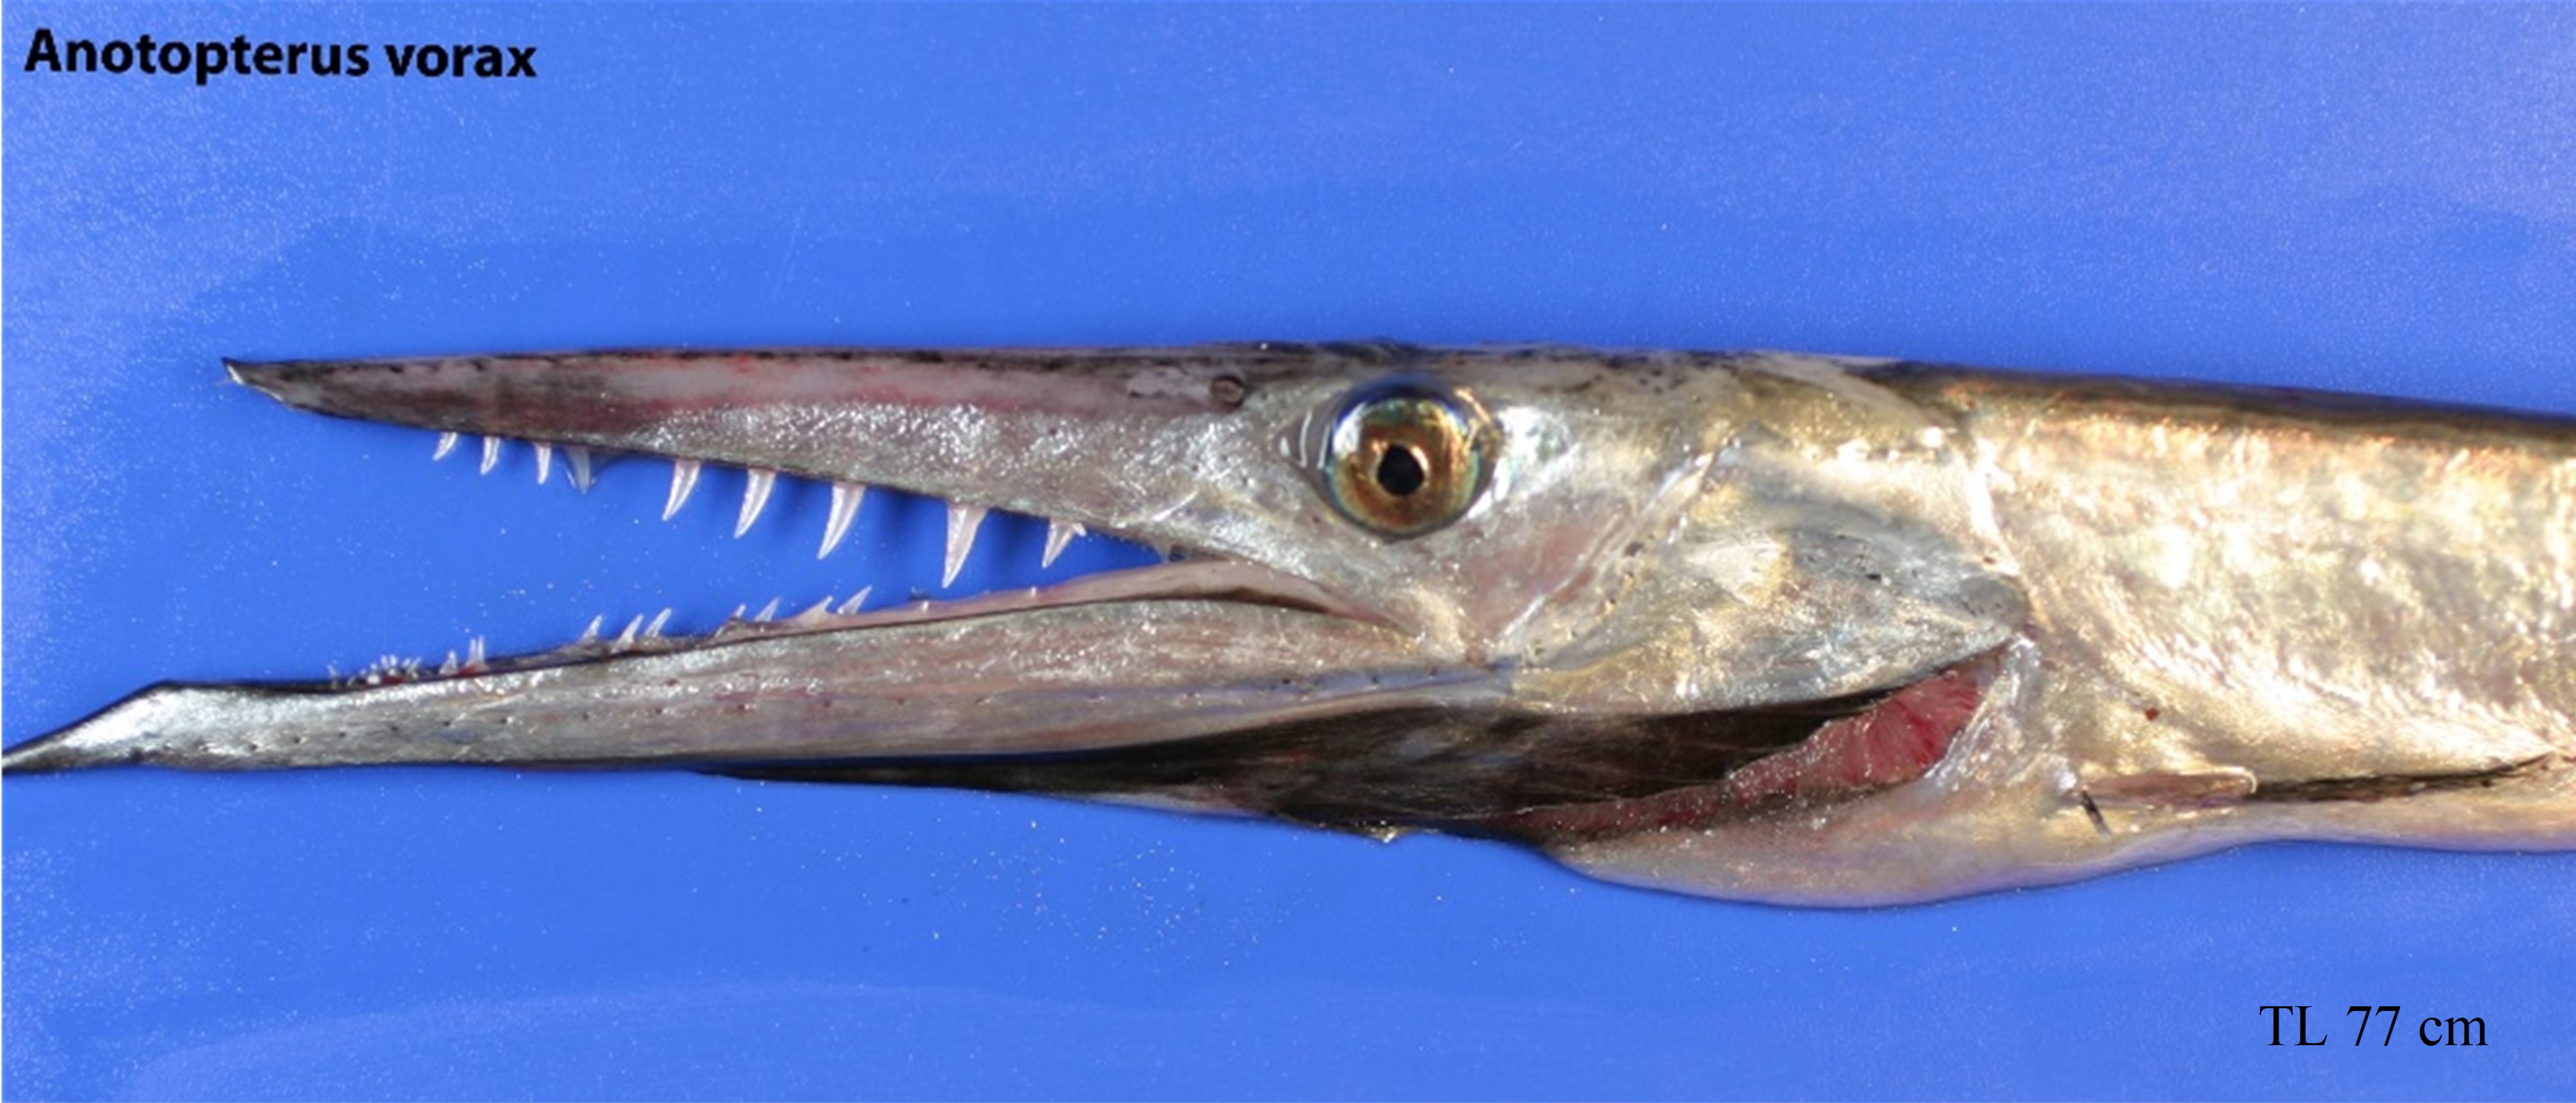
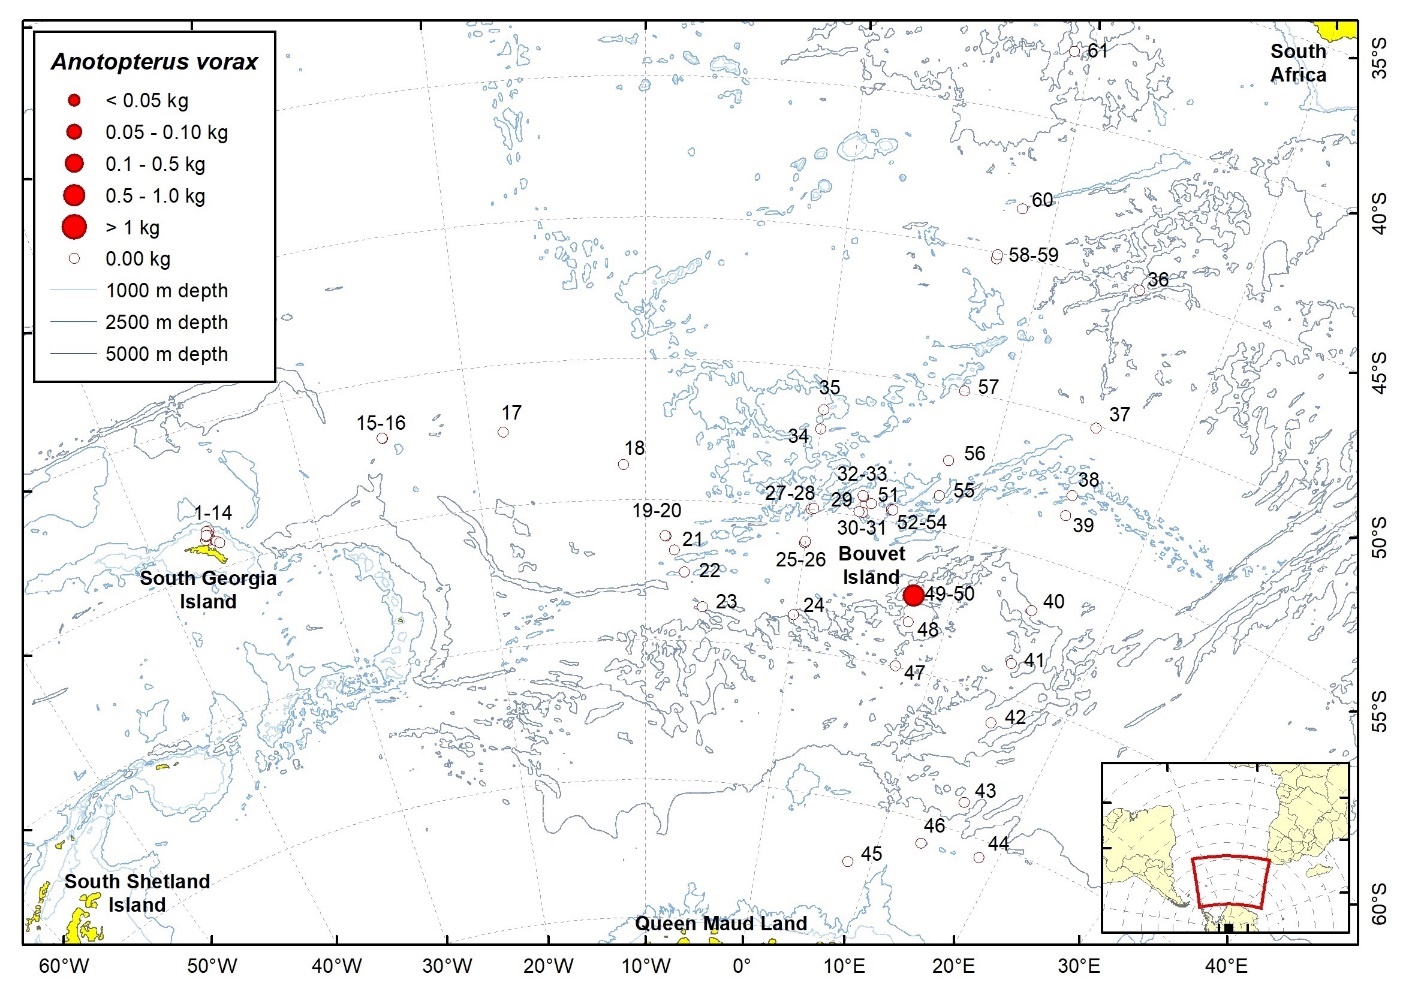
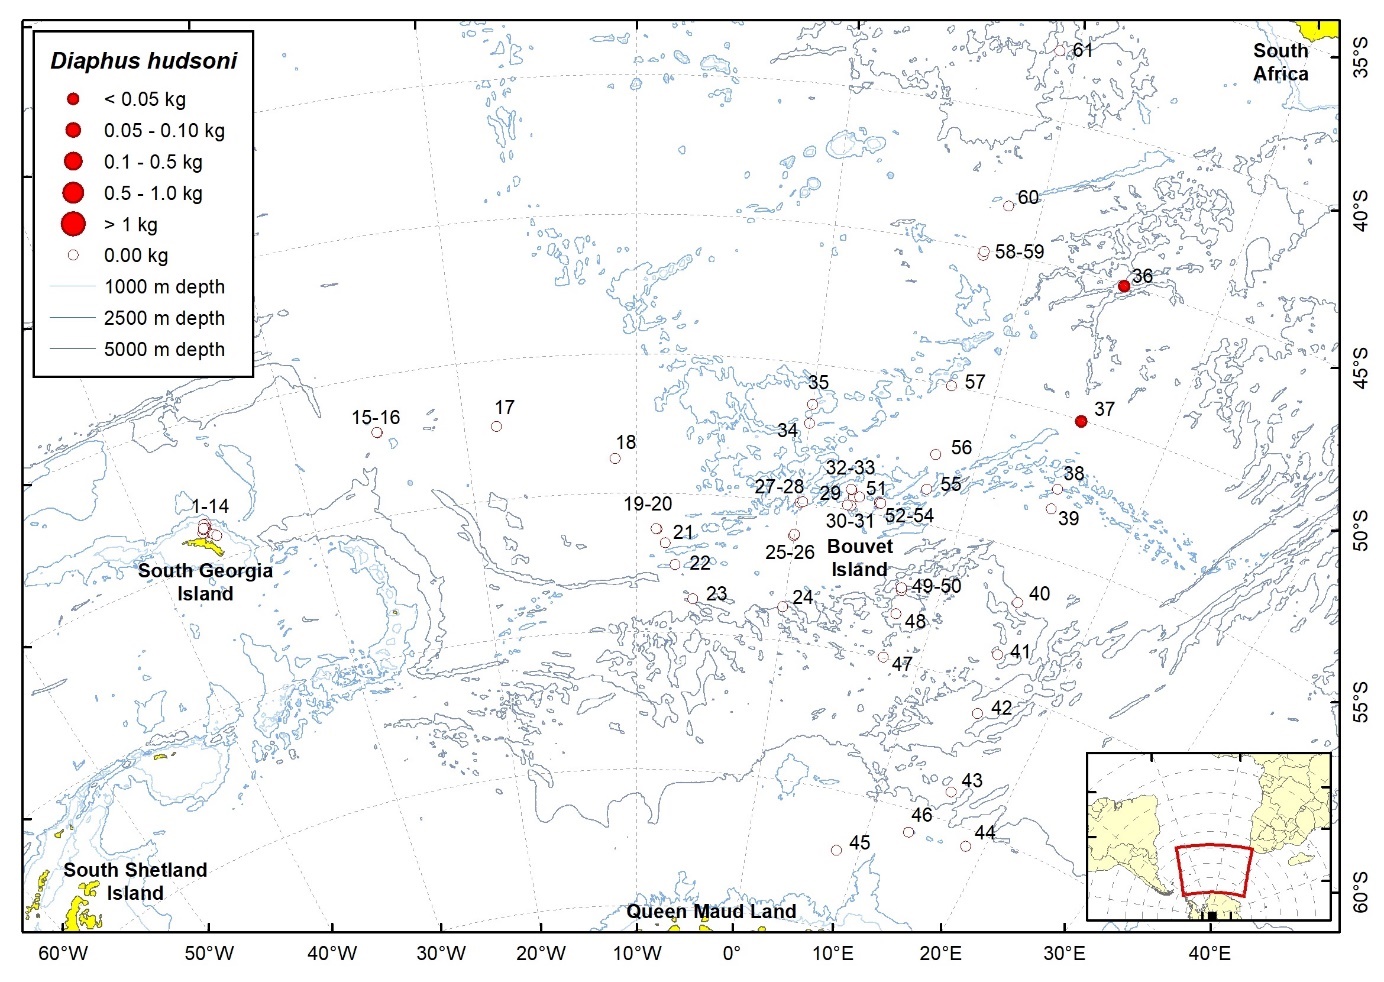
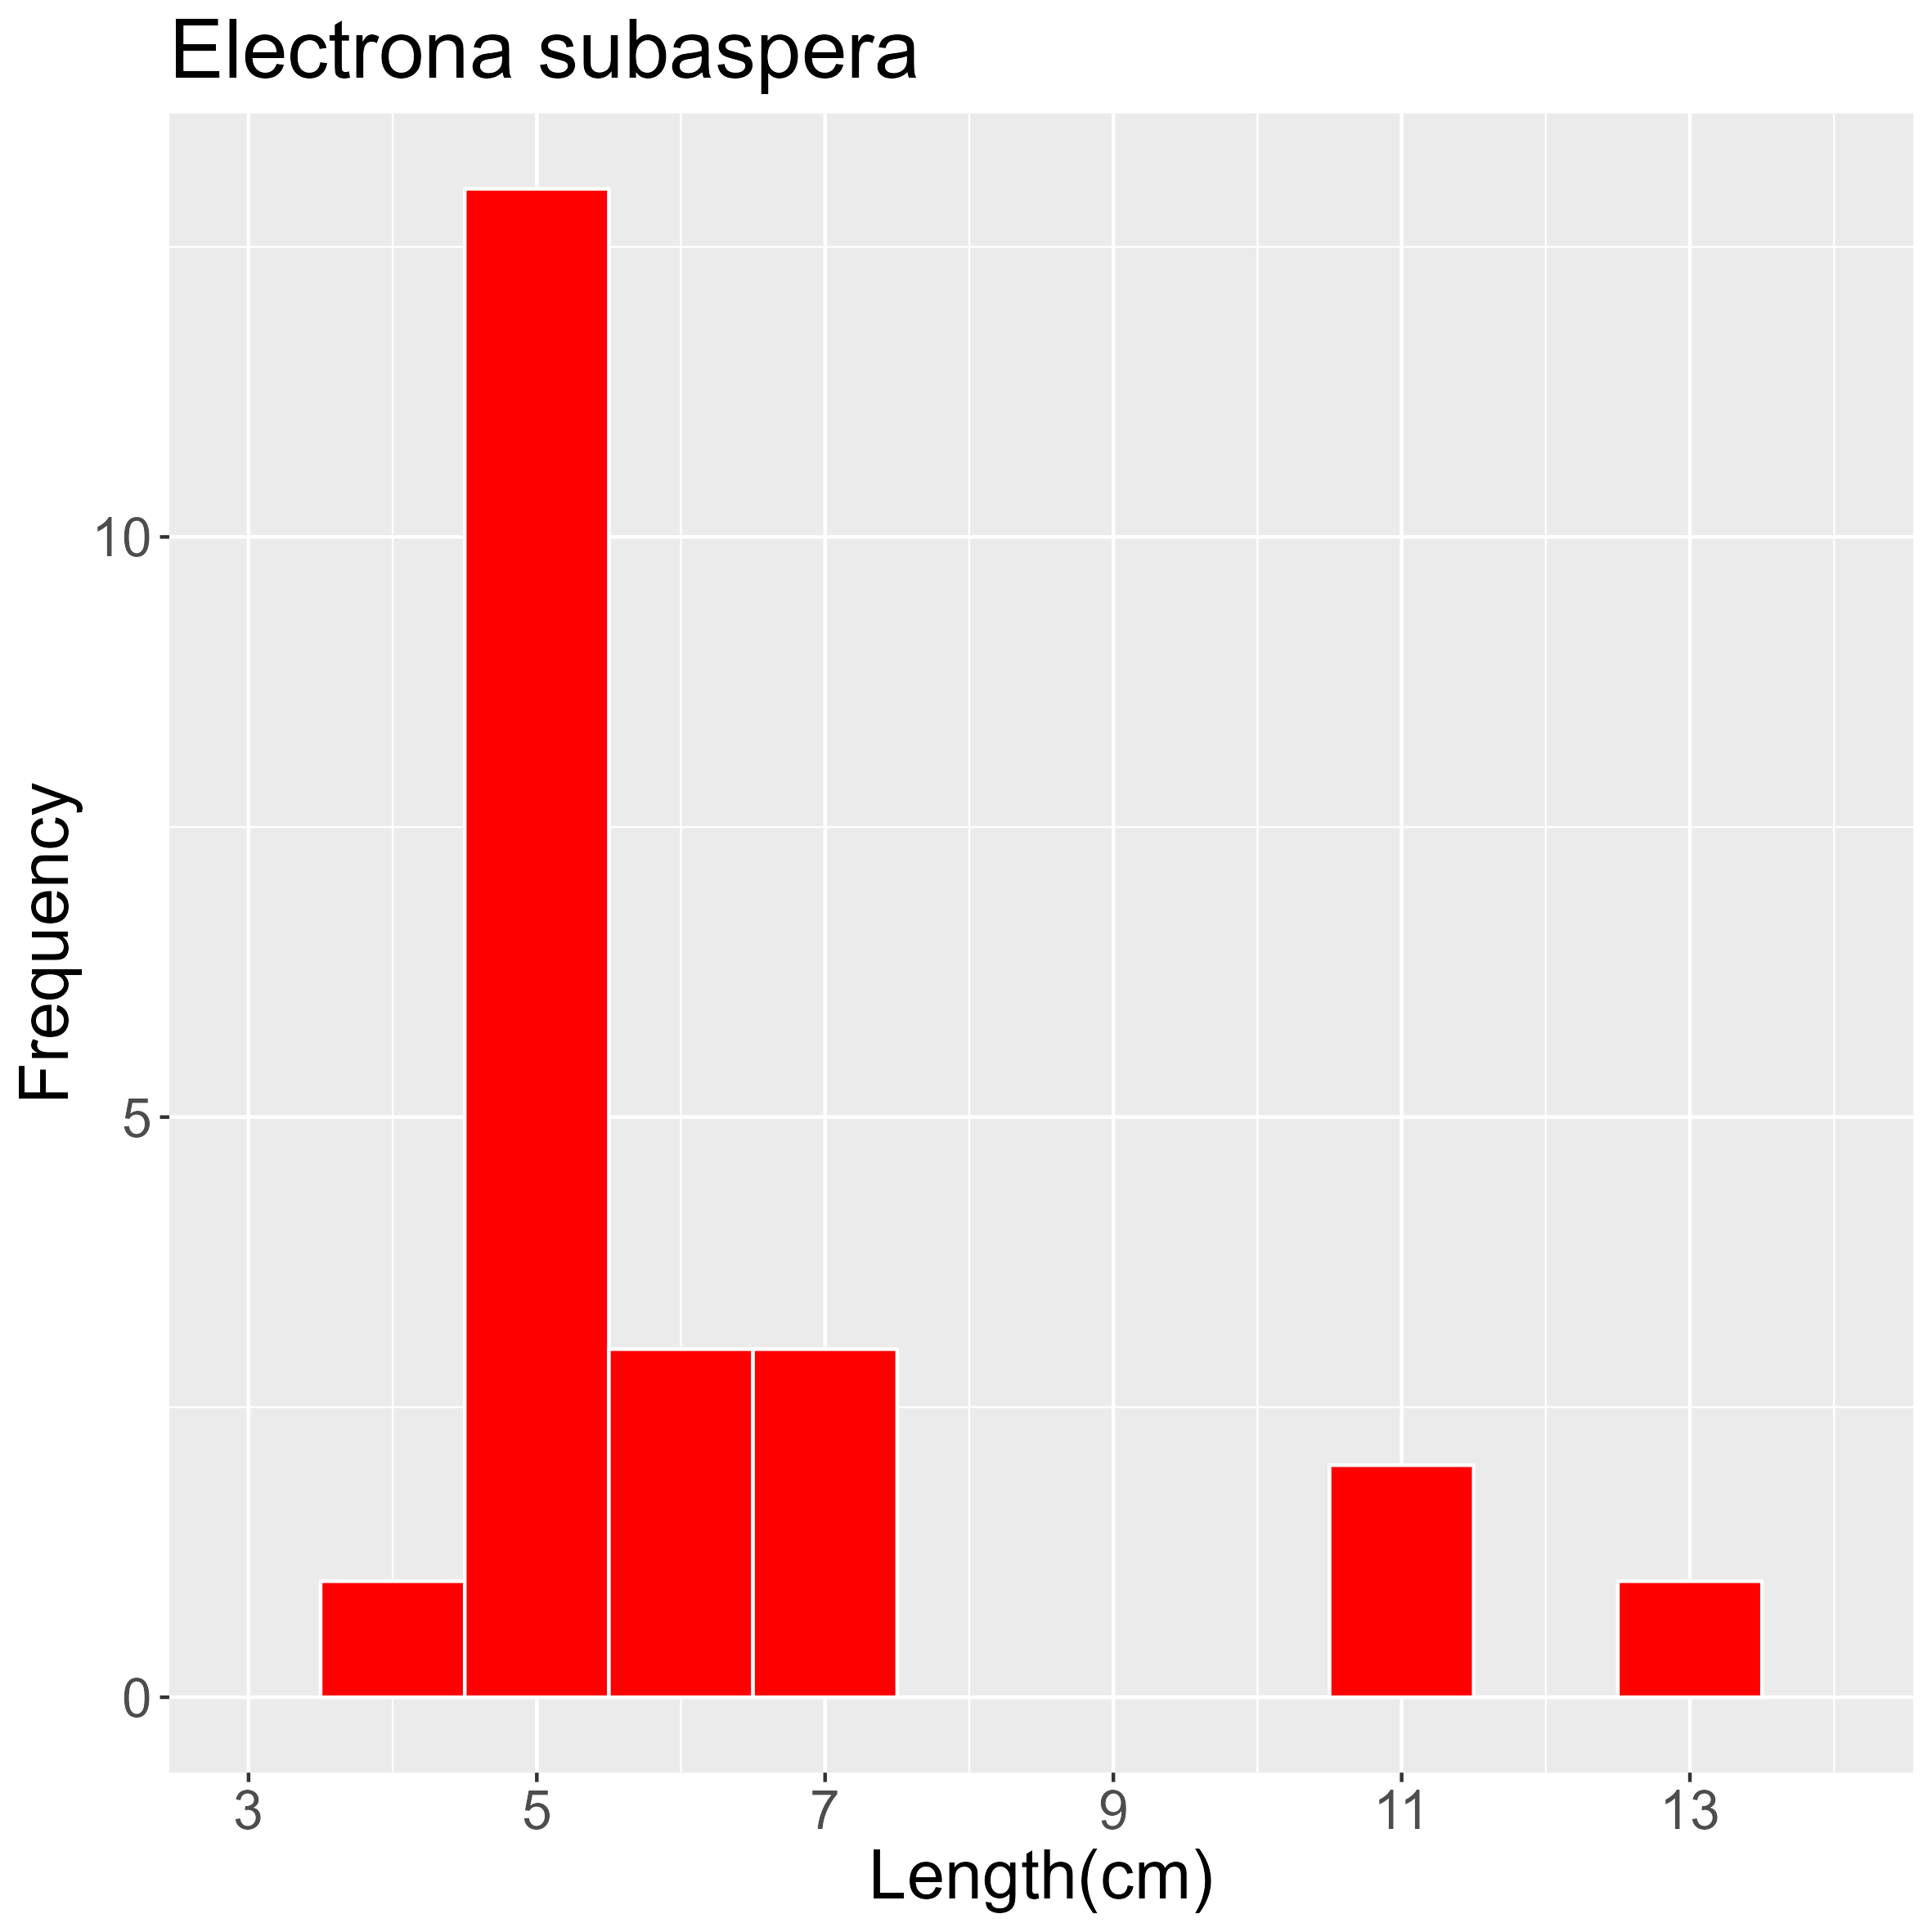
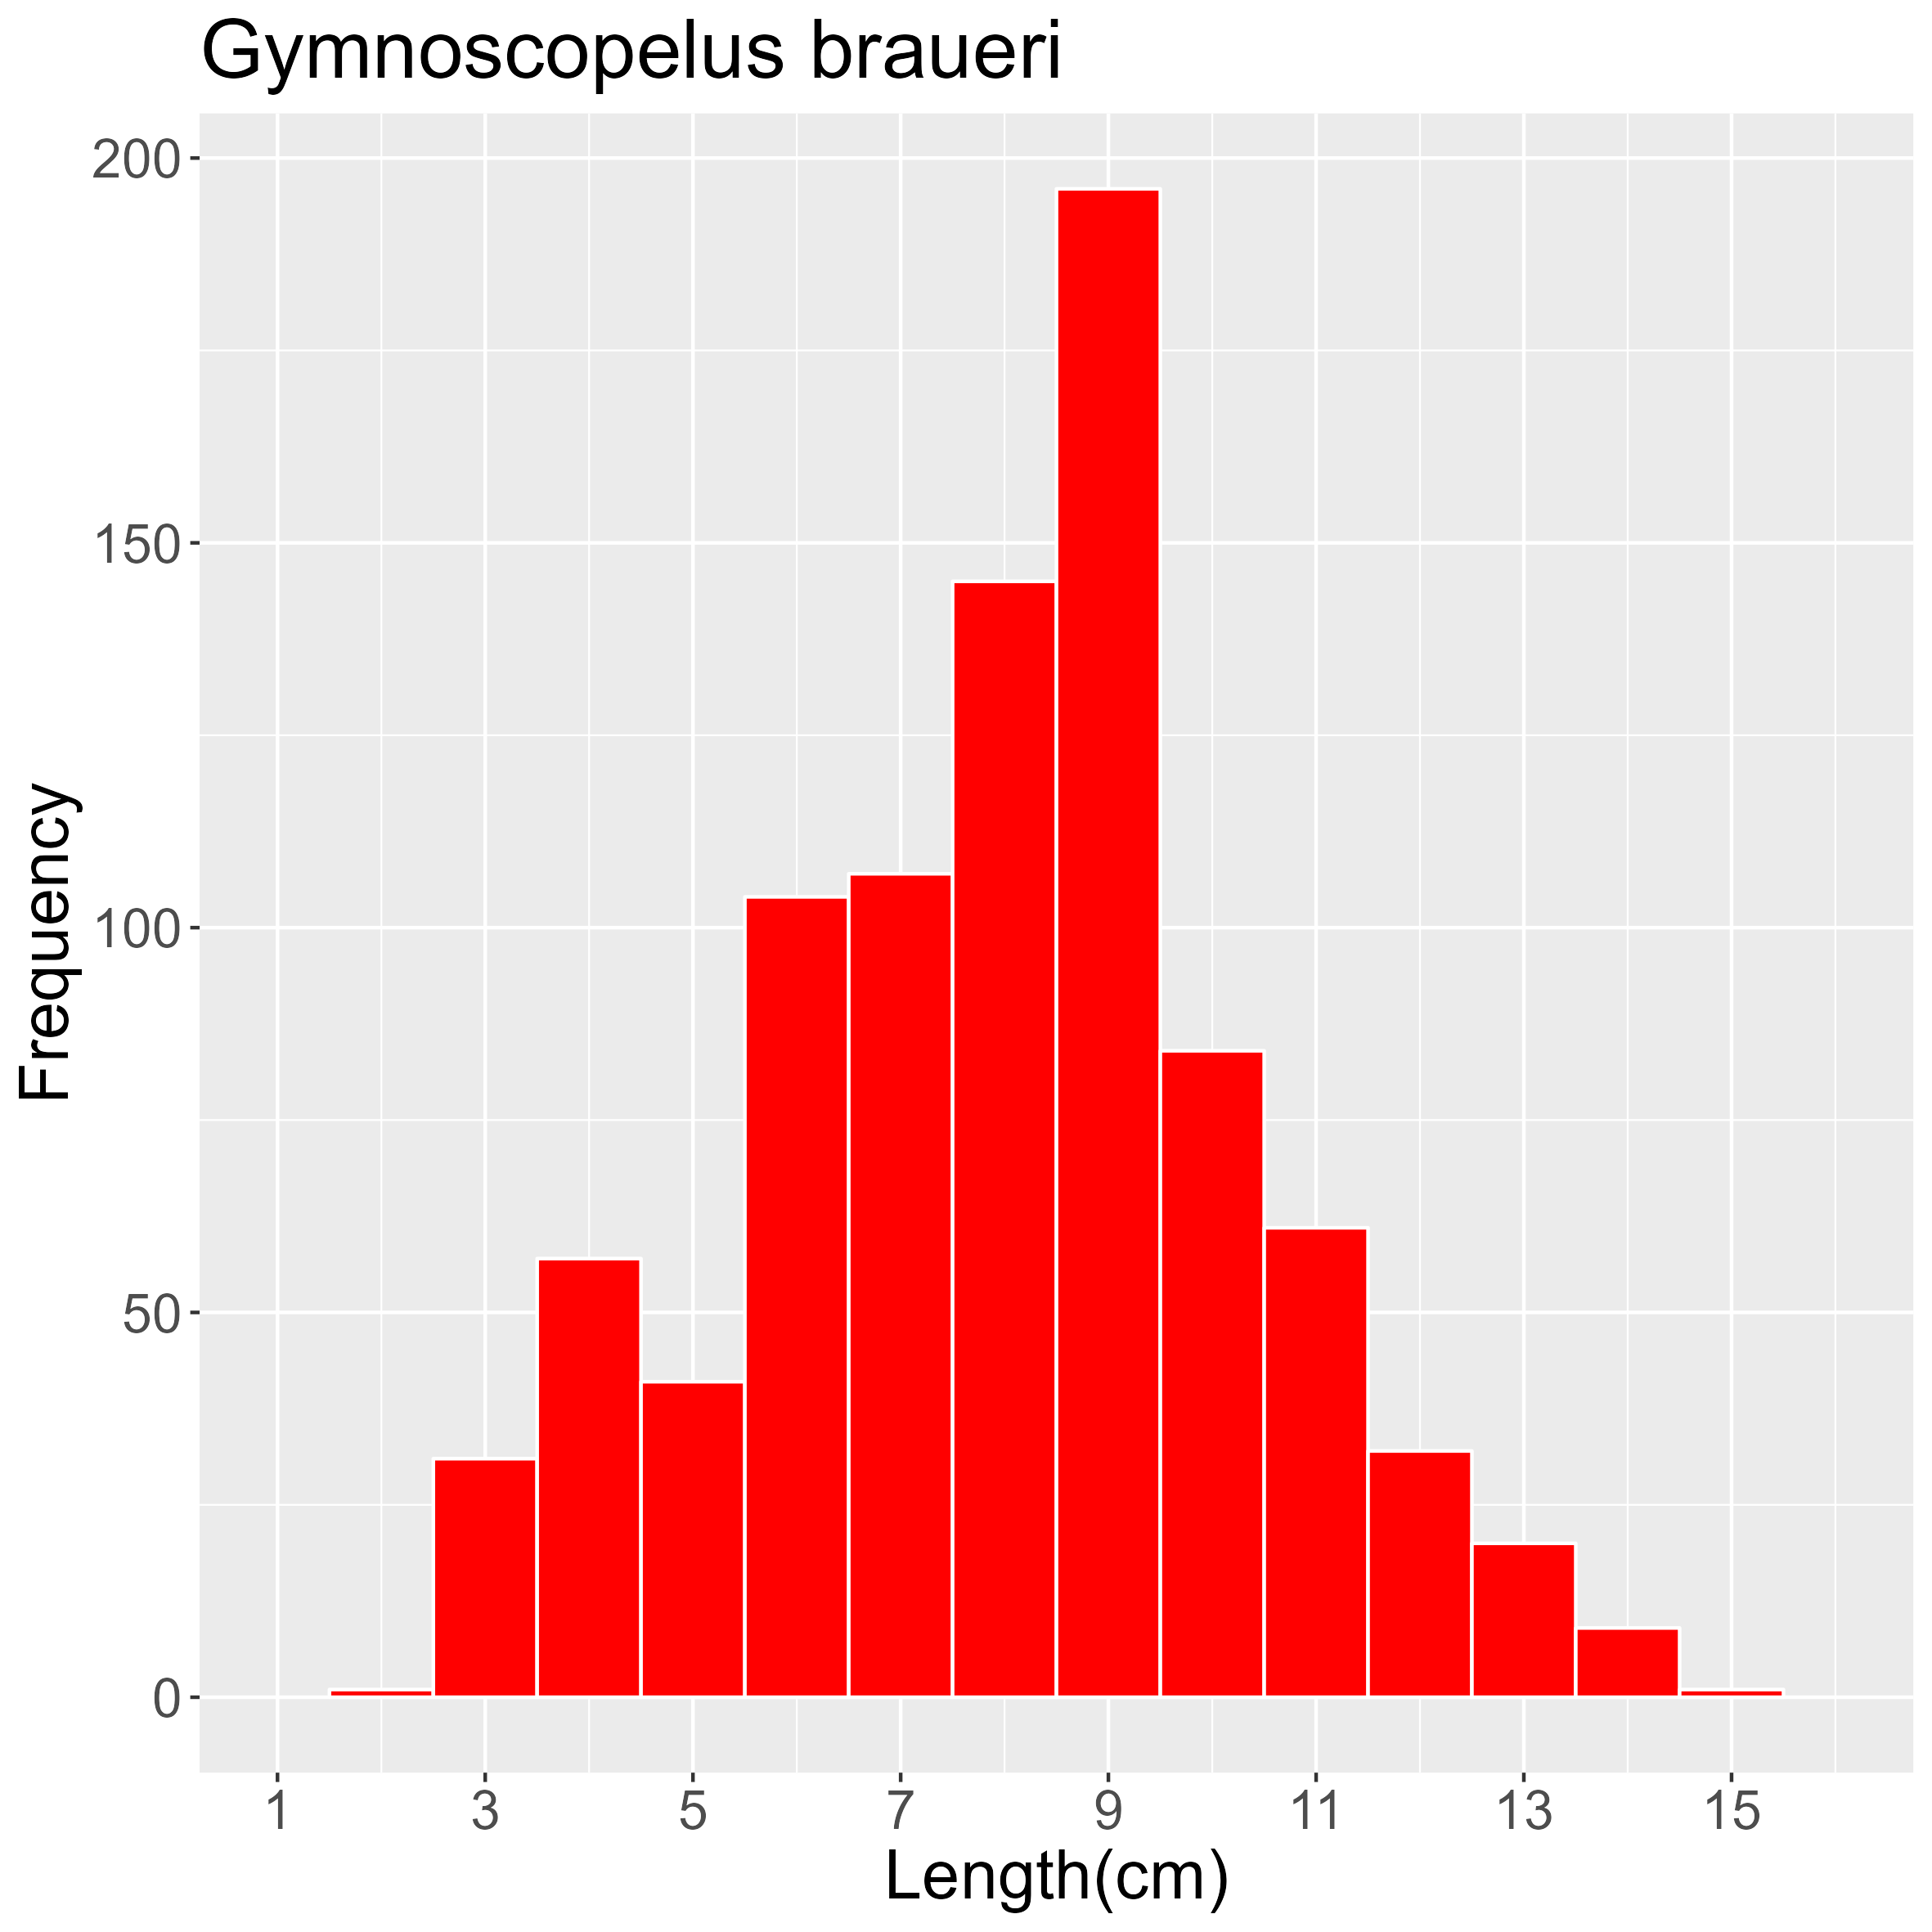
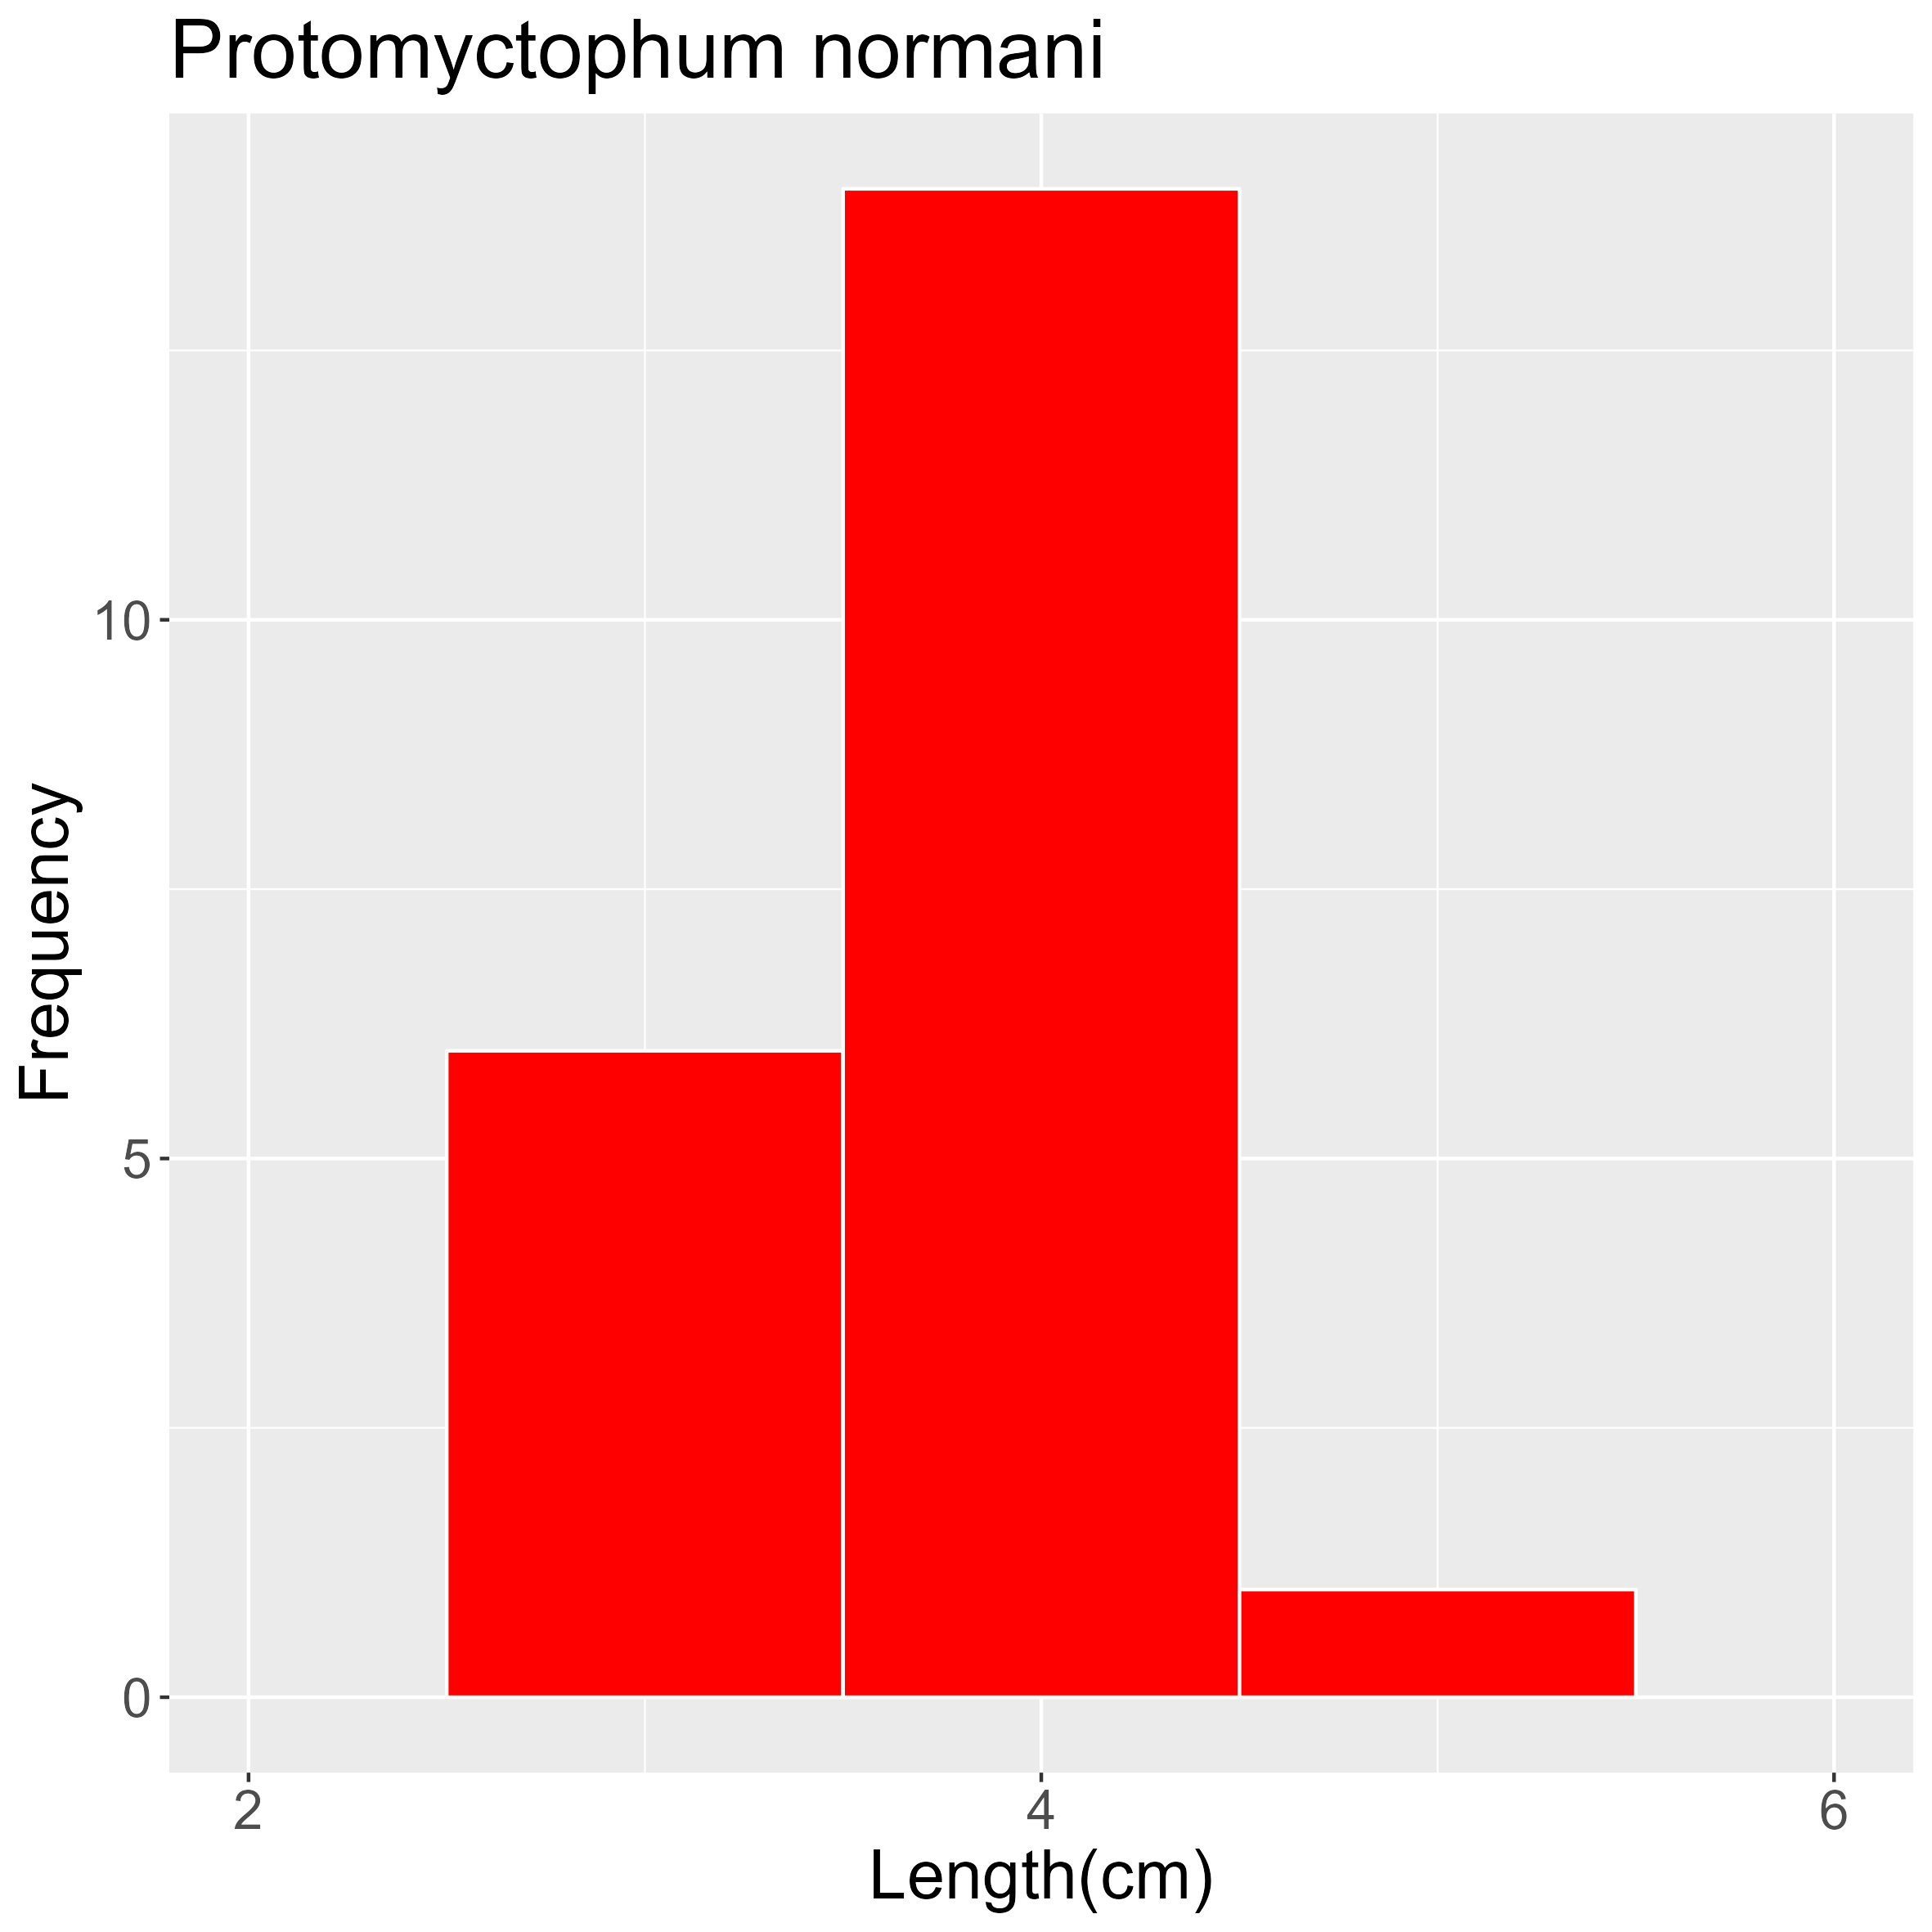
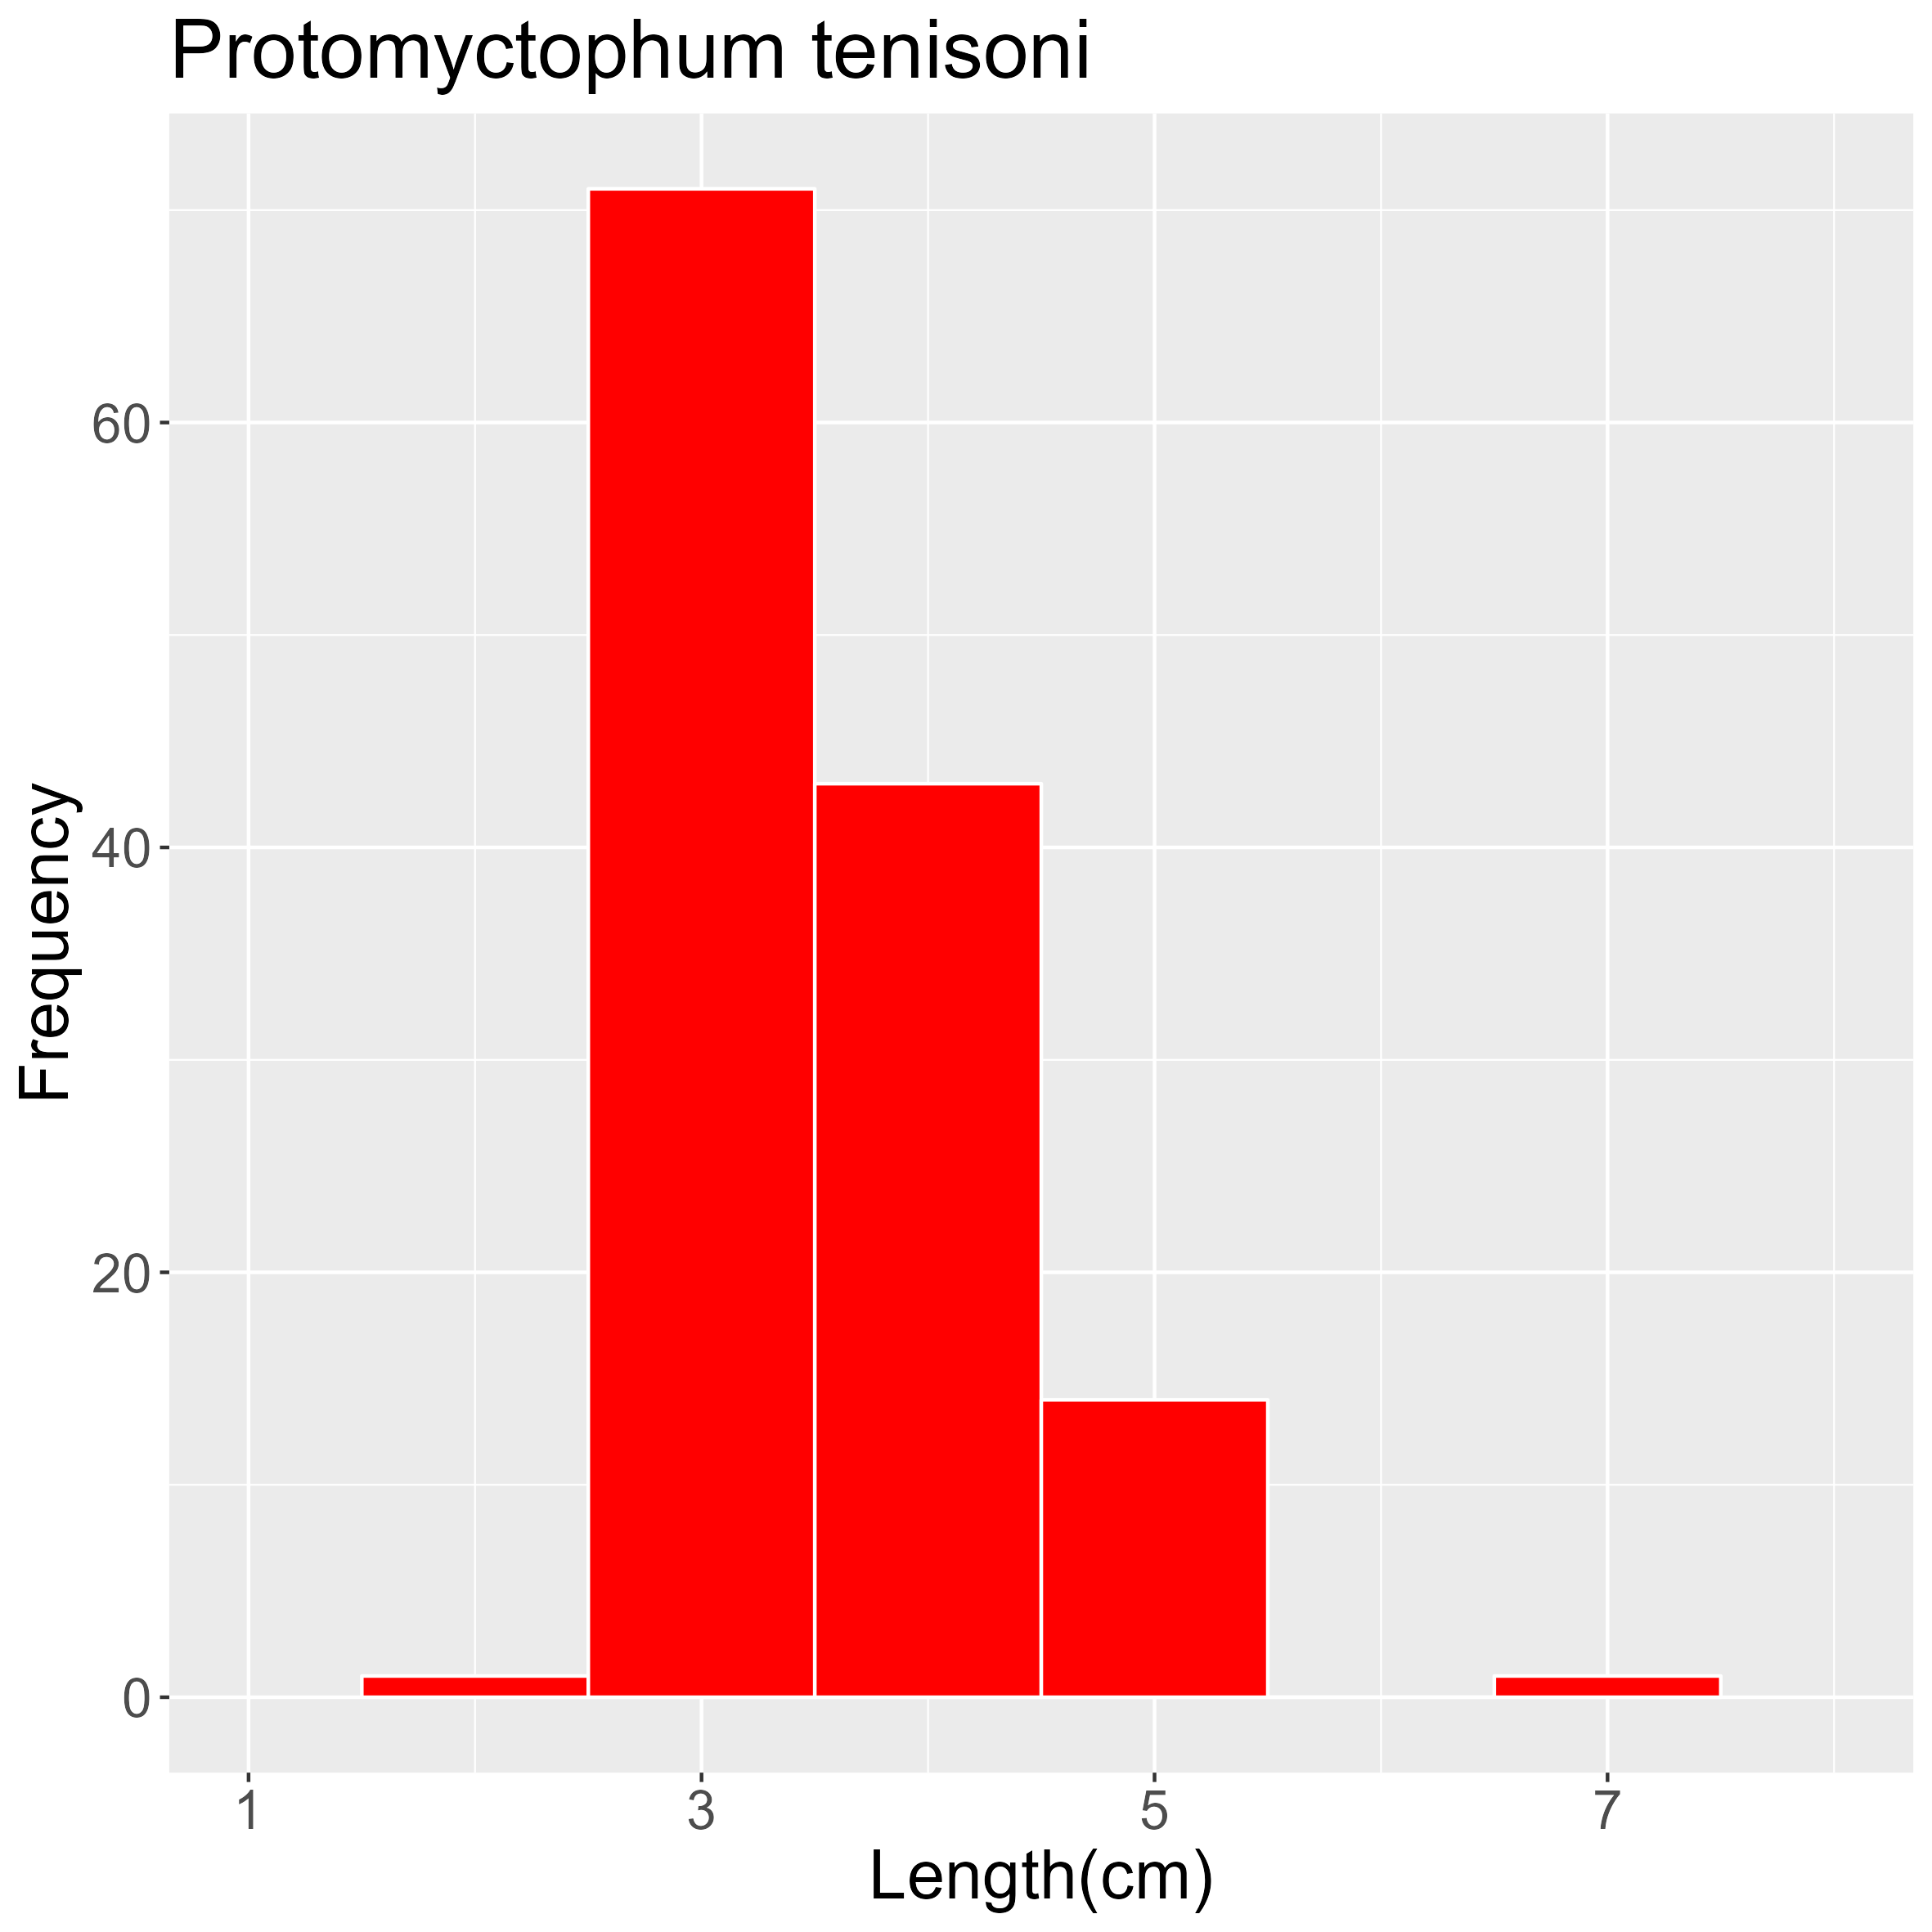
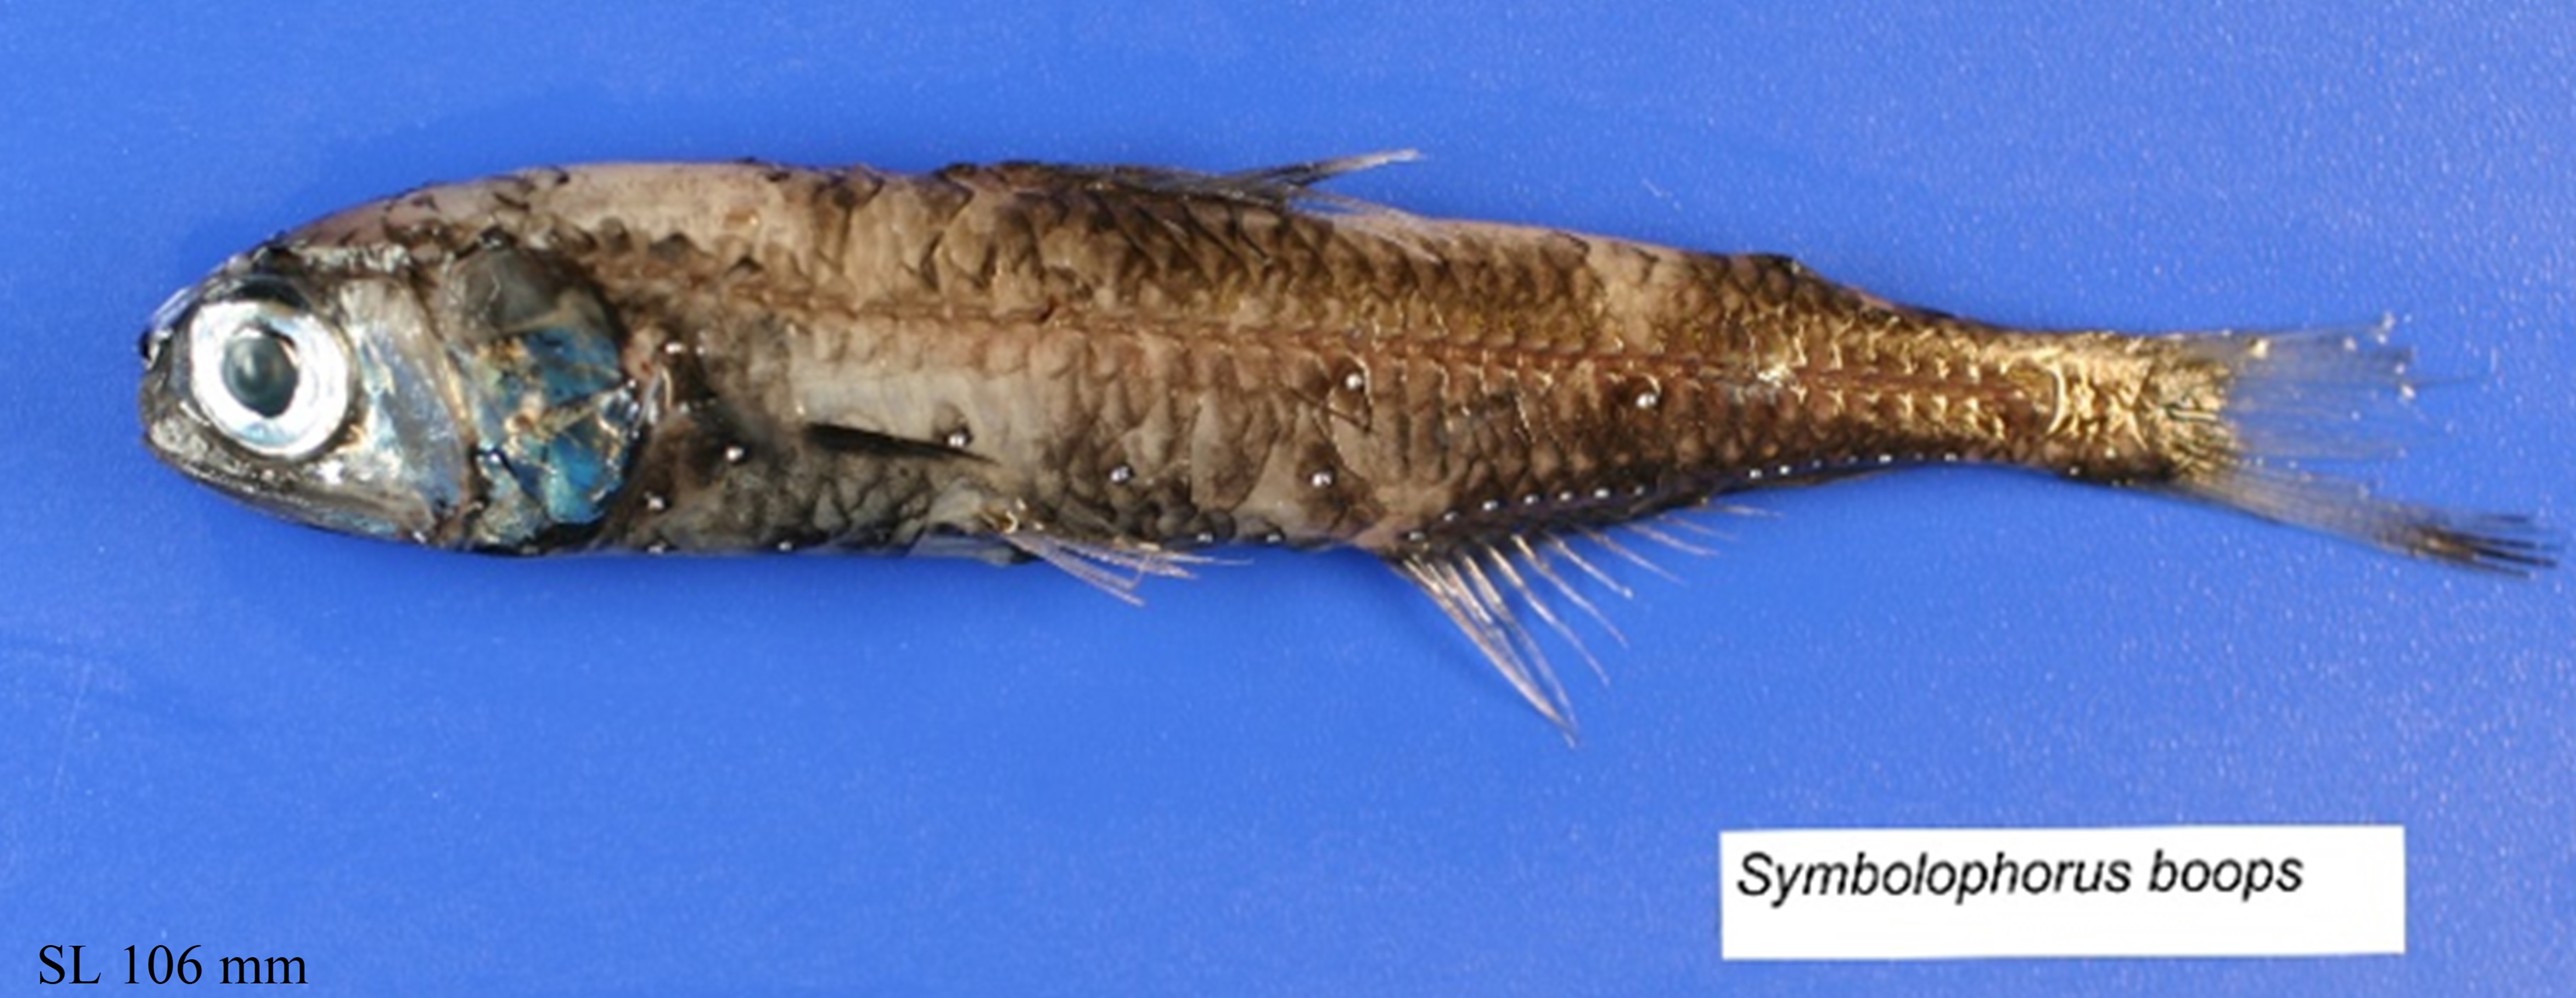
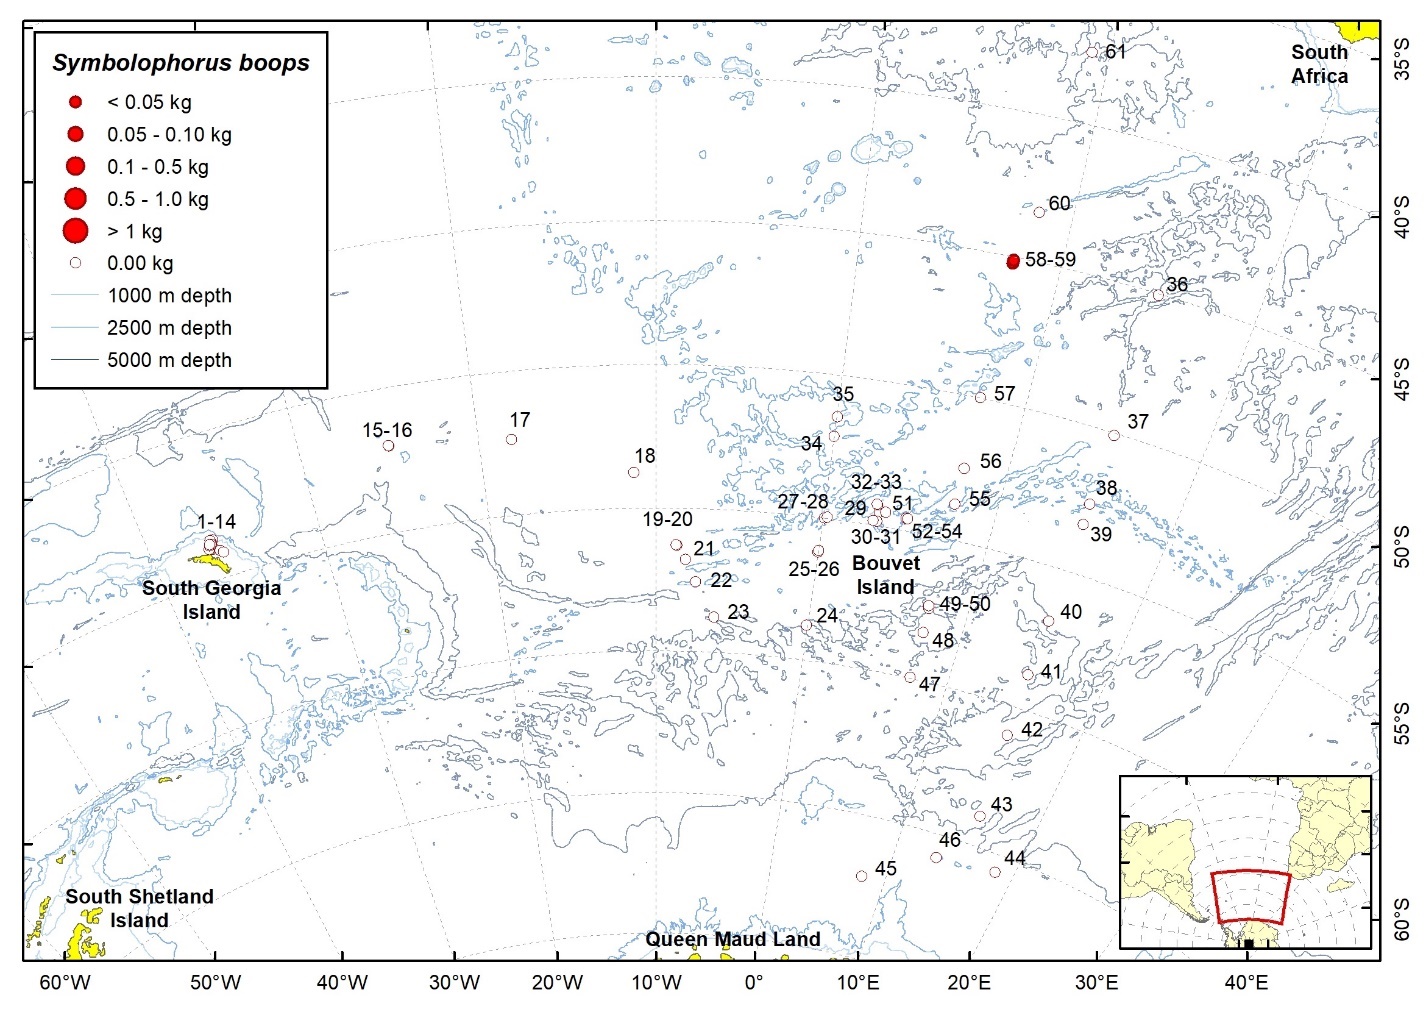
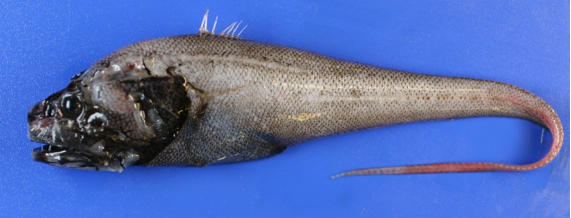
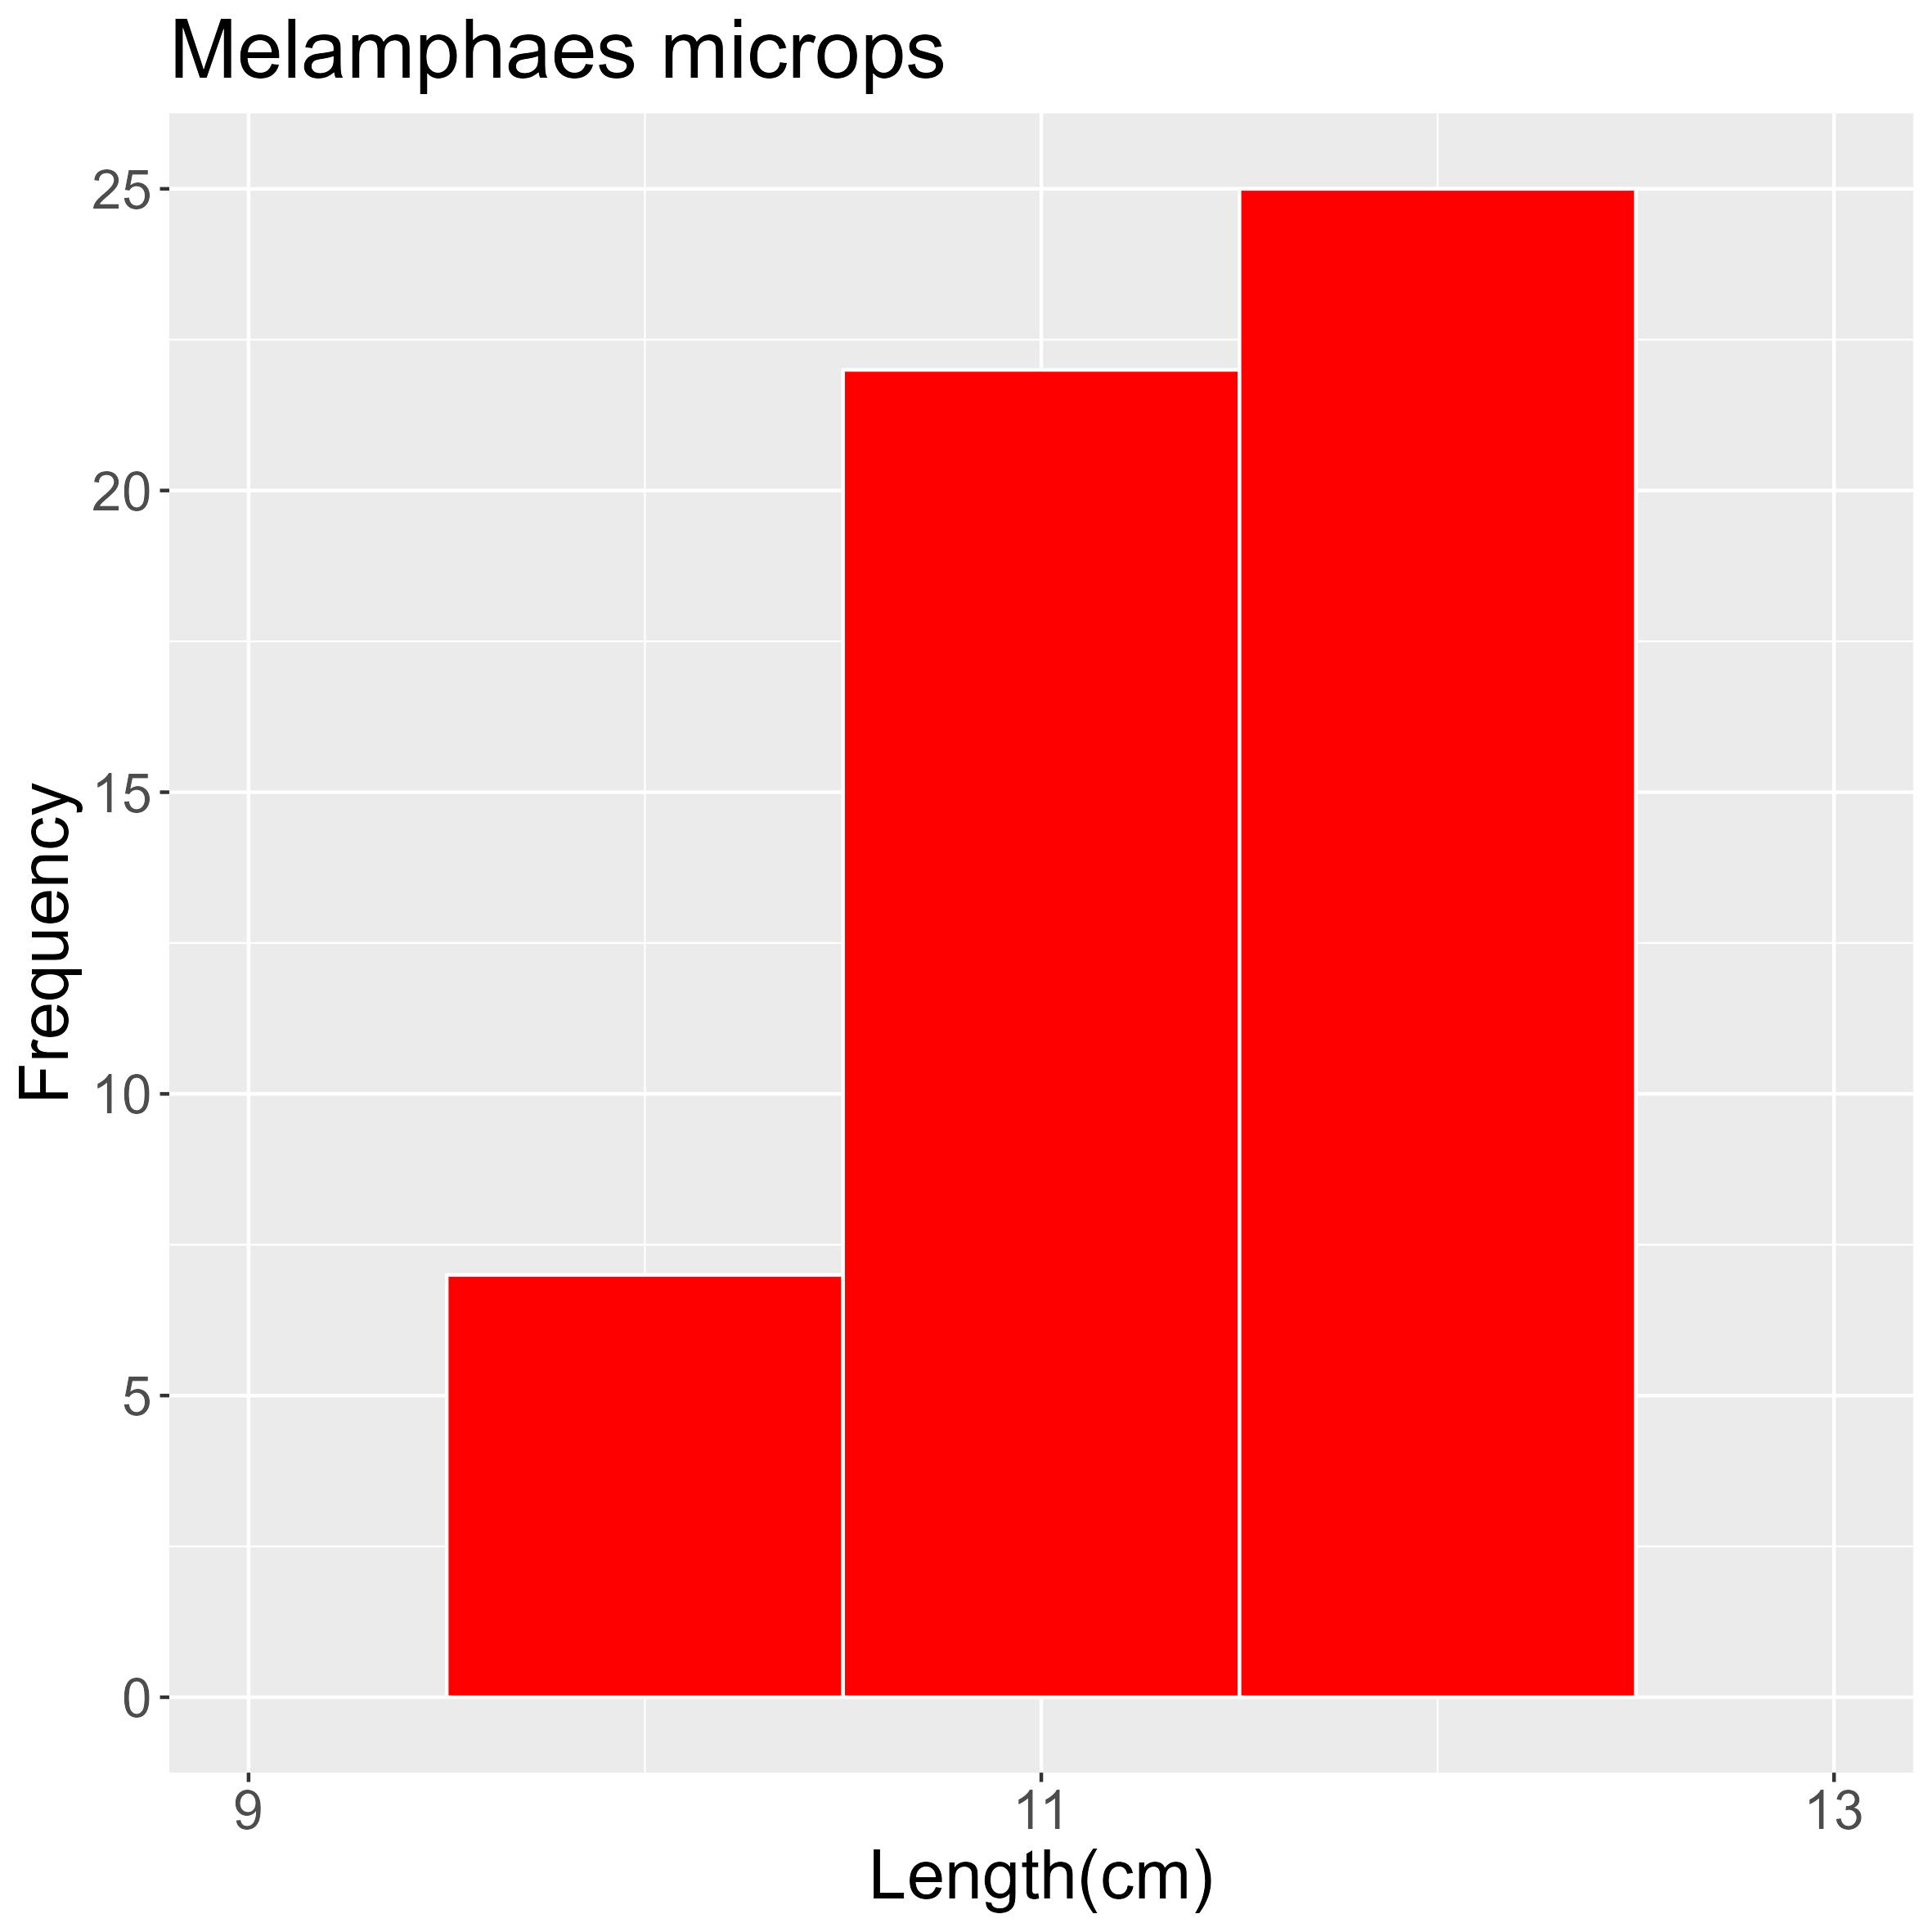
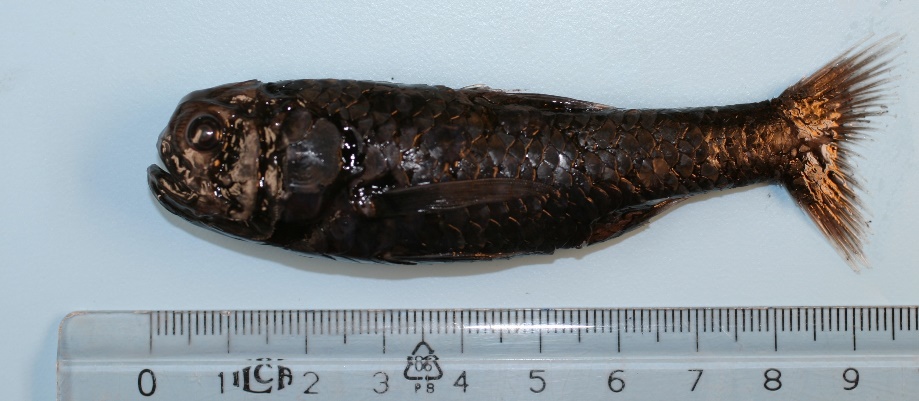
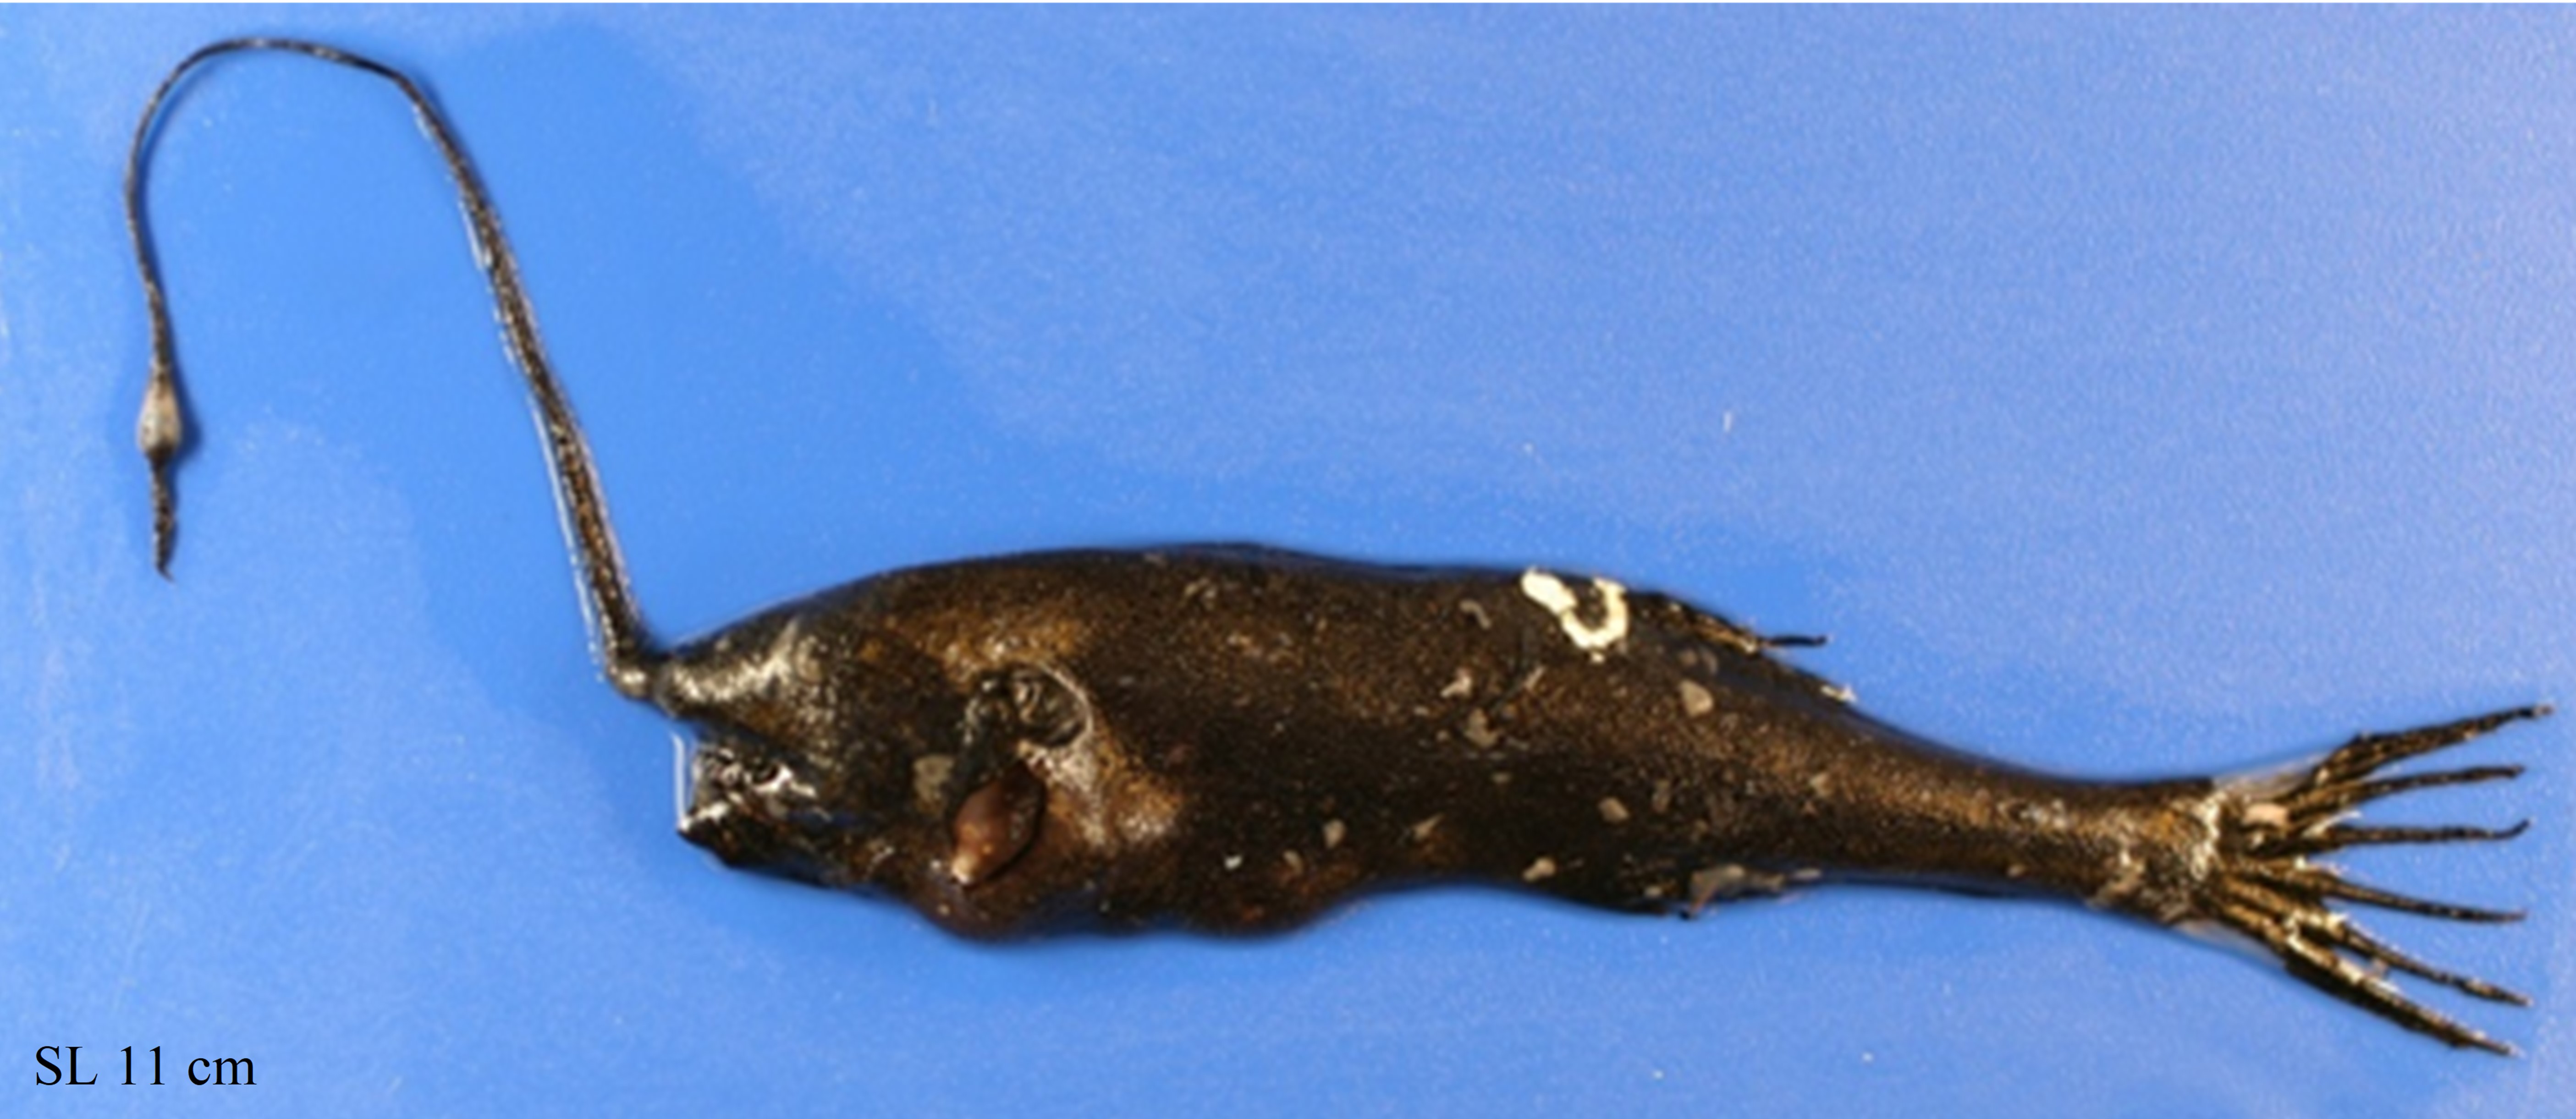
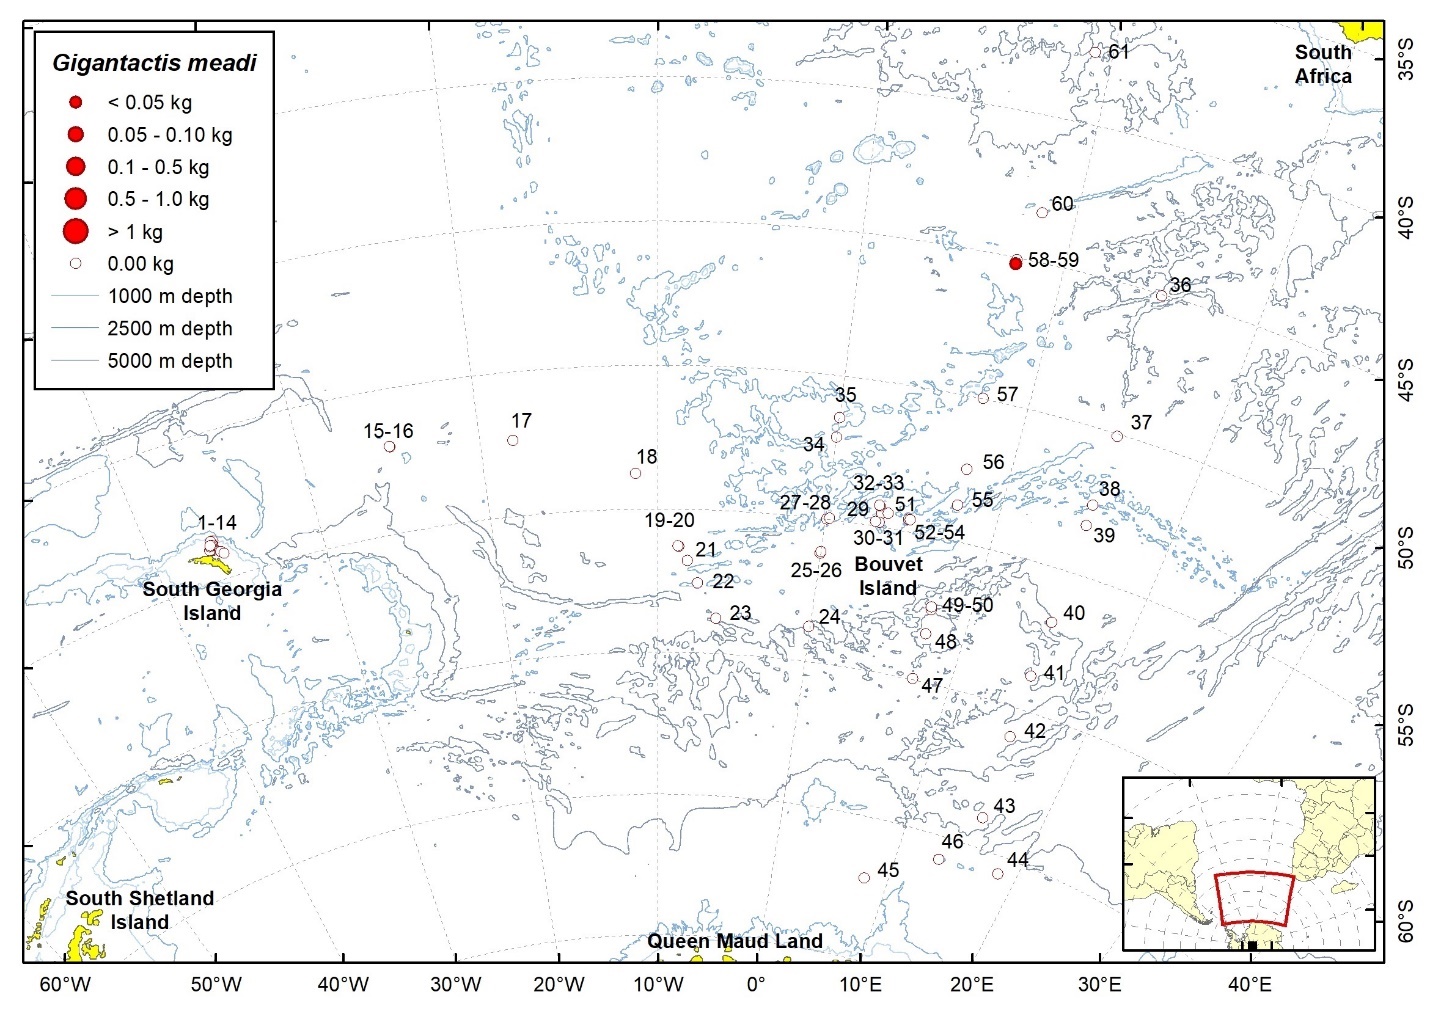
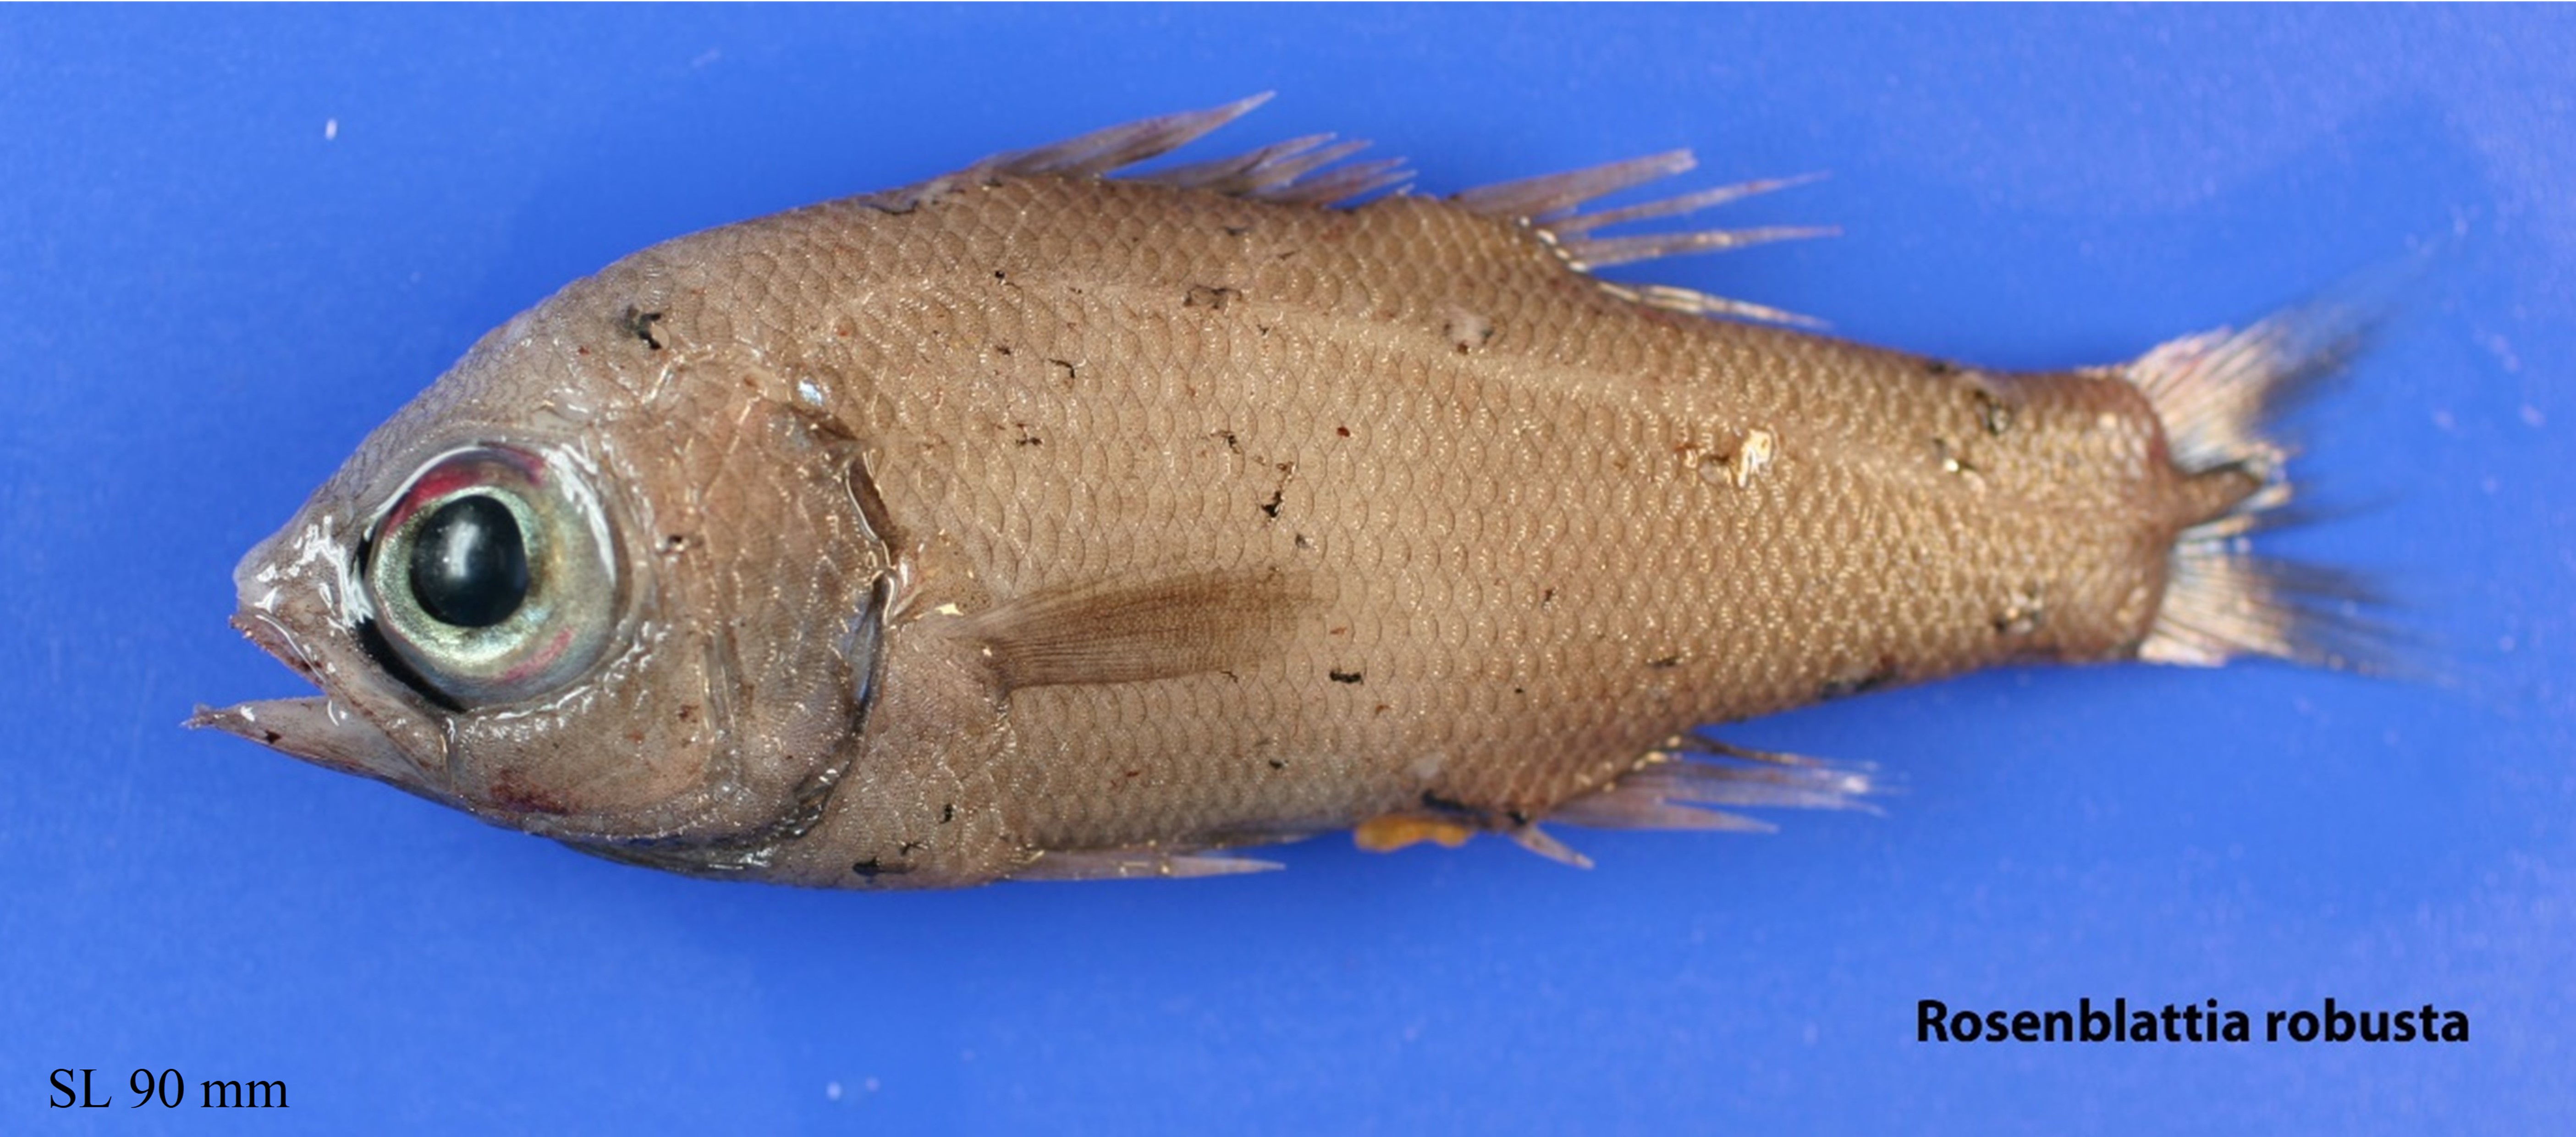
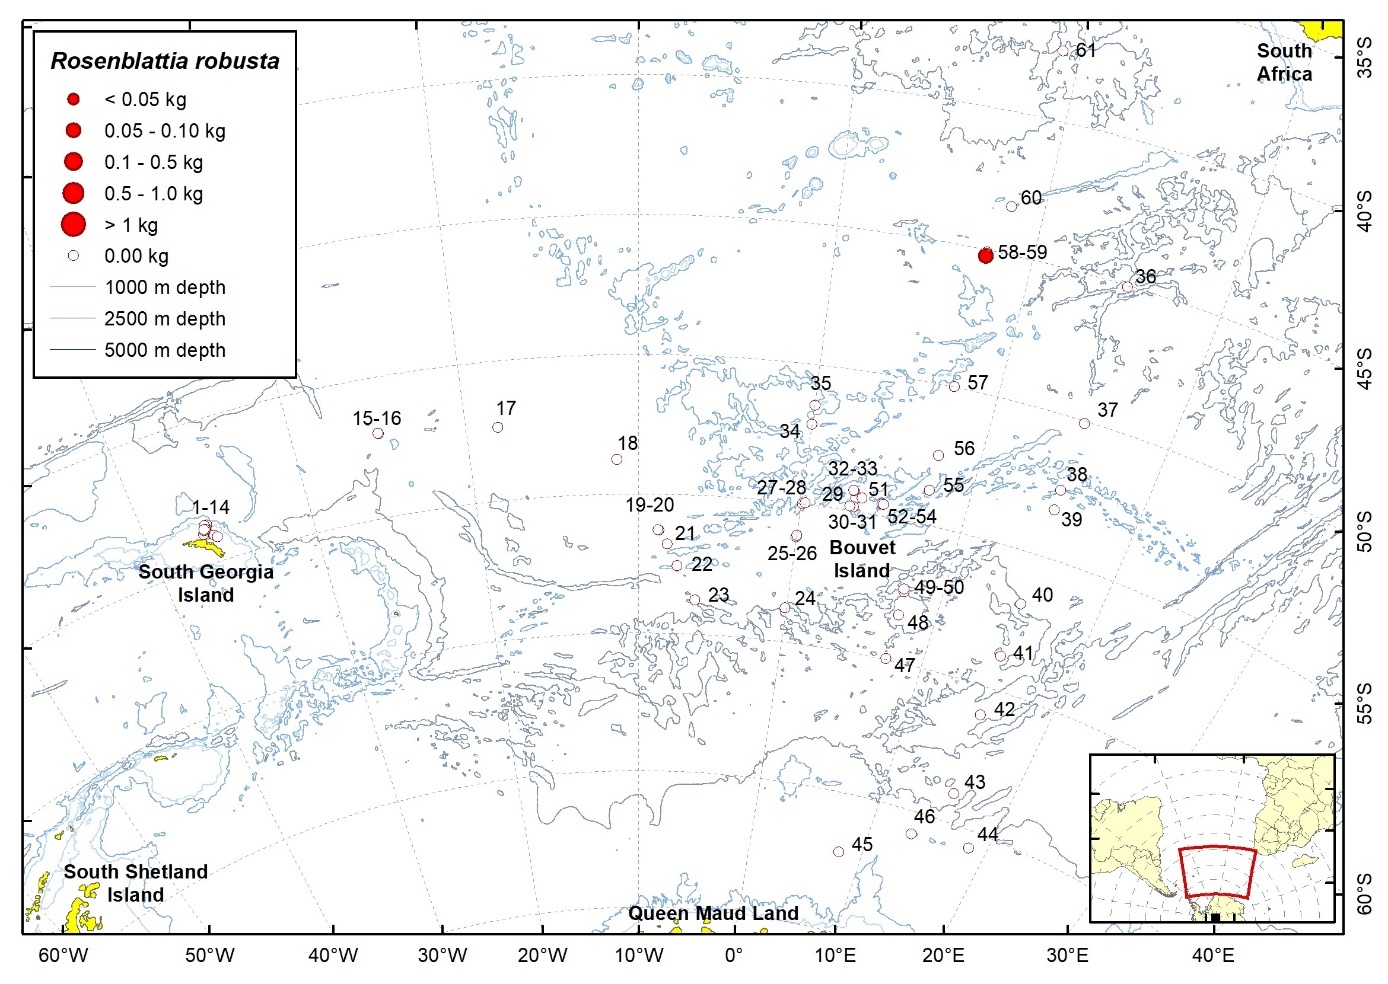
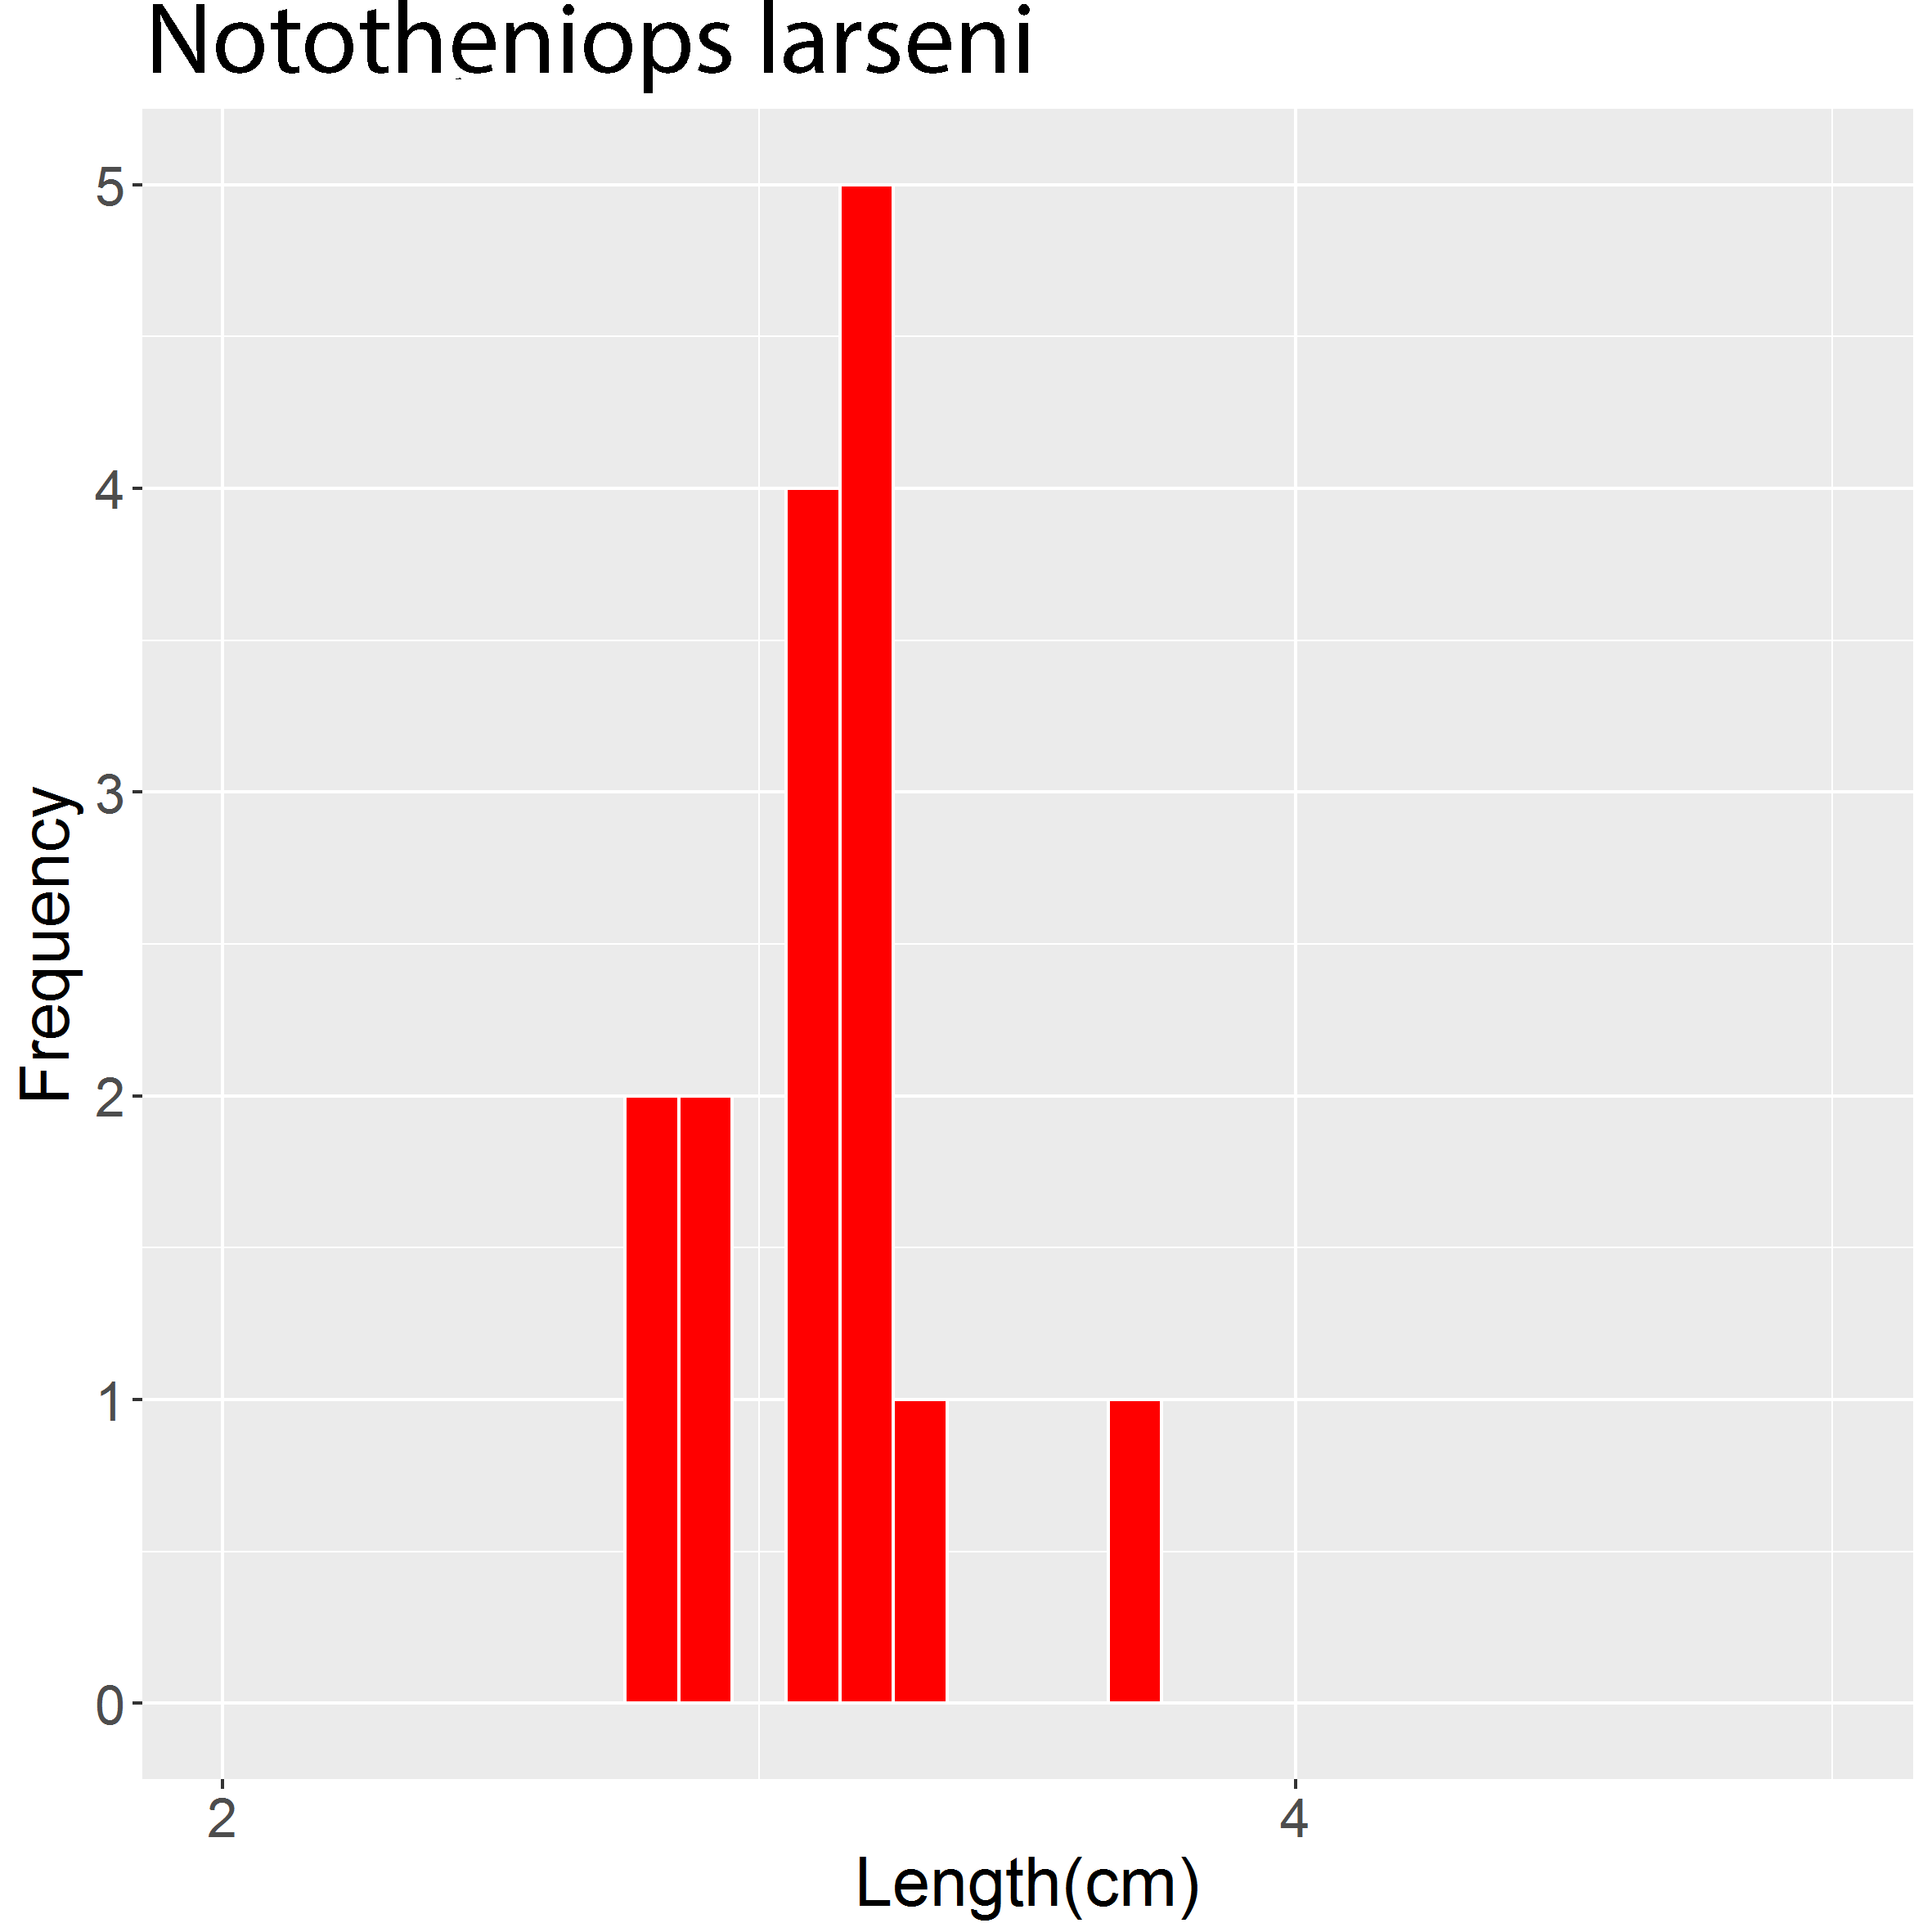
This report focuses on describing the results based on the fish that were sorted from the total catch where individuals were determined to the highest taxonomic level possible. Total weight per species and individual lengths were measured, following standard methodology described in Mjanger et al. (2007). Taxonomic identification was based on Gon & Heemstra (1990). In cases where taxonomic identification from the work carried out on board needed further validation; they were photographed and frozen for further onshore analyses. Each identified species or taxon is presented with an image, distribution map, station information (including number of specimens, weight (W), total catch weight of fish (TW fish) and total weight of catch (TW catch)), and for the most abundant species a length histogram. Lengths of fish are normally measured as total length (TL) from tip of snout to the end of the caudal fin ("untouched") or as standard length (SL) from tip of snout to the posterior end of the last vertebra. Validity of scientific names was checked with Fricke et al. (2020), systematic order is according to van der Laan et al. (2020), and English common names according to Froese & Pauly (2019).
2 - List of species account
2.1 - Nemichthyidae
2.1.1 - Avocettina paucipora Nielsen & Smith, 1978
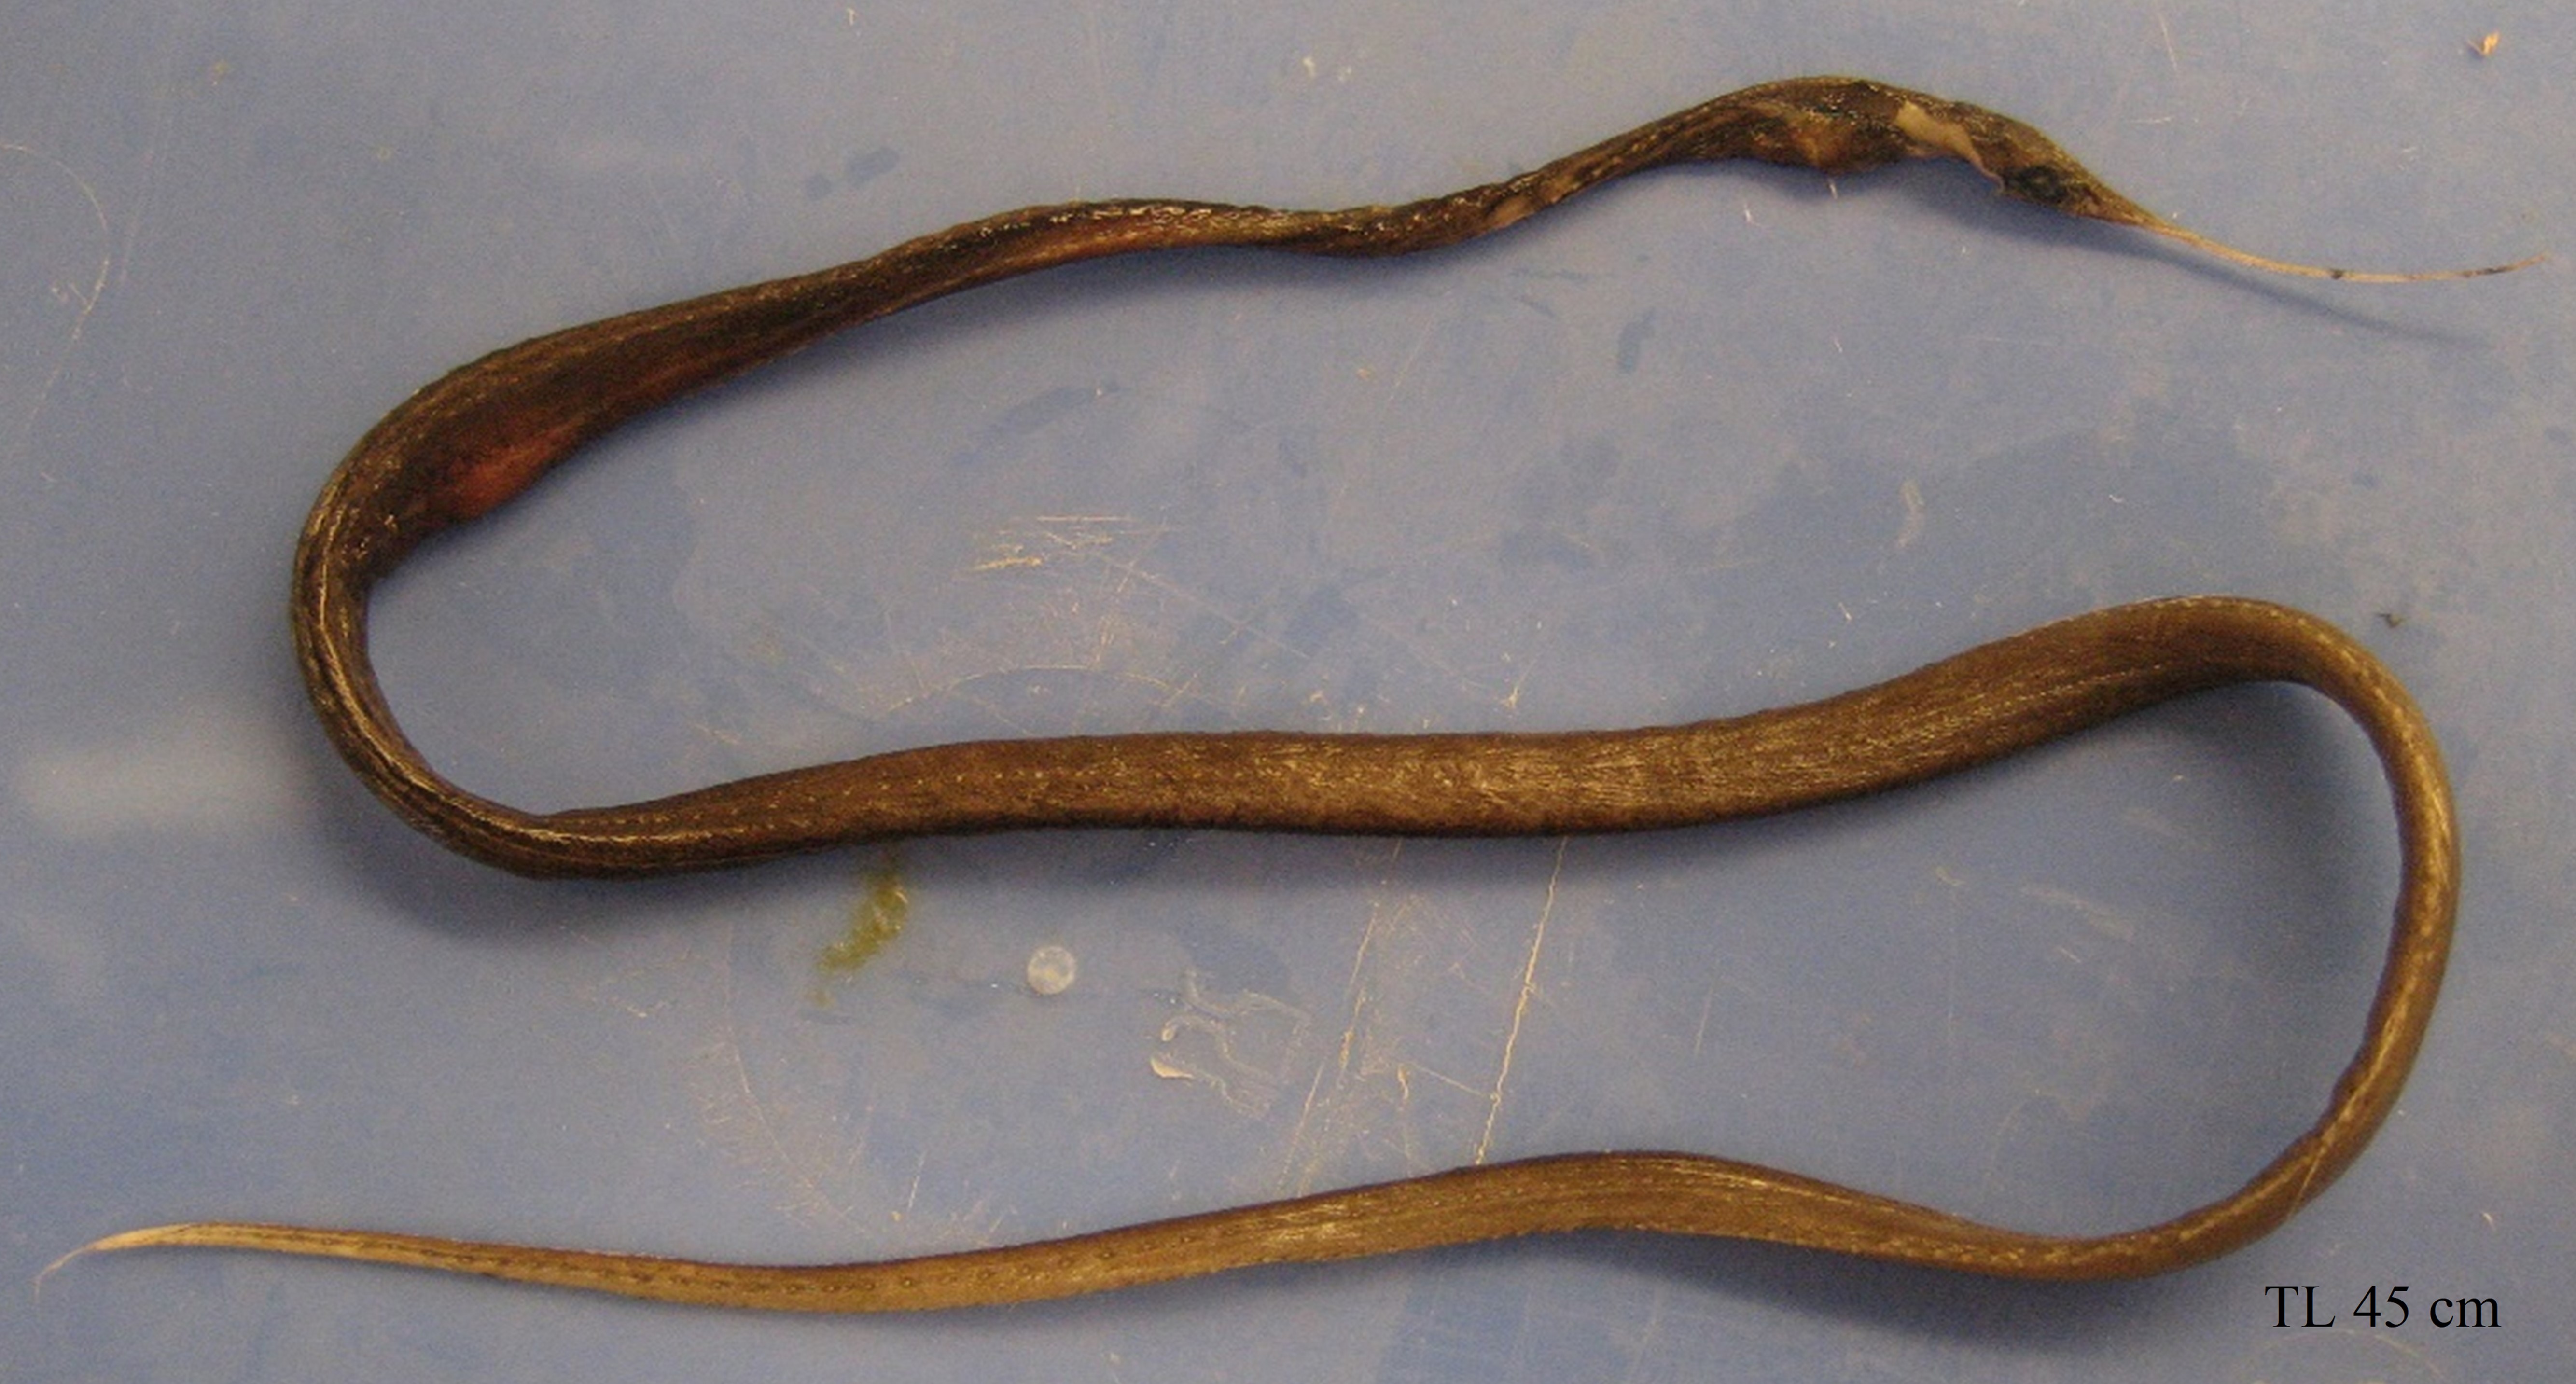
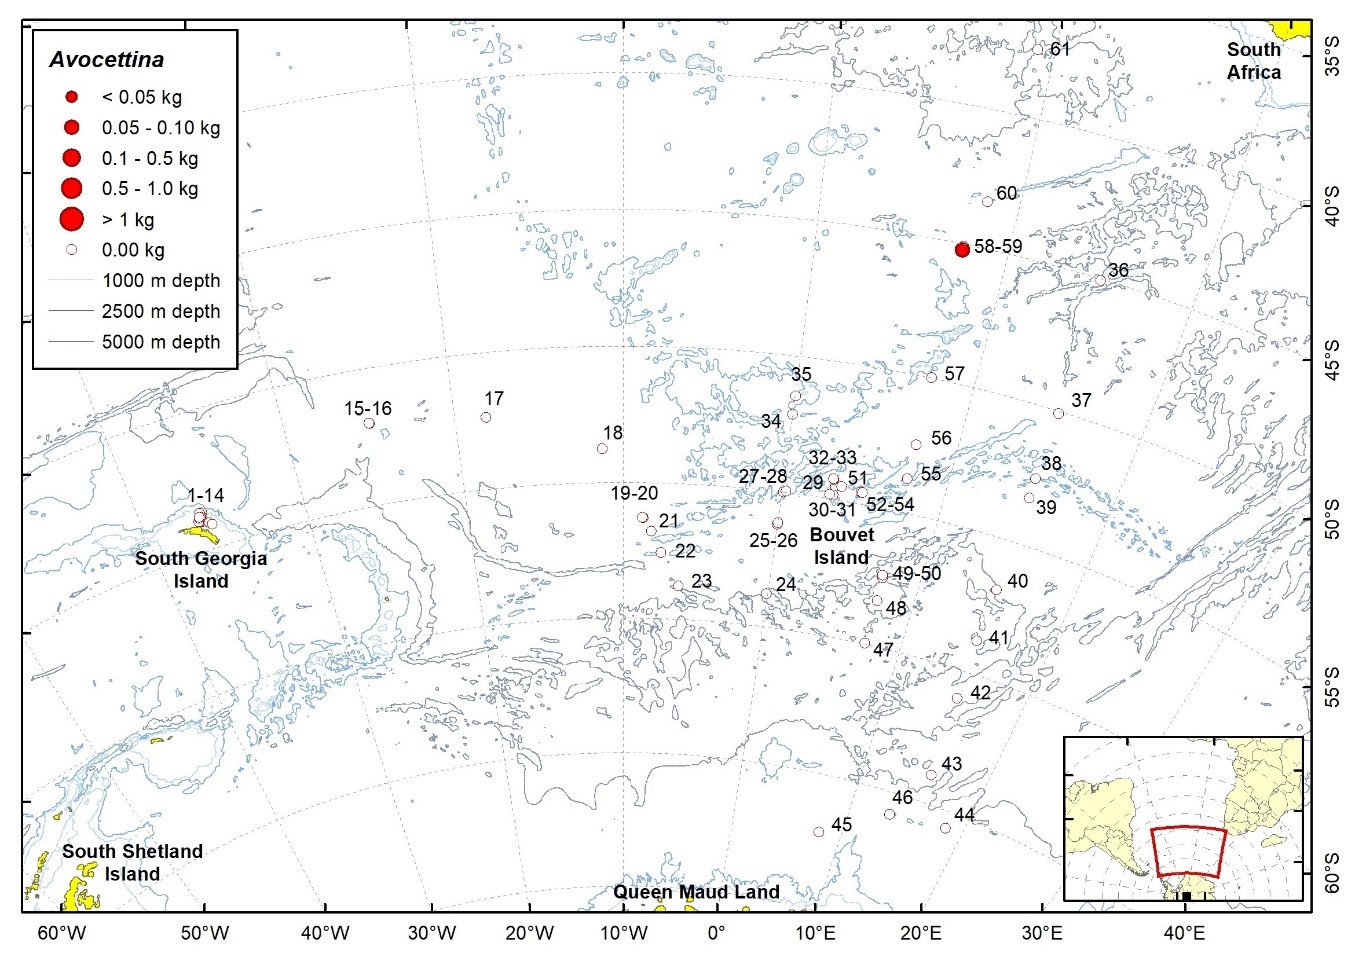
| Station | Date | Latitude | Longitude | Ind. caught | W (g) | TW fish (kg) | TW catch (kg) | ||
| 58 | 17.03.2008 | 45,20 | S | 7,65 | E | 2 | 92,0 | 10,17 | 19,92 |
2.2 - Serrivomeridae
2.2.1 - Serrivomer beanii

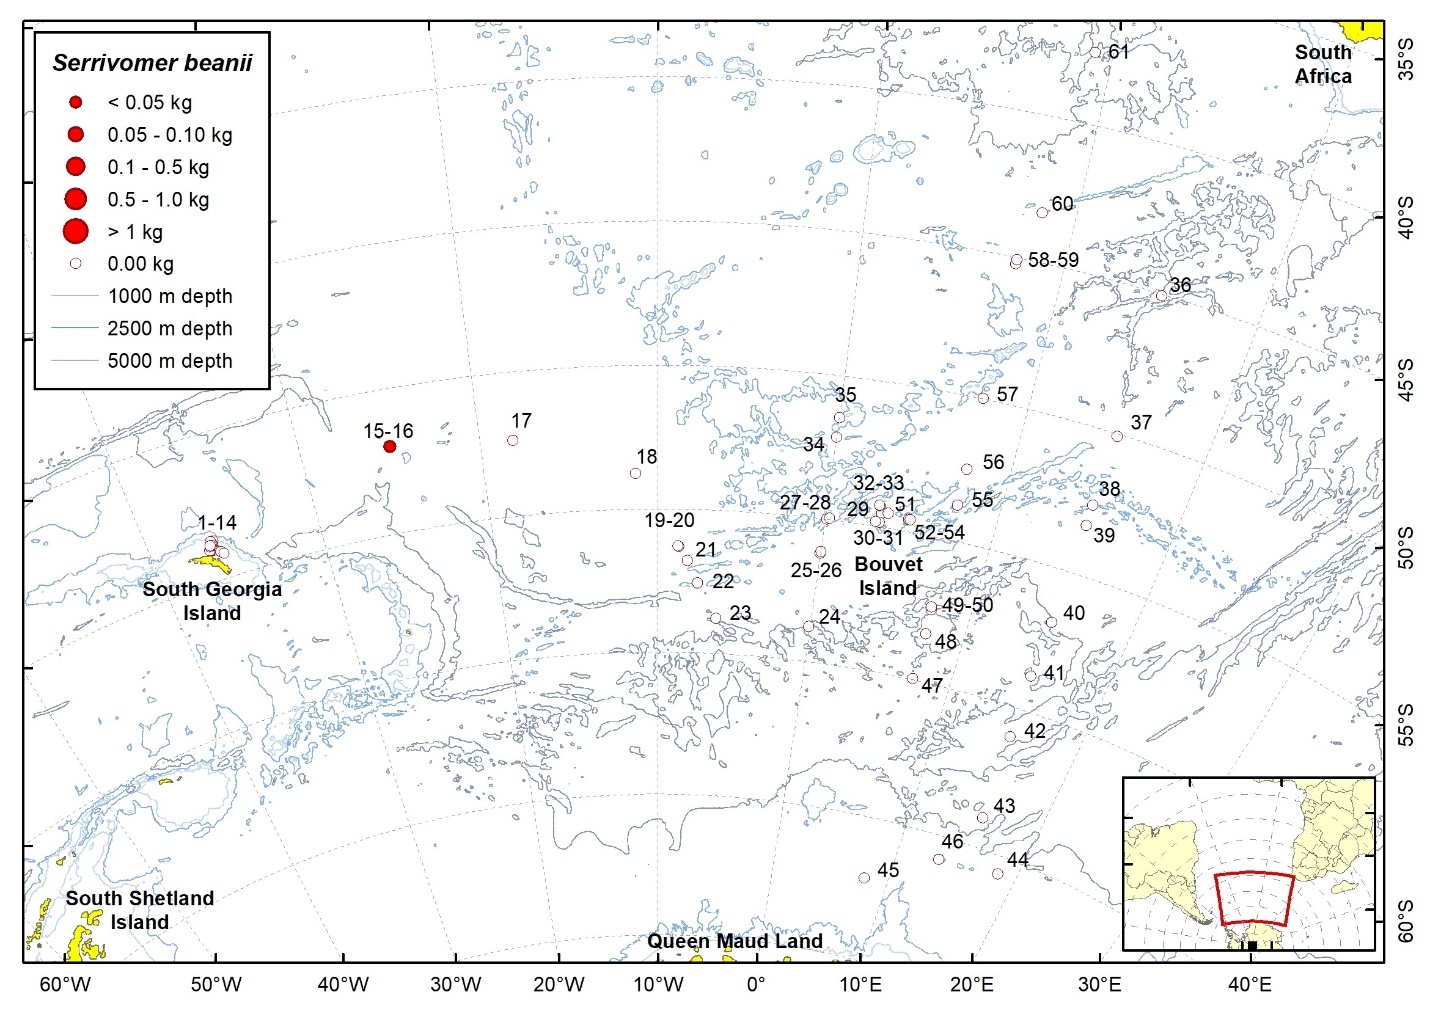
| Station | Date | Latitude | Longitude | Ind. caught | W (g) | TW fish (kg) | TW catch (kg) | ||
| 16 | 24.01.2008 | 51,99 | S | 25,00 | W | 1 | 3,4 | 3,23 | 45,05 |
2.3 - Microstomatidae
2.3.1 - Nansenia antarctica Kawaguchi & Butler, 1984

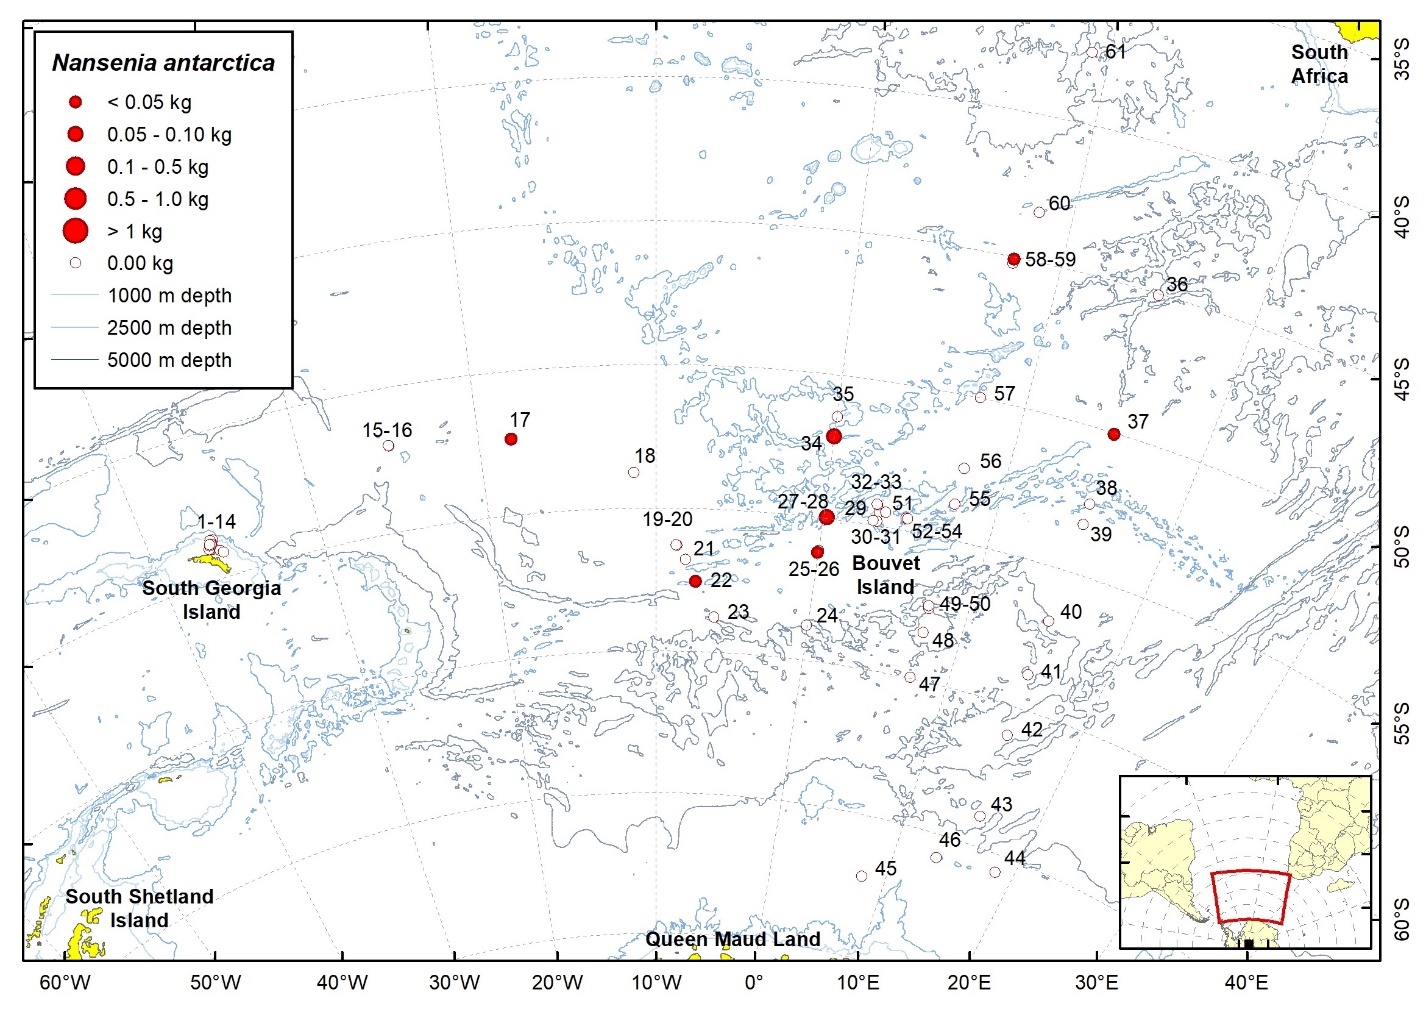
| Station | Date | Latitude | Longitude | Ind. caught | W (g) | TW fish (kg) | TW catch (kg) | ||
| 17 | 26.01.2008 | 52,33 | S | 18,16 | W | 2 | 13,2 | 1,20 | 26,43 |
| 22 | 30.01.2008 | 57,53 | S | 7,49 | W | 1 | 12,7 | 0,67 | 20,43 |
| 25 | 01.02.2008 | 56,21 | S | 0,05 | W | 3 | 31,0 | 0,18 | 44,71 |
| 28 | 02.02.2008 | 54,95 | S | 0,20 | E | 2 | 79,4 | 0,47 | 89,03 |
| 34 | 06.02.2008 | 52,12 | S | 0,02 | W | 3 | 83,6 | 4,15 | 44,70 |
| 37 | 24.02.2008 | 50,04 | S | 15,02 | E | 1 | 22,0 | 3,32 | 14,43 |
| 59 | 17.03.2008 | 45,06 | S | 7,67 | E | 2 | 3,9 | 1,02 | 5,63 |
2.4 - Bathylagidae
2.4.1 - Bathylagus antarcticus Günther, 1878
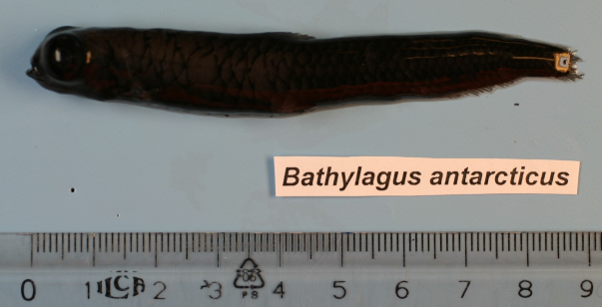
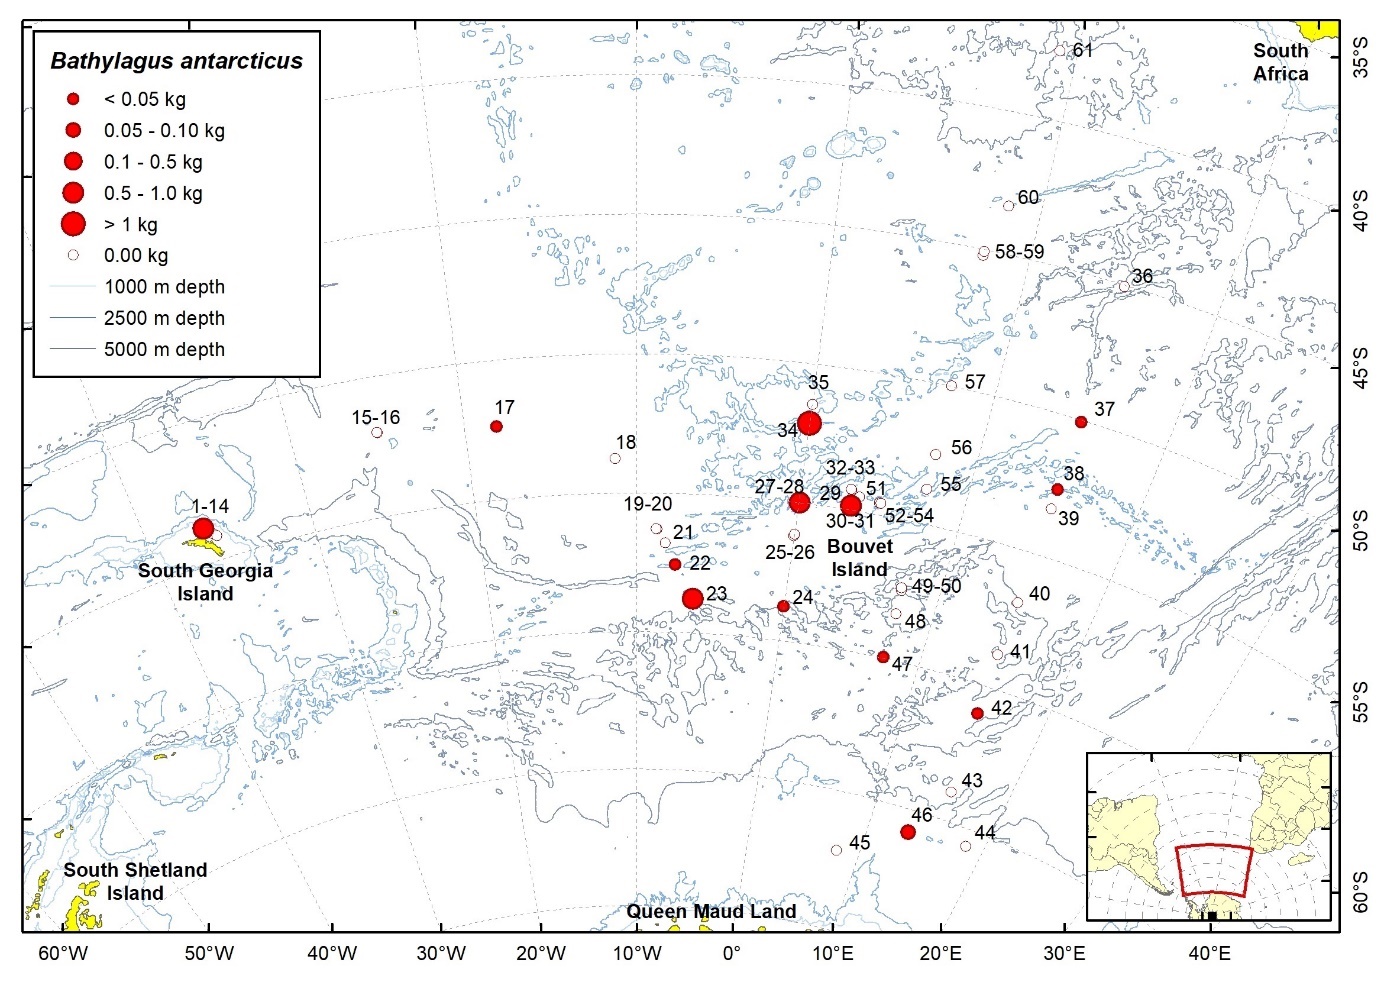
| Station | Date | Latitude | Longitude | Ind. caught | W (g) | TW fish (kg) | TW catch (kg) | ||
| 12 | 22.01.2008 | 53,75 | S | 36,50 | W | 50 | 908,0 | 0,91 | 7,50 |
| 17 | 26.01.2008 | 52,33 | S | 18,16 | W | 17 | 10,9 | 1,20 | 26,43 |
| 22 | 30.01.2008 | 57,53 | S | 7,49 | W | 26 | 9,9 | 0,67 | 20,43 |
| 23 | 30.01.2008 | 58,76 | S | 6,22 | W | 142 | 721,6 | 4,14 | 13,02 |
| 24 | 31.01.2008 | 58,76 | S | 0,04 | W | 7 | 36,4 | 1,49 | 29,02 |
| 27 | 02.02.2008 | 54,99 | S | 0,06 | E | 50 | 908,0 | 0,91 | 0,91 |
| 30 | 03.02.2008 | 54,84 | S | 3,23 | E | 115 | 859,6 | 1,44 | 273,78 |
| 34 | 06.02.2008 | 52,12 | S | 0,02 | W | 131 | 1980,0 | 4,15 | 44,70 |
| 37 | 24.02.2008 | 50,04 | S | 15,02 | E | 5 | 14,0 | 3,32 | 14,43 |
| 38 | 25.02.2008 | 52,57 | S | 15,00 | E | 48 | 14,1 | 3,66 | 49,50 |
| 42 | 28.02.2008 | 60,98 | S | 15,13 | E | 65 | 35,0 | 0,59 | 50,67 |
| 46 | 05.03.2008 | 65,80 | S | 13,38 | E | 87 | 83,0 | 1,59 | 32,17 |
| 47 | 07.03.2008 | 59,93 | S | 7,42 | E | 37 | 24,5 | 1,58 | 44,63 |
2.4.2 - Bathylagus tenuis Kobyliansky, 1986
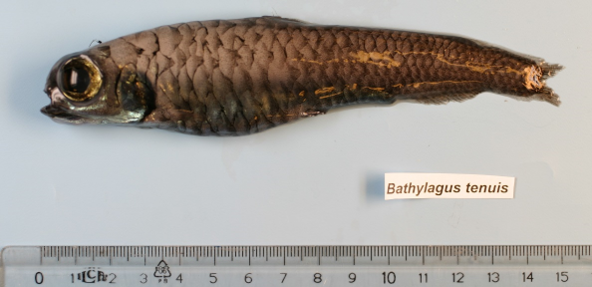
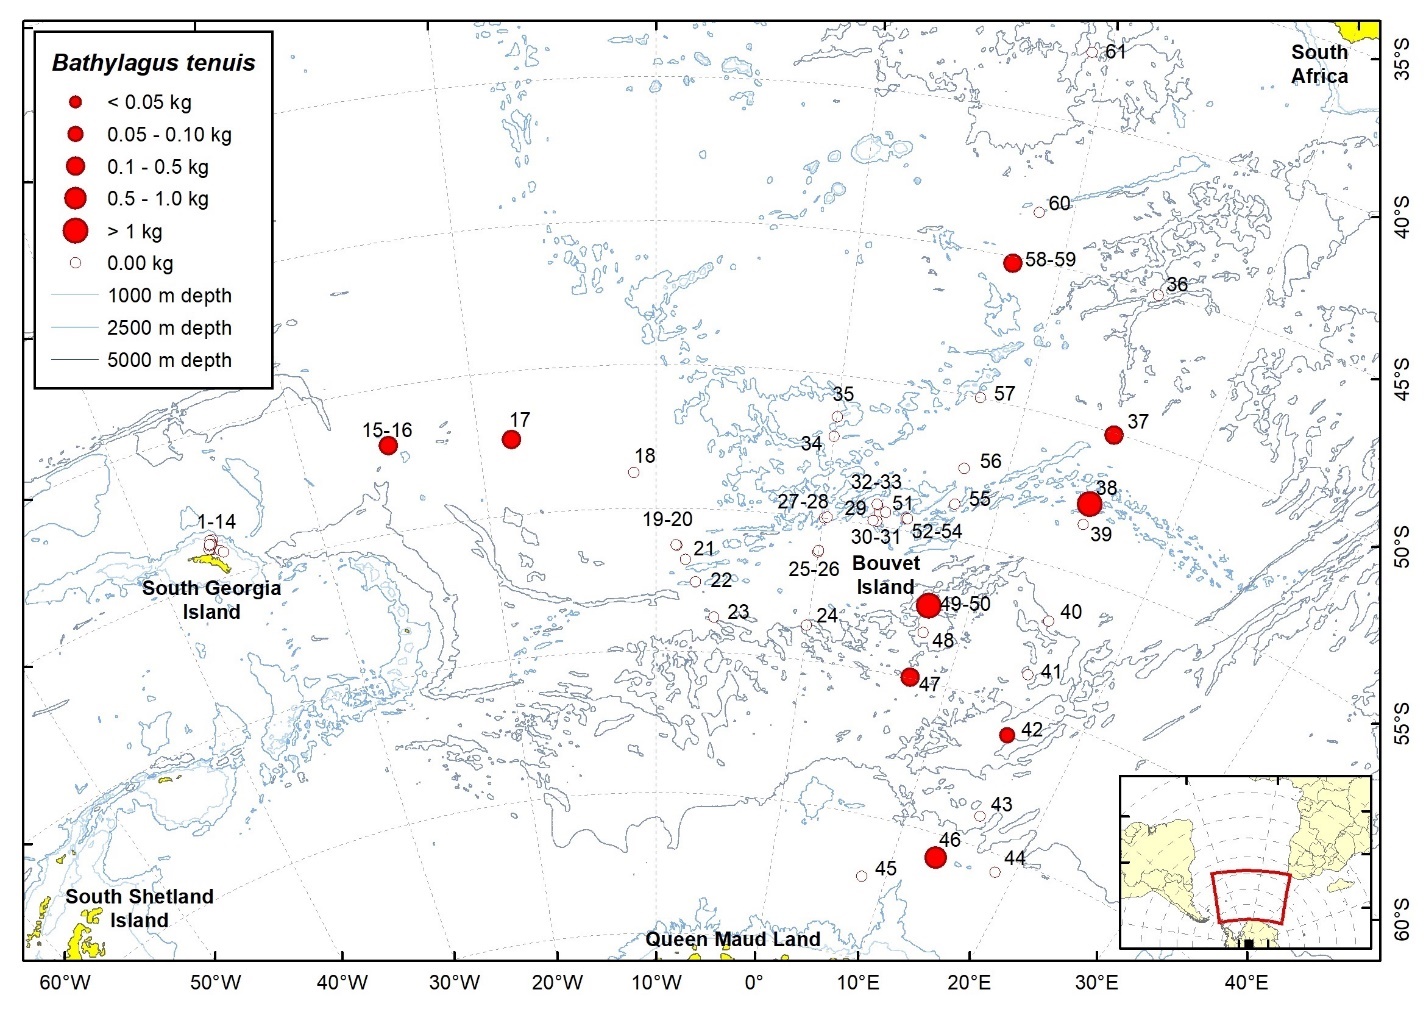
| Station | Date | Latitude | Longitude | Ind. caught | W (g) | TW fish (kg) | TW catch (kg) | ||
| 16 | 24.01.2008 | 51,99 | S | 25,00 | W | 13 | 231,3 | 3,23 | 45,05 |
| 17 | 26.01.2008 | 52,33 | S | 18,16 | W | 7 | 228,8 | 1,20 | 26,43 |
| 37 | 24.02.2008 | 50,04 | S | 15,02 | E | 10 | 243,7 | 3,32 | 14,43 |
| 38 | 25.02.2008 | 52,55 | S | 14,99 | E | 158 | 2456,0 | 3,66 | 49,50 |
| 42 | 28.02.2008 | 60,98 | S | 15,13 | E | 9 | 81,4 | 0,59 | 50,67 |
| 46 | 05.03.2008 | 65,80 | S | 13,38 | E | 55 | 955,0 | 1,59 | 32,17 |
| 47 | 07.03.2008 | 59,98 | S | 7,47 | E | 24 | 199,5 | 1,58 | 44,63 |
| 50 | 08.03.2008 | 57,39 | S | 7,44 | E | 183 | 4360,0 | 26,34 | 31,75 |
| 58 | 17.03.2008 | 45,20 | S | 7,65 | E | 9 | 332,0 | 10,17 | 19,92 |
2.5 - Opisthoproctidae
2.5.1 - Dolichopteryx sp.

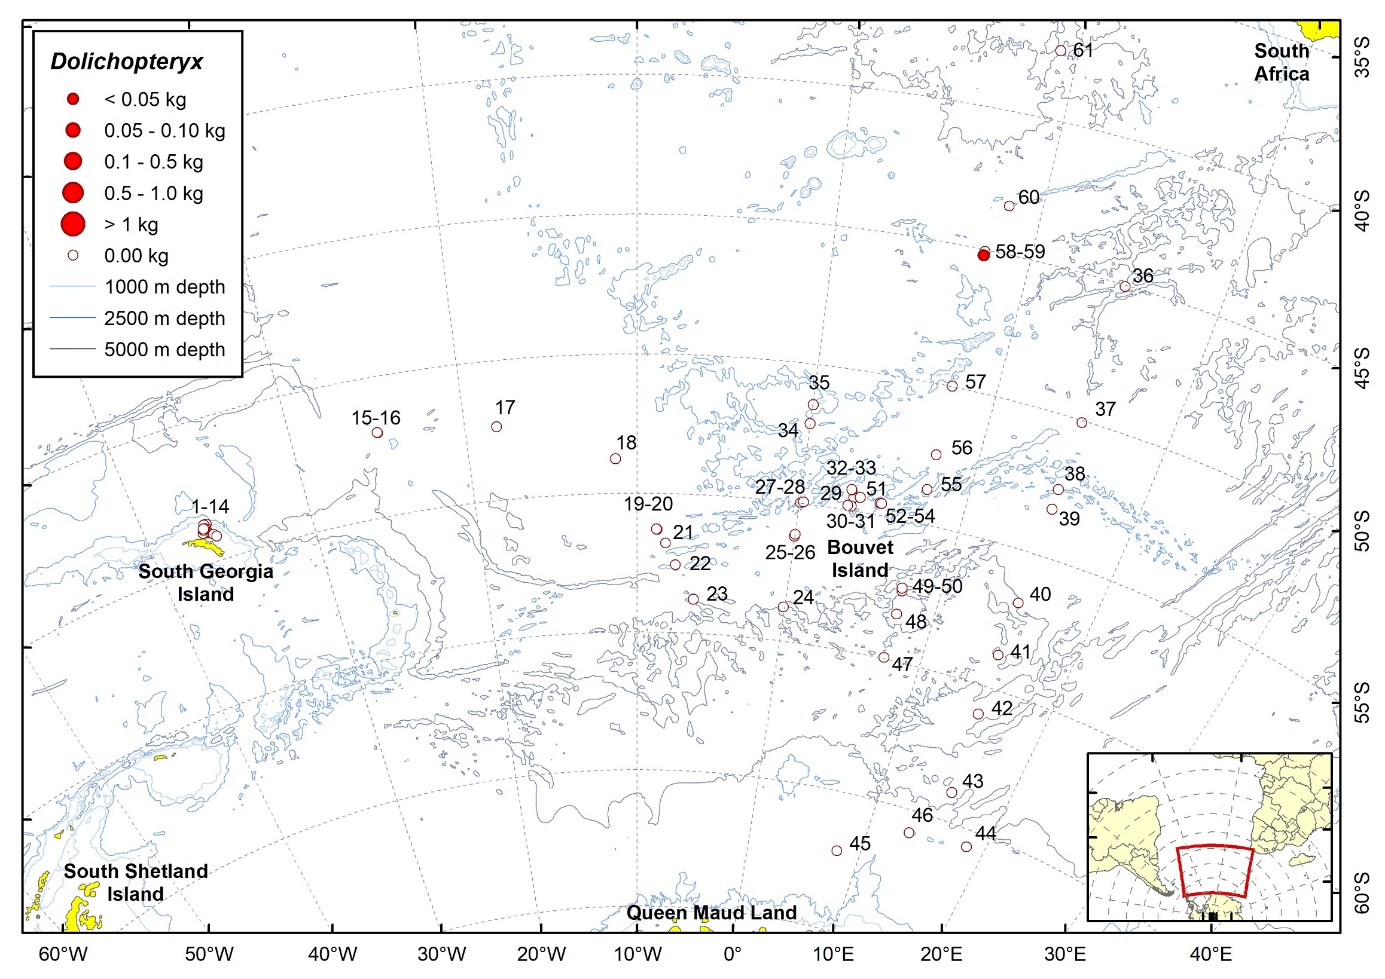
| Station | Date | Latitude | Longitude | Ind. caught | W (g) | TW fish (kg) | TW catch (kg) | ||
| 58 | 17.03.2008 | 45,20 | S | 7,65 | E | 1 | 16,0 | 10,17 | 19,92 |
2.6 - Gonostomatidae
2.6.1 - Diplophos rebainsi Krefft & Parin, 1972

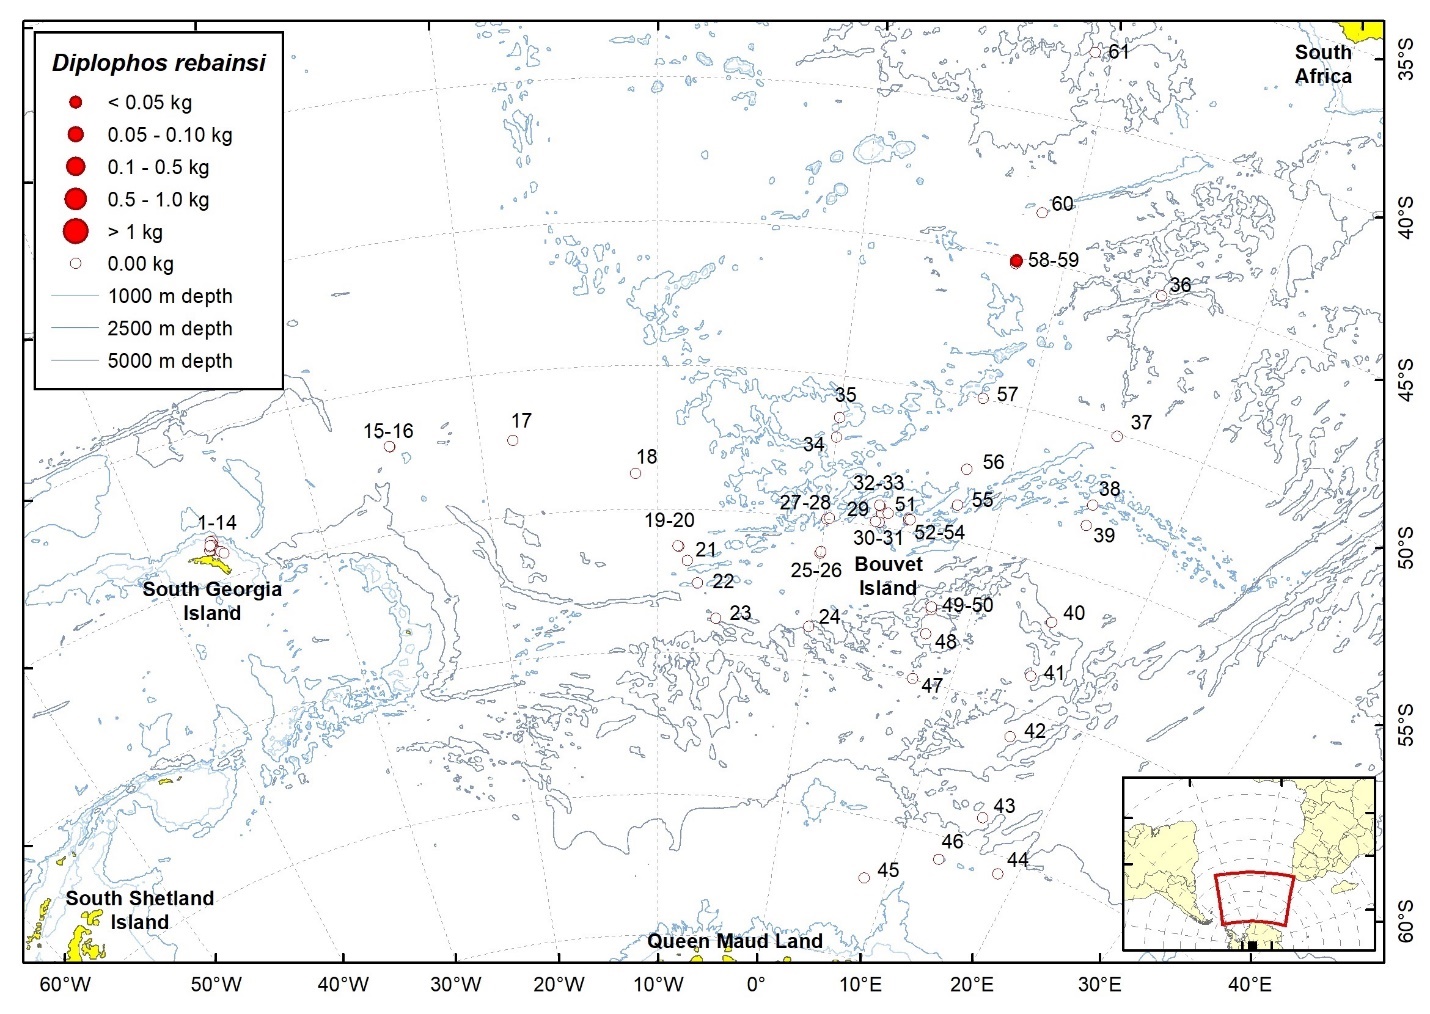
| Station | Date | Latitude | Longitude | Ind. caught | W (g) | TW fish (kg) | TW catch (kg) | ||
| 59 | 17.03.2008 | 45,11 | S | 7,66 | E | 1 | 41,0 | 1,02 | 5,63 |
2.7 - Sternoptychidae
2.7.1 - Argyropelecus hemigymnus Cocco, 1829
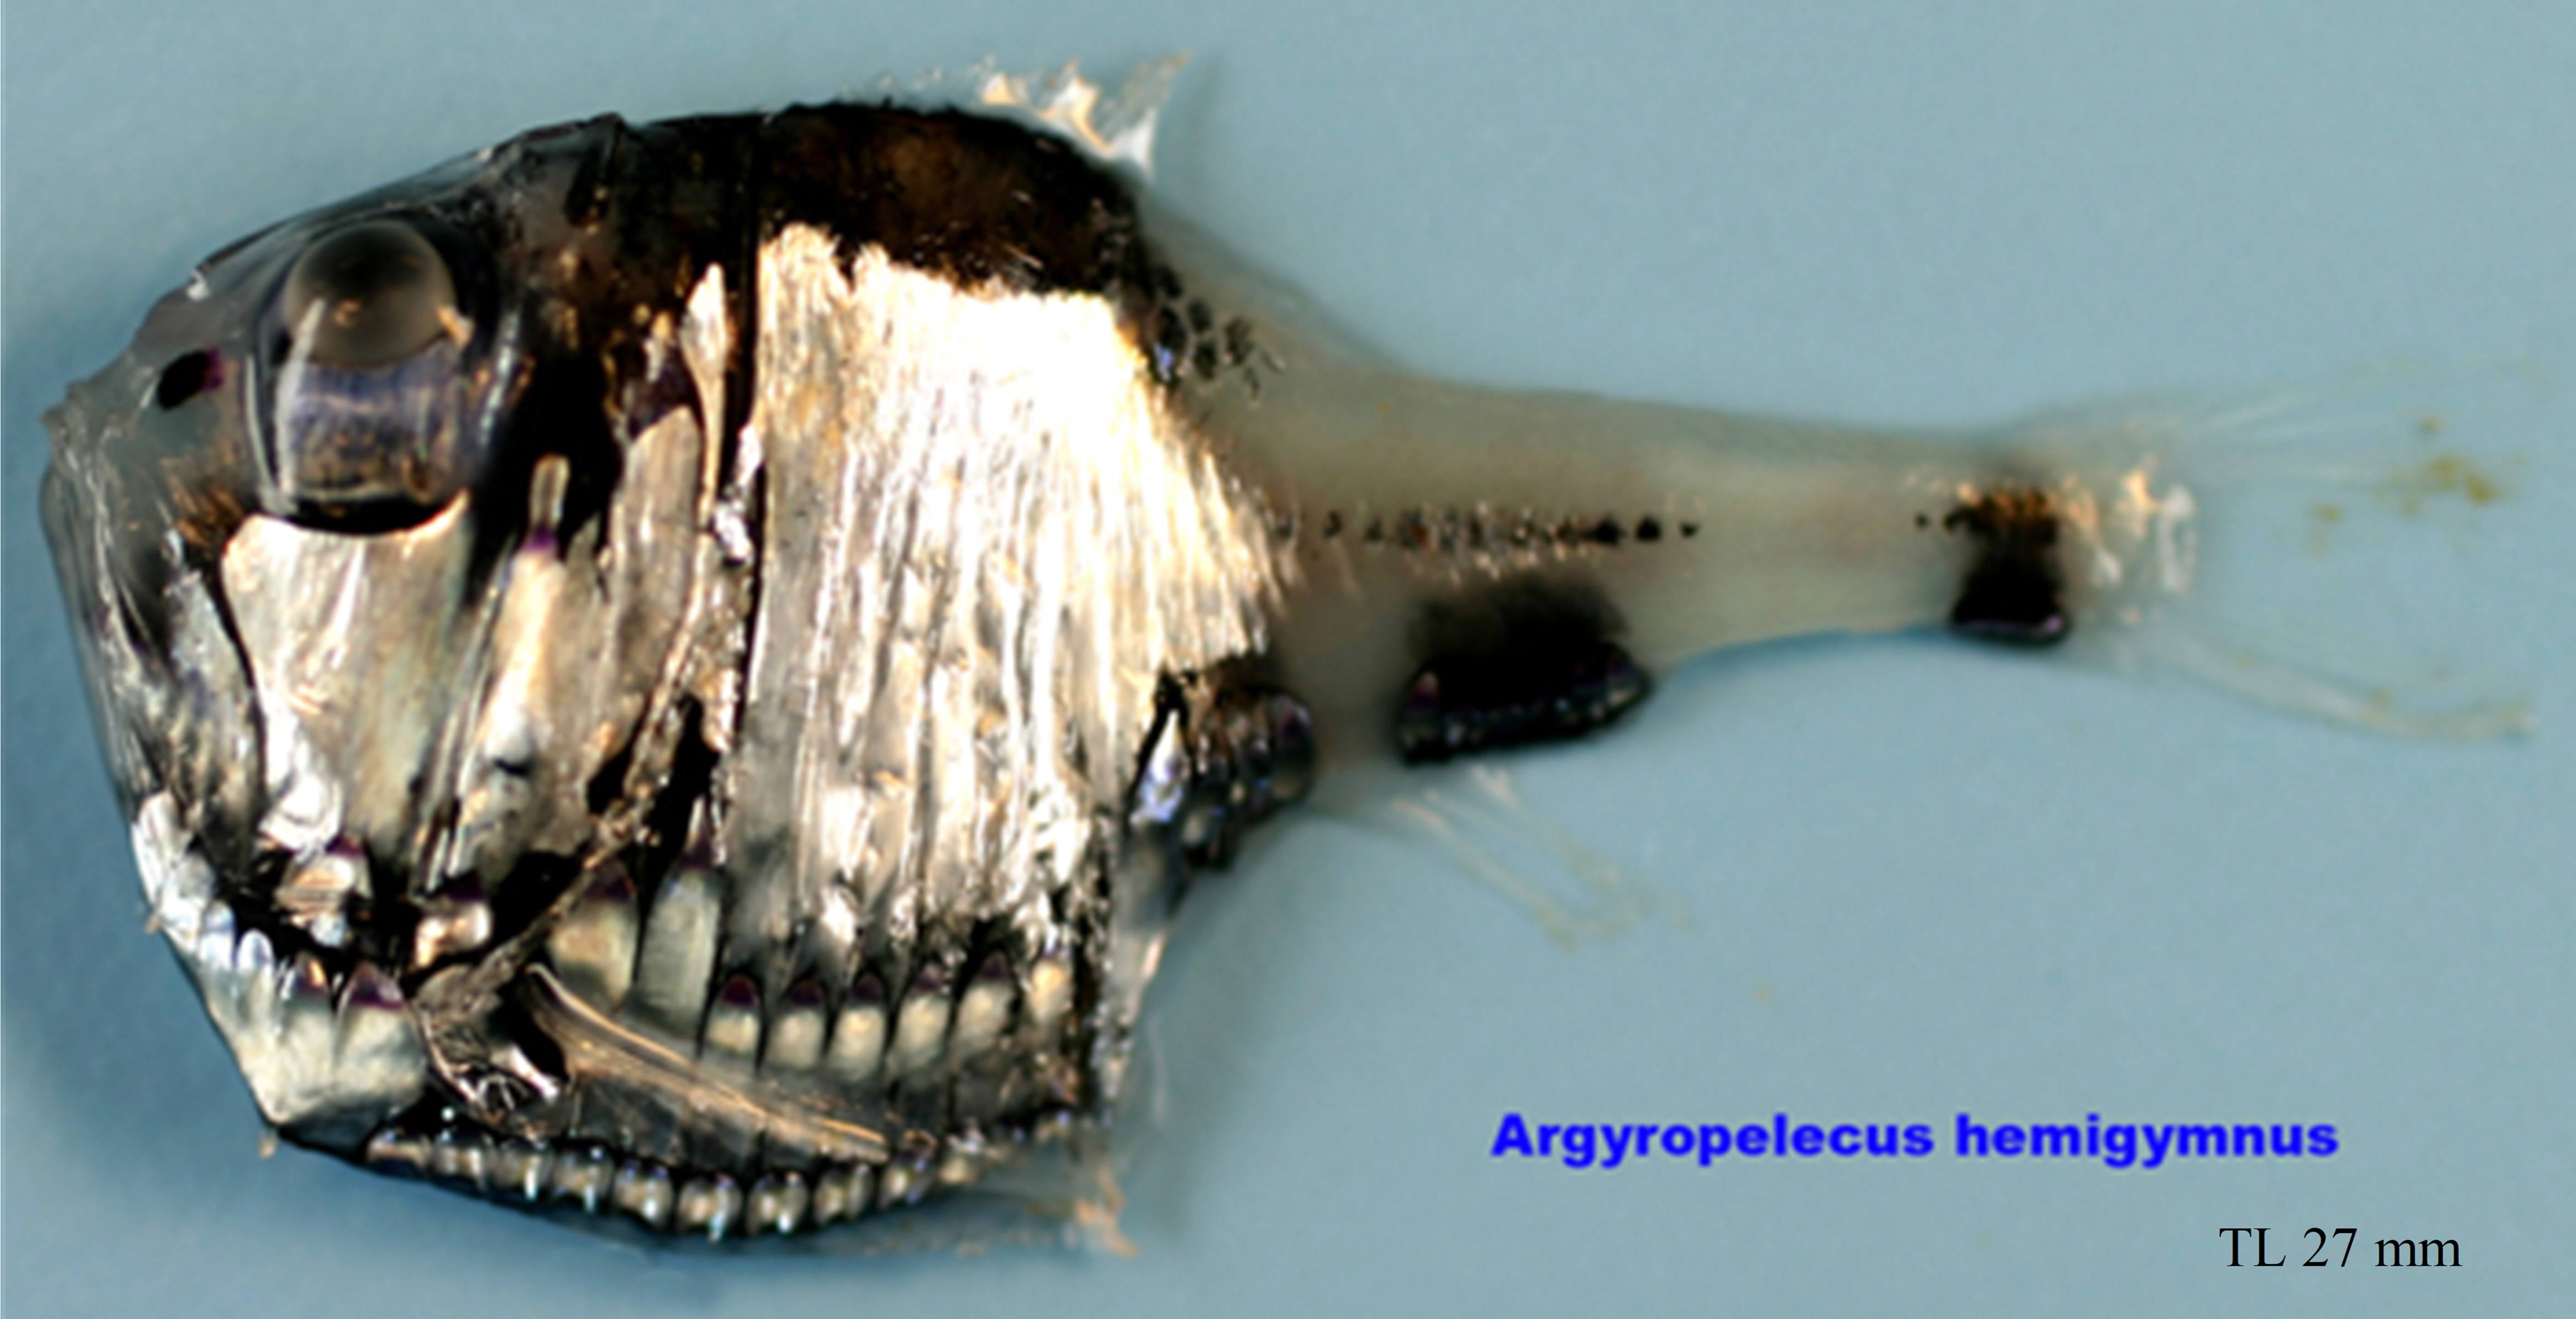
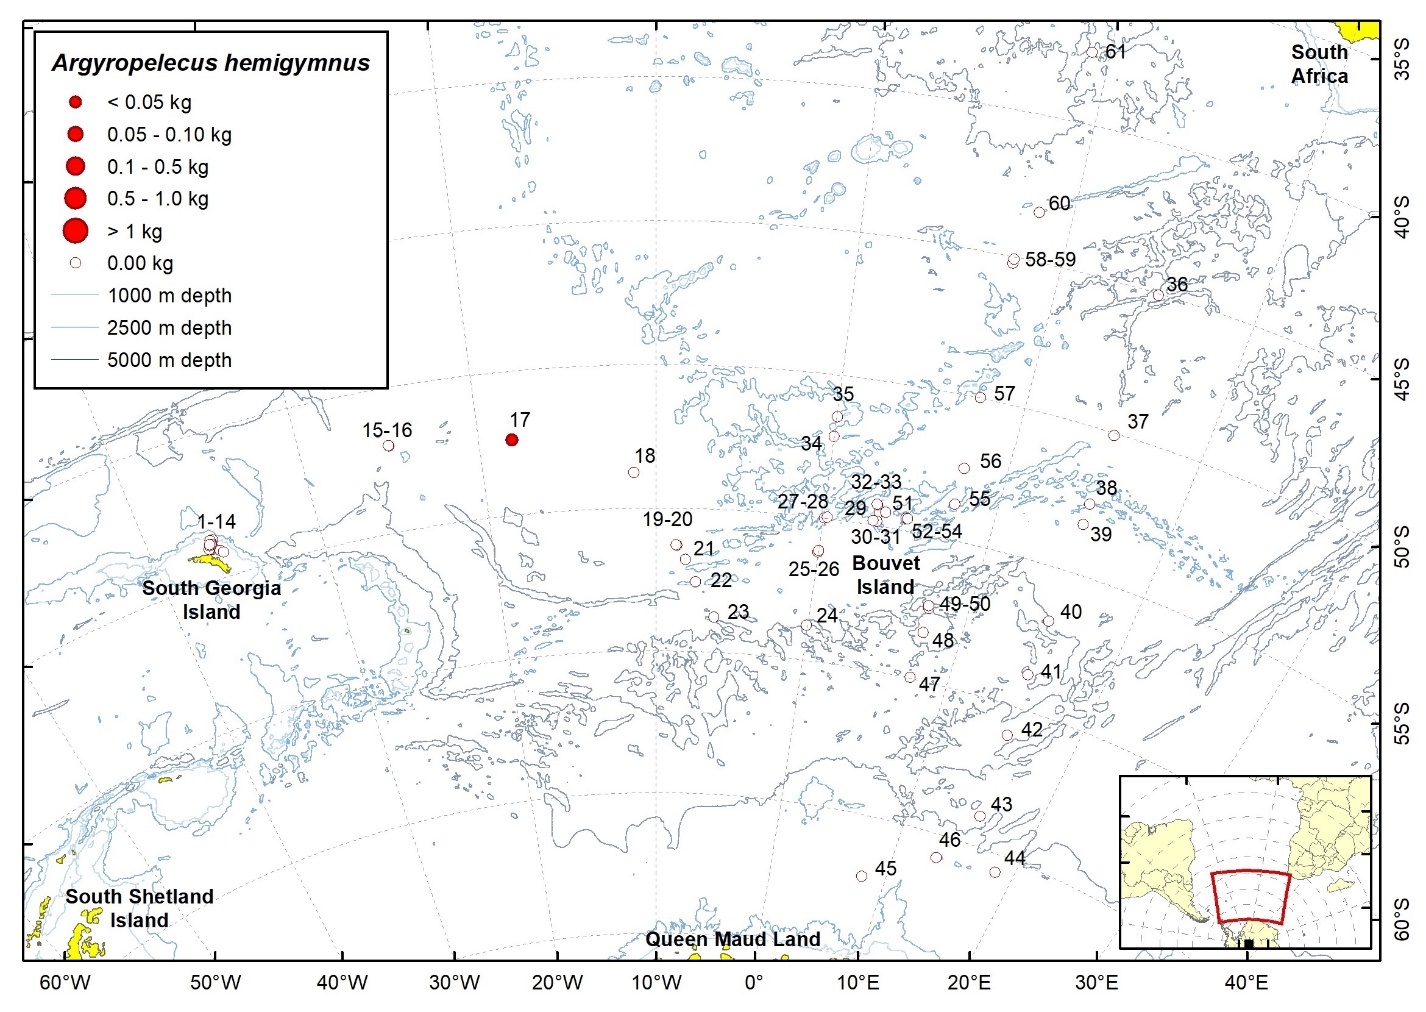
| Station | Date | Latitude | Longitude | Ind. caught | W (g) | TW fish (kg) | TW catch (kg) | ||
| 17 | 26.01.2008 | 52,38 | S | 18,13 | W | 1 | 0,3 | 1,20 | 26,43 |
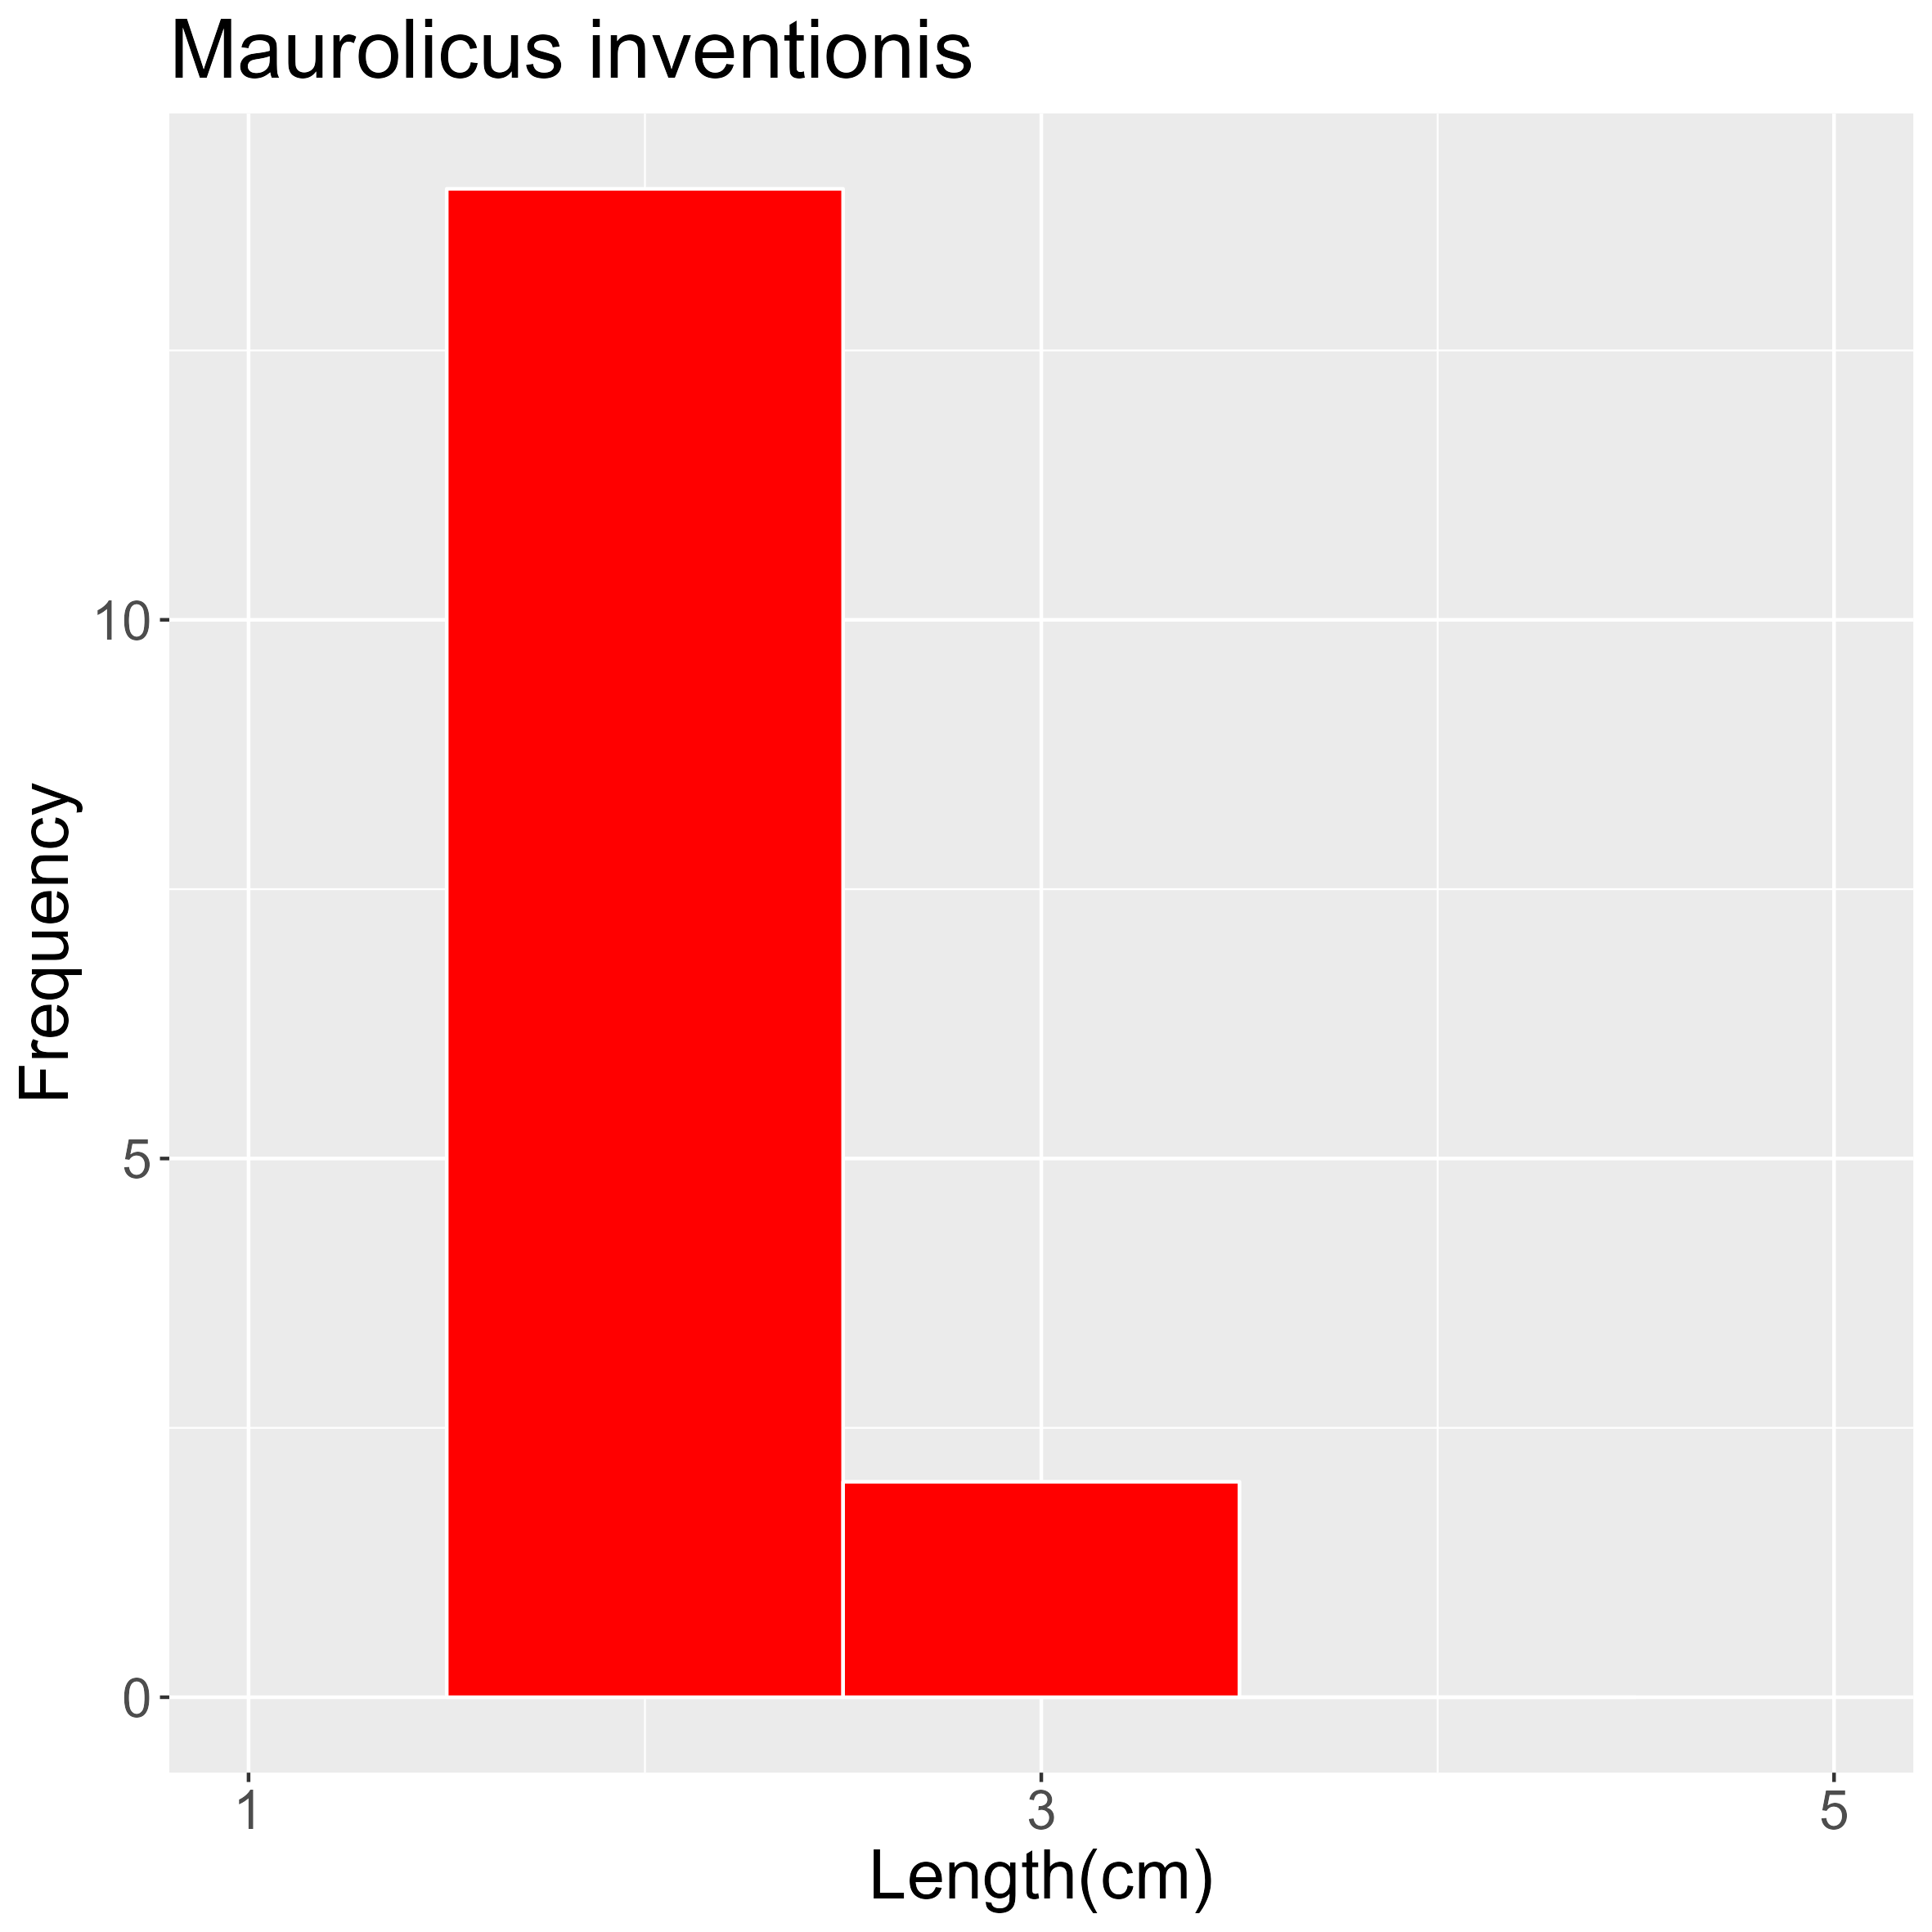
2.7.2 - Maurolicus inventionis Parin & Kobyliansky, 1993
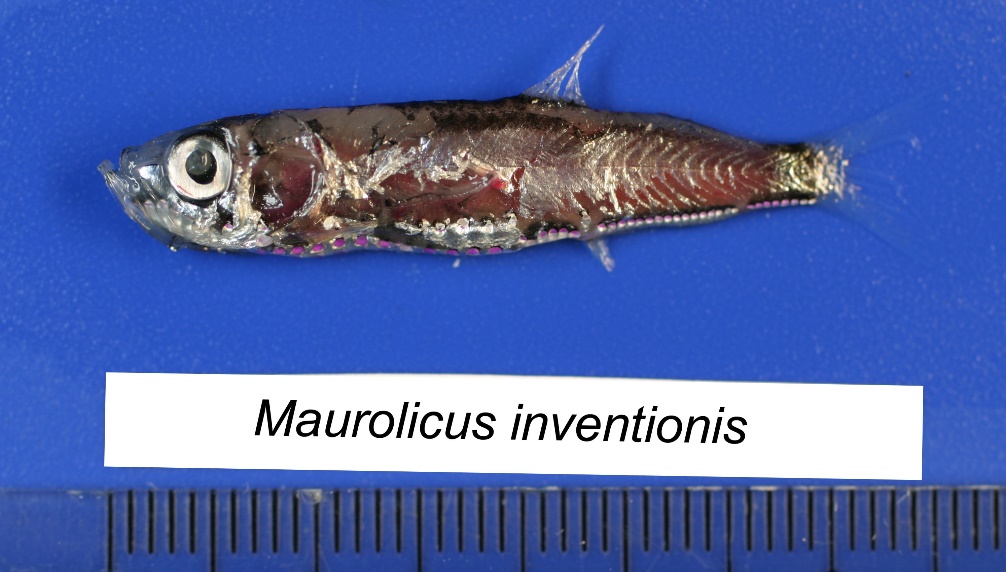
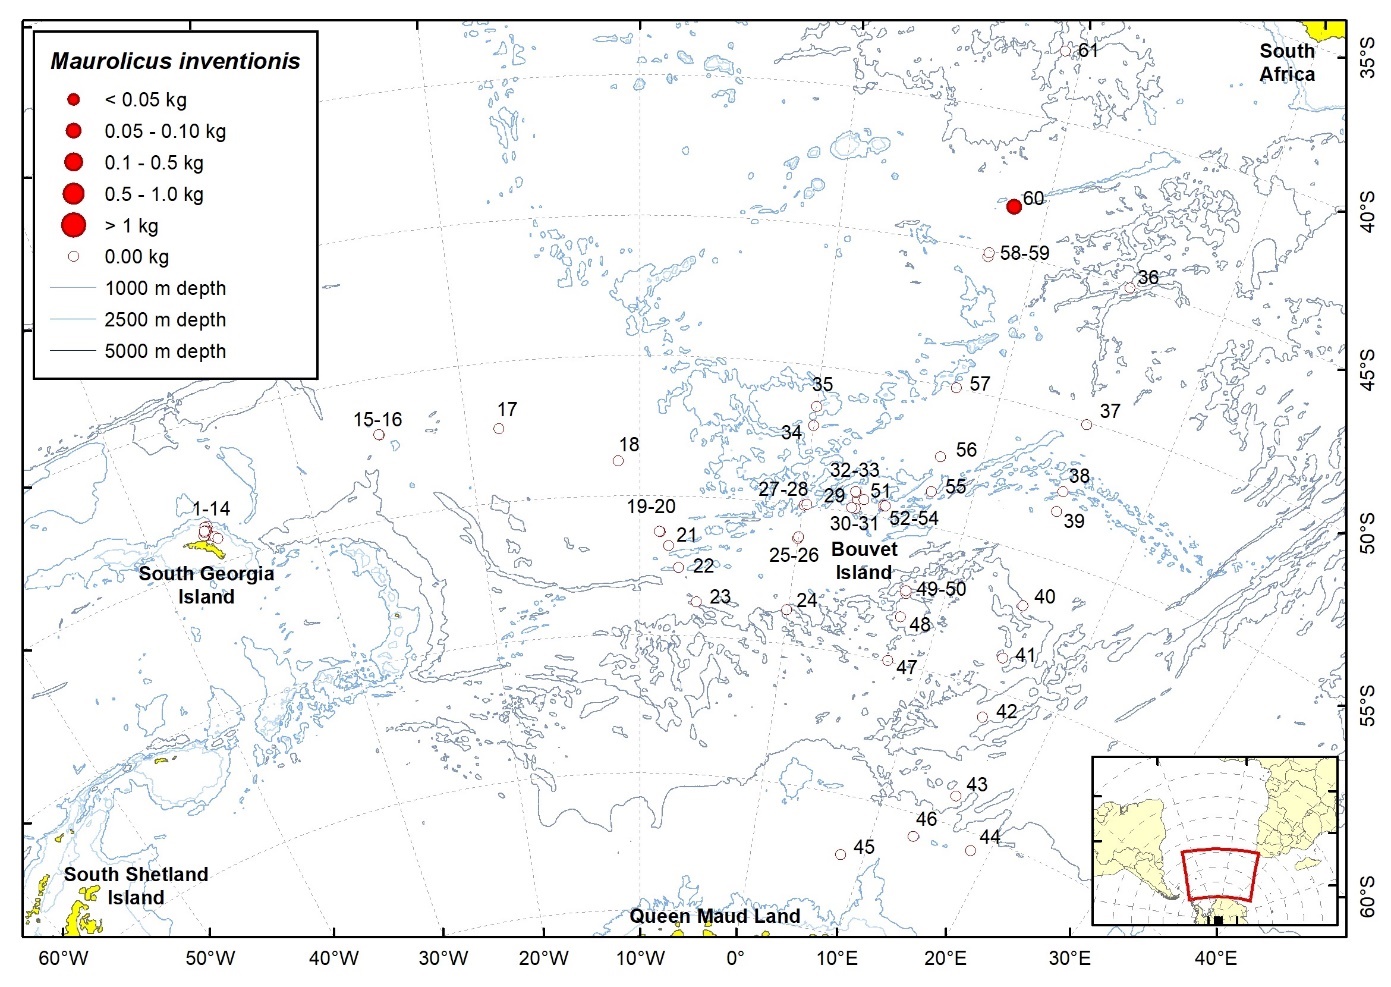
| Station | Date | Latitude | Longitude | Ind. caught | W (g) | TW fish (kg) | TW catch (kg) | ||
| 60 | 18.03.2008 | 43,33 | S | 8,37 | E | 361 | 51,7 | 110,70 | 332,36 |
2.8 - Phosichthyidae
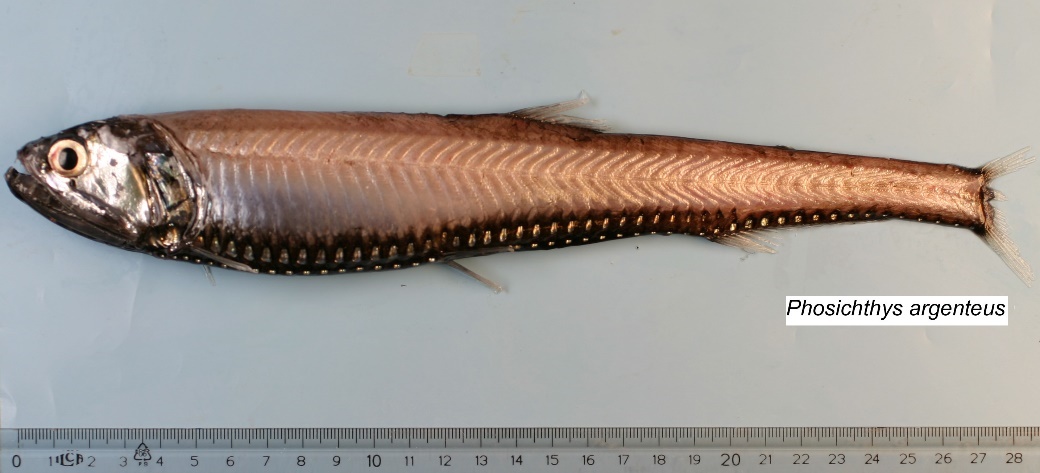
2.8.1 - Phosichthys argenteus Hutton, 1872
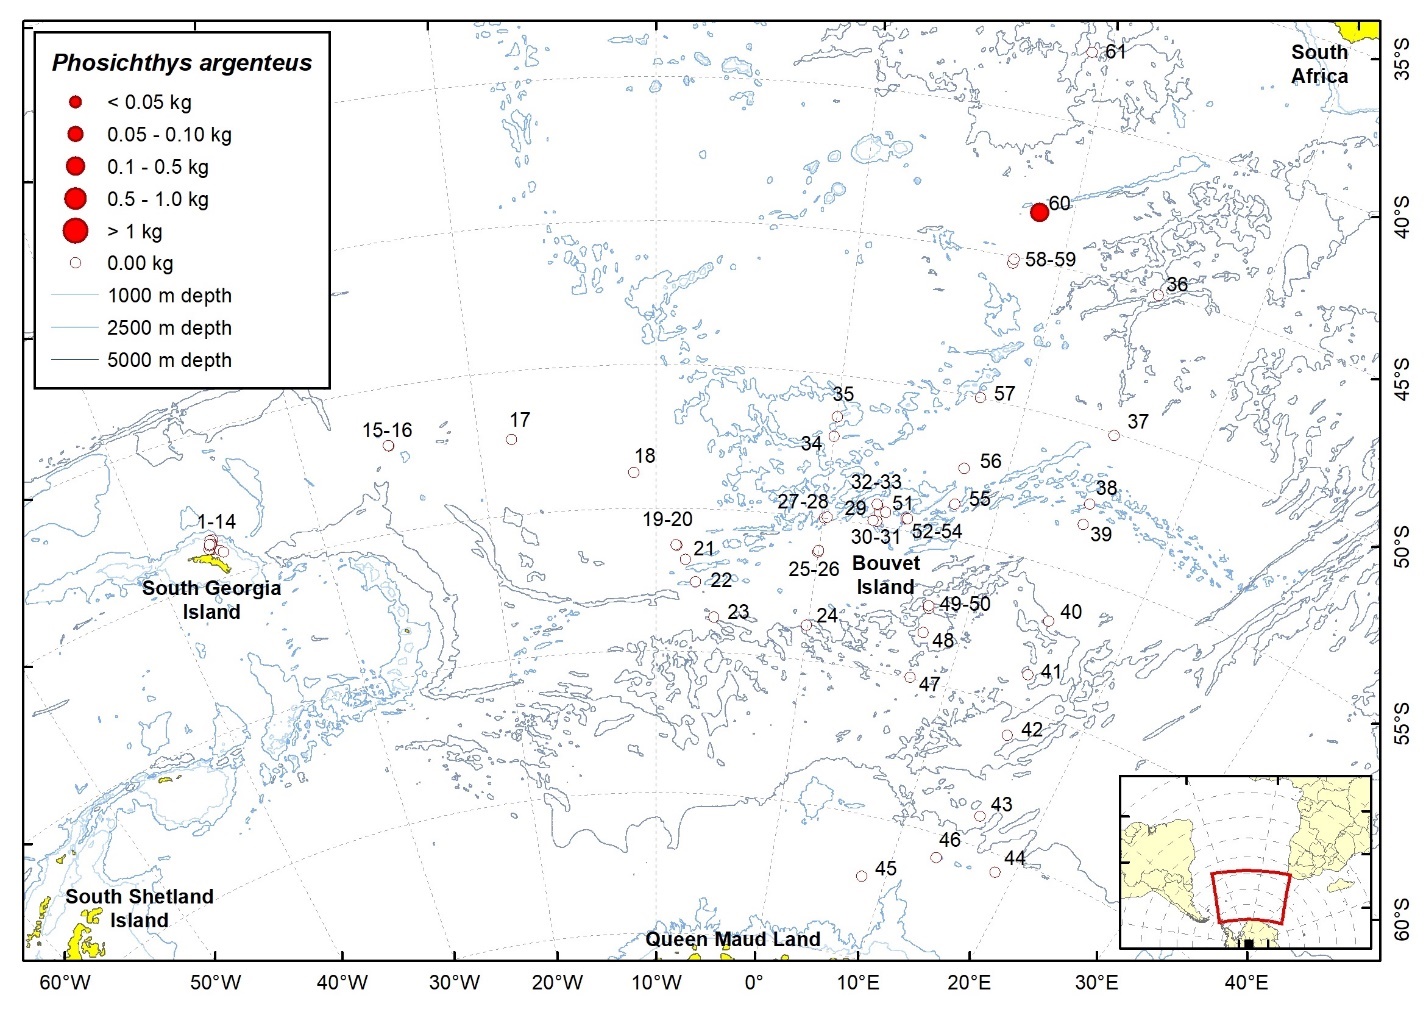
| Station | Date | Latitude | Longitude | Ind. caught | W (g) | TW fish (kg) | TW catch (kg) | ||
| 60 | 18.03.2008 | 43,33 | S | 8,37 | E | 6 | 220,0 | 110,70 | 332,36 |
2.9 - Stomiidae
2.9.1 - Astronesthes boulengeri Gilchrist, 1902
| Station | Date | Latitude | Longitude | Ind. caught | W (g) | TW fish (kg) | TW catch (kg) | ||
| 59 | 17.03.2008 | 45,11 | S | 7,66 | E | 1 | 21,0 | 1,02 | 5,63 |
2.9.2 - Borostomias antarcticus (Lönnberg, 1905)

| Station | Date | Latitude | Longitude | Ind. caught | W (g) | TW fish (kg) | TW catch (kg) | ||
| 16 | 24.01.2008 | 51,99 | S | 25,00 | W | 5 | 151,0 | 3,23 | 45,05 |
| 17 | 26.01.2008 | 52,33 | S | 18,16 | W | 3 | 94,3 | 1,20 | 26,43 |
| 58 | 17.03.2008 | 45,20 | S | 7,65 | E | 2 | 173,0 | 10,17 | 19,92 |
2.9.3 - Idiacanthus atlanticus Brauer, 1906

| Station | Date | Latitude | Longitude | Ind. caught | W (g) | TW fish (kg) | TW catch (kg) | ||
| 17 | 26.01.2008 | 52,38 | S | 18,13 | W | 2 | 56,9 | 1,20 | 26,43 |
| 58 | 17.03.2008 | 45,20 | S | 7,65 | E | 1 | 44,0 | 10,17 | 19,92 |
2.9.4 - Stomias boa (Risso, 1810)
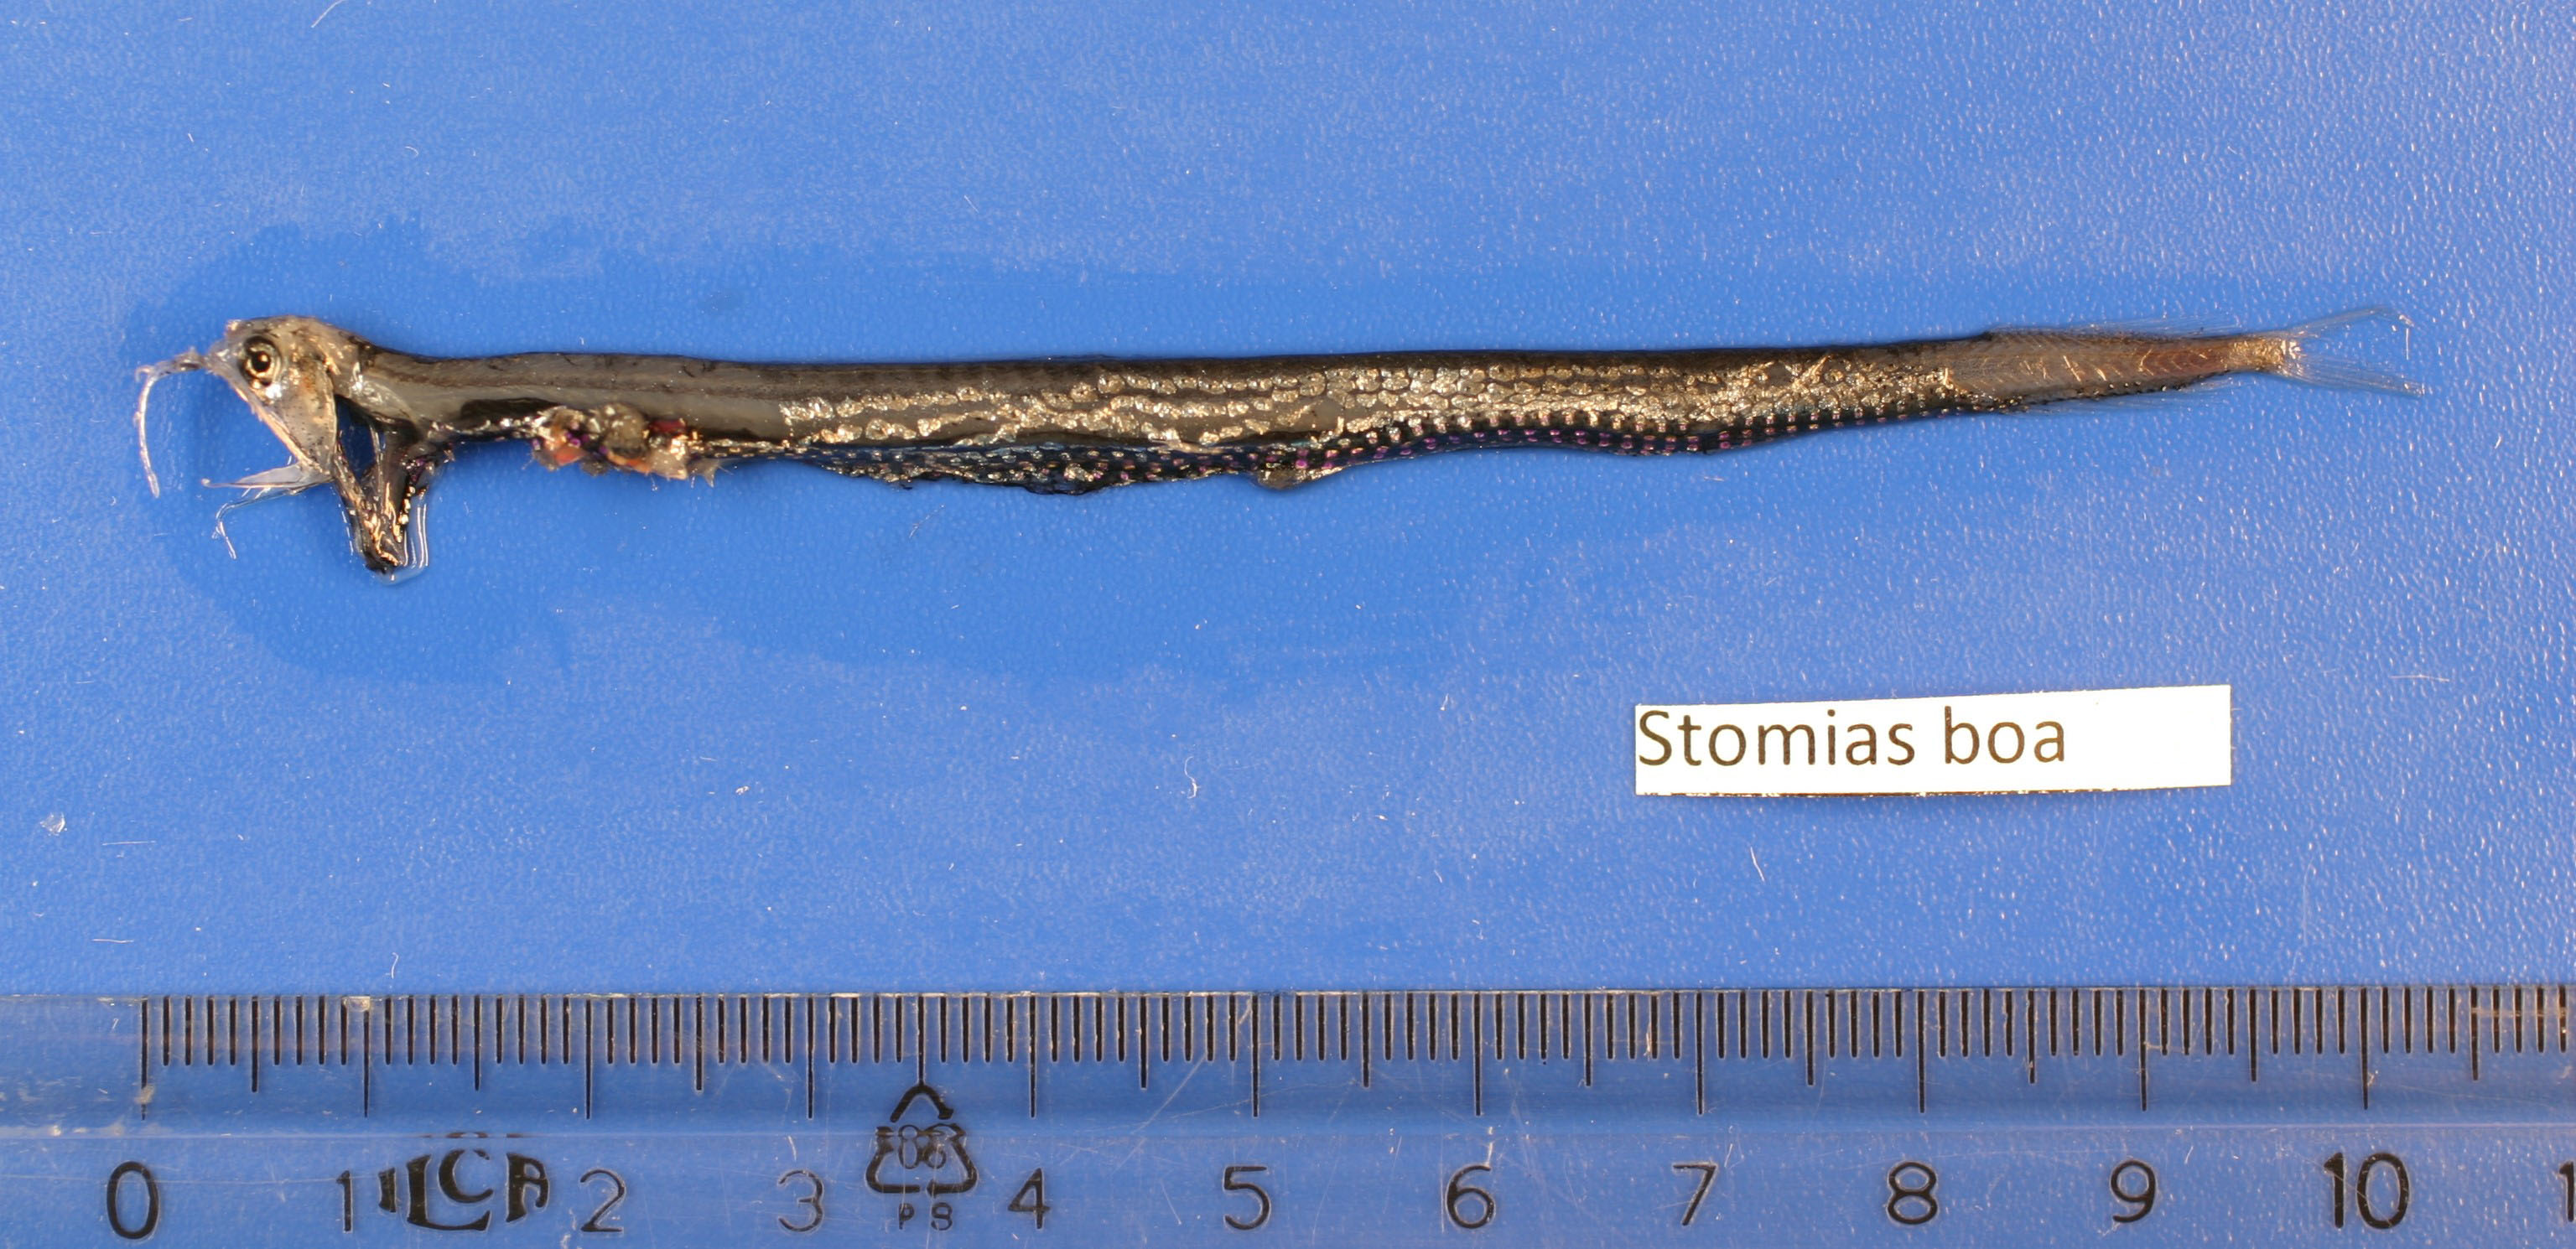
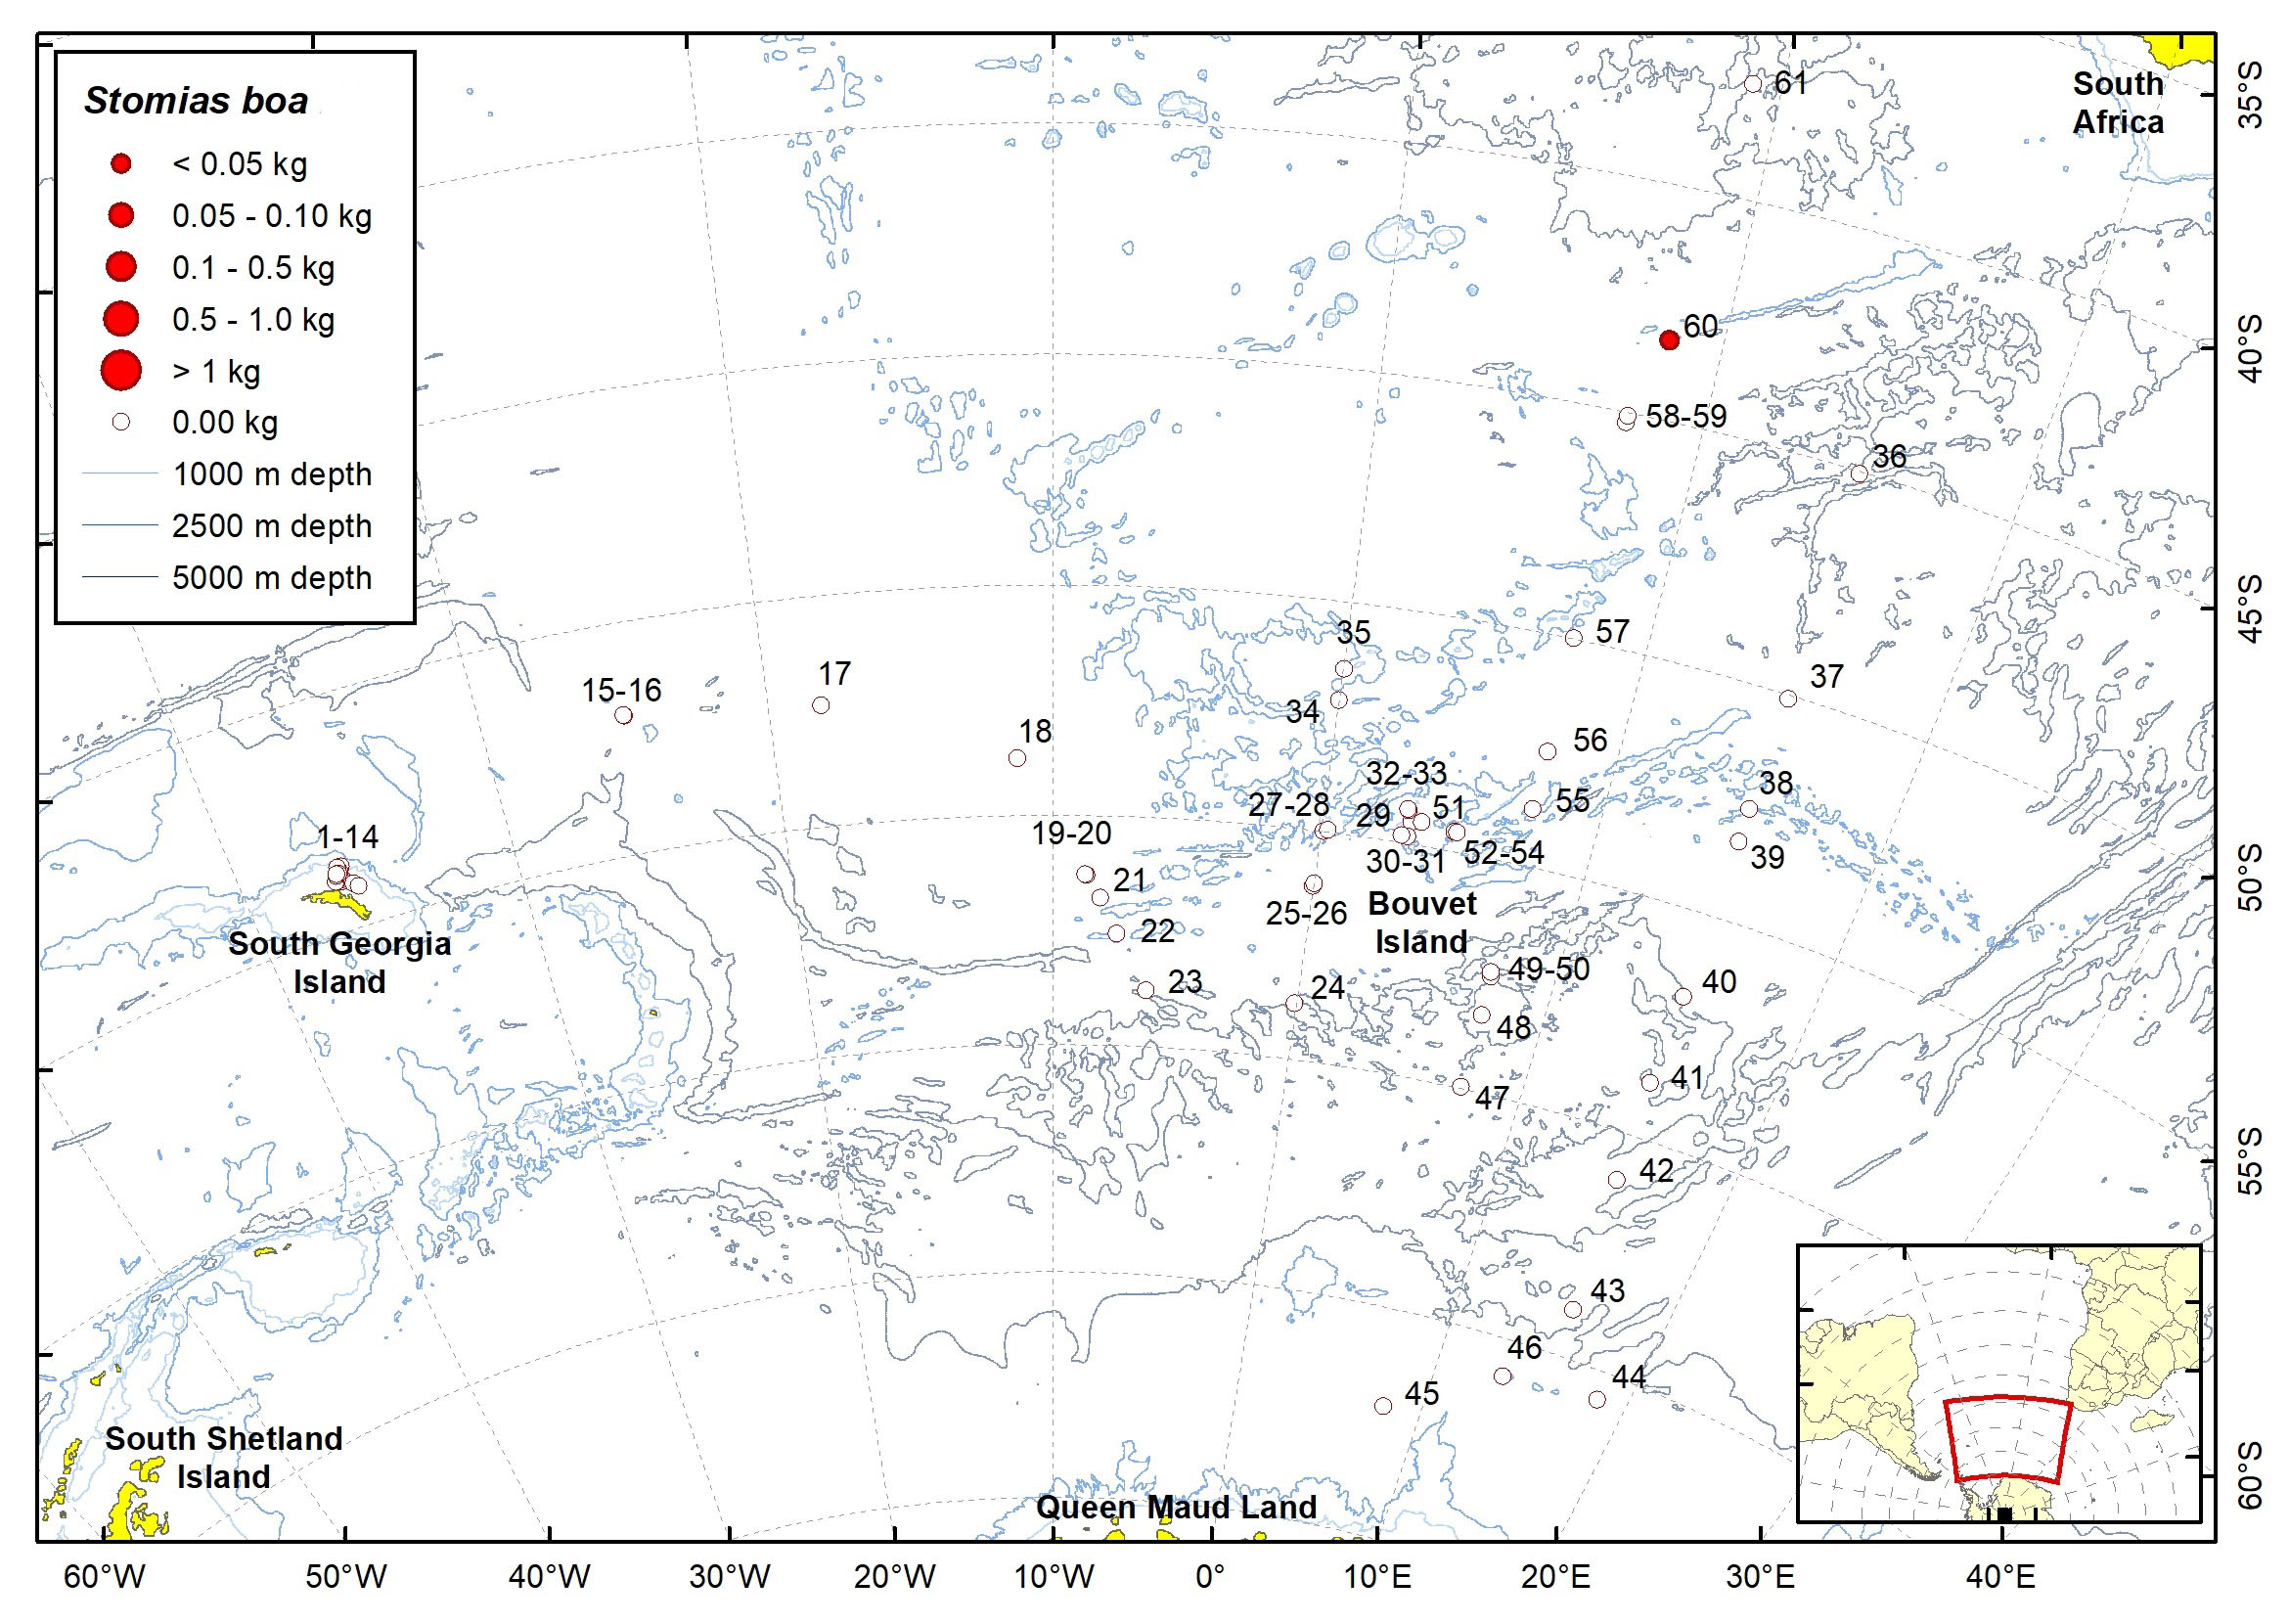
| Station | Date | Latitude | Longitude | Ind. caught | W (g) | TW fish (kg) | TW catch (kg) | ||
| 60 | 18.03.2008 | 43,29 | S | 8,40 | E | 2 | 3,0 | 110,70 | 332,36 |
2.9.5 - Stomias gracilis Garman, 1899

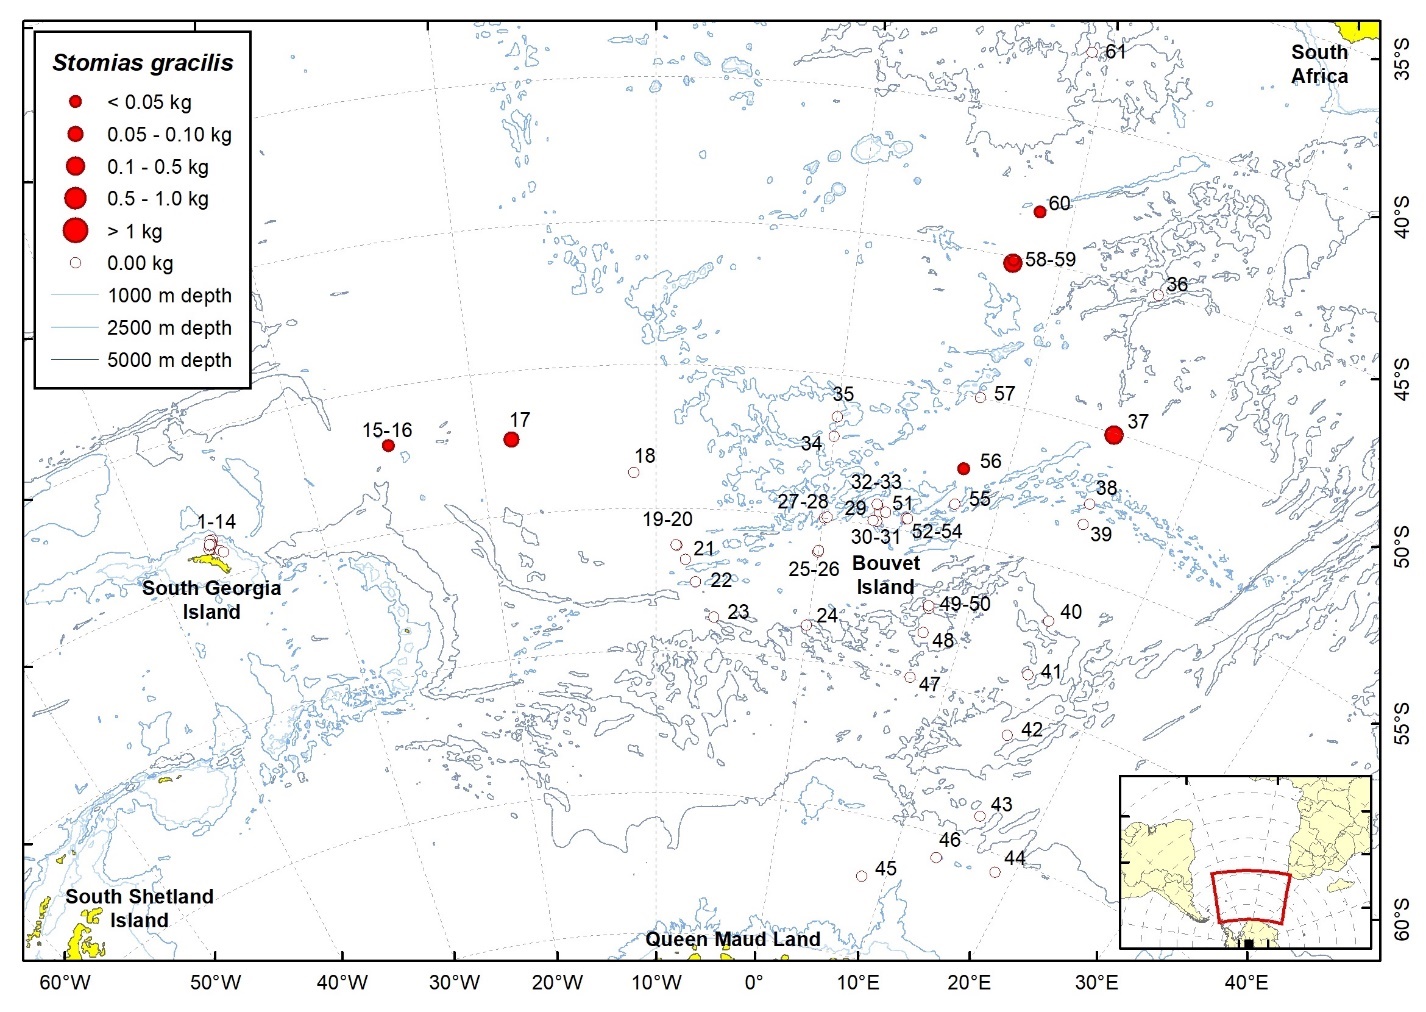
| Station | Date | Latitude | Longitude | Ind. caught | W (g) | TW fish (kg) | TW catch (kg) | ||
| 16 | 24.01.2008 | 51,98 | S | 25,04 | W | 1 | 16,0 | 3,23 | 45,05 |
| 17 | 26.01.2008 | 52,33 | S | 18,16 | W | 4 | 83,8 | 1,20 | 26,43 |
| 37 | 24.02.2008 | 50,04 | S | 15,02 | E | 12 | 242,0 | 3,32 | 14,43 |
| 56 | 14.03.2008 | 52,51 | S | 7,53 | E | 1 | 41,0 | 0,44 | 188,87 |
| 58 | 17.03.2008 | 45,20 | S | 7,65 | E | 8 | 174,0 | 10,17 | 19,92 |
| 59 | 17.03.2008 | 45,11 | S | 7,66 | E | 1 | 29,0 | 1,02 | 5,63 |
| 60 | 18.03.2008 | 43,29 | S | 8,40 | E | 1 | 1,6 | 110,70 | 332,36 |
2.10 - Scopelarchidae
2.10.1 - Benthalbella elongata (Norman, 1937)

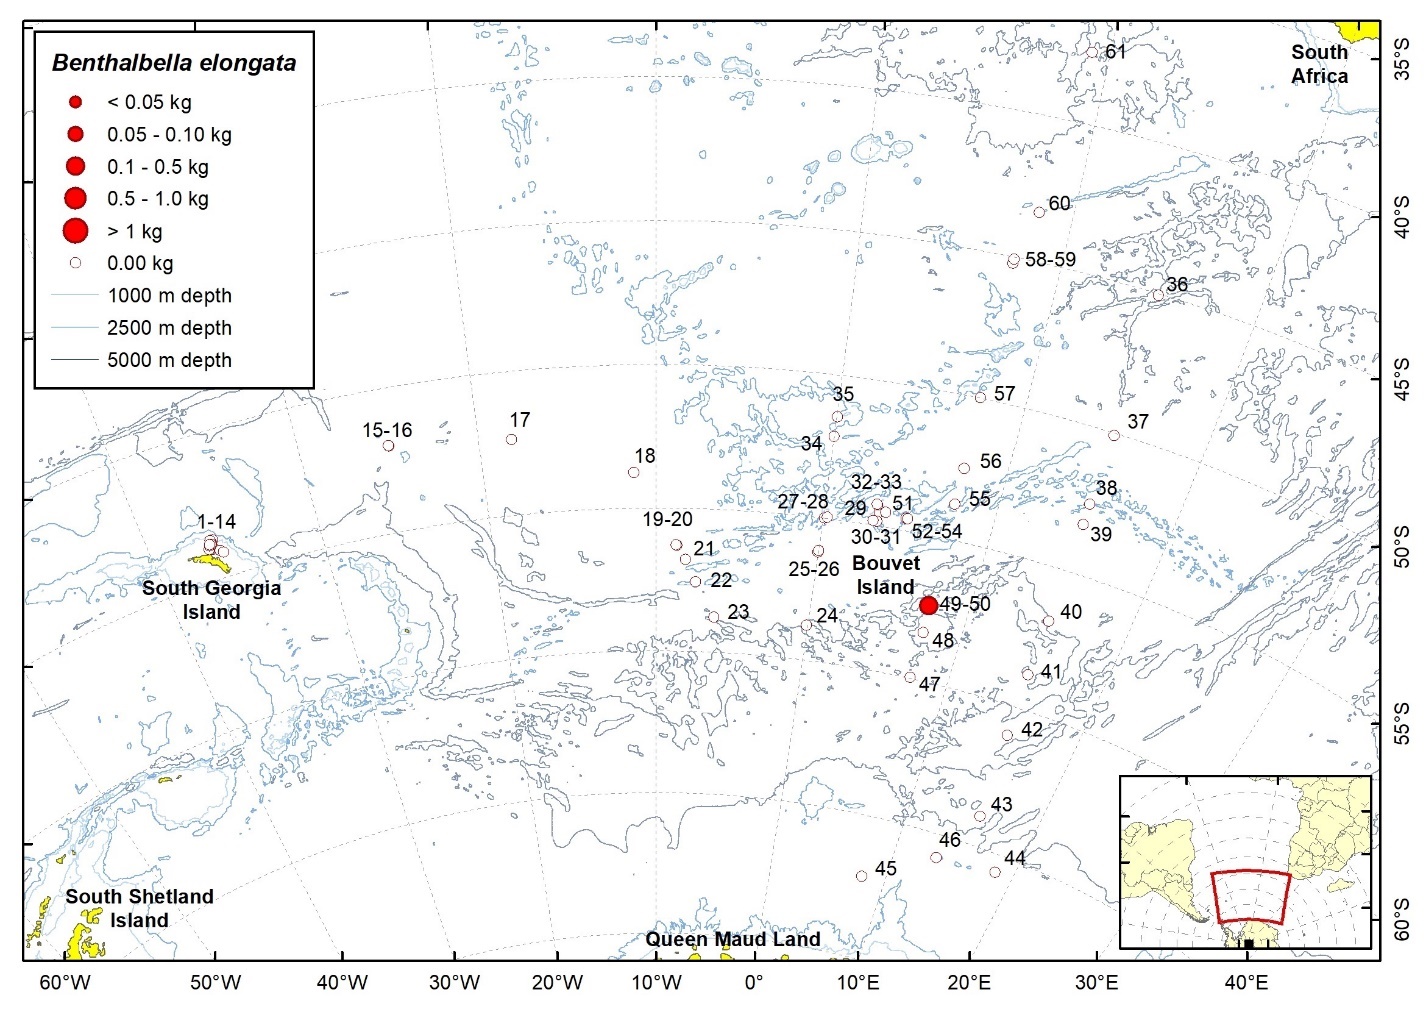
| Station | Date | Latitude | Longitude | Ind. caught | W (g) | TW fish (kg) | TW catch (kg) | ||
| 50 | 08.03.2008 | 57,39 | S | 7,44 | E | 1 | 103,0 | 26,34 | 31,75 |
2.10.2 - Lagiacrusichthys macropinna (Bussing & Bussing, 1966)
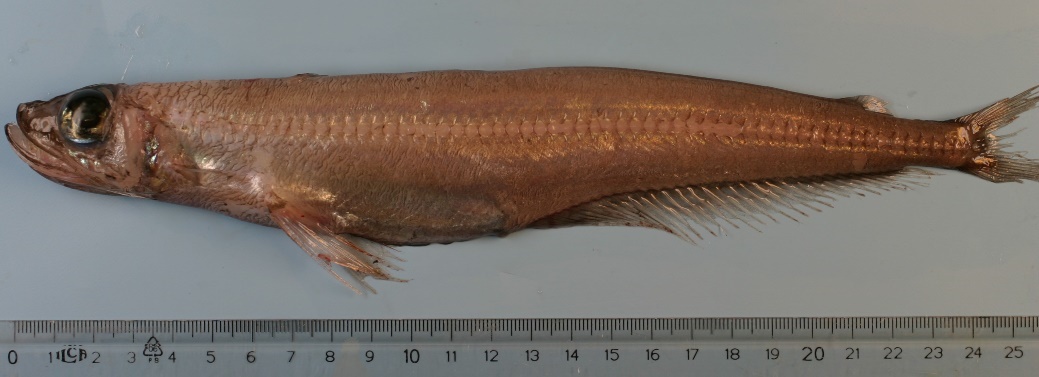
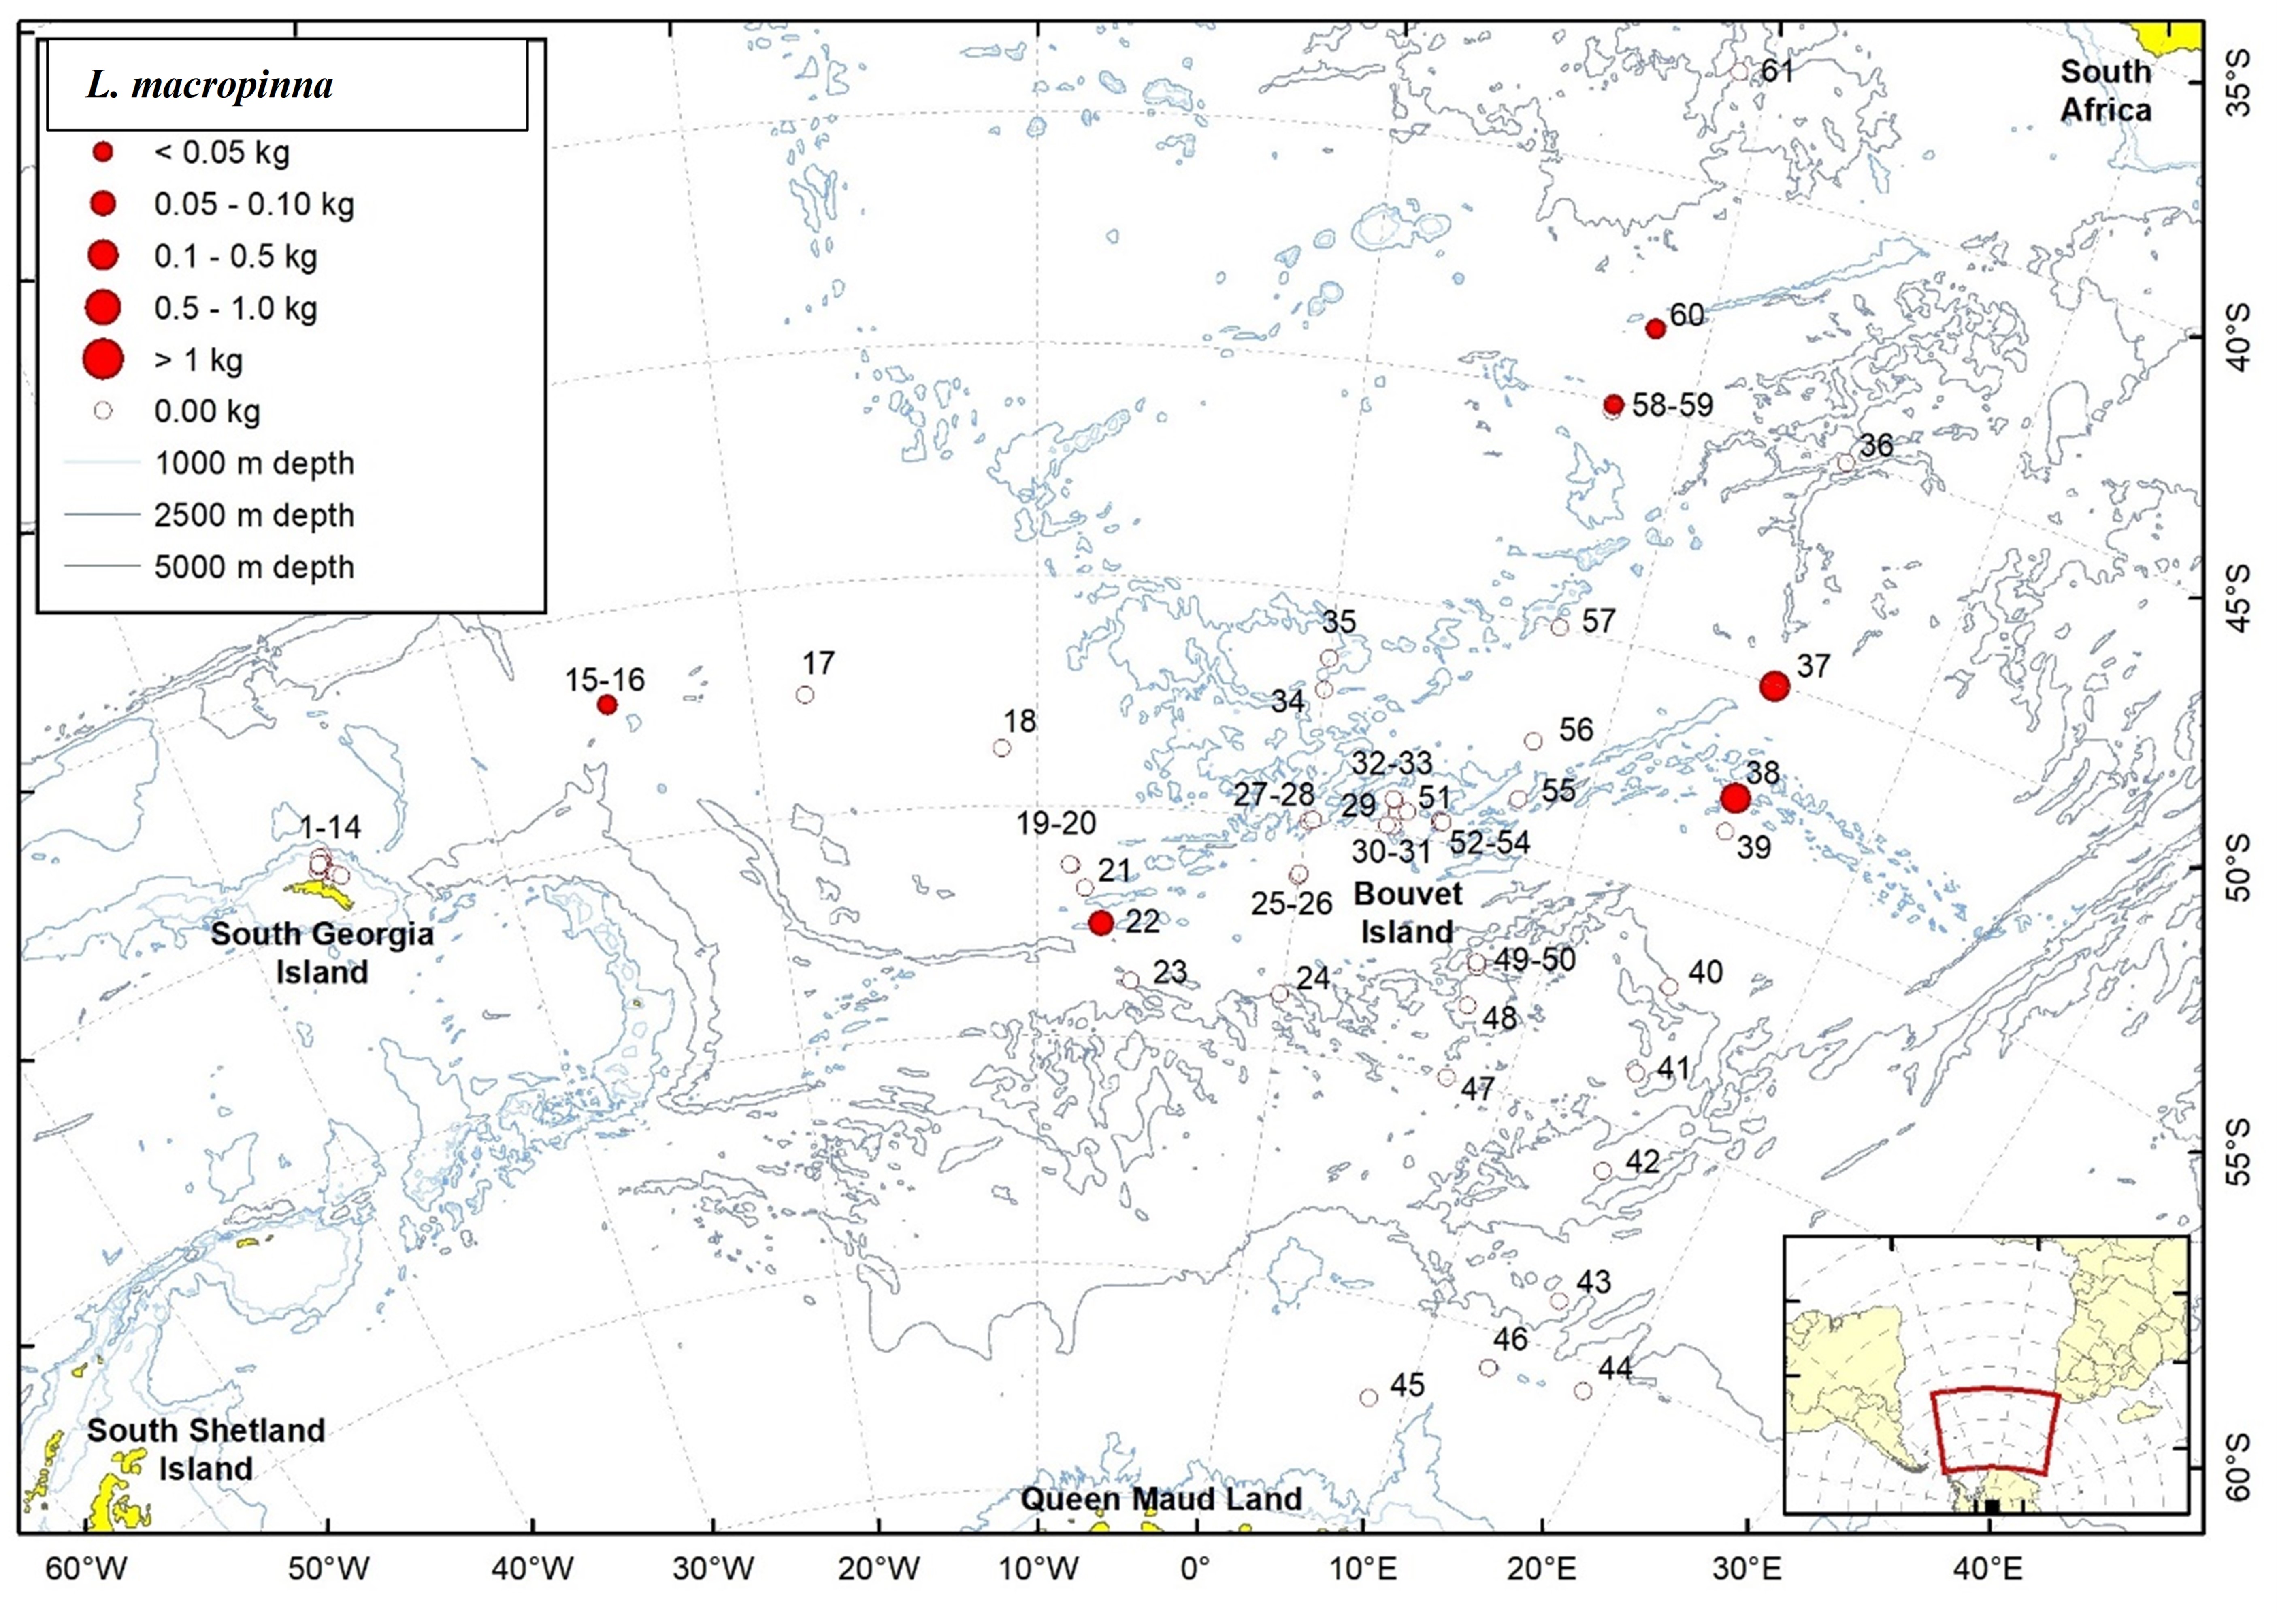
| Station | Date | Latitude | Longitude | Ind. caught | W (g) | TW fish (kg) | TW catch (kg) | ||
| 16 | 24.01.2008 | 51,99 | S | 25,00 | W | 1 | 41,1 | 3,23 | 45,05 |
| 22 | 30.01.2008 | 57,53 | S | 7,49 | W | 1 | 73,6 | 0,67 | 20,43 |
| 37 | 24.02.2008 | 50,04 | S | 15,02 | E | 2 | 138,0 | 3,32 | 14,43 |
| 38 | 25.02.2008 | 52,55 | S | 14,99 | E | 3 | 180,0 | 3,66 | 49,50 |
| 59 | 17.03.2008 | 45,11 | S | 7,66 | E | 21 | 34,4 | 1,02 | 5,63 |
| 60 | 18.03.2008 | 43,29 | S | 8,40 | E | 1 | 2,0 | 110,70 | 332,36 |
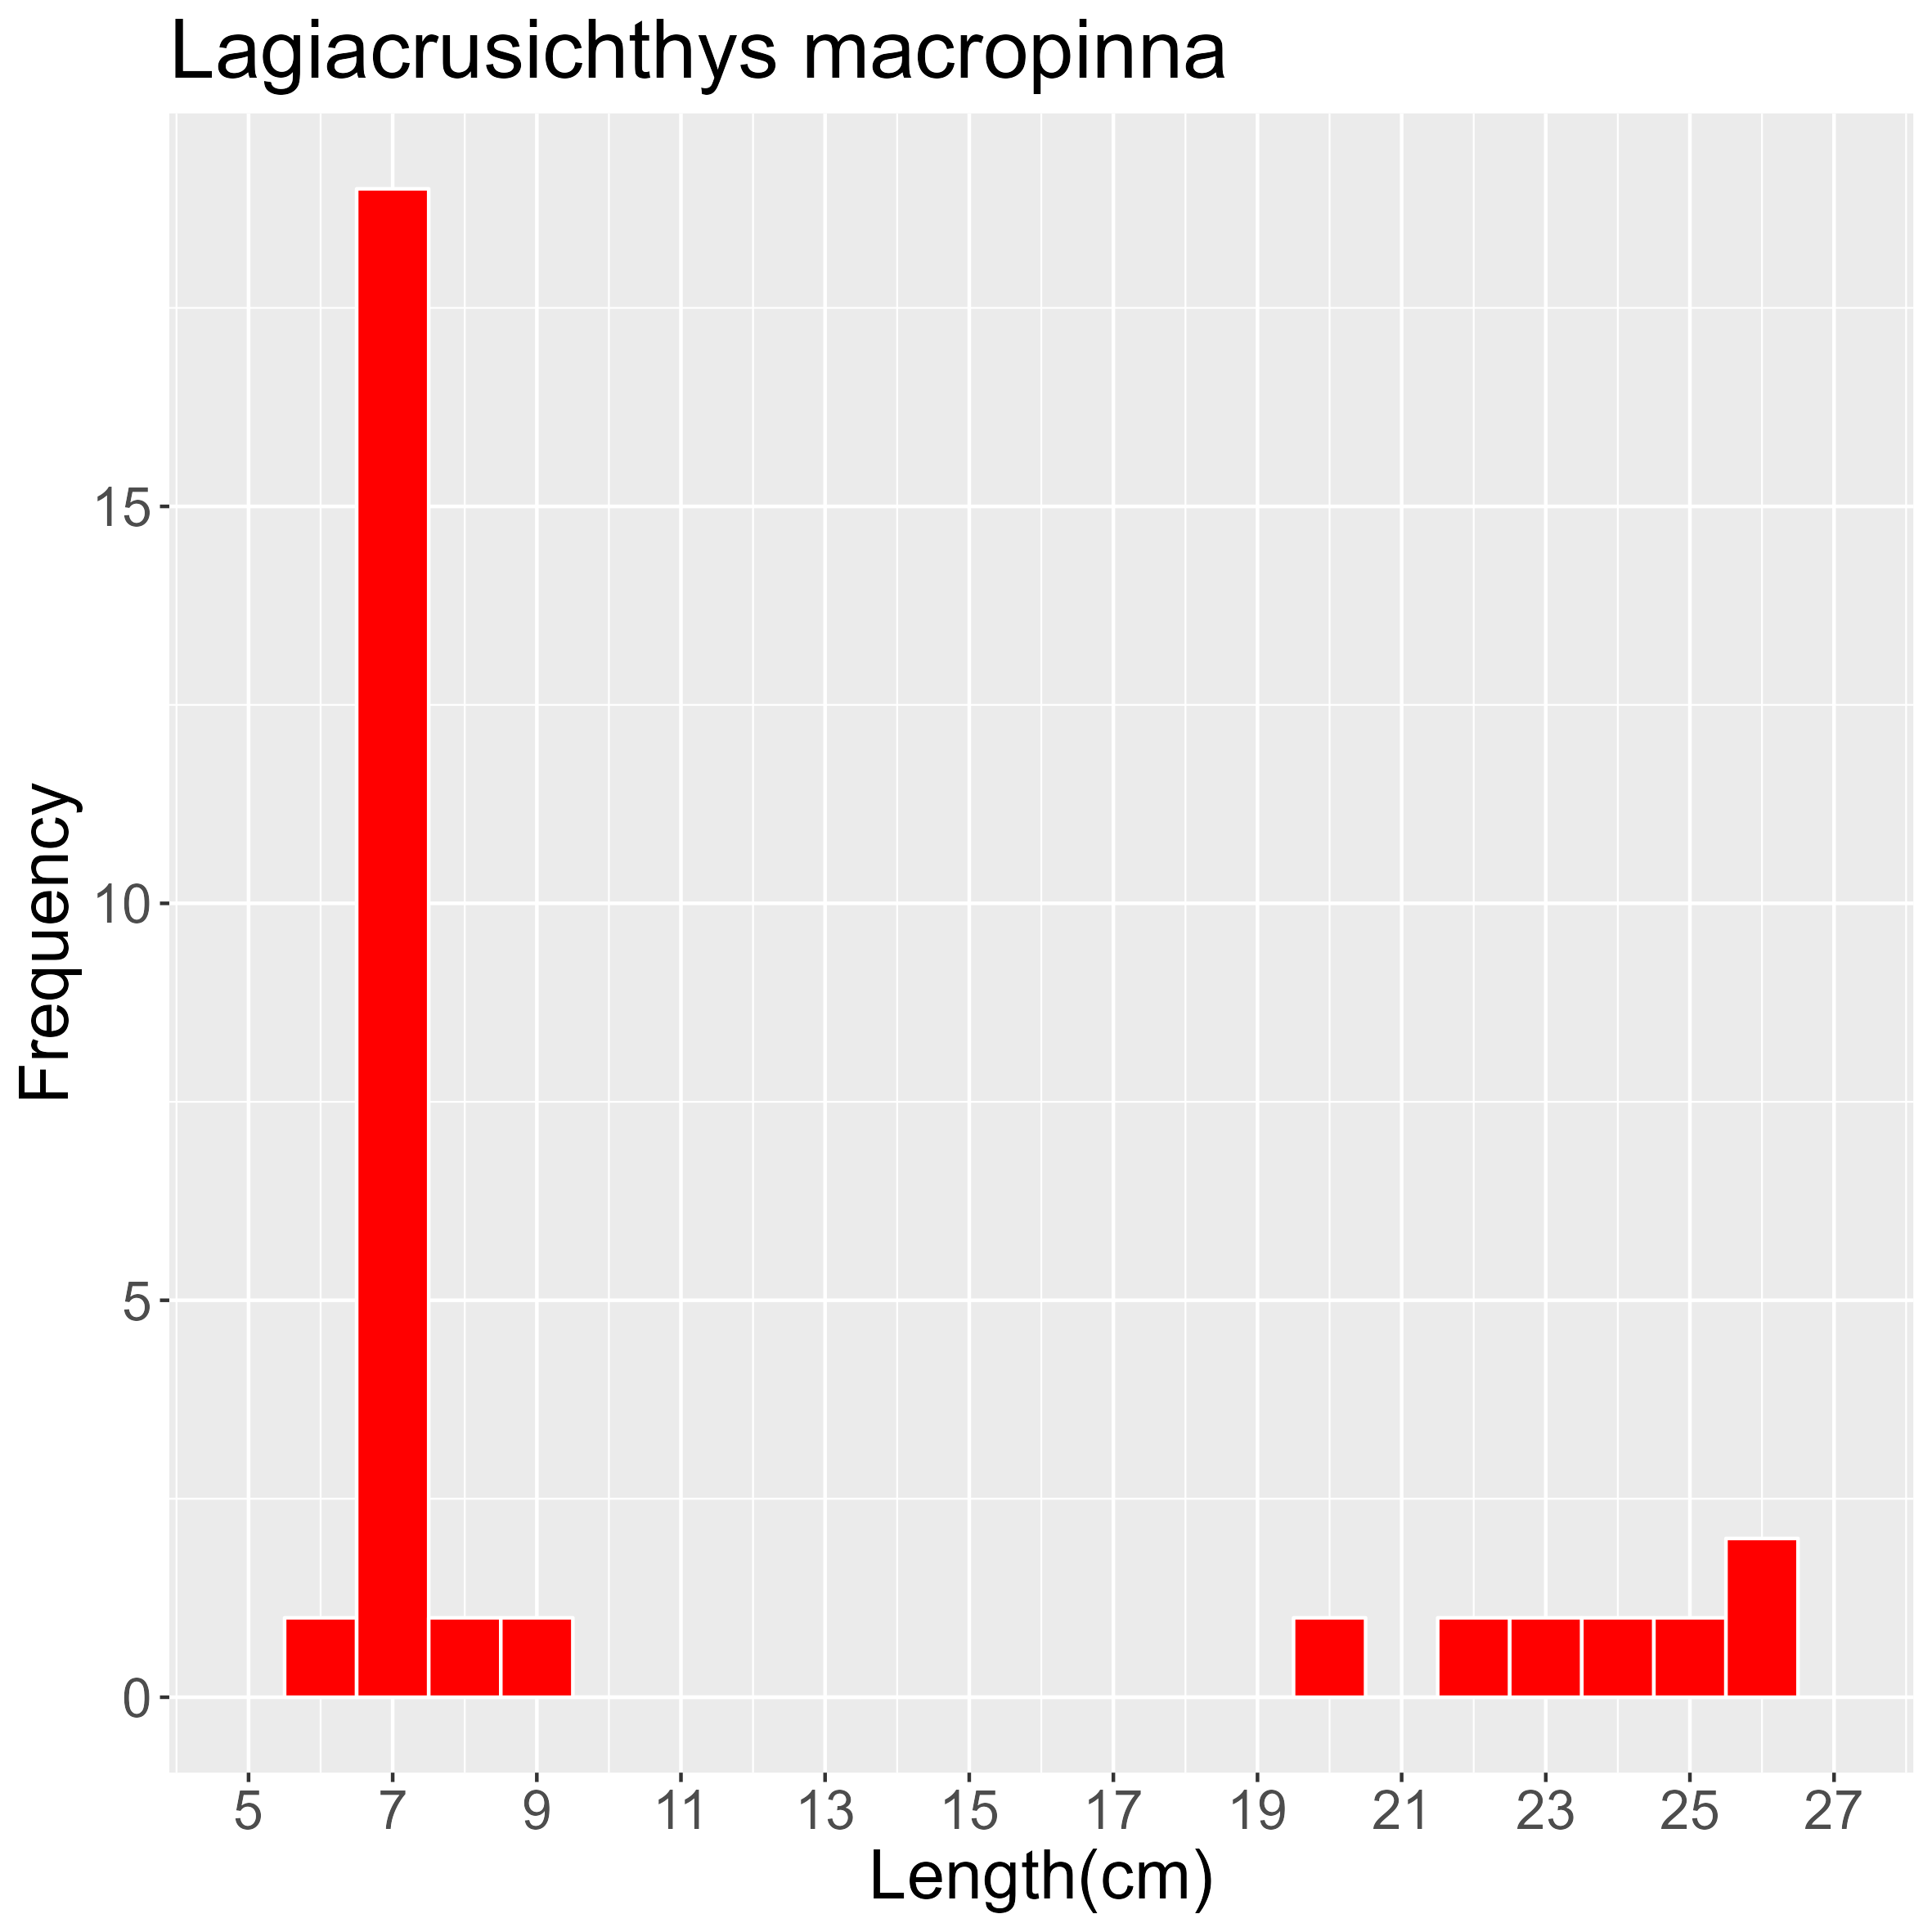
2.11 - Paralepididae
2.11.1 - Magnisudis prionosa (Rofen, 1963)
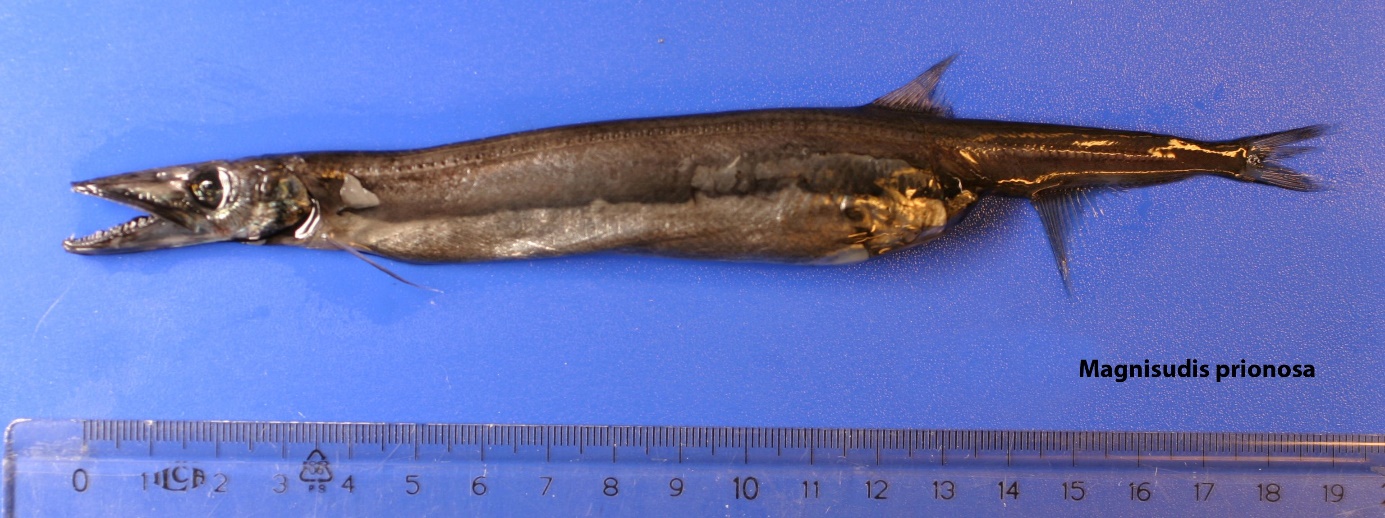
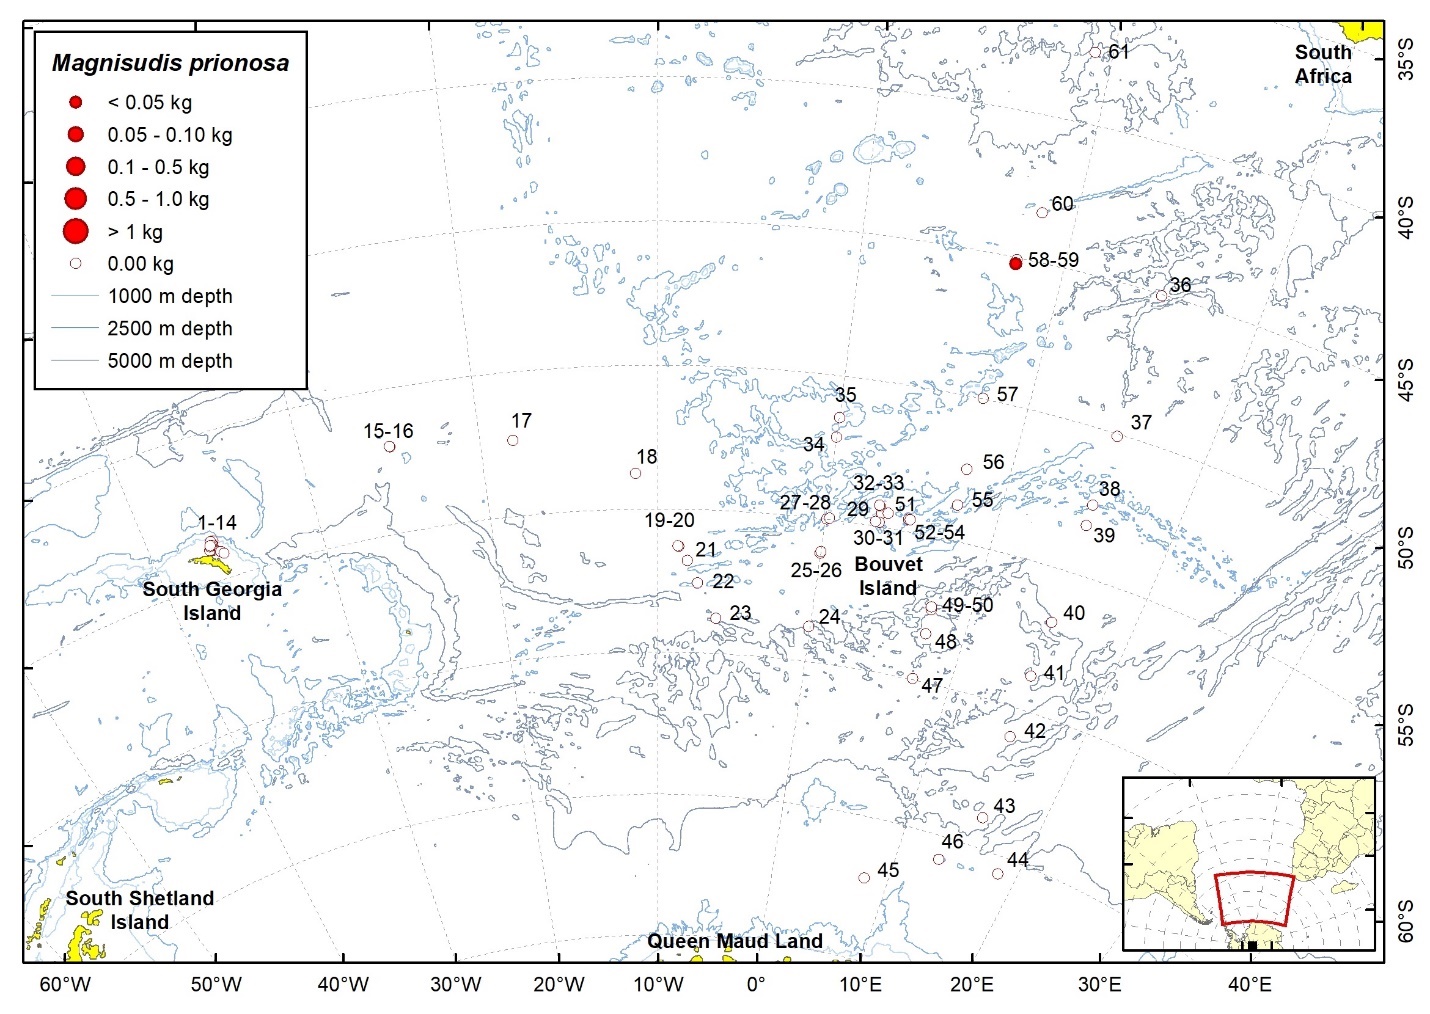
| Station | Date | Latitude | Longitude | Ind. caught | W (g) | TW fish (kg) | TW catch (kg) | ||
| 58 | 17.03.2008 | 45,20 | S | 7,65 | E | 1 | 18,0 | 10,17 | 19,92 |
2.11.2 - Notolepis annulata Post, 1978

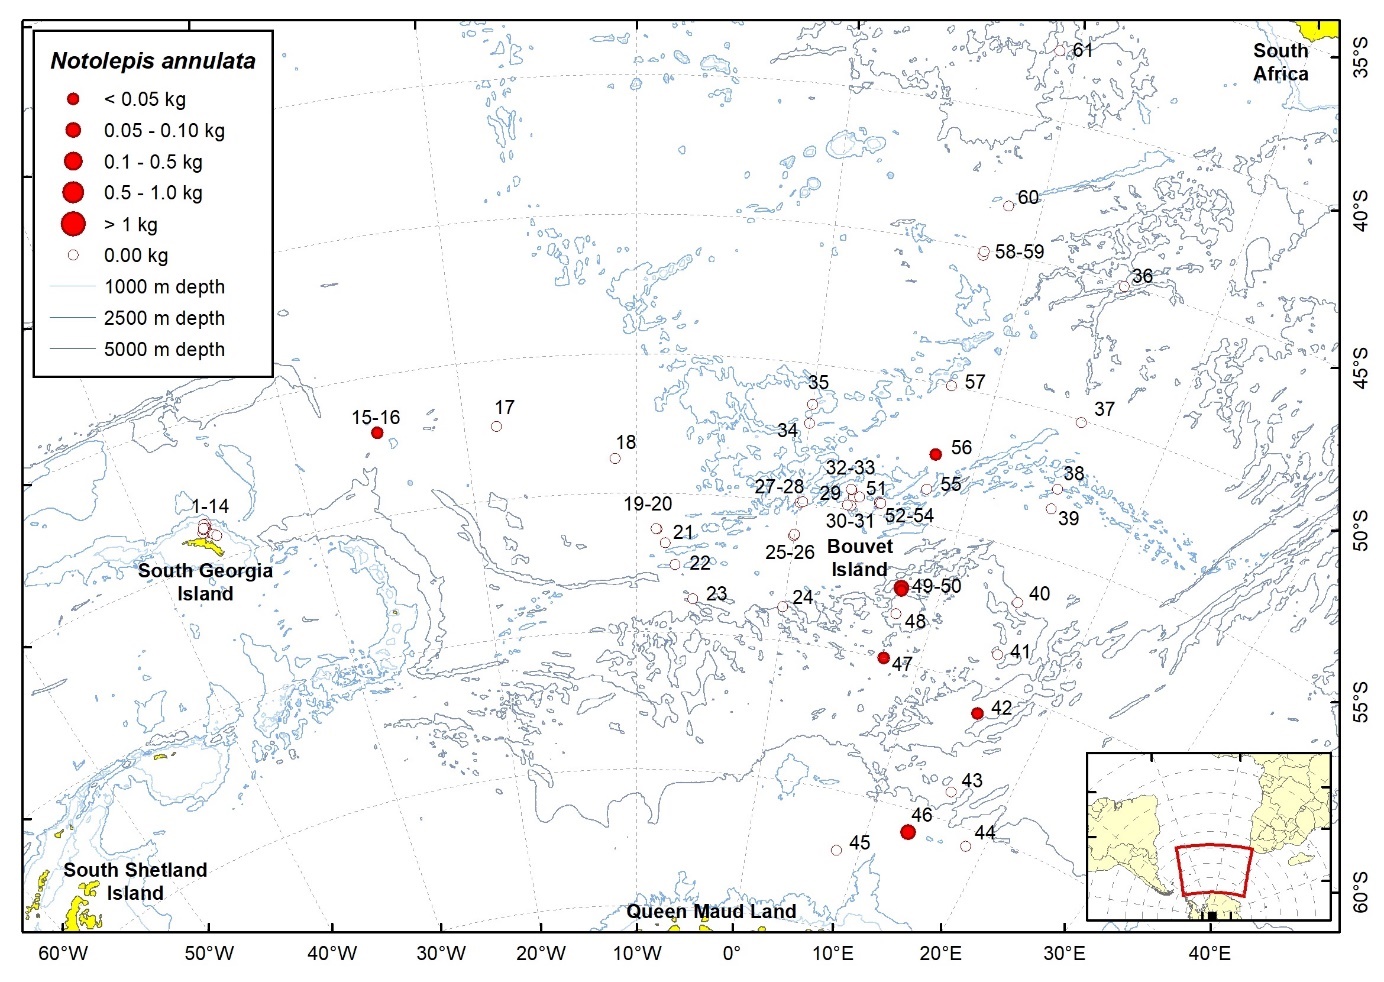
| Station | Date | Latitude | Longitude | Ind. caught | W (g) | TW fish (kg) | TW catch (kg) | ||
| 15 | 24.01.2008 | 52,00 | S | 25,01 | W | 1 | 13,0 | 1,28 | 28,00 |
| 42 | 28.02.2008 | 60,98 | S | 15,13 | E | 23 | 42,5 | 0,59 | 50,67 |
| 46 | 05.03.2008 | 65,80 | S | 13,38 | E | 94 | 72,2 | 1,59 | 32,17 |
| 47 | 07.03.2008 | 59,98 | S | 7,47 | E | 1 | 8,0 | 1,58 | 44,63 |
| 49 | 08.03.2008 | 57,49 | S | 7,49 | E | 1 | 3,0 | 0,00 | 46,36 |
| 50 | 08.03.2008 | 57,39 | S | 7,44 | E | 11 | 96,0 | 26,34 | 31,75 |
| 56 | 14.03.2008 | 52,45 | S | 7,56 | E | 9 | 4,6 | 0,44 | 188,87 |
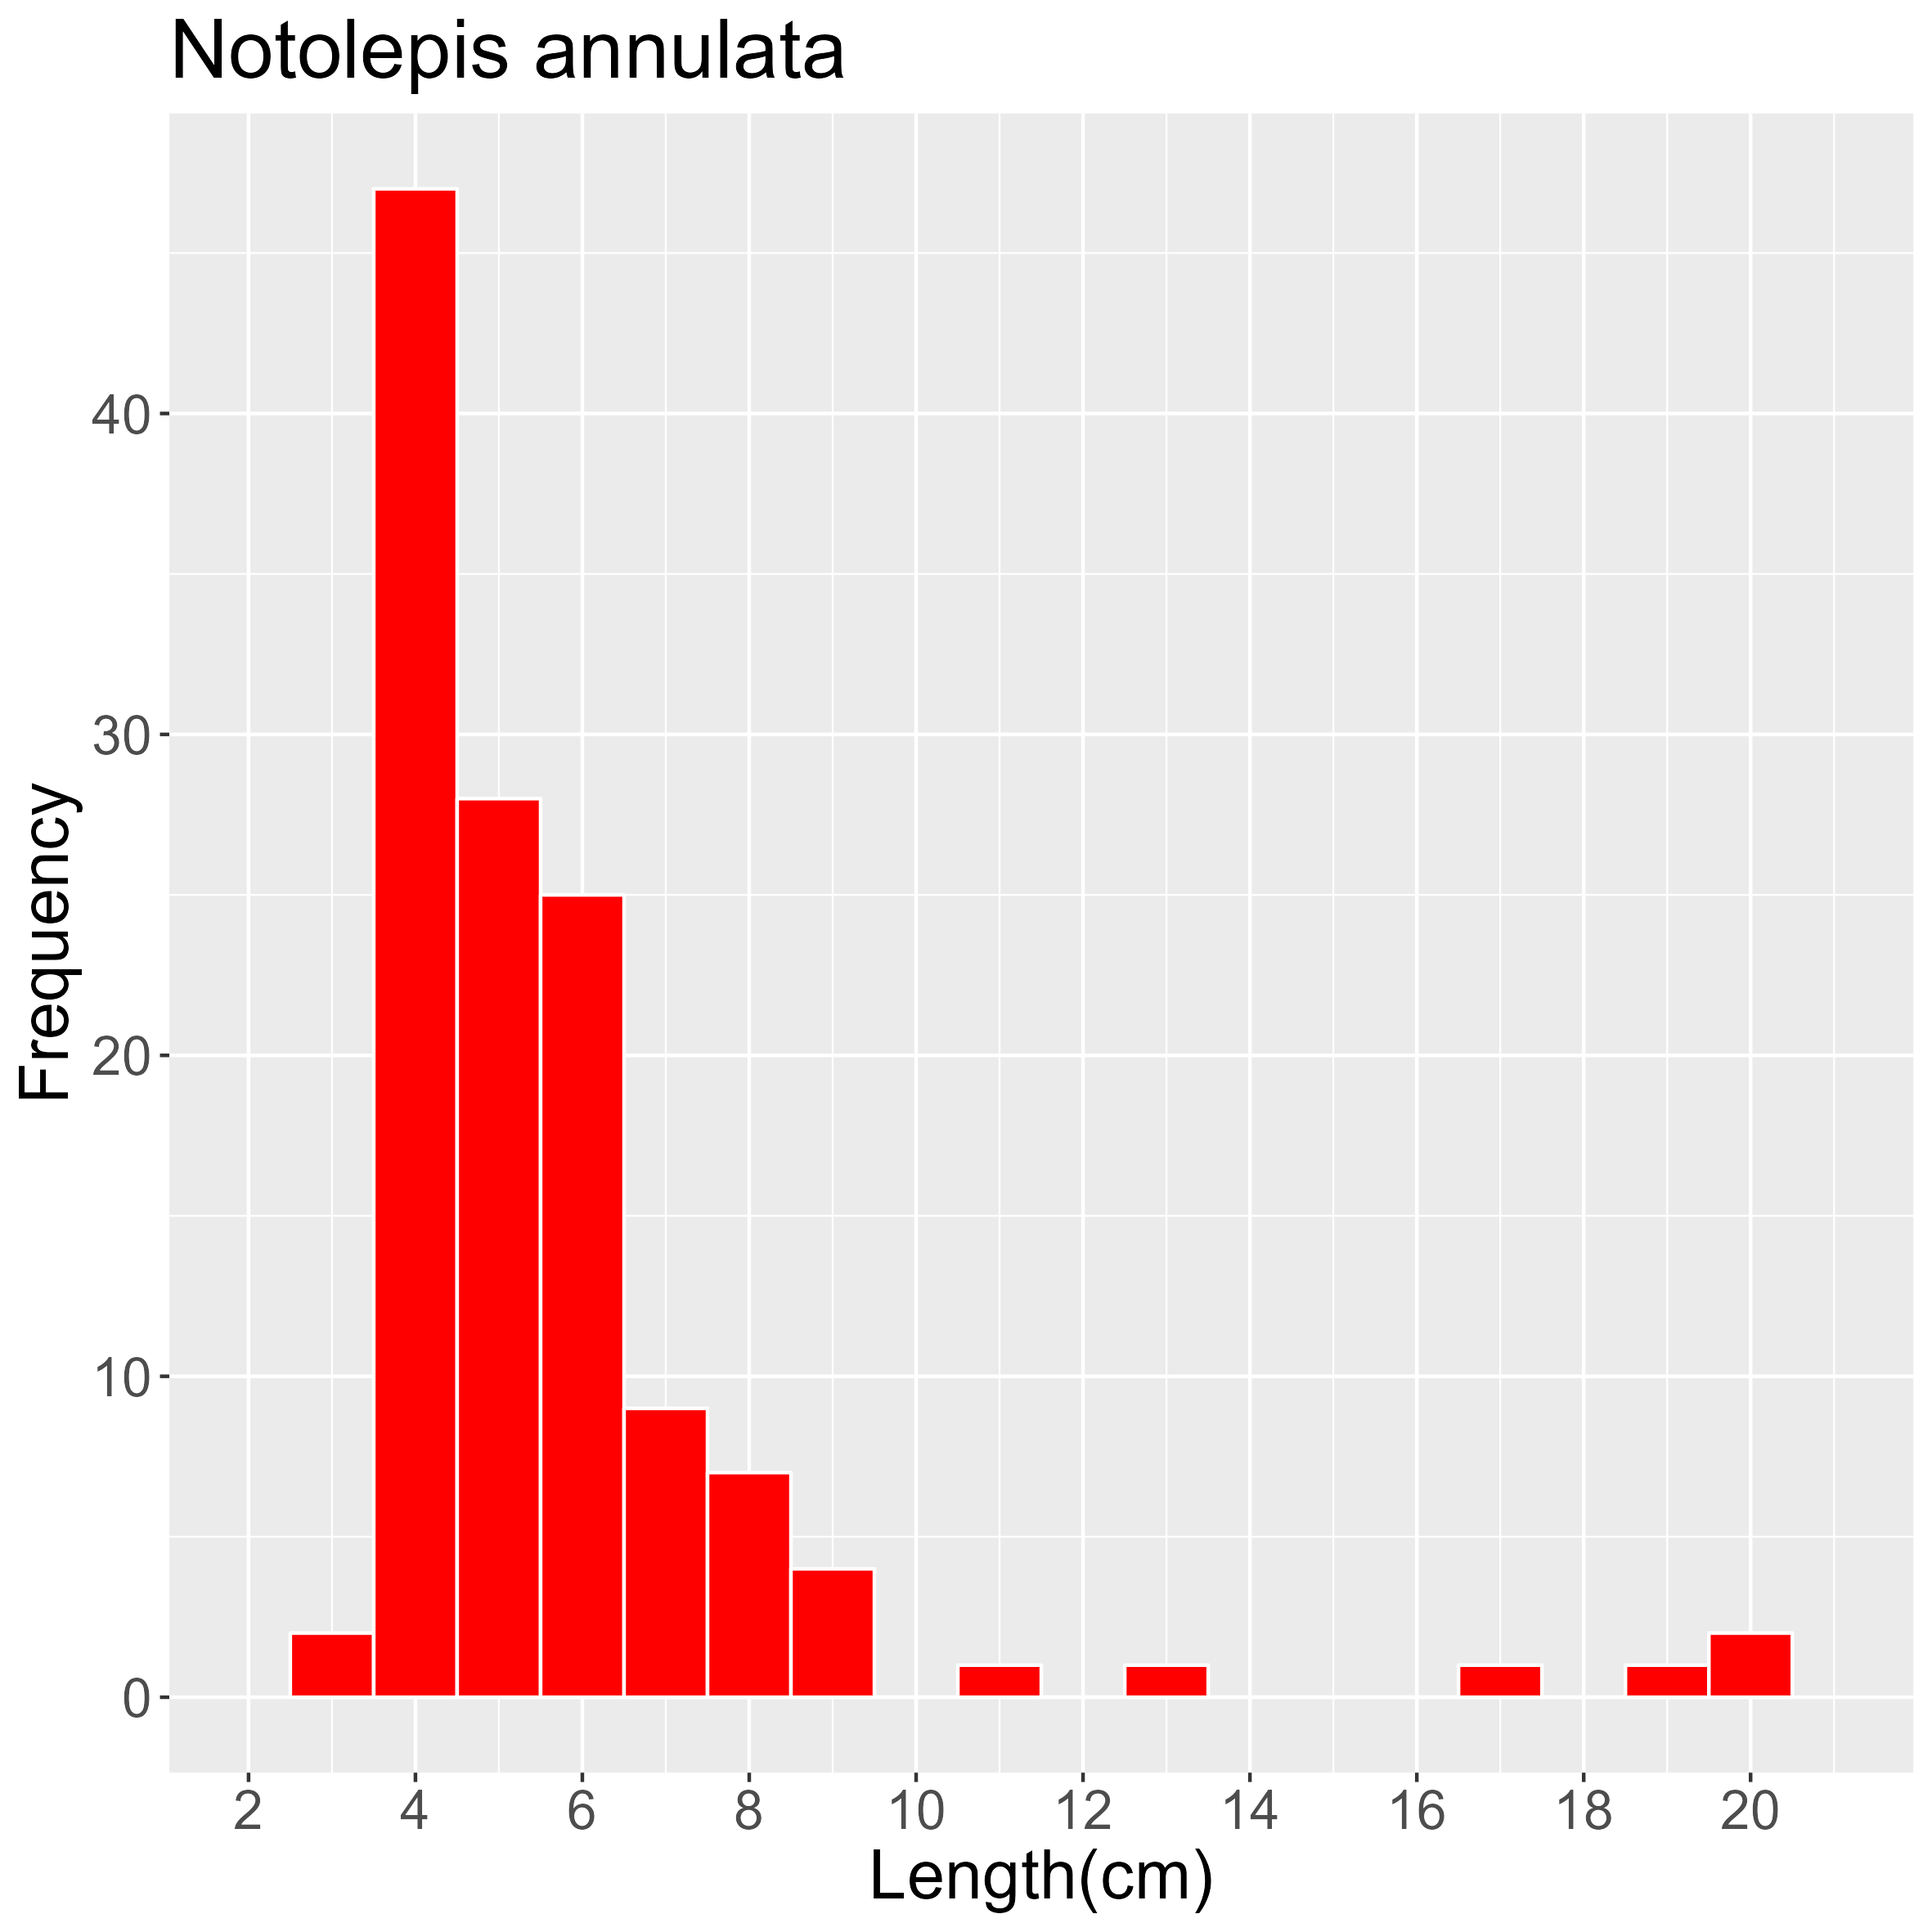
2.11.3 - Notolepis coatsorum Dollo, 1908

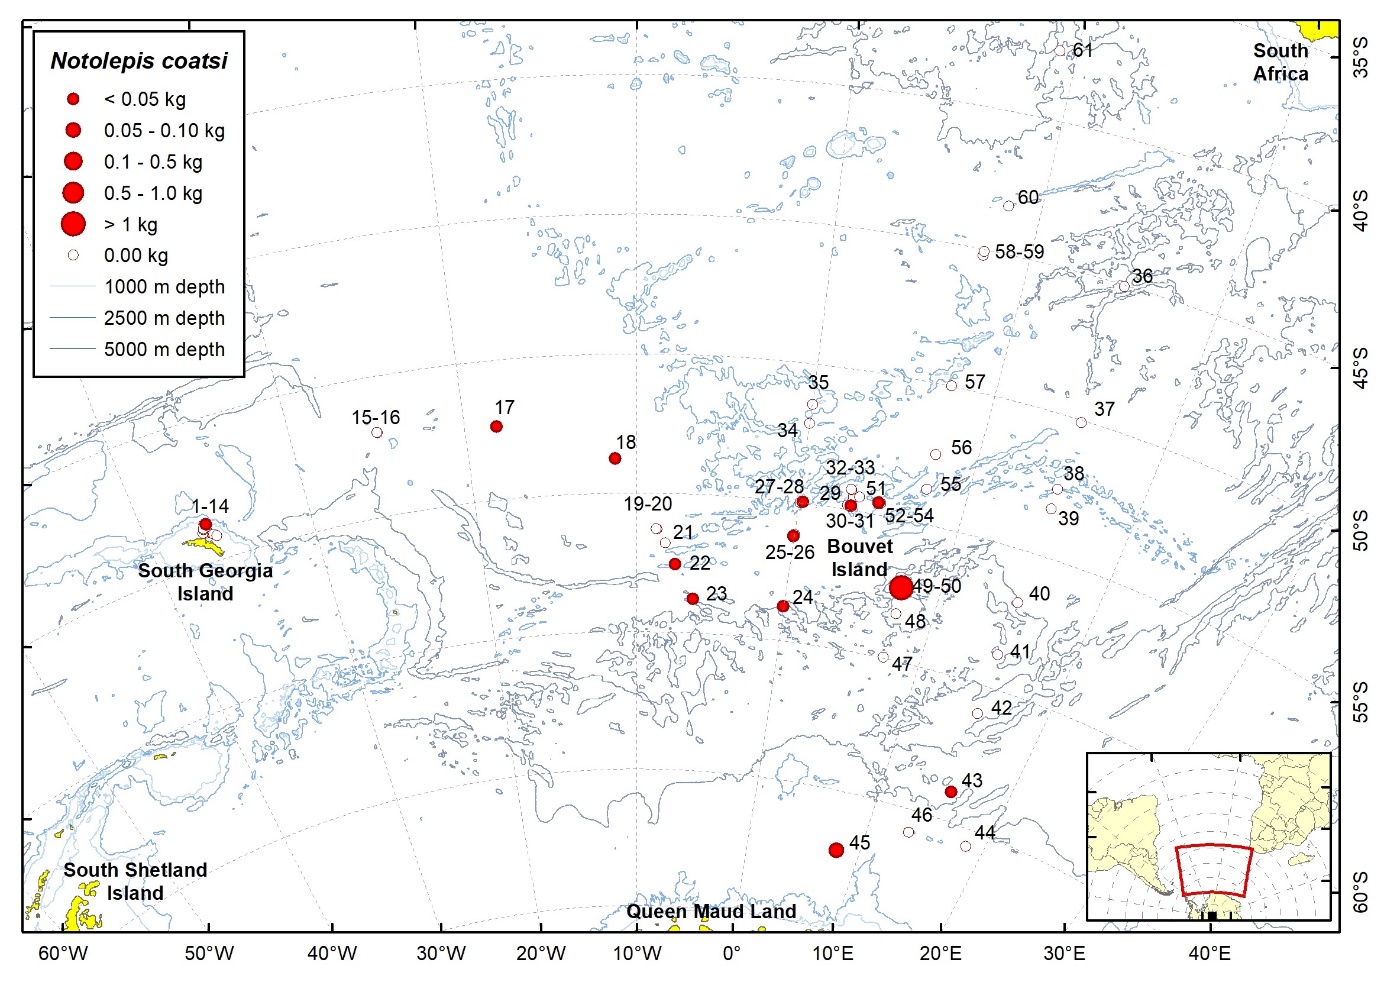
| Station | Date | Latitude | Longitude | Ind. caught | W (g) | TW fish (kg) | TW catch (kg) | ||
| 4 | 20.01.2008 | 53,64 | S | 36,27 | W | 2 | 1,5 | 0,42 | 4,32 |
| 17 | 26.01.2008 | 52,33 | S | 18,16 | W | 15 | 4,3 | 1,20 | 26,43 |
| 18 | 27.01.2008 | 53,75 | S | 11,29 | W | 10 | 1,0 | 3,07 | 24,11 |
| 22 | 30.01.2008 | 57,53 | S | 7,49 | W | 1 | 1,2 | 0,67 | 20,43 |
| 23 | 30.01.2008 | 58,76 | S | 6,22 | W | 19 | 34,0 | 4,14 | 13,02 |
| 24 | 31.01.2008 | 58,76 | S | 0,04 | W | 7 | 10,0 | 1,49 | 29,02 |
| 25 | 01.02.2008 | 56,21 | S | 0,05 | W | 3 | 6,0 | 0,18 | 44,71 |
| 28 | 02.02.2008 | 54,94 | S | 0,25 | E | 10 | 4,5 | 0,47 | 89,03 |
| 30 | 03.02.2008 | 54,84 | S | 3,19 | E | 15 | 5,9 | 1,44 | 273,78 |
| 43 | 28.02.2008 | 63,96 | S | 15,52 | E | 3 | 15,0 | 0,11 | 184,07 |
| 45 | 02.03.2008 | 67,12 | S | 7,95 | E | 7 | 68,0 | 0,07 | 3,91 |
| 50 | 08.03.2008 | 57,39 | S | 7,44 | E | 44 | 1844,0 | 26,34 | 31,75 |
| 53 | 12.03.2008 | 54,57 | S | 4,83 | E | 1 | 0,1 | 0,07 | 4,33 |
2.12 - Anotopteridae
2.12.1 - Anotopterus vorax (Regan, 1913)
| Station | Date | Latitude | Longitude | Ind. caught | W (g) | TW fish (kg) | TW catch (kg) | ||
| 50 | 08.03.2008 | 57,39 | S | 7,44 | E | 3 | 647,0 | 26,34 | 31,75 |
2.13 - Myctophidae
2.13.1 - Diaphus hudsoni Zurbrigg & Scott, 1976
| Station | Date | Latitude | Longitude | Ind. caught | W (g) | TW fish (kg) | TW catch (kg) | ||
| 36 | 22.02.2008 | 45,04 | S | 15,00 | E | 1 | 7,8 | 1,60 | 4,28 |
| 37 | 24.02.2008 | 50,04 | S | 15,02 | E | 1 | 2,0 | 3,32 | 14,43 |
2.13.2 - Electrona antarctica (Günther, 1878)
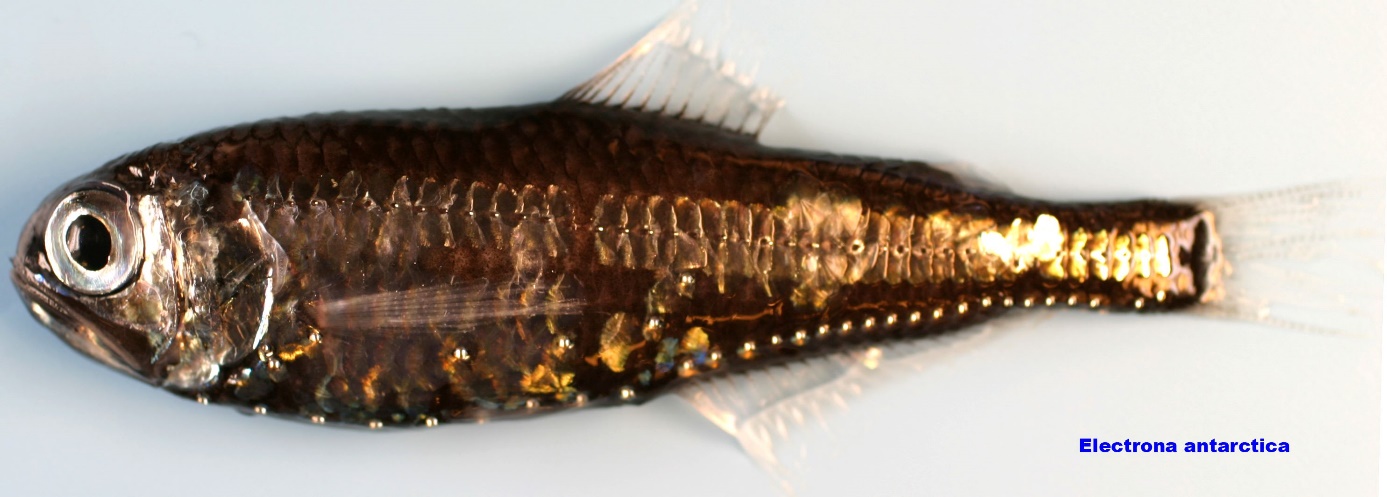
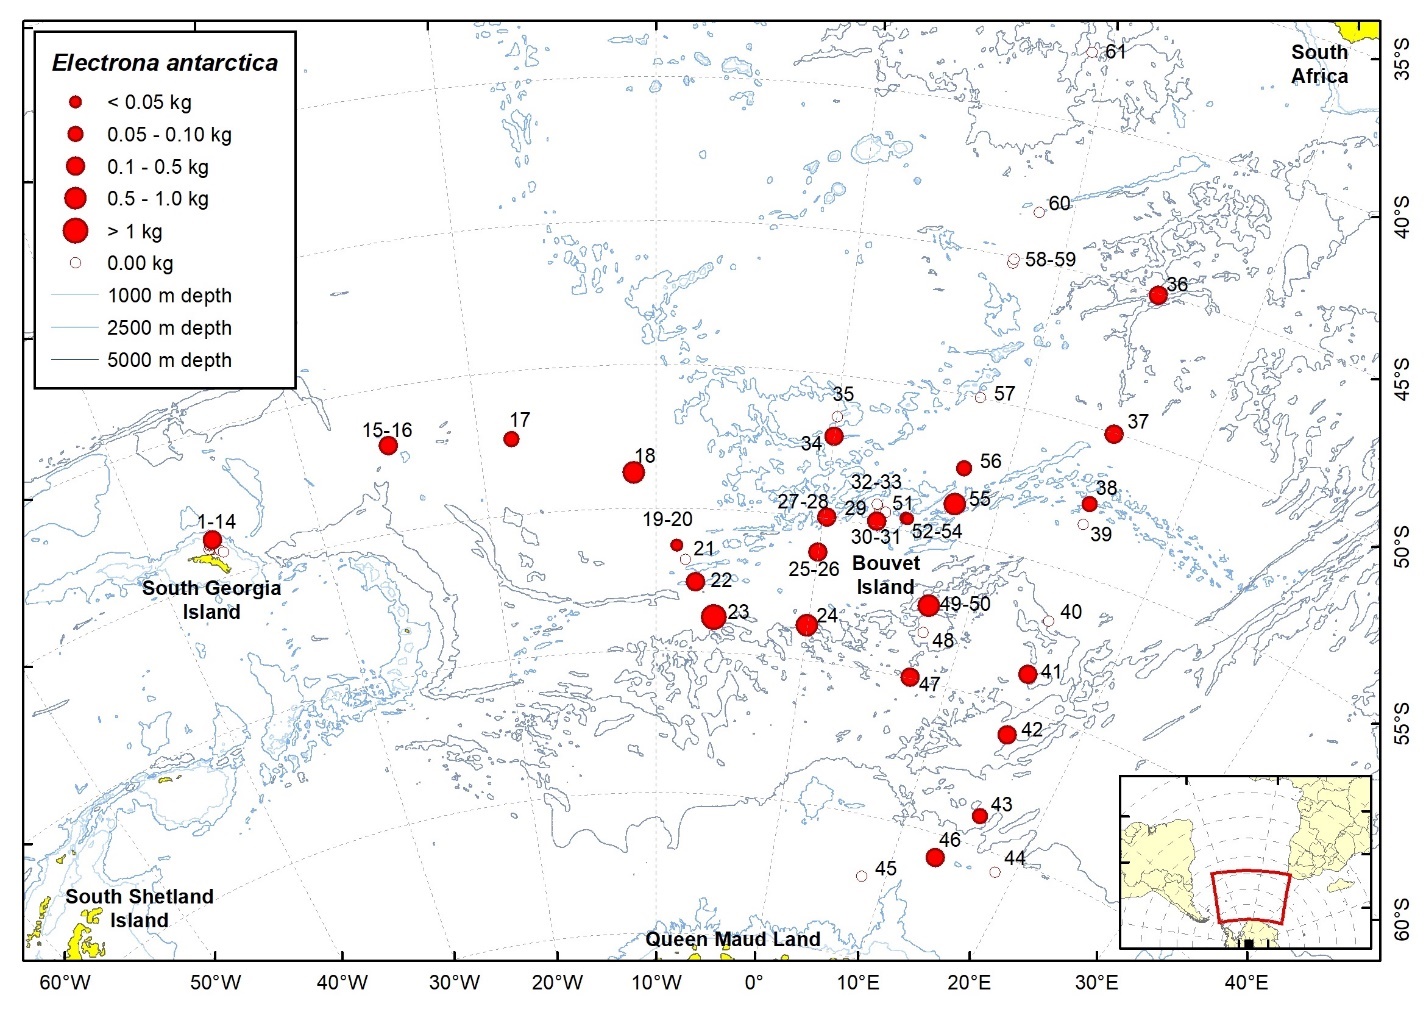
| Station | Date | Latitude | Longitude | Ind. caught | W (g) | TW fish (kg) | TW catch (kg) | ||
| 4 | 20.01.2008 | 53,64 | S | 36,27 | W | 97 | 251,7 | 0,42 | 4,32 |
| 16 | 24.01.2008 | 51,99 | S | 25,00 | W | 68 | 111,6 | 3,23 | 45,05 |
| 17 | 26.01.2008 | 52,33 | S | 18,16 | W | 19 | 69,4 | 1,20 | 26,43 |
| 18 | 27.01.2008 | 53,75 | S | 11,29 | W | 484 | 884,4 | 3,07 | 24,11 |
| 19 | 29.01.2008 | 56,28 | S | 8,71 | W | 4 | 11,8 | 0,16 | 49,45 |
| 22 | 30.01.2008 | 57,53 | S | 7,49 | W | 87 | 266,1 | 0,67 | 20,43 |
| 22 | 30.01.2008 | 57,53 | S | 7,49 | W | 24 | 88,5 | 0,67 | 20,43 |
| 23 | 30.01.2008 | 58,76 | S | 6,22 | W | 231 | 1085,1 | 4,14 | 13,02 |
| 24 | 31.01.2008 | 58,76 | S | 0,04 | W | 170 | 537,6 | 1,49 | 29,02 |
| 25 | 01.02.2008 | 56,21 | S | 0,05 | W | 63 | 135,5 | 0,18 | 44,71 |
| 28 | 02.02.2008 | 54,95 | S | 0,20 | E | 68 | 244,8 | 0,47 | 89,03 |
| 30 | 03.02.2008 | 54,84 | S | 3,23 | E | 211 | 411,0 | 1,44 | 273,78 |
| 34 | 06.02.2008 | 52,12 | S | 0,02 | W | 138 | 221,2 | 4,15 | 44,70 |
| 36 | 22.02.2008 | 45,03 | S | 15,00 | E | 466 | 230,3 | 1,60 | 4,28 |
| 37 | 24.02.2008 | 50,04 | S | 15,02 | E | 273 | 180,7 | 3,32 | 14,43 |
| 38 | 25.02.2008 | 52,55 | S | 14,99 | E | 73 | 98,2 | 3,66 | 49,50 |
| 41 | 27.02.2008 | 58,78 | S | 14,99 | E | 114 | 297,9 | 0,34 | 210,17 |
| 42 | 28.02.2008 | 60,98 | S | 15,13 | E | 187 | 244,0 | 0,59 | 50,67 |
| 43 | 28.02.2008 | 63,96 | S | 15,52 | E | 45 | 91,8 | 0,11 | 184,07 |
| 46 | 05.03.2008 | 65,80 | S | 13,38 | E | 130 | 212,3 | 1,59 | 32,17 |
| 47 | 07.03.2008 | 59,98 | S | 7,47 | E | 227 | 468,1 | 1,58 | 44,63 |
| 50 | 08.03.2008 | 57,39 | S | 7,44 | E | 75 | 661,6 | 26,34 | 31,75 |
| 53 | 12.03.2008 | 54,58 | S | 4,91 | E | 18 | 26,1 | 0,07 | 4,33 |
| 54 | 13.03.2008 | 54,58 | S | 4,98 | E | 1 | 4,0 | 0,26 | 85,64 |
| 55 | 13.03.2008 | 53,75 | S | 7,49 | E | 133 | 822,9 | 1,18 | 382,02 |
| 56 | 14.03.2008 | 52,45 | S | 7,56 | E | 114 | 64,7 | 0,44 | 188,87 |
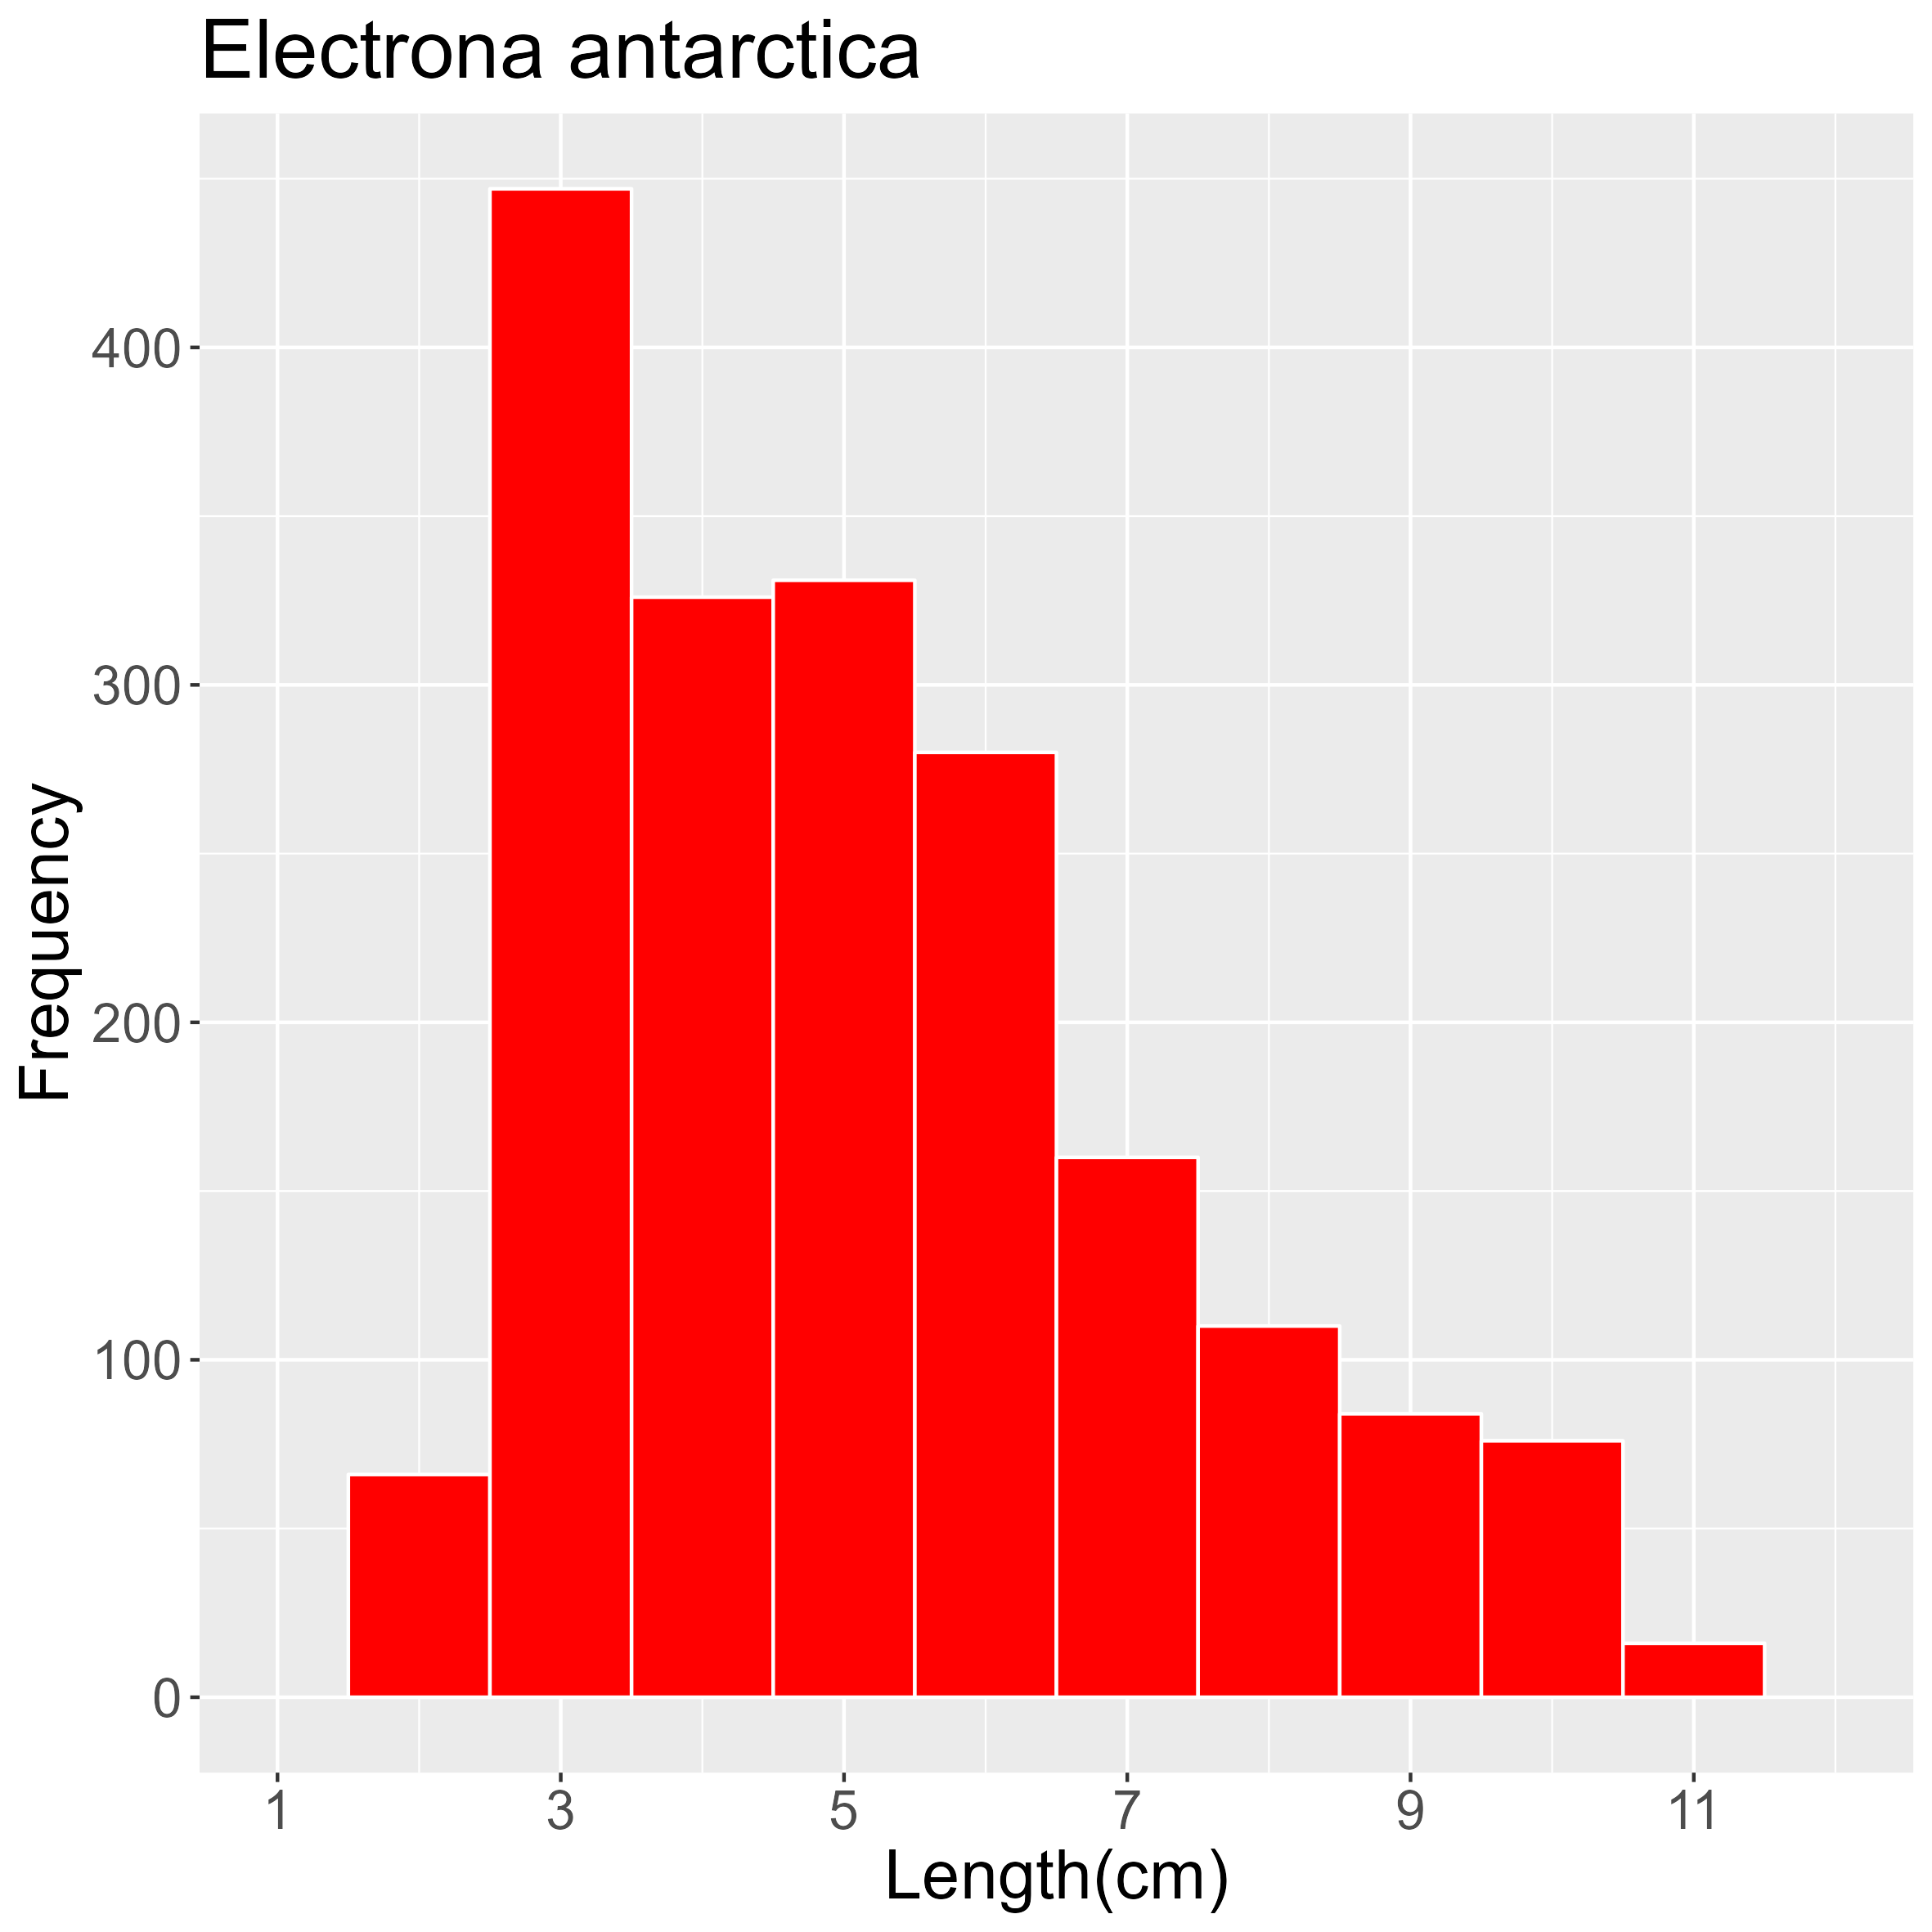
2.13.3 - Electrona carlsbergi (Tåning, 1932)

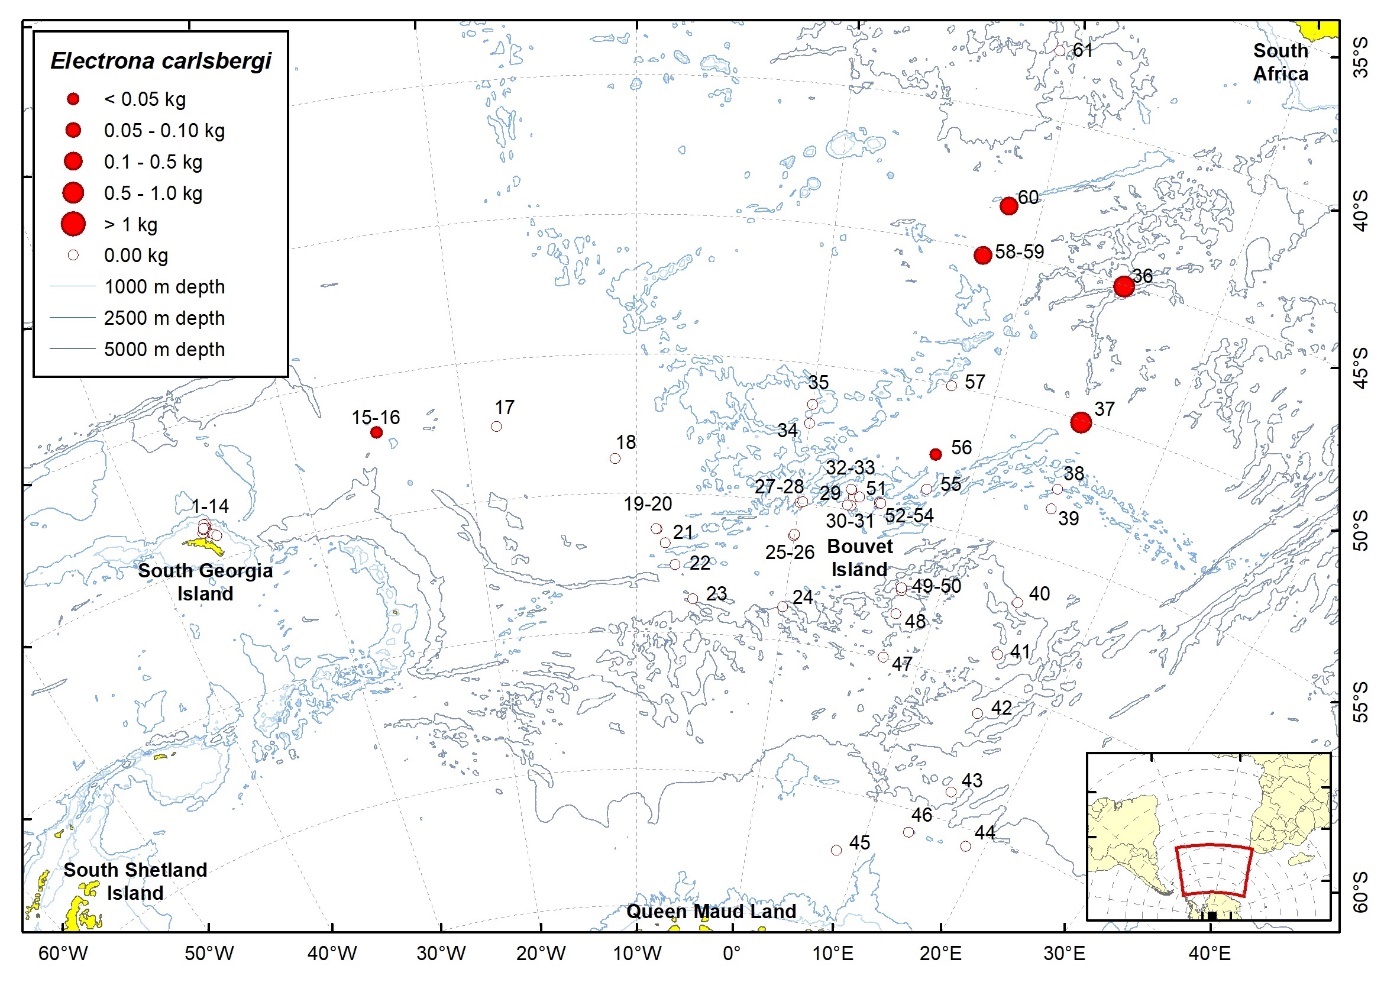
| Station | Date | Latitude | Longitude | Ind. caught | W (g) | TW fish (kg) | TW catch (kg) | ||
| 16 | 25.01.2008 | 51,98 | S | 25,05 | W | 1 | 6,6 | 3,23 | 45,05 |
| 36 | 22.02.2008 | 45,03 | S | 15,00 | E | 5045 | 788,5 | 1,60 | 4,28 |
| 37 | 24.02.2008 | 50,07 | S | 15,04 | E | 154 | 752,0 | 3,32 | 14,43 |
| 56 | 14.03.2008 | 52,49 | S | 7,54 | E | 1 | 18,7 | 0,44 | 188,87 |
| 58 | 17.03.2008 | 45,20 | S | 7,65 | E | 16 | 157,0 | 10,17 | 19,92 |
| 60 | 18.03.2008 | 43,29 | S | 8,40 | E | 498 | 160,3 | 110,70 | 332,36 |
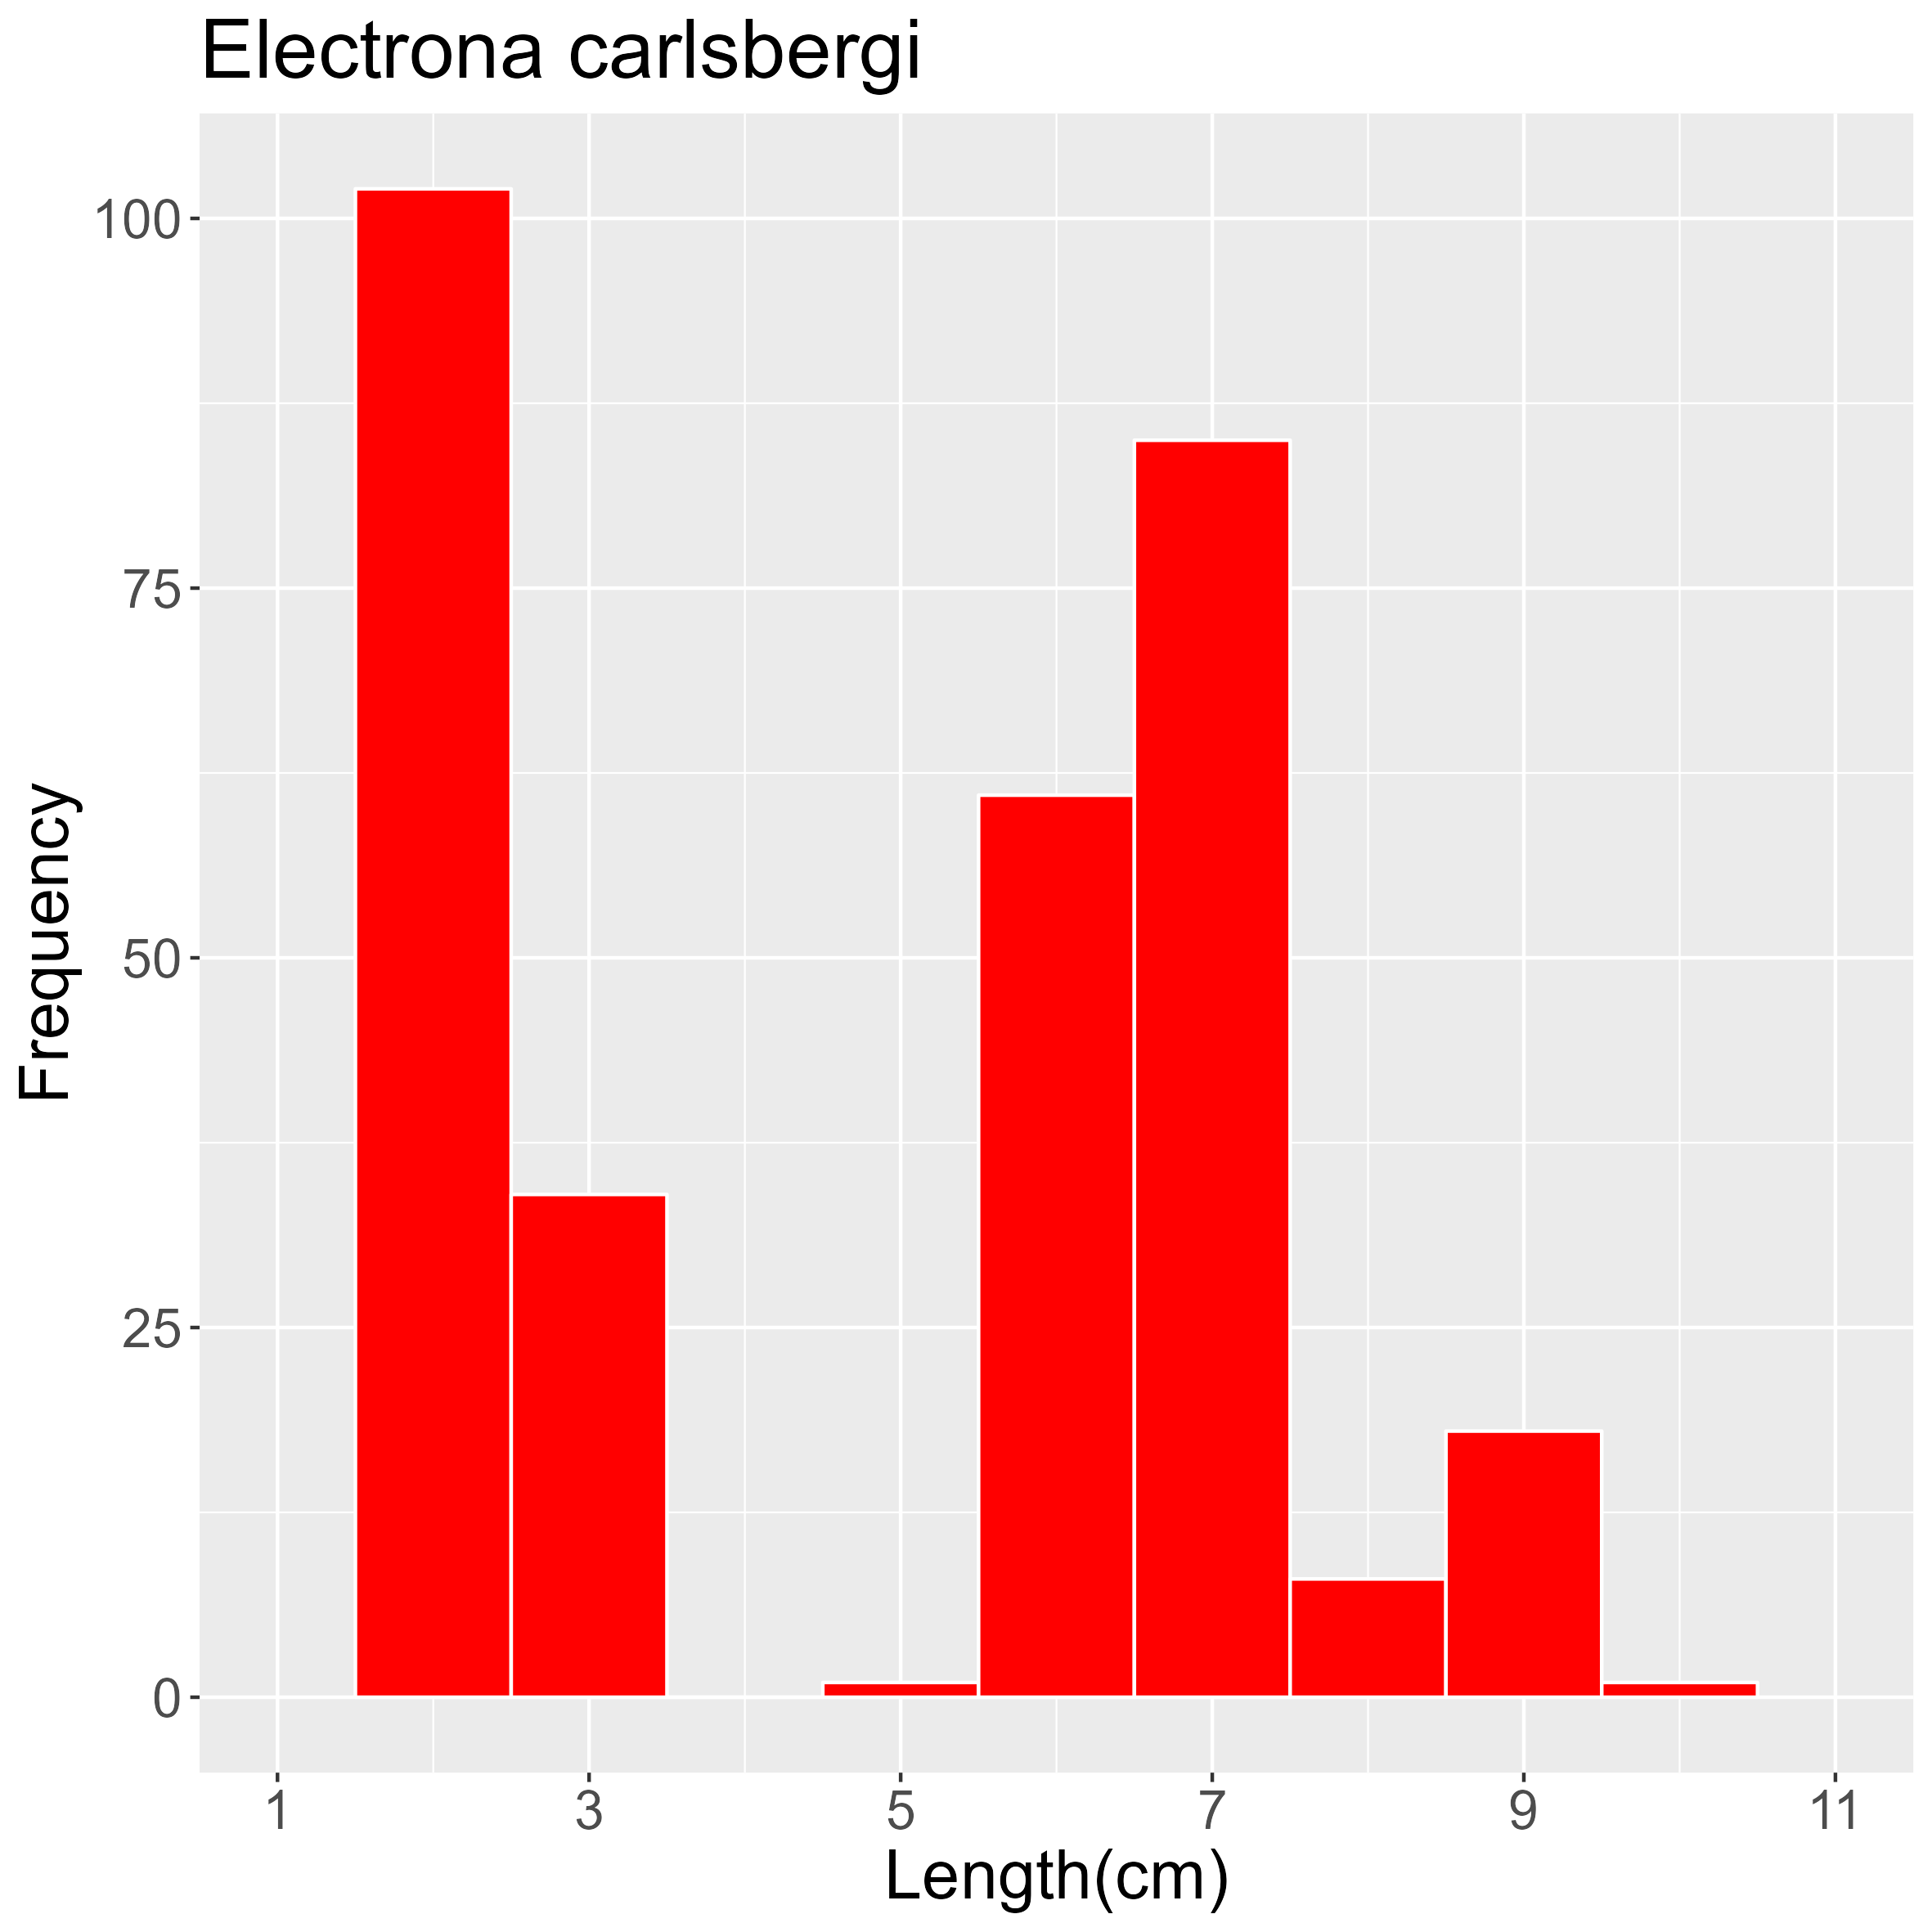
2.13.4 - Electrona paucirastra Bolin, 1962

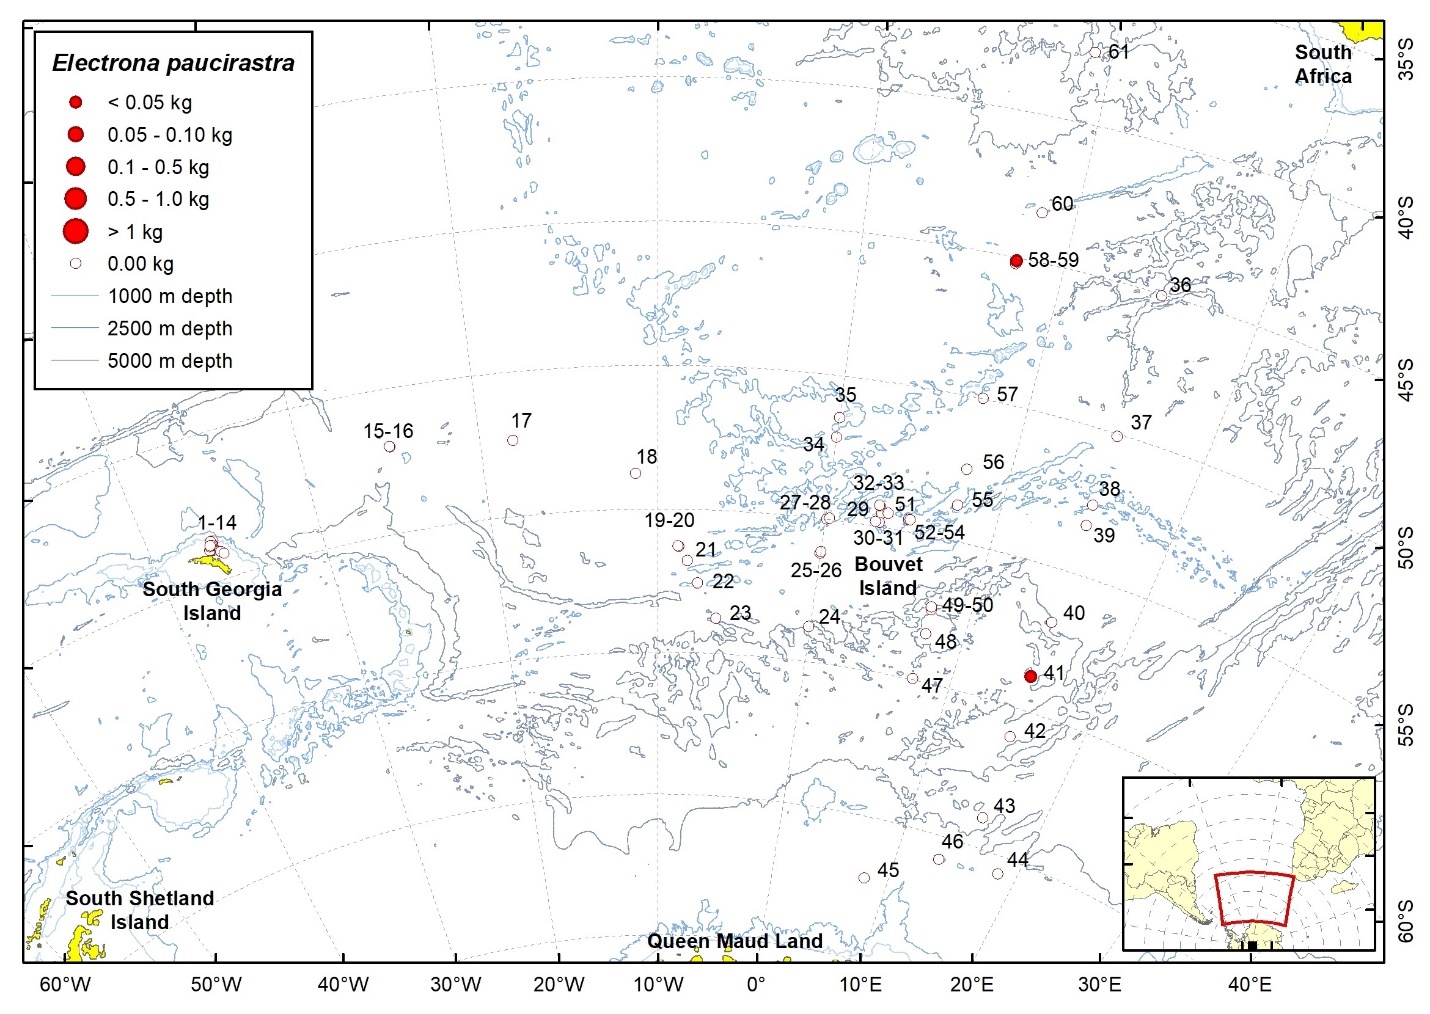
| Station | Date | Latitude | Longitude | Ind. caught | W (g) | TW fish (kg) | TW catch (kg) | ||
| 41 | 27.02.2008 | 58,81 | S | 15,00 | E | 1 | 0,3 | 0,34 | 210,17 |
| 59 | 17.03.2008 | 45,11 | S | 7,66 | E | 3 | 12,0 | 1,02 | 5,63 |
2.13.5 - Electrona subaspera (Günther, 1864)
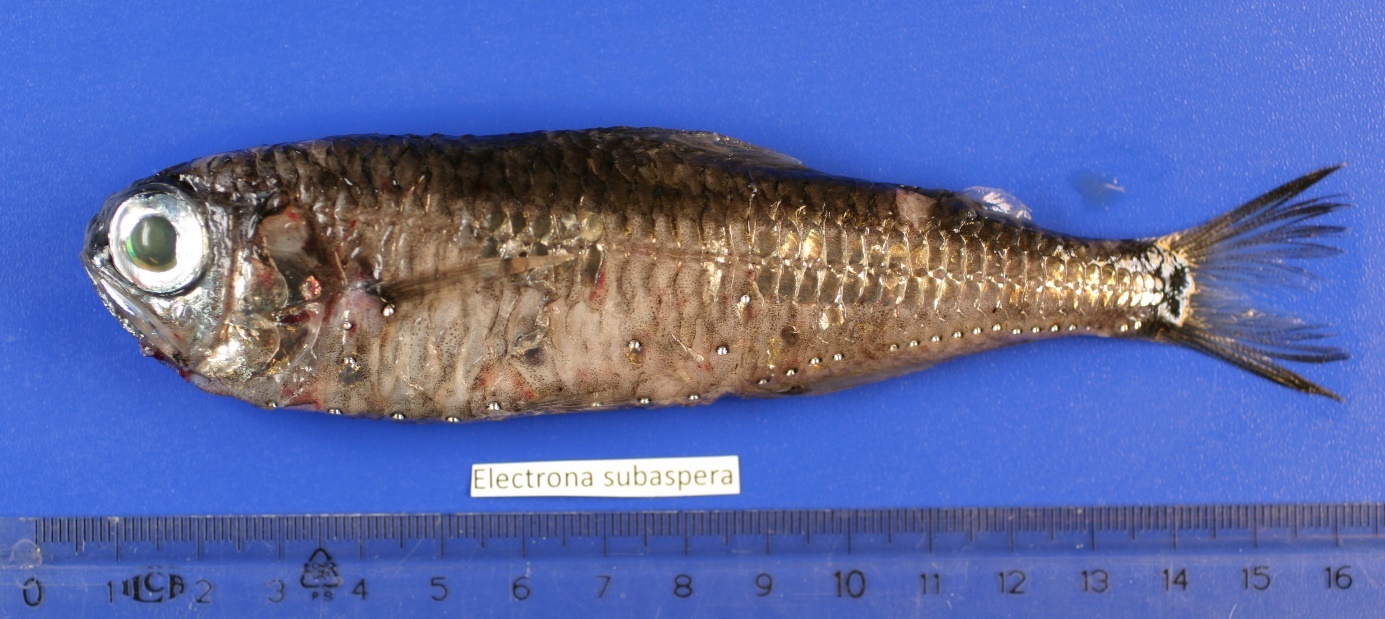
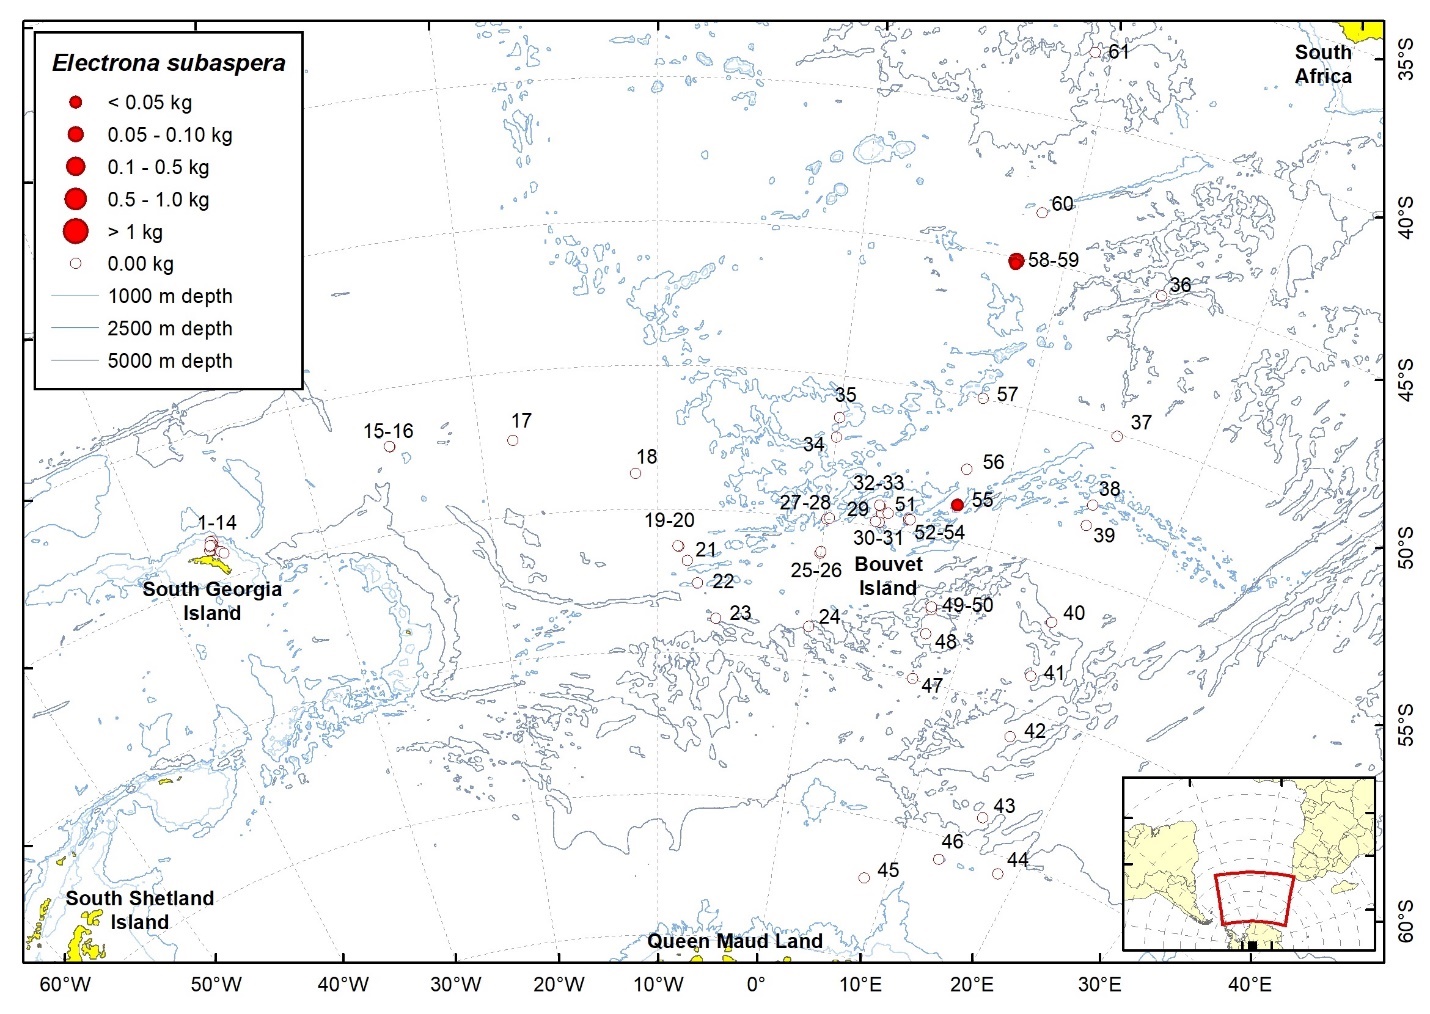
| Station | Date | Latitude | Longitude | Ind. caught | W (g) | TW fish (kg) | TW catch (kg) | ||
| 55 | 13.03.2008 | 53,75 | S | 7,49 | E | 1 | 40,0 | 1,18 | 382,02 |
| 58 | 17.03.2008 | 45,20 | S | 7,65 | E | 1 | 2,4 | 10,17 | 19,92 |
| 59 | 17.03.2008 | 45,11 | S | 7,66 | E | 21 | 82,0 | 1,02 | 5,63 |
2.13.6 - Gymnoscopelus bolini Andriashev, 1962

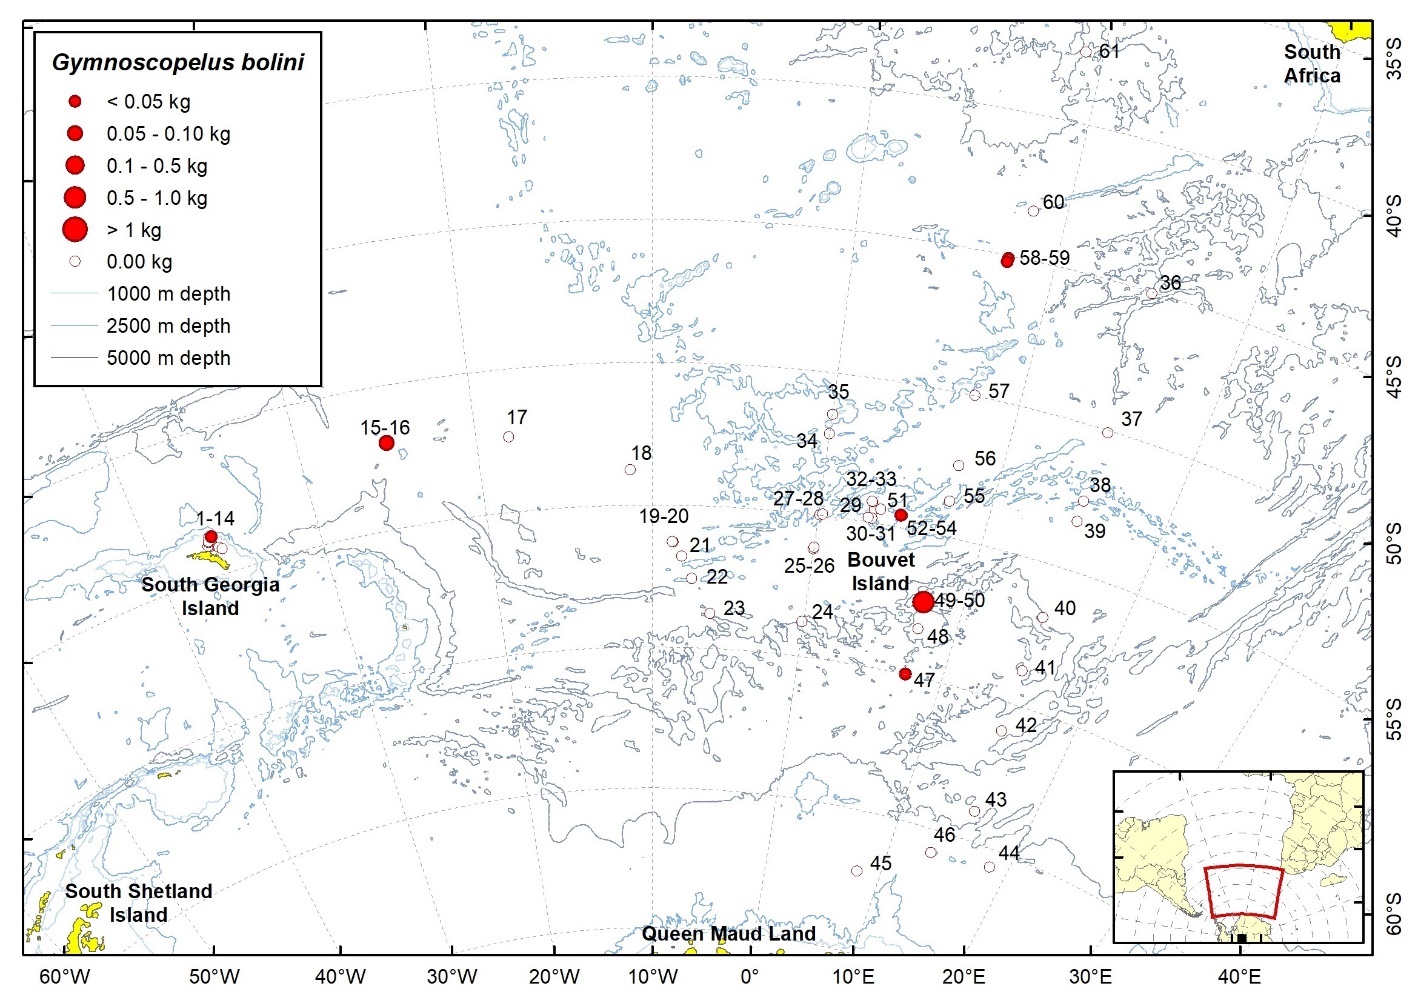
| Station | Date | Latitude | Longitude | Ind. caught | W (g) | TW fish (kg) | TW catch (kg) | ||
| 4 | 20.01.2008 | 53,64 | S | 36,26 | W | 1 | 29,2 | 0,42 | 4,32 |
| 16 | 24.01.2008 | 51,99 | S | 25,00 | W | 1 | 92,9 | 3,23 | 45,05 |
| 47 | 07.03.2008 | 59,98 | S | 7,47 | E | 1 | 21,0 | 1,58 | 44,63 |
| 50 | 08.03.2008 | 57,39 | S | 7,44 | E | 7 | 602,0 | 26,34 | 31,75 |
| 53 | 12.03.2008 | 54,57 | S | 4,87 | E | 1 | 2,7 | 0,07 | 4,33 |
| 58 | 17.03.2008 | 45,20 | S | 7,65 | E | 1 | 6,0 | 10,17 | 19,92 |
| 59 | 17.03.2008 | 45,06 | S | 7,67 | E | 5 | 34,0 | 1,02 | 5,63 |
2.13.7 - Gymnoscopelus braueri (Lönnberg, 1905)

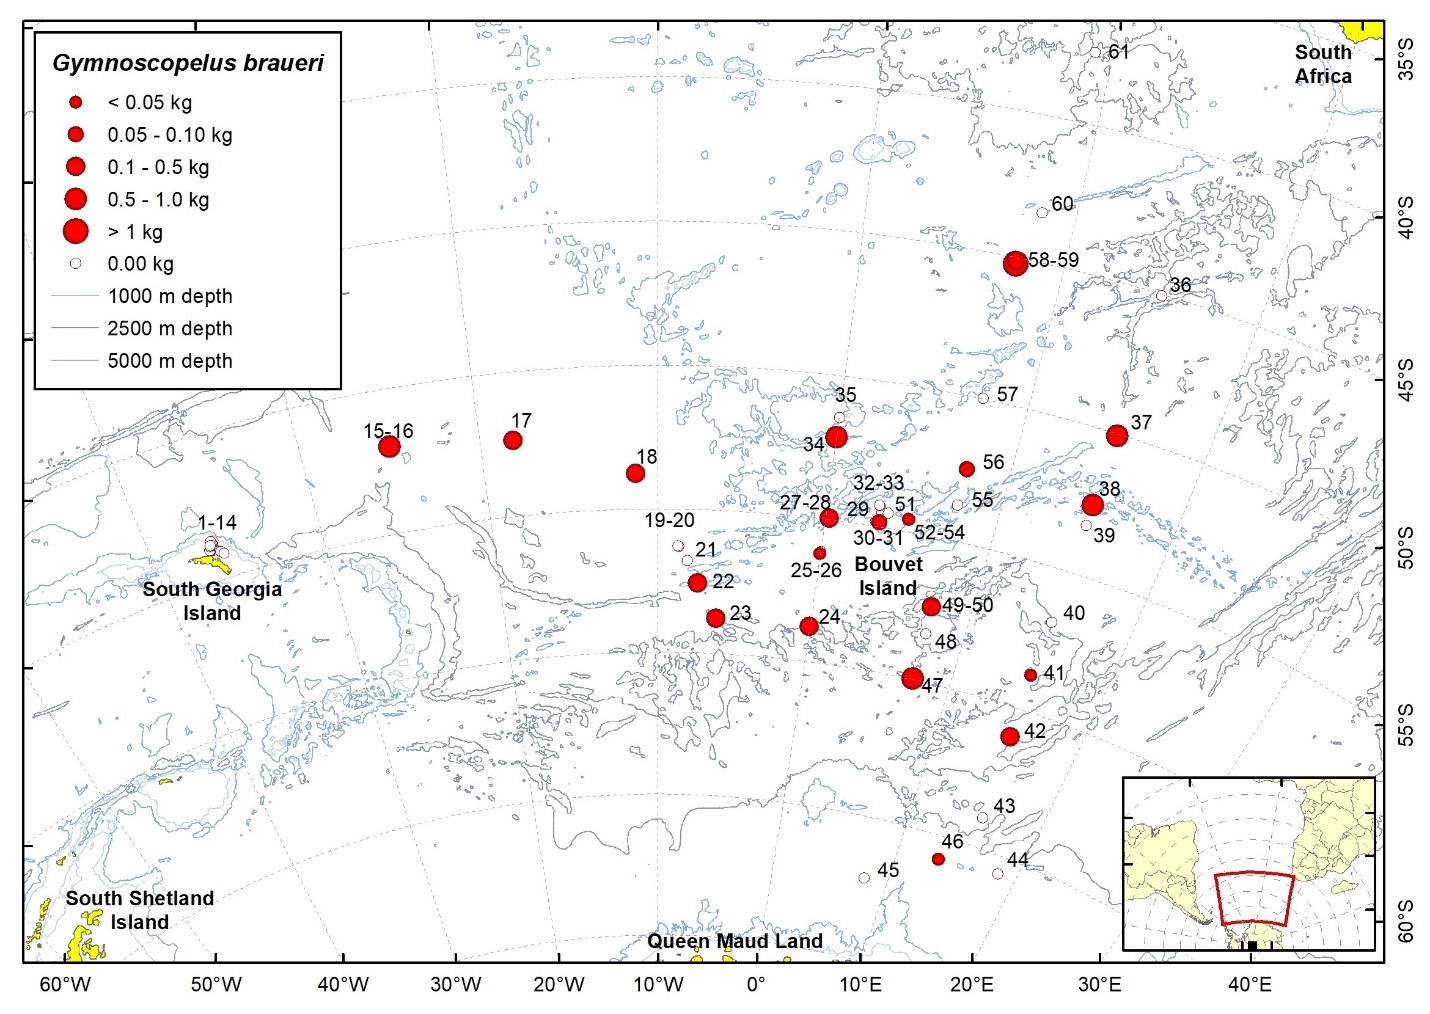
| Station | Date | Latitude | Longitude | Ind. caught | W (g) | TW fish (kg) | TW catch (kg) | ||
| 16 | 24.01.2008 | 51,99 | S | 25,00 | W | 62 | 721,6 | 3,23 | 45,05 |
| 17 | 26.01.2008 | 52,33 | S | 18,16 | W | 48 | 129,3 | 1,20 | 26,43 |
| 18 | 27.01.2008 | 53,75 | S | 11,29 | W | 43 | 121,0 | 3,07 | 24,11 |
| 22 | 30.01.2008 | 57,53 | S | 7,49 | W | 58 | 239,4 | 0,67 | 20,43 |
| 23 | 30.01.2008 | 58,76 | S | 6,22 | W | 17 | 214,8 | 4,14 | 13,02 |
| 24 | 31.01.2008 | 58,76 | S | 0,04 | W | 11 | 105,2 | 1,49 | 29,02 |
| 25 | 01.02.2008 | 56,21 | S | 0,05 | W | 1 | 2,3 | 0,18 | 44,71 |
| 28 | 02.02.2008 | 54,95 | S | 0,20 | E | 28 | 105,3 | 0,47 | 89,03 |
| 30 | 03.02.2008 | 54,85 | S | 3,19 | E | 16 | 57,9 | 1,44 | 273,78 |
| 34 | 06.02.2008 | 52,12 | S | 0,02 | W | 203 | 824,0 | 4,15 | 44,70 |
| 37 | 24.02.2008 | 50,04 | S | 15,02 | E | 49 | 544,0 | 3,32 | 14,43 |
| 38 | 25.02.2008 | 52,55 | S | 14,99 | E | 106 | 507,8 | 3,66 | 49,50 |
| 41 | 27.02.2008 | 58,78 | S | 14,99 | E | 4 | 10,5 | 0,34 | 210,17 |
| 42 | 28.02.2008 | 60,98 | S | 15,13 | E | 28 | 143,5 | 0,59 | 50,67 |
| 46 | 05.03.2008 | 65,80 | S | 13,38 | E | 3 | 21,6 | 1,59 | 32,17 |
| 47 | 07.03.2008 | 59,98 | S | 7,47 | E | 107 | 800,0 | 1,58 | 44,63 |
| 50 | 08.03.2008 | 57,39 | S | 7,44 | E | 18 | 251,0 | 26,34 | 31,75 |
| 53 | 12.03.2008 | 54,57 | S | 4,87 | E | 1 | 2,5 | 0,07 | 4,33 |
| 56 | 14.03.2008 | 52,51 | S | 7,53 | E | 34 | 54,5 | 0,44 | 188,87 |
| 58 | 17.03.2008 | 45,20 | S | 7,65 | E | 180 | 1799,0 | 10,17 | 19,92 |
| 59 | 17.03.2008 | 45,11 | S | 7,66 | E | 102 | 287,0 | 1,02 | 5,63 |
2.13.8 - Gymnoscopelus fraseri (Fraser-Brunner, 1931)

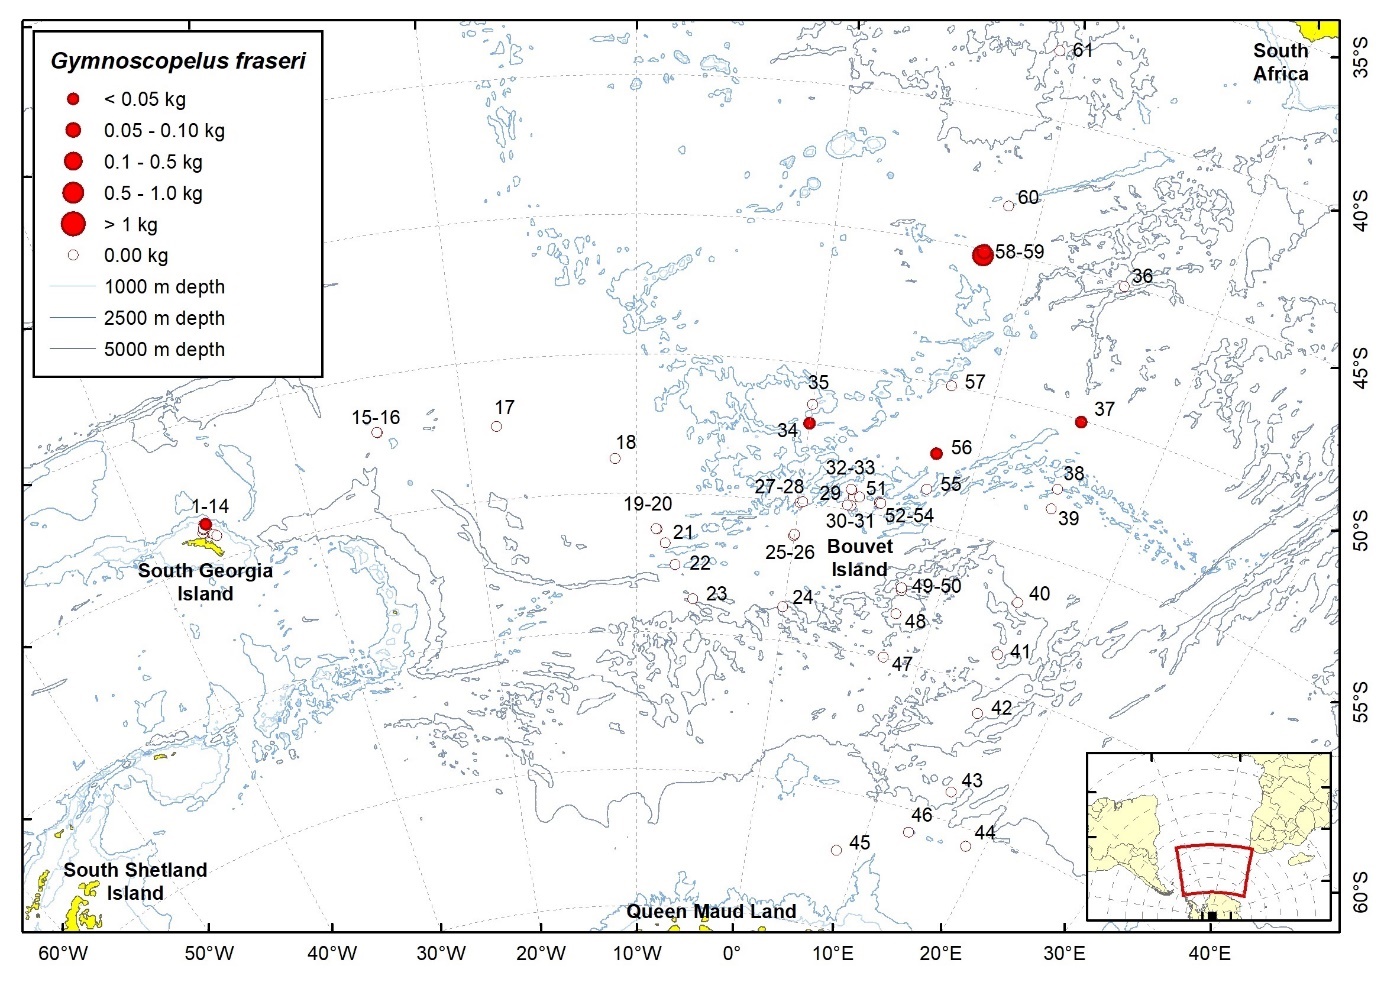
| Station | Date | Latitude | Longitude | Ind. caught | W (g) | TW fish (kg) | TW catch (kg) | ||
| 4 | 20.01.2008 | 53,64 | S | 36,27 | W | 1 | 0,03 | 0,42 | 4,32 |
| 34 | 06.02.2008 | 52,12 | S | 0,02 | W | 4 | 0,01 | 4,15 | 44,70 |
| 37 | 24.02.2008 | 50,04 | S | 15,02 | E | 1 | 0,02 | 3,32 | 14,43 |
| 56 | 14.03.2008 | 52,51 | S | 7,53 | E | 1 | 0,00 | 0,44 | 188,87 |
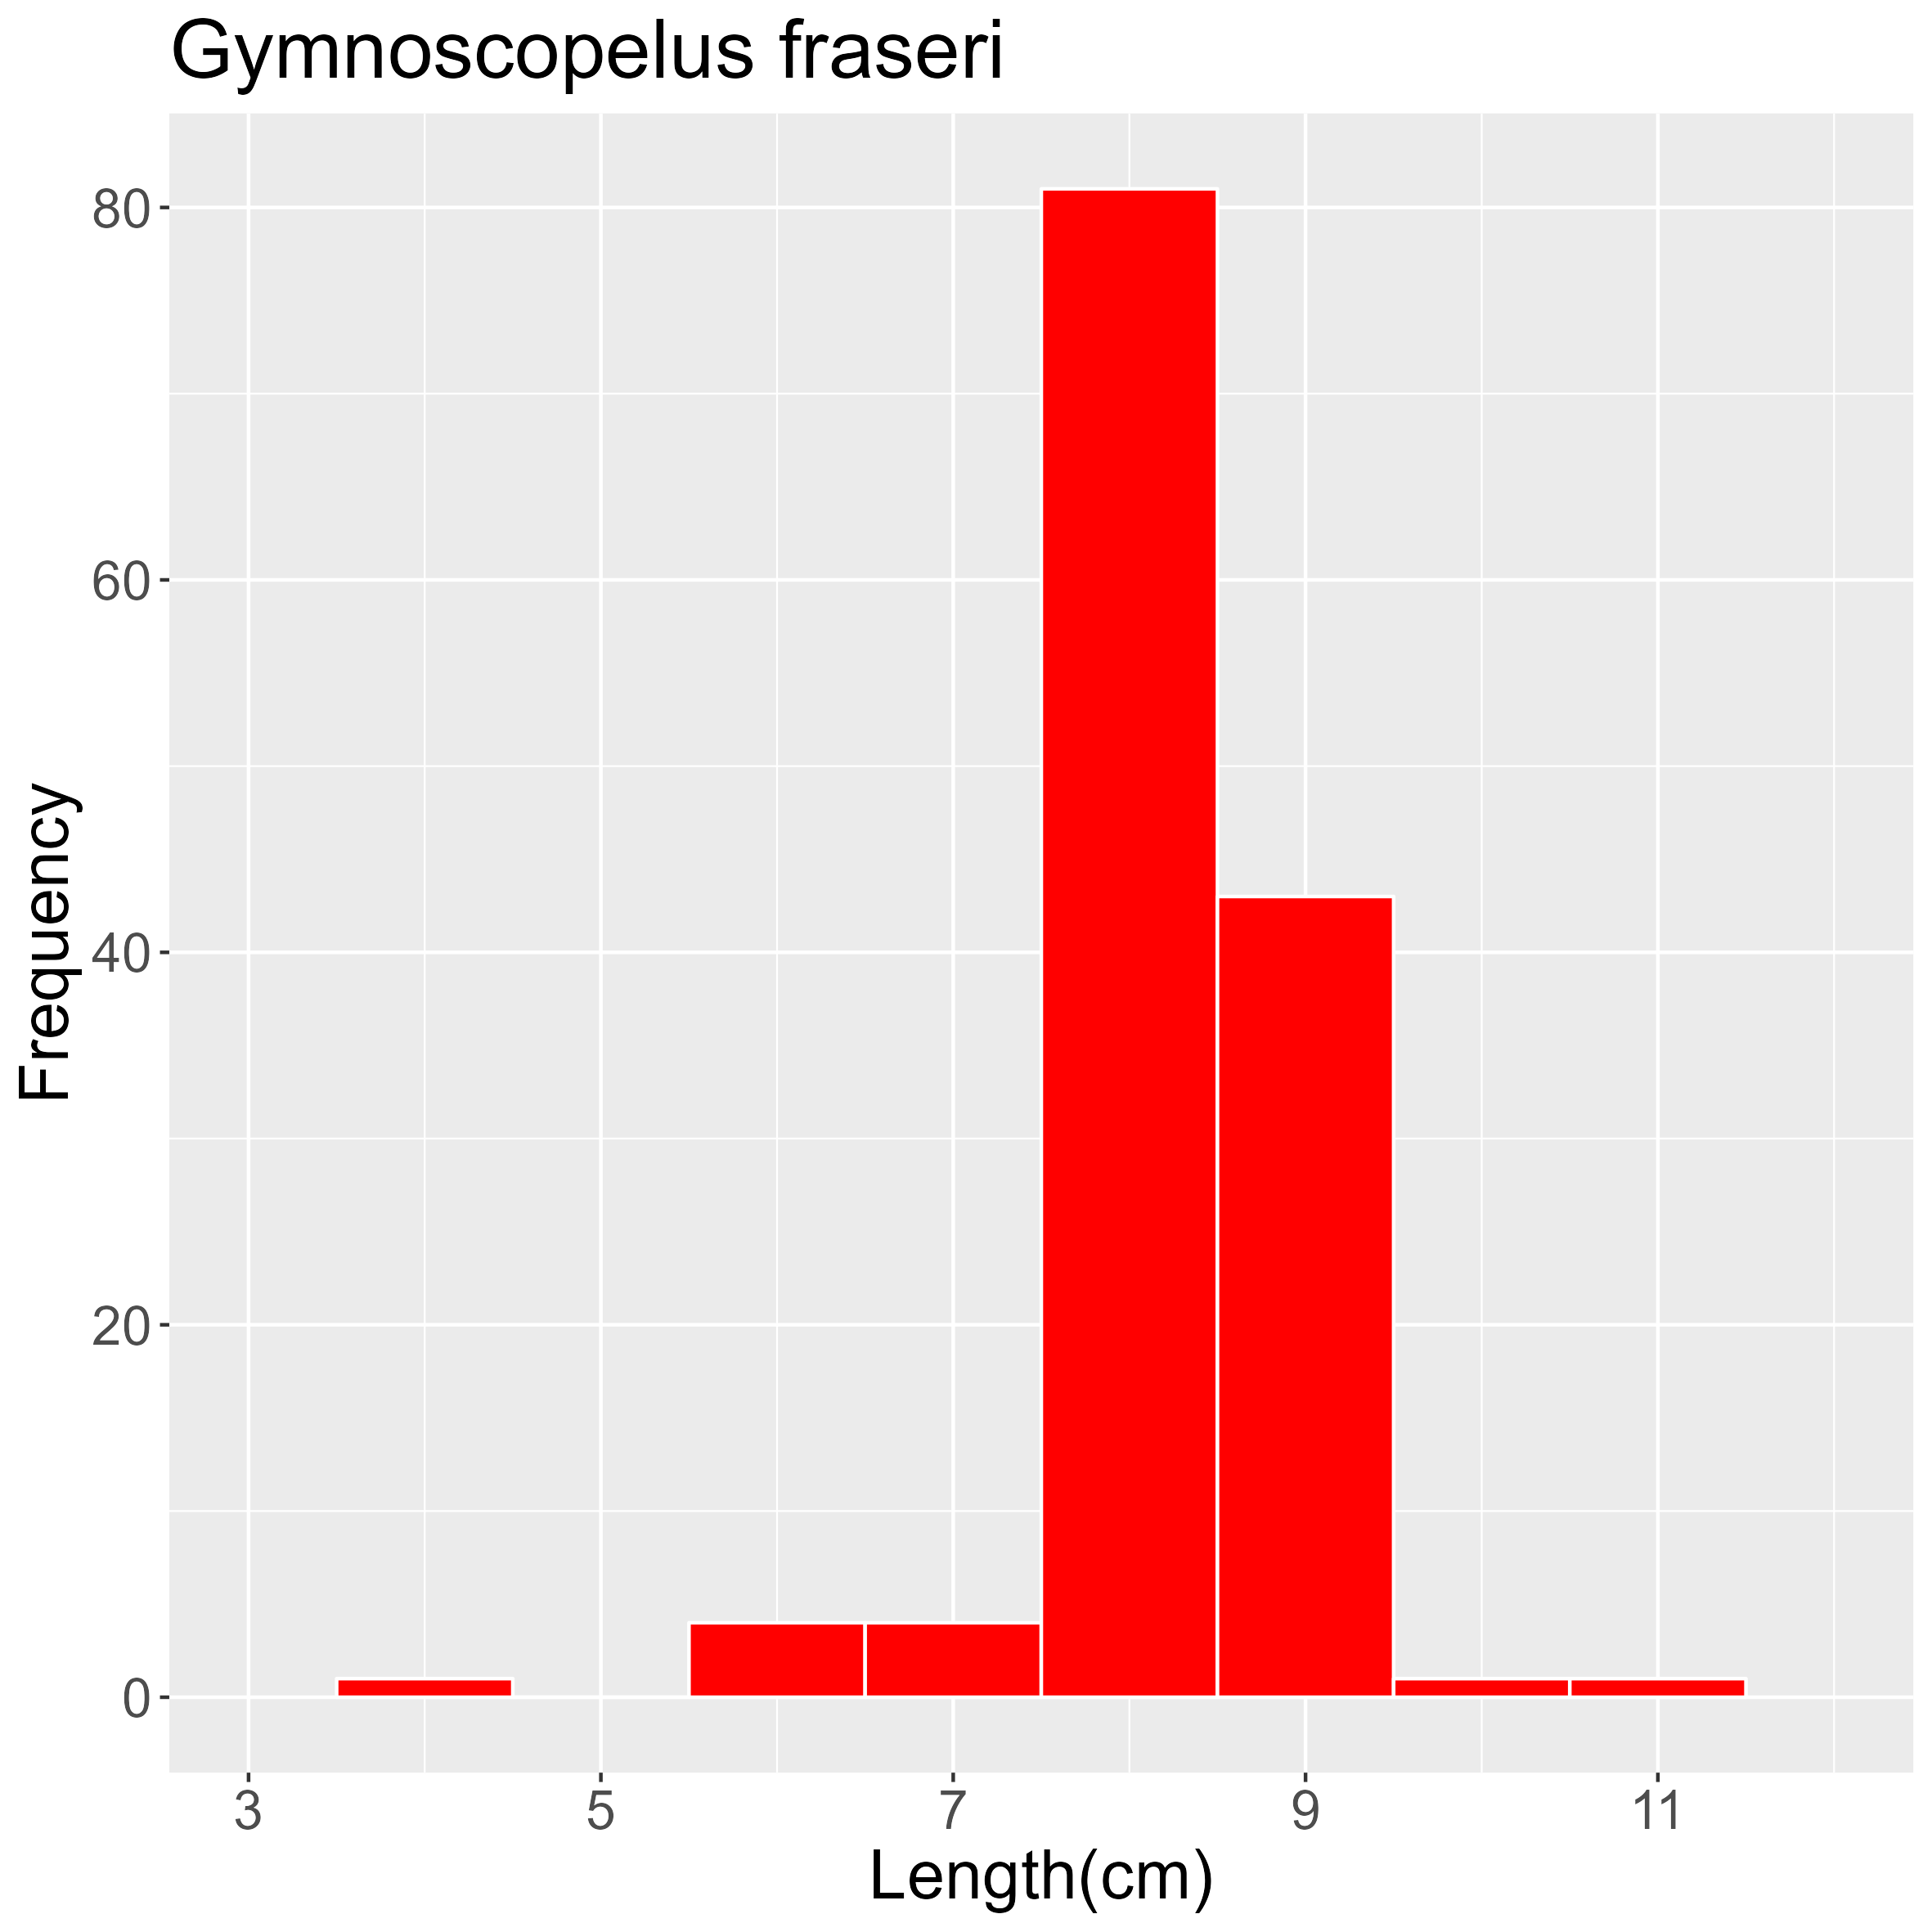
| 58 | 17.03.2008 | 45,2 | S | 7,65 | E | 123 | 0,90 | 10,17 | 19,92 |
| 59 | 17.03.2008 | 45,11 | S | 7,66 | E | 1 | 0,07 | 1,02 | 5,63 |
2.13.9 - Gymnoscopelus hintonoides Hulley, 1981

| Station | Date | Latitude | Longitude | Ind. caught | W (g) | TW fish (kg) | TW catch (kg) | ||
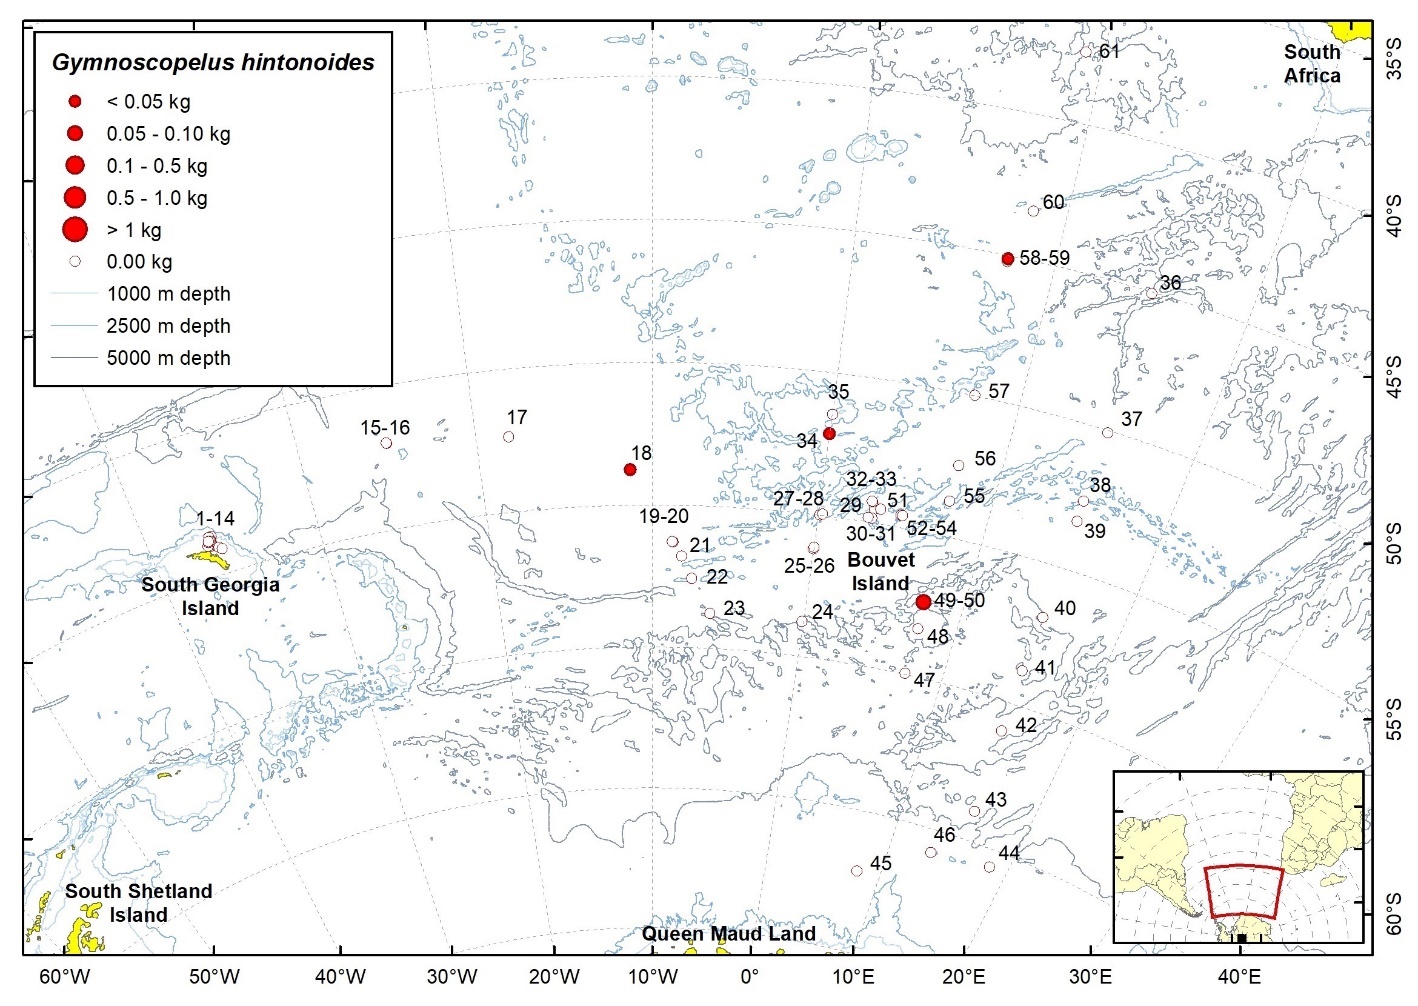
| 18 | 27.01.2008 | 53,75 | S | 11,29 | W | 1 | 2,8 | 3,07 | 24,11 |
| 34 | 06.02.2008 | 52,12 | S | 0,02 | W | 4 | 10,0 | 4,15 | 44,70 |
| 50 | 08.03.2008 | 57,39 | S | 7,44 | E | 3 | 81,0 | 26,34 | 31,75 |
| 59 | 17.03.2008 | 45,11 | S | 7,66 | E | 5 | 14,0 | 1,02 | 5,63 |
2.13.10 - Gymnoscopelus microlampas Hulley, 1981

| Station | Date | Latitude | Longitude | Ind. caught | W (g) | TW fish (kg) | TW catch (kg) | ||
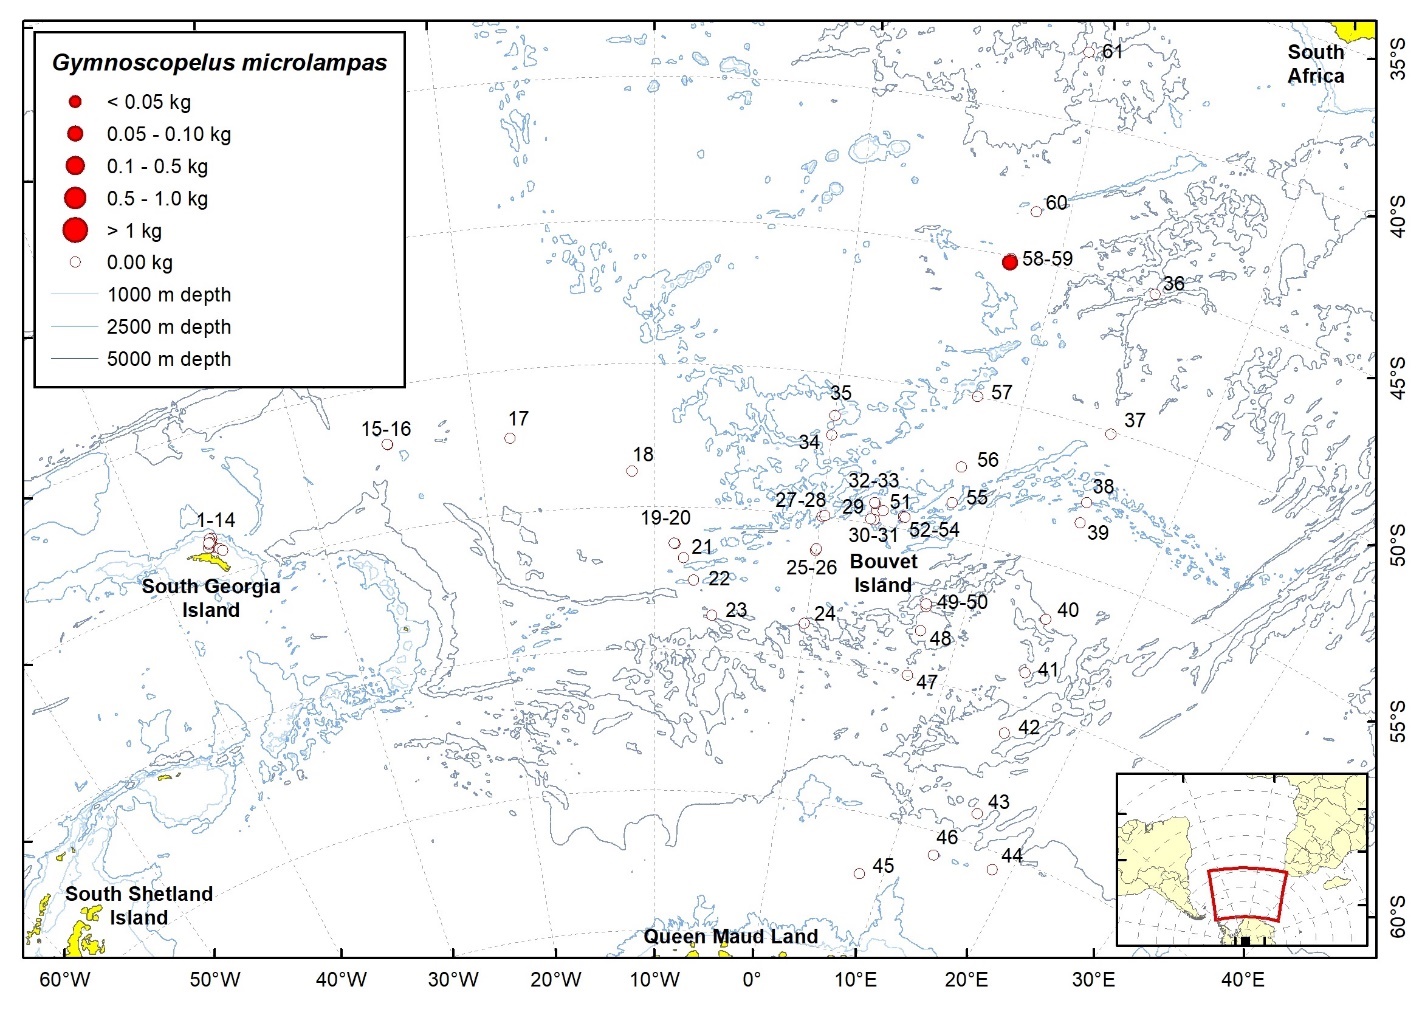
| 58 | 17.03.2008 | 45,20 | S | 7,65 | E | 10 | 56,0 | 10,17 | 19,92 |
2.13.11 - Gymnoscopelus nicholsi (Gilbert, 1911)
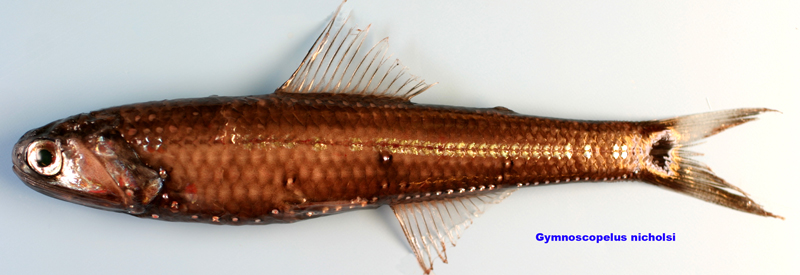
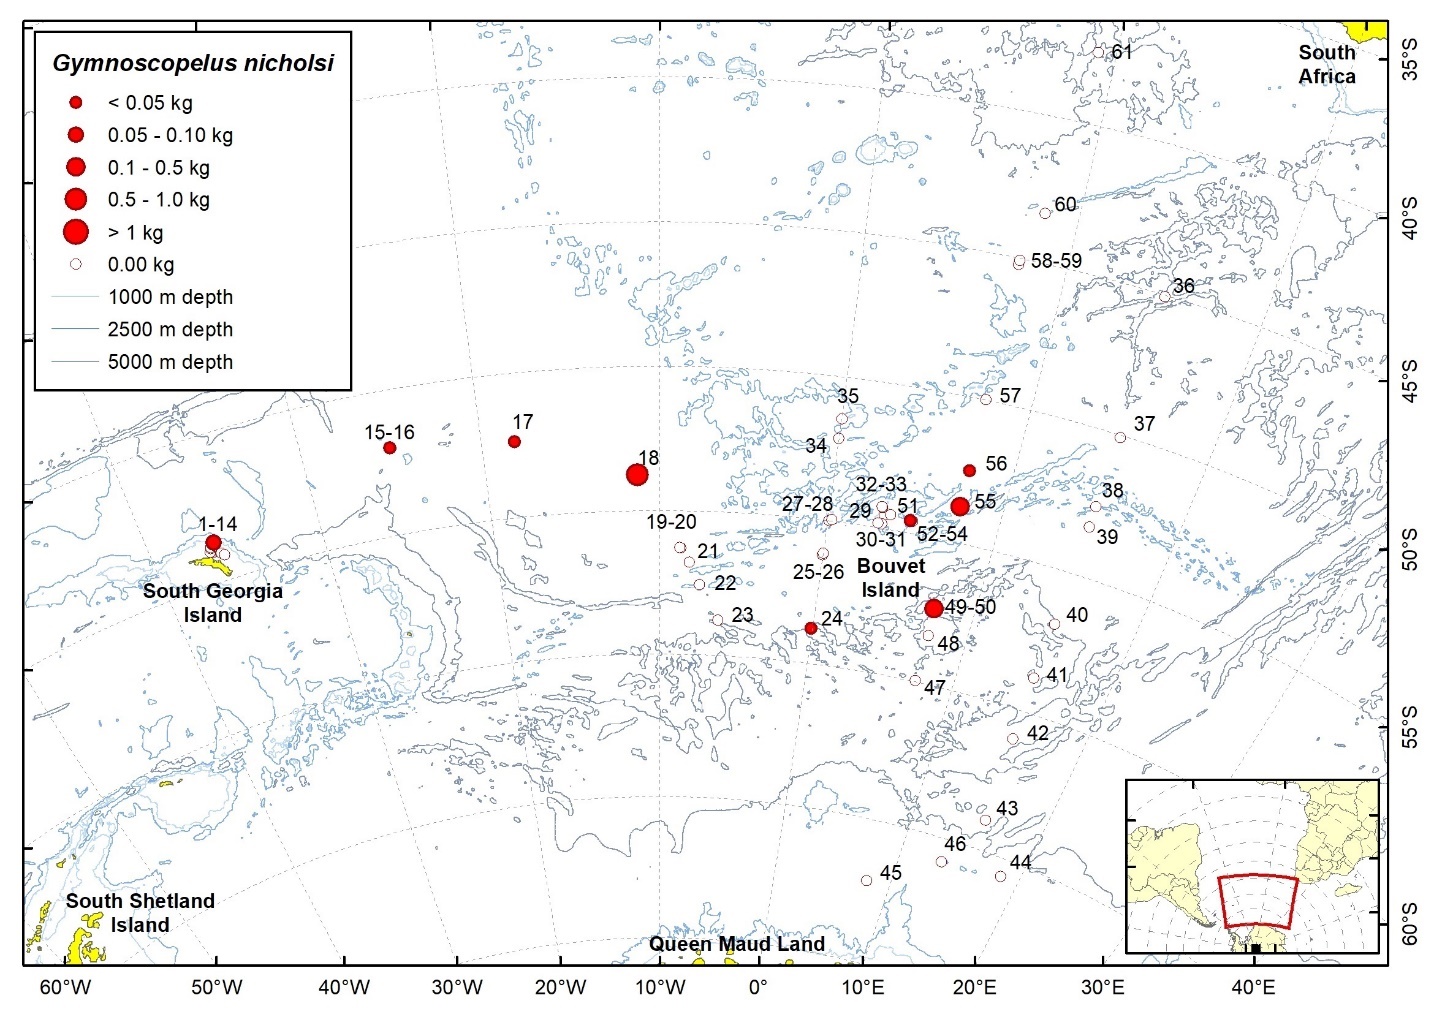
| Station | Date | Latitude | Longitude | Ind. caught | W (g) | TW fish (kg) | TW catch (kg) | ||
| 4 | 20.01.2008 | 53,64 | S | 36,26 | W | 1 | 82,7 | 0,42 | 4,32 |
| 16 | 25.01.2008 | 51,98 | S | 25,07 | W | 1 | 12,5 | 3,23 | 45,05 |
| 17 | 26.01.2008 | 52,36 | S | 18,15 | W | 3 | 36,1 | 1,20 | 26,43 |
| 18 | 27.01.2008 | 53,75 | S | 11,29 | W | 39 | 767,0 | 3,07 | 24,11 |
| 24 | 31.01.2008 | 58,77 | S | 0,08 | W | 1 | 39,0 | 1,49 | 29,02 |
| 50 | 08.03.2008 | 57,39 | S | 7,44 | E | 18 | 251,0 | 26,34 | 31,75 |
| 53 | 12.03.2008 | 54,57 | S | 4,83 | E | 1 | 16,0 | 0,07 | 4,33 |
| 55 | 13.03.2008 | 53,75 | S | 7,49 | E | 11 | 269,0 | 1,18 | 382,02 |
| 56 | 14.03.2008 | 52,49 | S | 7,54 | E | 2 | 38,0 | 0,44 | 188,87 |
2.13.12 - Gymnoscopelus opisthopterus Fraser-Brunner, 1949
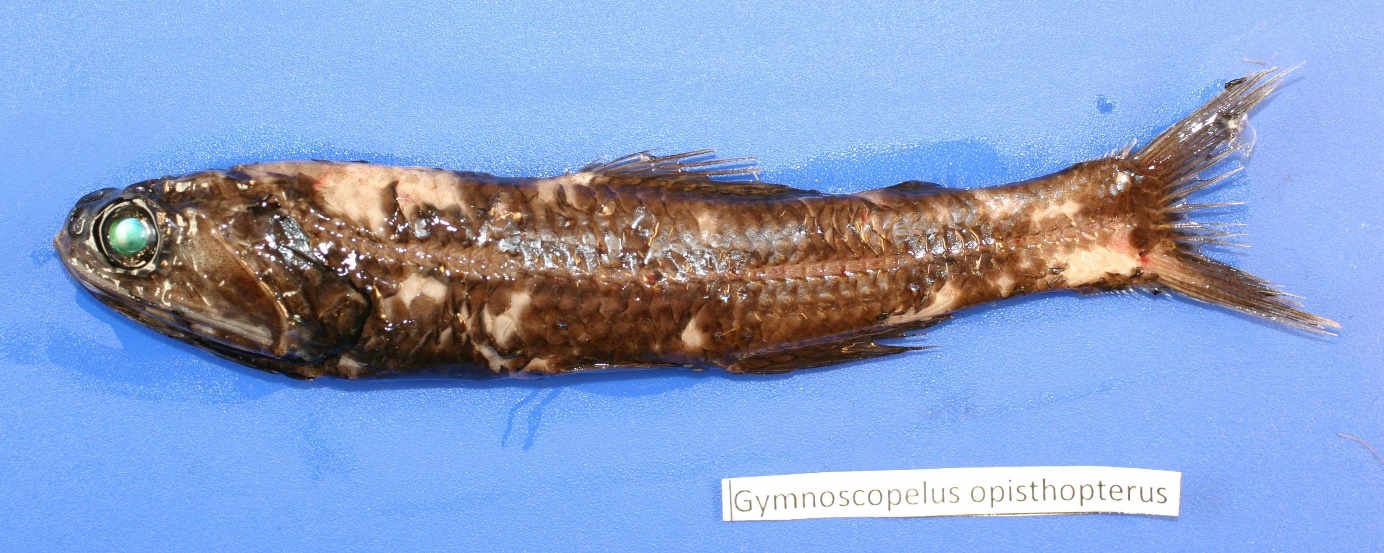
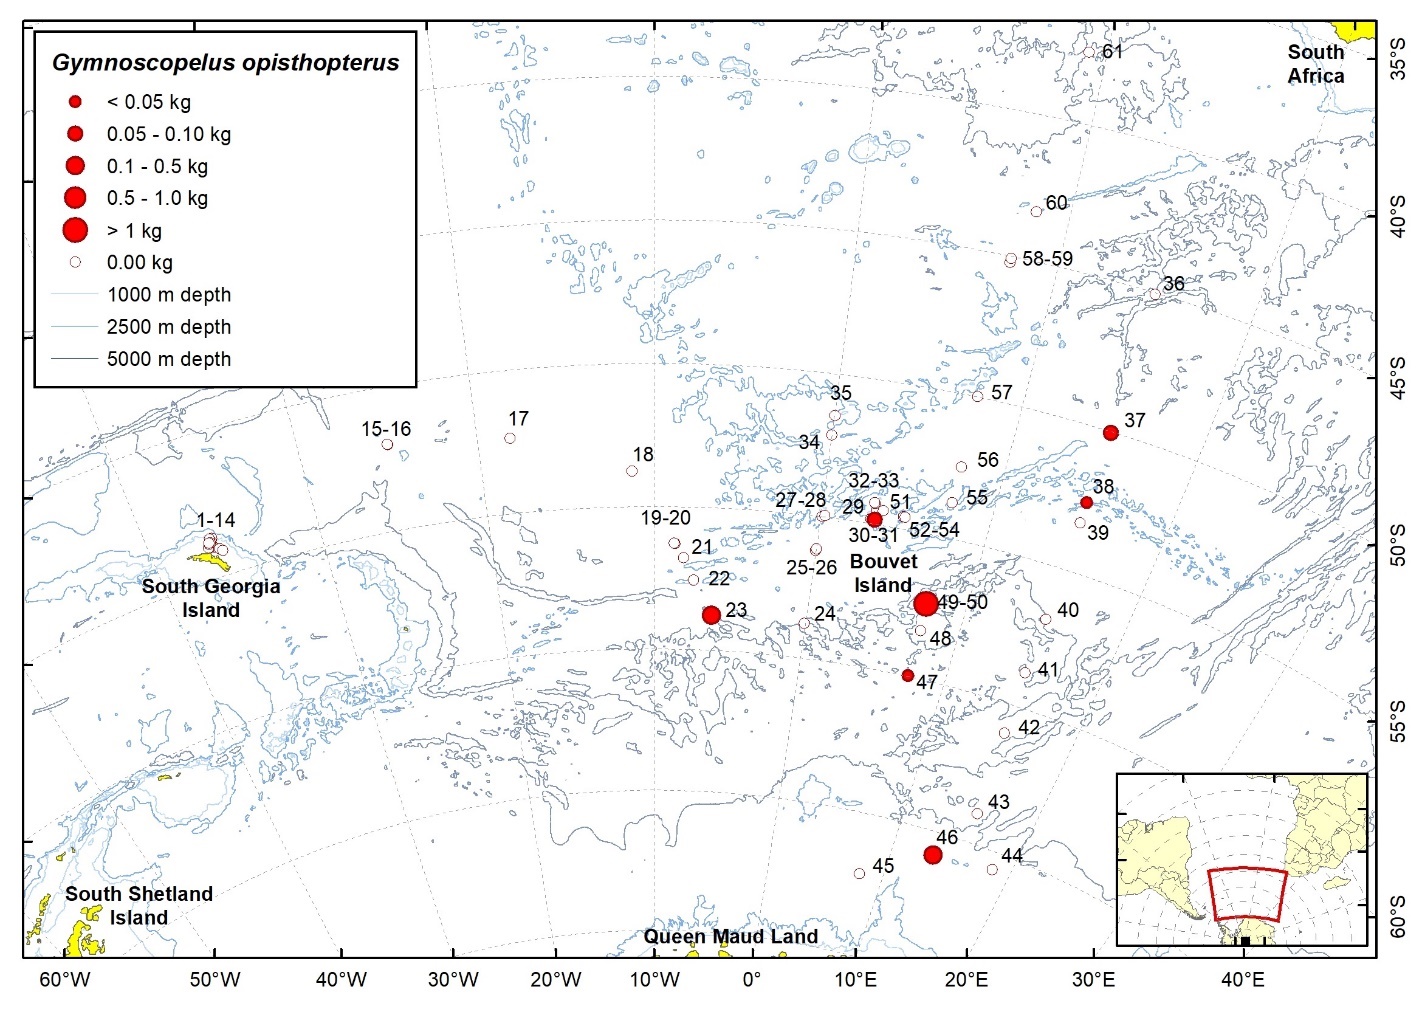
| Station | Date | Latitude | Longitude | Ind. caught | W (g) | TW fish (kg) | TW catch (kg) | ||
| 23 | 30.01.2008 | 58,76 | S | 6,22 | W | 7 | 126,0 | 4,14 | 13,02 |
| 30 | 03.02.2008 | 54,84 | S | 3,23 | E | 5 | 51,6 | 1,44 | 273,78 |
| 37 | 24.02.2008 | 50,04 | S | 15,02 | E | 5 | 51,4 | 3,32 | 14,43 |
| 38 | 25.02.2008 | 52,57 | S | 15,00 | E | 1 | 29,0 | 3,66 | 49,50 |
| 46 | 05.03.2008 | 65,80 | S | 13,38 | E | 30 | 195,5 | 1,59 | 32,17 |
| 47 | 07.03.2008 | 59,98 | S | 7,47 | E | 3 | 42,0 | 1,58 | 44,63 |
| 50 | 08.03.2008 | 57,39 | S | 7,44 | E | 554 | 11685,0 | 26,34 | 31,75 |
2.13.13 - Gymnoscopelus piabilis (Whitley, 1931)
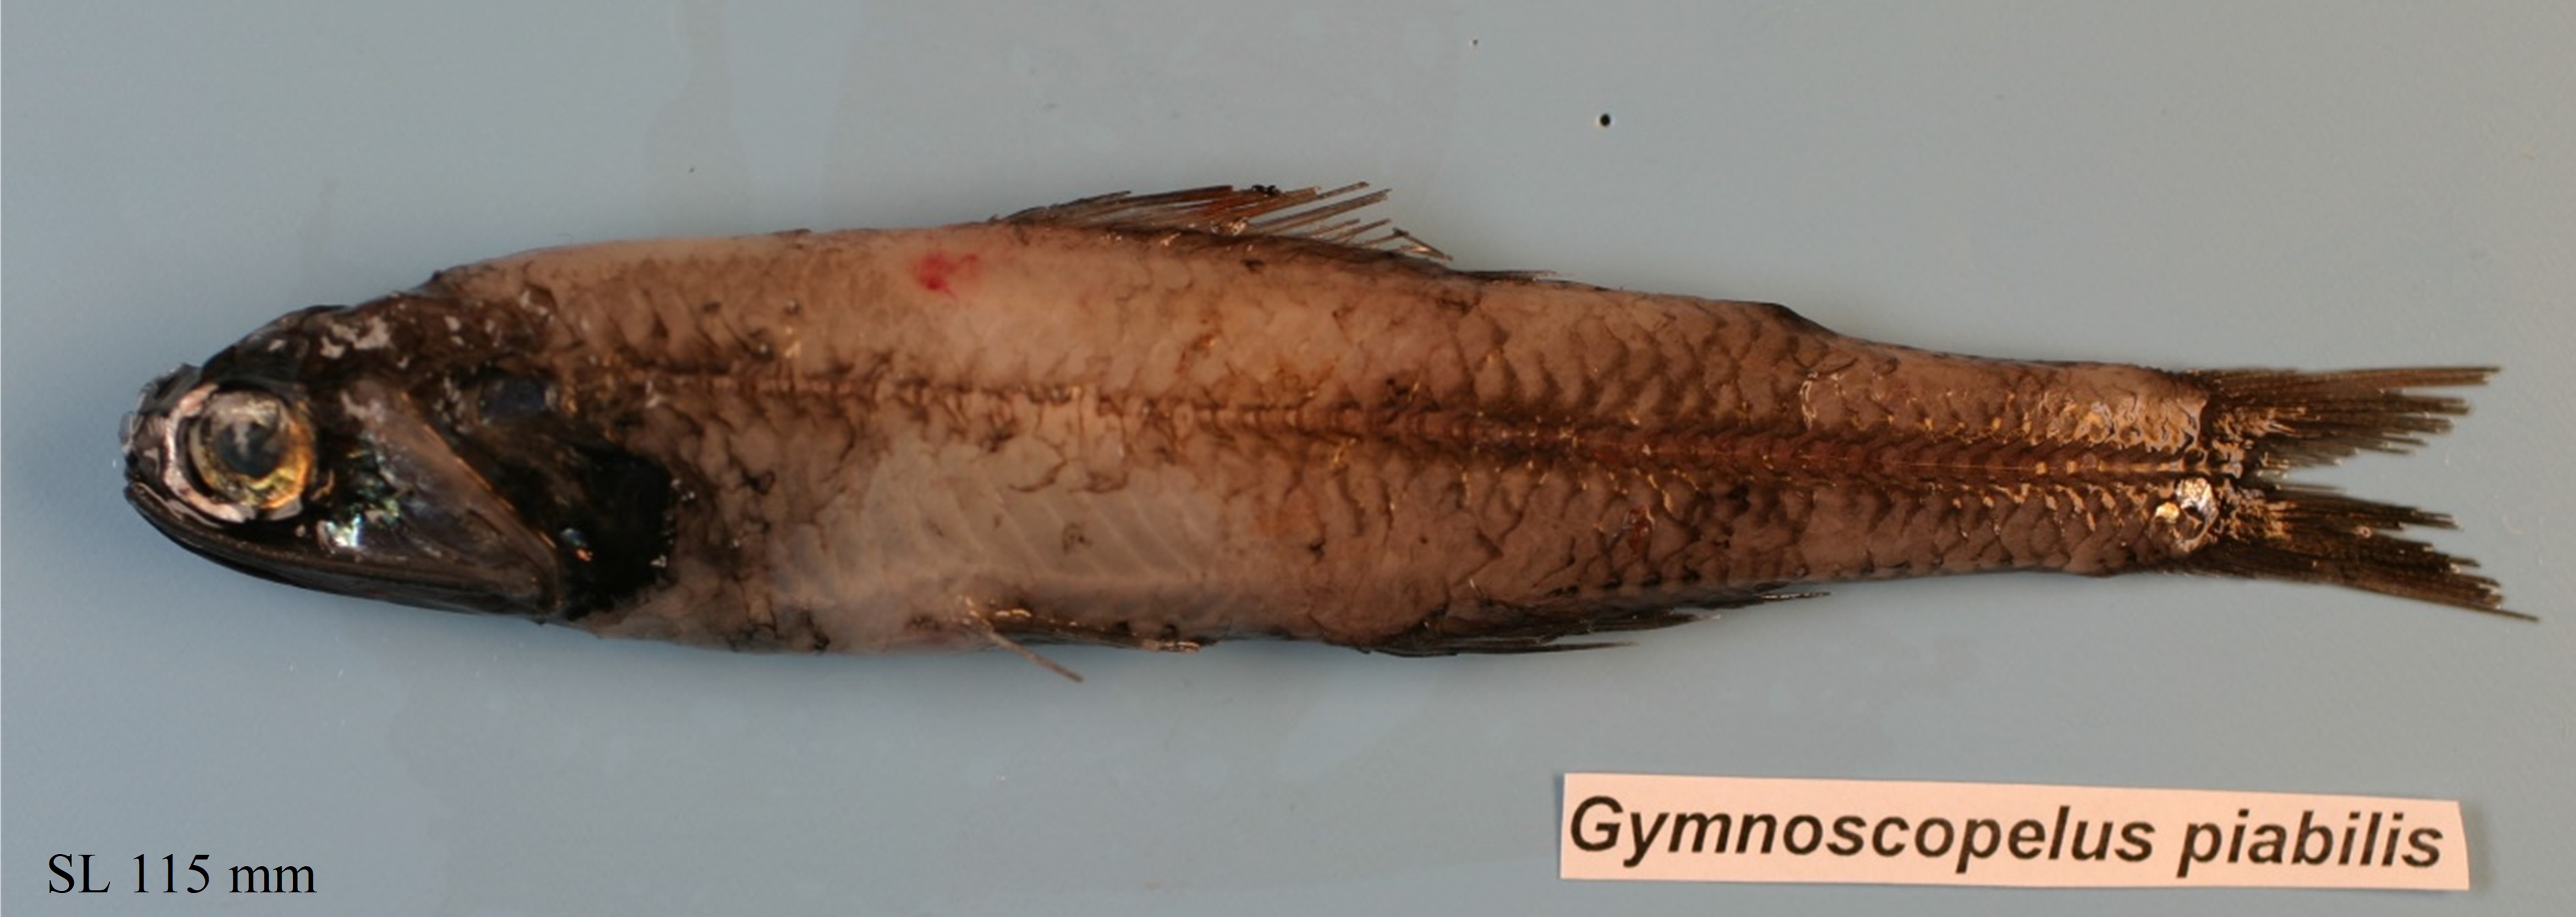
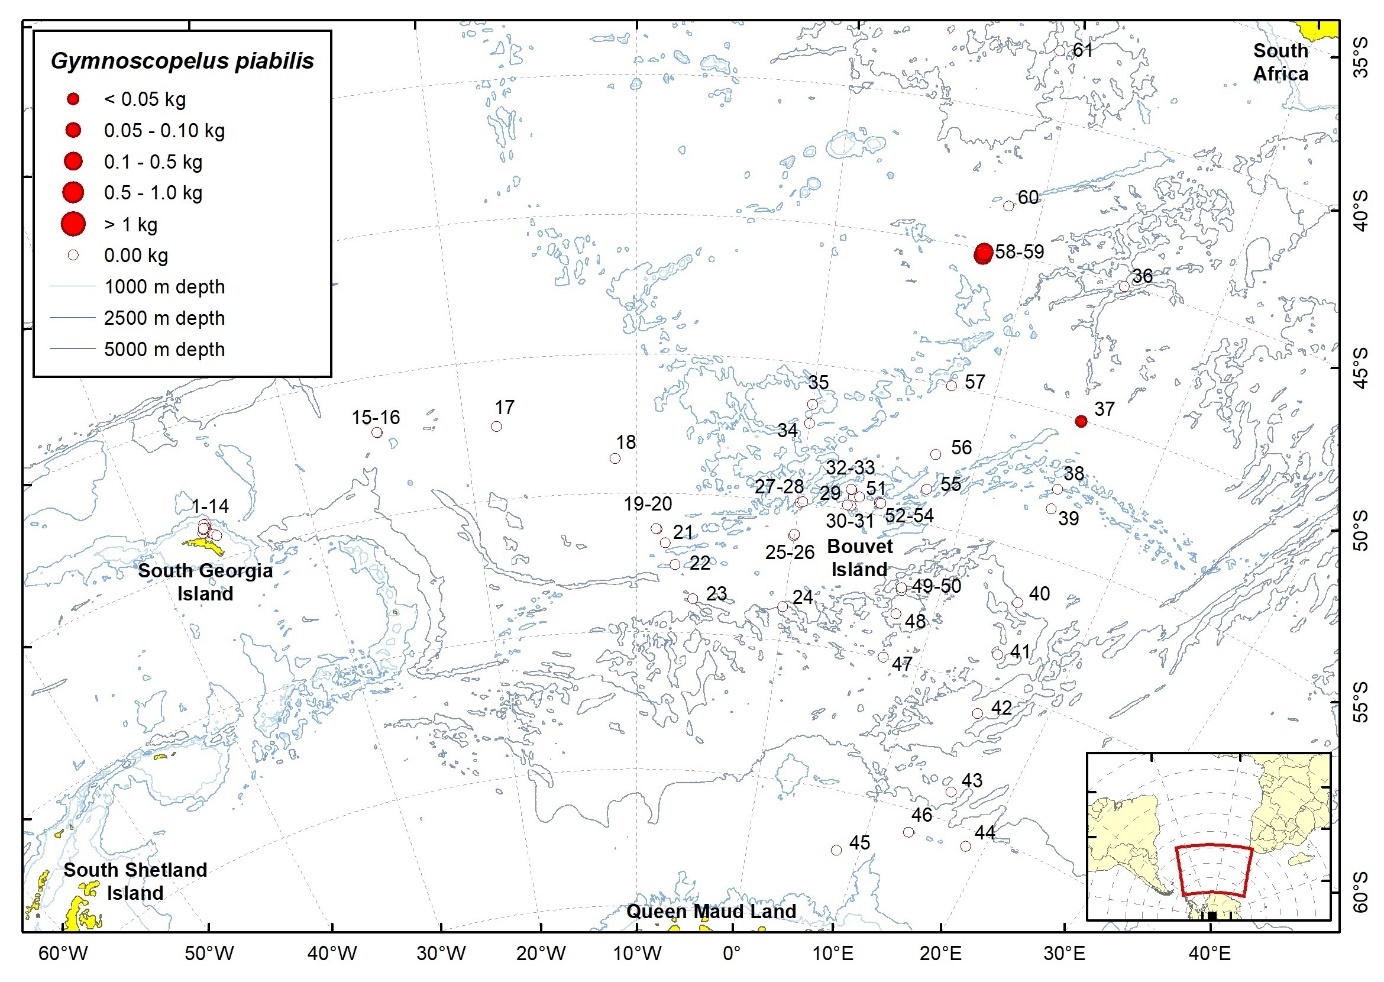
| Station | Date | Latitude | Longitude | Ind. caught | W (g) | TW fish (kg) | TW catch (kg) | ||
| 37 | 24.02.2008 | 50,04 | S | 15,02 | E | 2 | 34,6 | 3,32 | 14,43 |
| 58 | 17.03.2008 | 45,20 | S | 7,65 | E | 23 | 138,0 | 10,17 | 19,92 |
| 59 | 17.03.2008 | 45,06 | S | 7,67 | E | 15 | 115,0 | 1,02 | 5,63 |
2.13.14 - Gymnoscopelus spp .
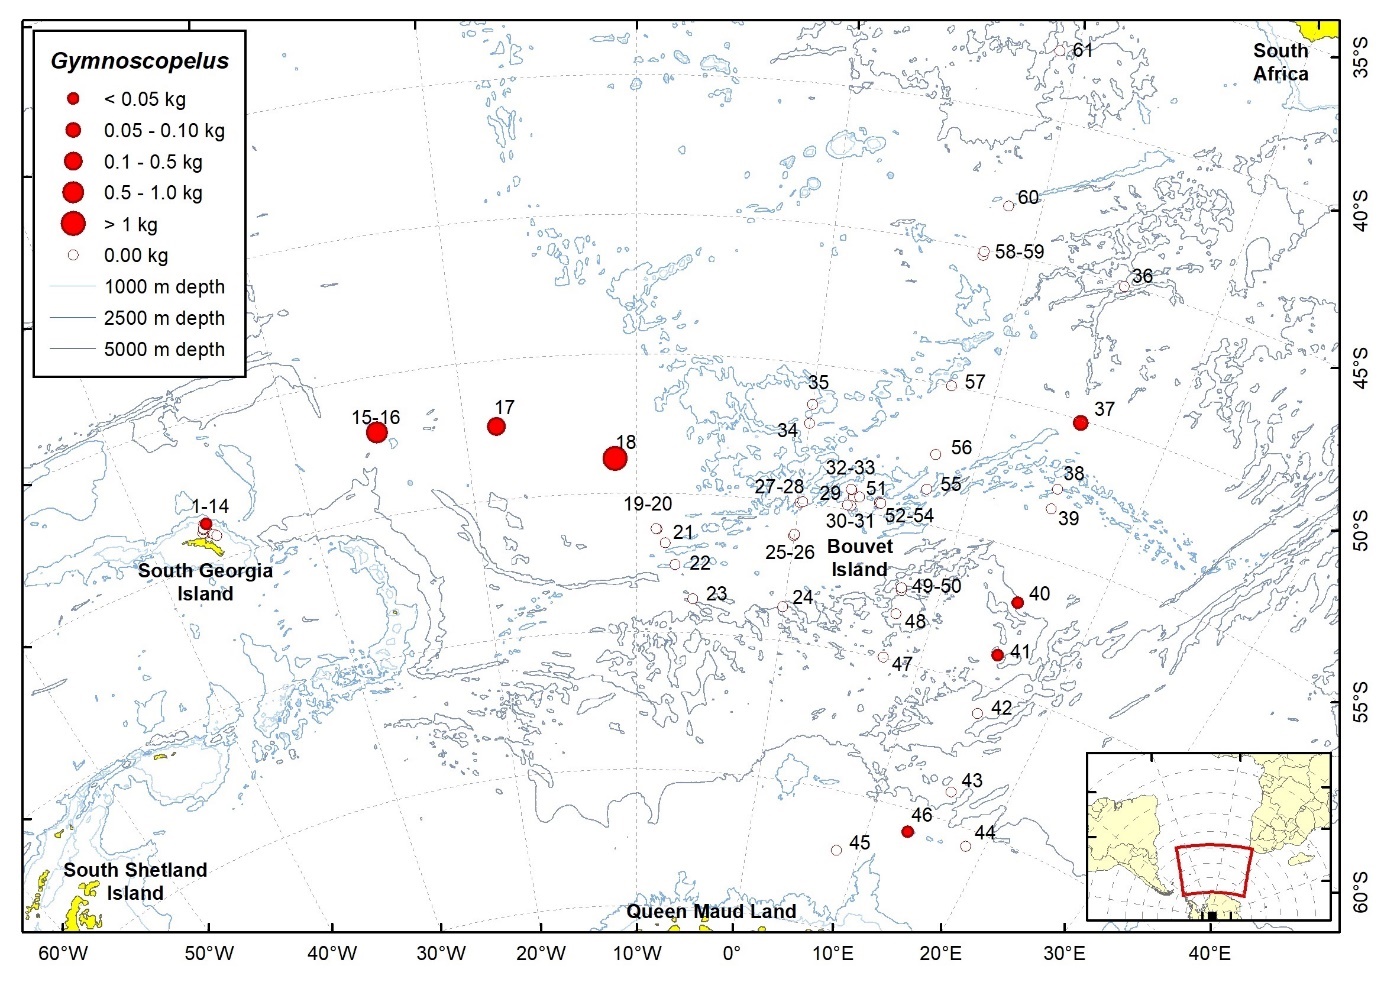
| Station | Date | Latitude | Longitude | Ind. caught | W (g) | TW fish (kg) | TW catch (kg) | ||
| 4 | 20.01.2008 | 53,64 | S | 36,26 | W | 5 | 16,0 | 0,42 | 4,32 |
| 16 | 24.01.2008 | 51,99 | S | 25,00 | W | 118 | 740,1 | 3,23 | 45,05 |
| 17 | 26.01.2008 | 52,33 | S | 18,16 | W | 186 | 155,9 | 1,20 | 26,43 |
| 18 | 27.01.2008 | 53,75 | S | 11,29 | W | 420 | 1181,0 | 3,07 | 24,11 |
| 37 | 24.02.2008 | 50,10 | S | 15,05 | E | 312 | 78,0 | 3,32 | 14,43 |
| 40 | 26.02.2008 | 56,82 | S | 15,03 | E | 13 | 3,0 | 0,00 | 3,35 |
| 41 | 27.02.2008 | 58,81 | S | 15,00 | E | 1 | 3,0 | 0,34 | 210,17 |
| 46 | 05.03.2008 | 65,80 | S | 13,38 | E | 2 | 0,5 | 1,59 | 32,17 |
2.13.15 - Hintonia candens Fraser-Brunner, 1949
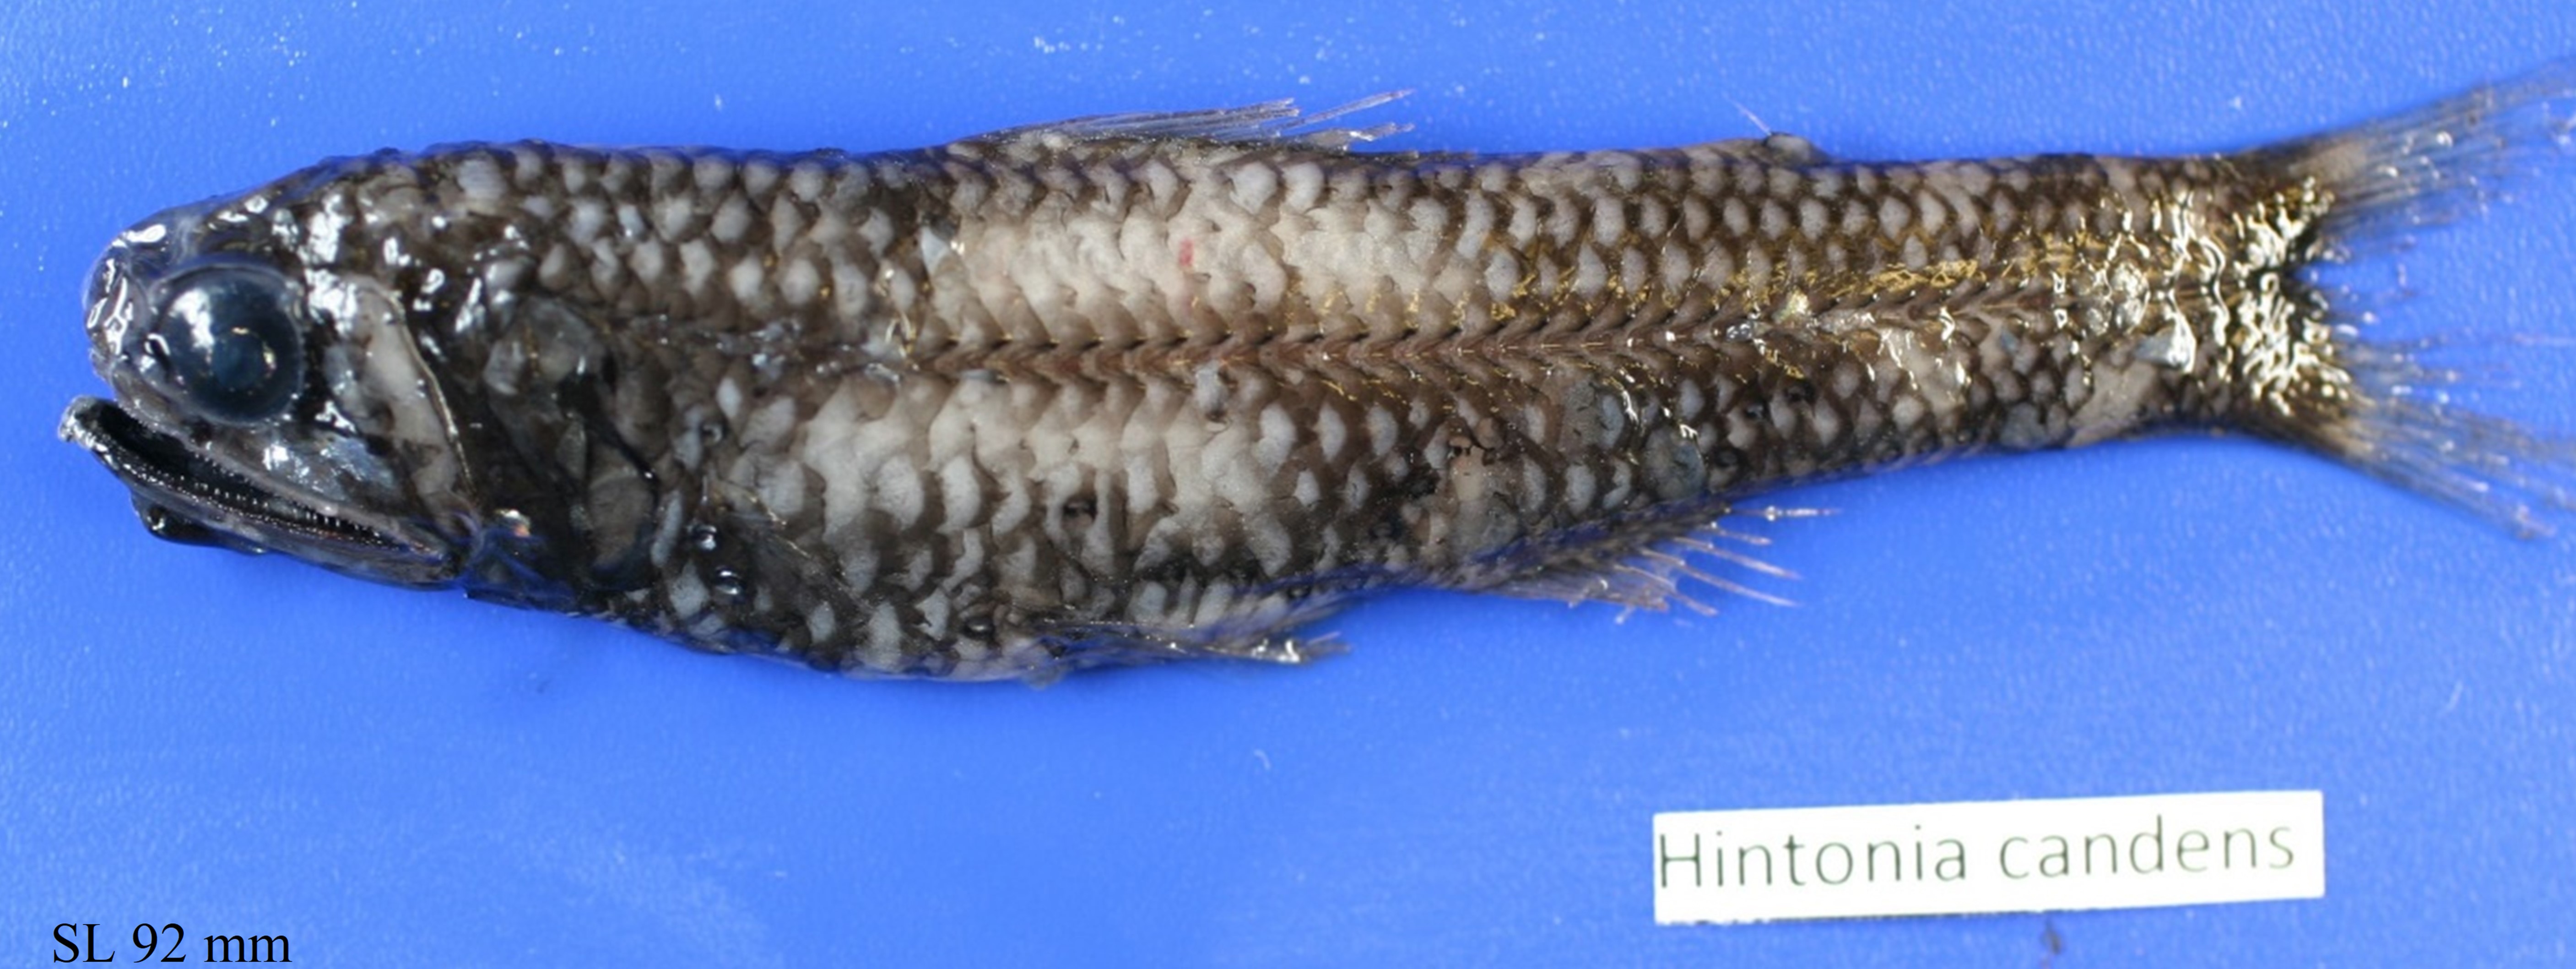
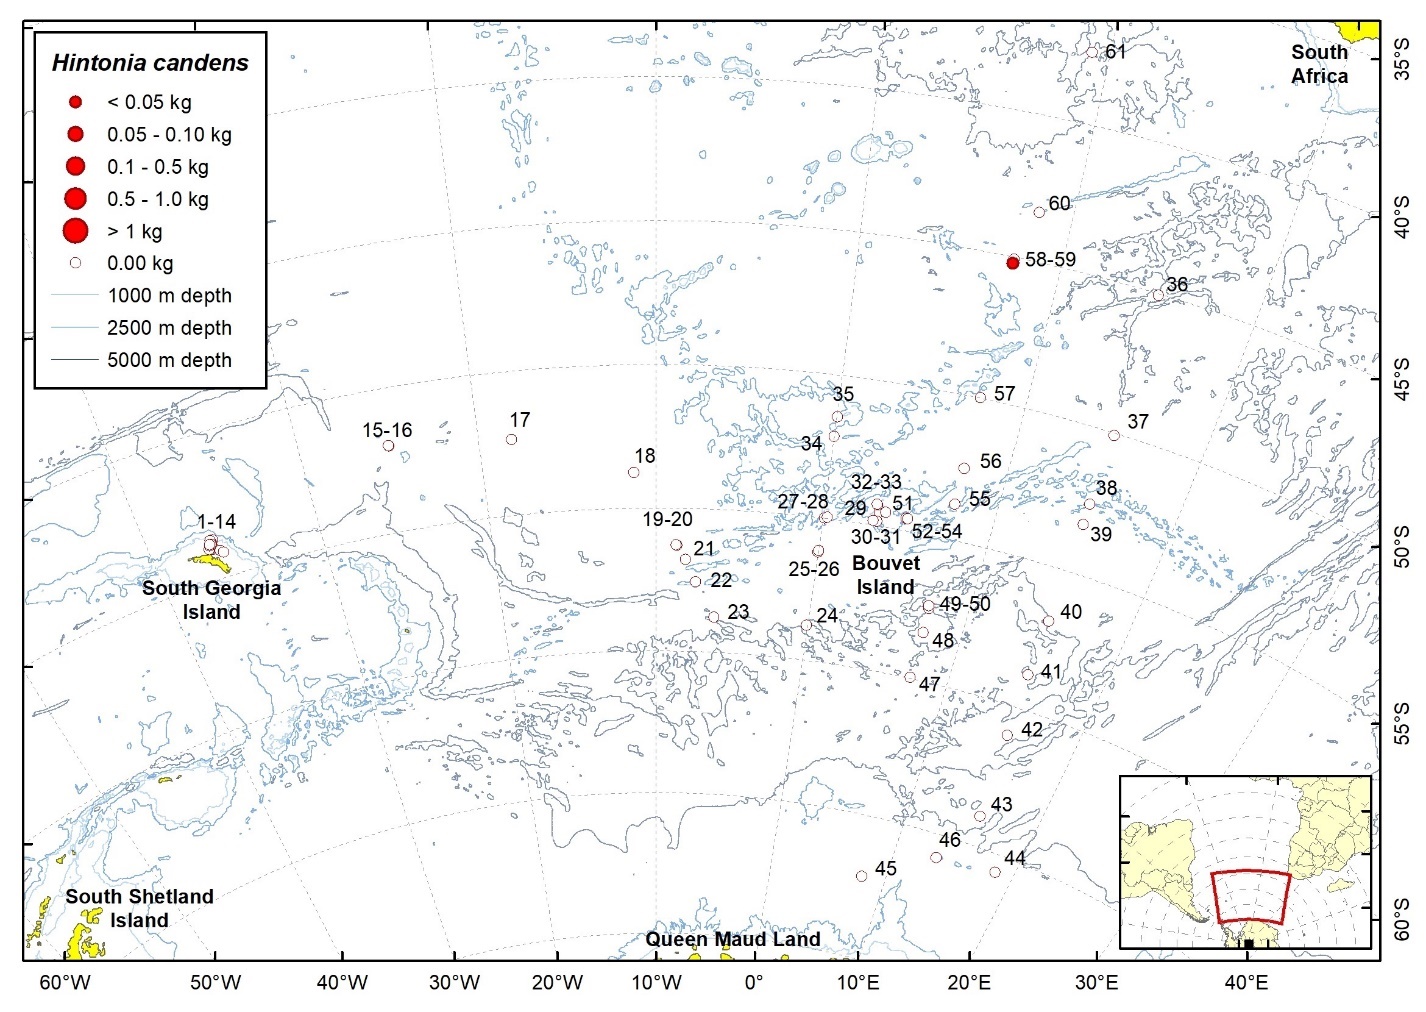
| Station | Date | Latitude | Longitude | Ind. caught | W (g) | TW fish (kg) | TW catch (kg) | ||
| 58 | 17.03.2008 | 45,20 | S | 7,65 | E | 1 | 12,0 | 10,17 | 19,92 |
2.13.16 - Krefftichthys anderssoni (Lönnberg, 1905)

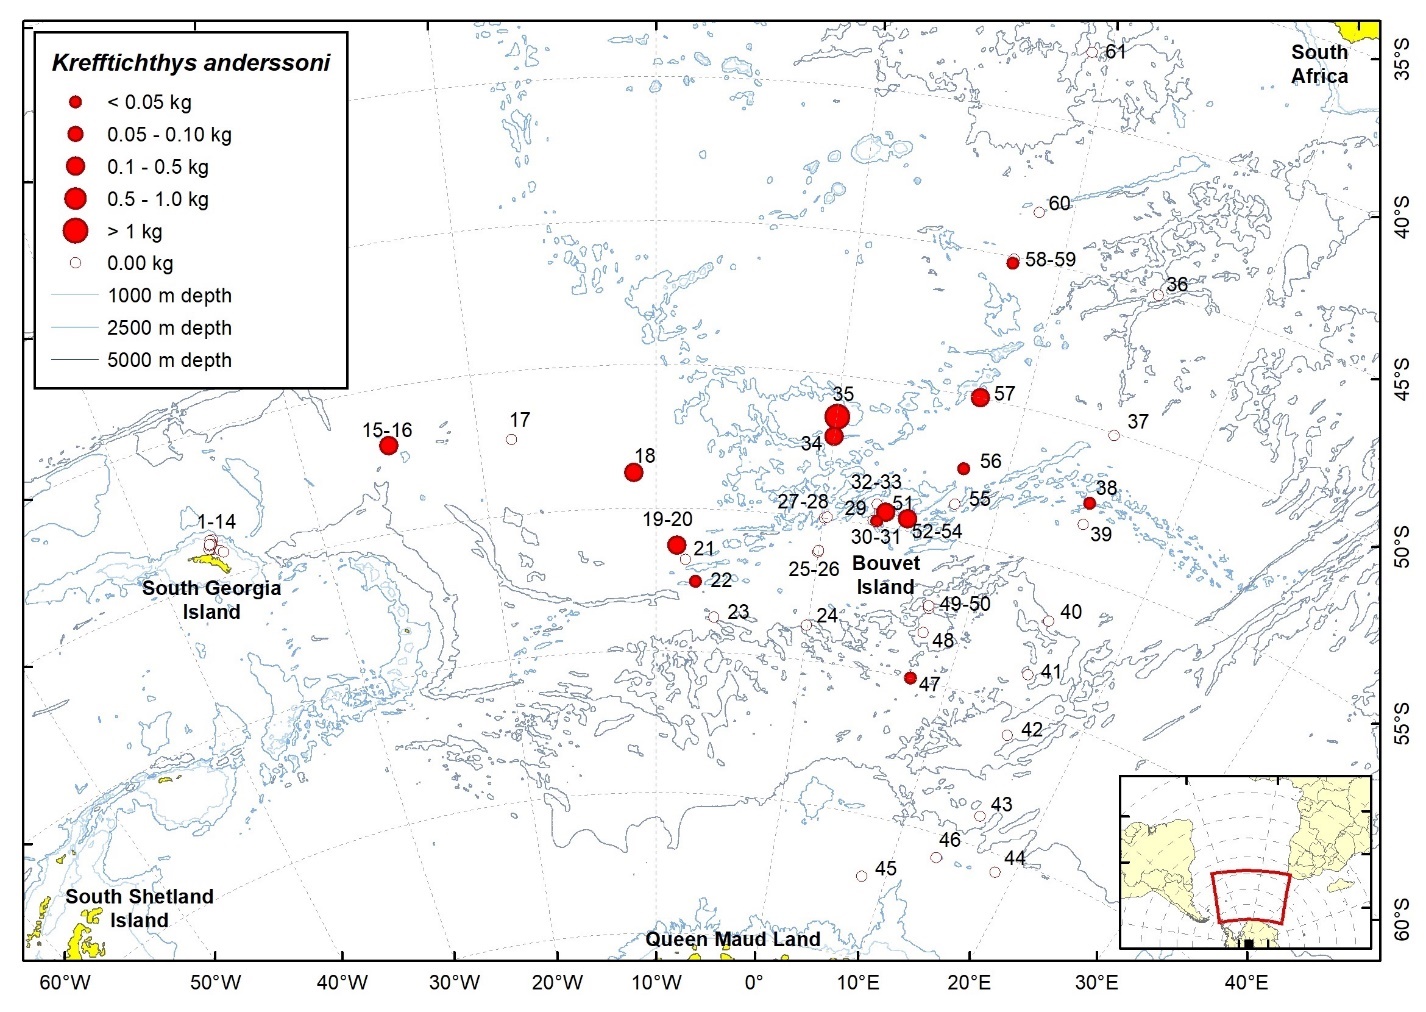
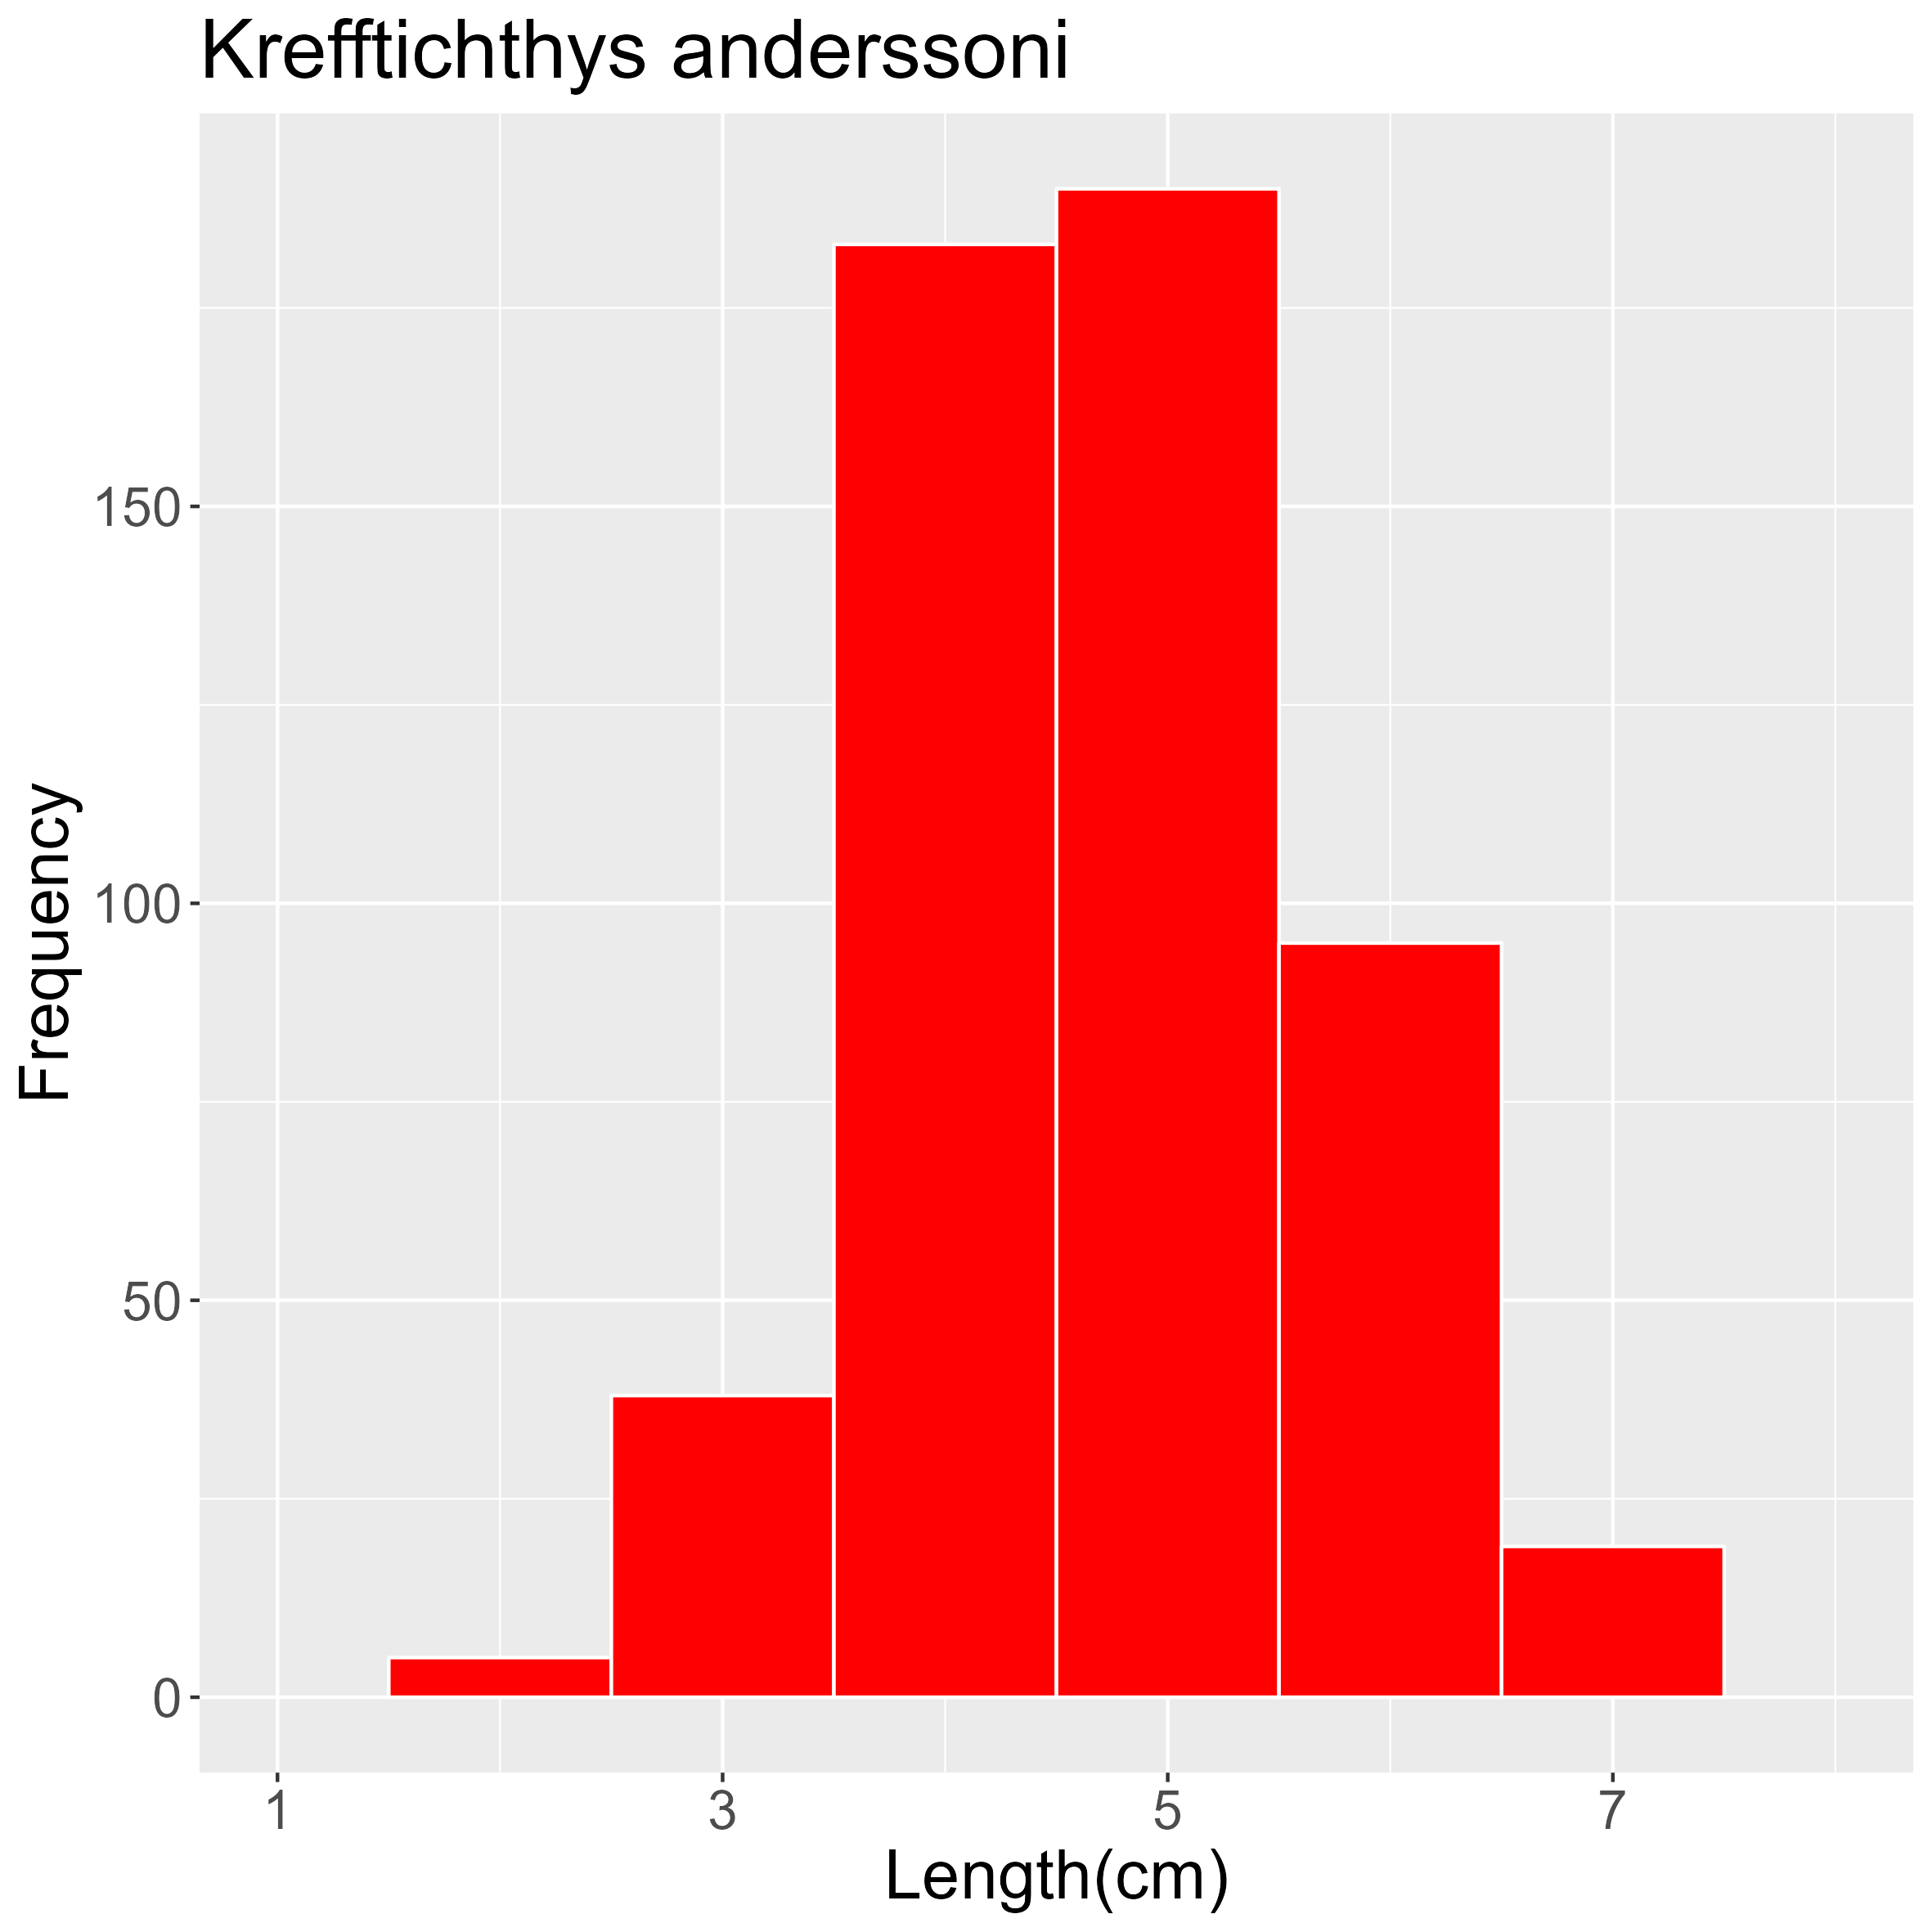
| Station | Date | Latitude | Longitude | Ind. caught | W (g) | TW fish (kg) | TW catch (kg) | ||
| 16 | 24.01.2008 | 51,99 | S | 25,00 | W | 261 | 312,6 | 3,23 | 45,05 |
| 18 | 27.01.2008 | 53,75 | S | 11,29 | W | 195 | 113,0 | 3,07 | 24,11 |
| 19 | 29.01.2008 | 56,28 | S | 8,71 | W | 241 | 135,4 | 0,16 | 49,45 |
| 22 | 30.01.2008 | 57,53 | S | 7,49 | W | 10 | 11,9 | 0,67 | 20,43 |
| 30 | 03.02.2008 | 54,84 | S | 3,23 | E | 3 | 5,3 | 1,44 | 273,78 |
| 34 | 06.02.2008 | 52,12 | S | 0,02 | W | 139 | 316,0 | 4,15 | 44,70 |
| 35 | 06.02.2008 | 51,44 | S | 0,02 | E | 1643 | 2664,0 | 2,71 | 38,52 |
| 38 | 25.02.2008 | 52,55 | S | 14,99 | E | 6 | 9,0 | 3,66 | 49,50 |
| 47 | 07.03.2008 | 59,98 | S | 7,47 | E | 1 | 5,0 | 1,58 | 44,63 |
| 51 | 11.03.2008 | 54,49 | S | 3,62 | E | 300 | 360,0 | 0,36 | 5000,36 |
| 54 | 13.03.2008 | 54,58 | S | 4,98 | E | 184 | 257,0 | 0,26 | 85,64 |
| 56 | 14.03.2008 | 52,51 | S | 7,53 | E | 4 | 3,8 | 0,44 | 188,87 |
| 57 | 15.03.2008 | 49,98 | S | 7,53 | E | 105 | 196,0 | 0,22 | 40,00 |
| 58 | 17.03.2008 | 45,20 | S | 7,65 | E | 1 | 2,0 | 10,17 | 19,92 |
2.13.17 - Lampanyctus achirus Andriashev, 1962

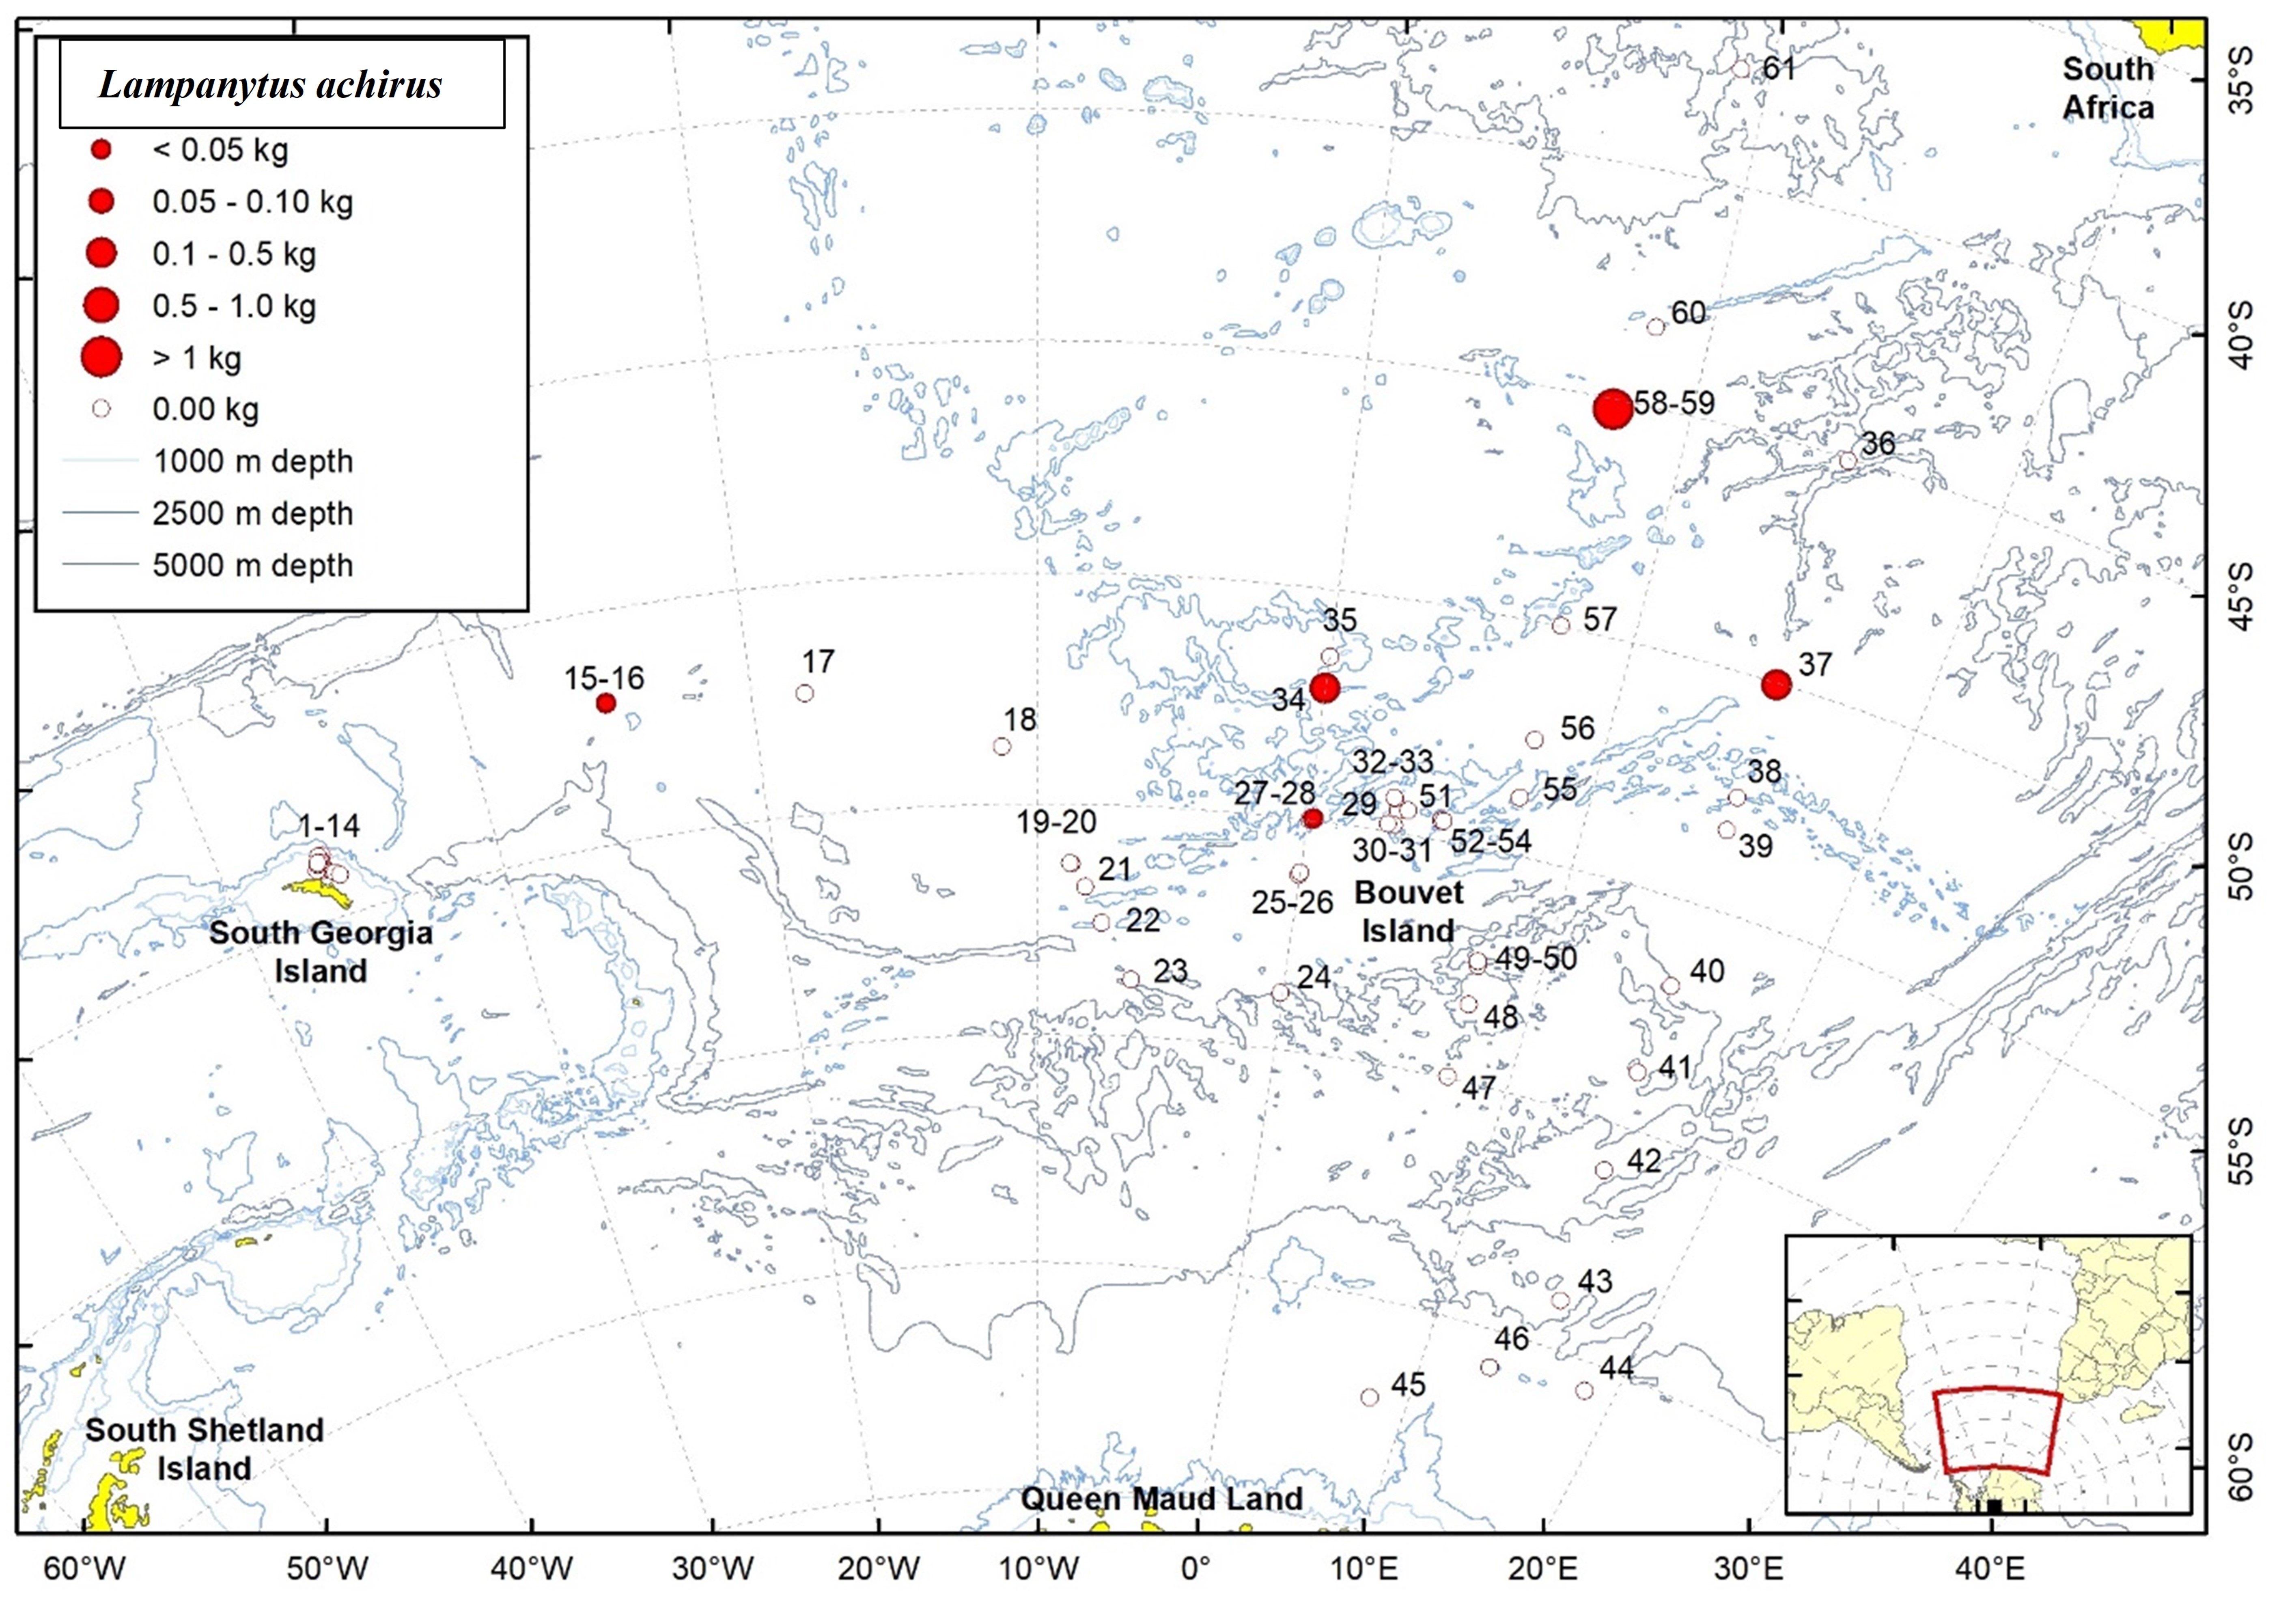
| Station | Date | Latitude | Longitude | Ind. caught | W (g) | TW fish (kg) | TW catch (kg) | ||
| 16 | 24.01.2008 | 51,98 | S | 25,04 | W | 2 | 22,2 | 3,23 | 45,05 |
| 28 | 02.02.2008 | 54,95 | S | 0,20 | E | 1 | 17,4 | 0,47 | 89,03 |
| 34 | 06.02.2008 | 52,12 | S | 0,02 | W | 8 | 164,0 | 4,15 | 44,70 |
| 37 | 24.02.2008 | 50,04 | S | 15,02 | E | 8 | 158,0 | 3,32 | 4,28 |
| 58 | 17.03.2008 | 45,20 | S | 7,65 | E | 154 | 3260,0 | 10,17 | 19,92 |
2.13.18 - Lampanyctus ater Tåning, 1928

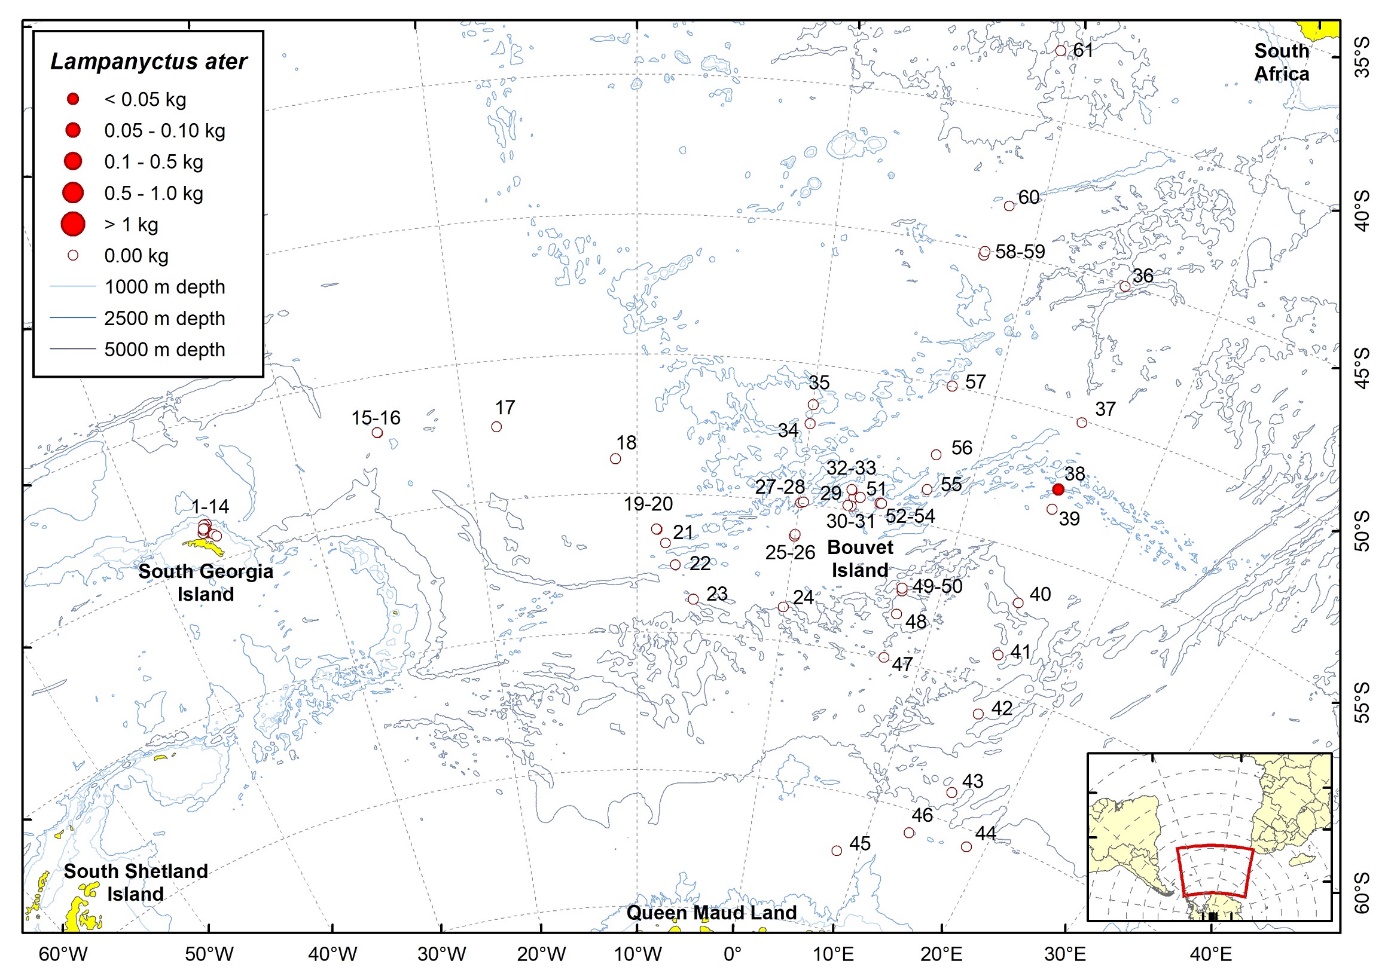
| Station | Date | Latitude | Longitude | Ind. caught | W (g) | TW fish (kg) | TW catch (kg) | ||
| 38 | 25.02.2008 | 52,57 | S | 15,00 | E | 1 | 4,5 | 3,66 | 49,50 |
2.13.19 - Lampanyctus australis Tåning, 1932
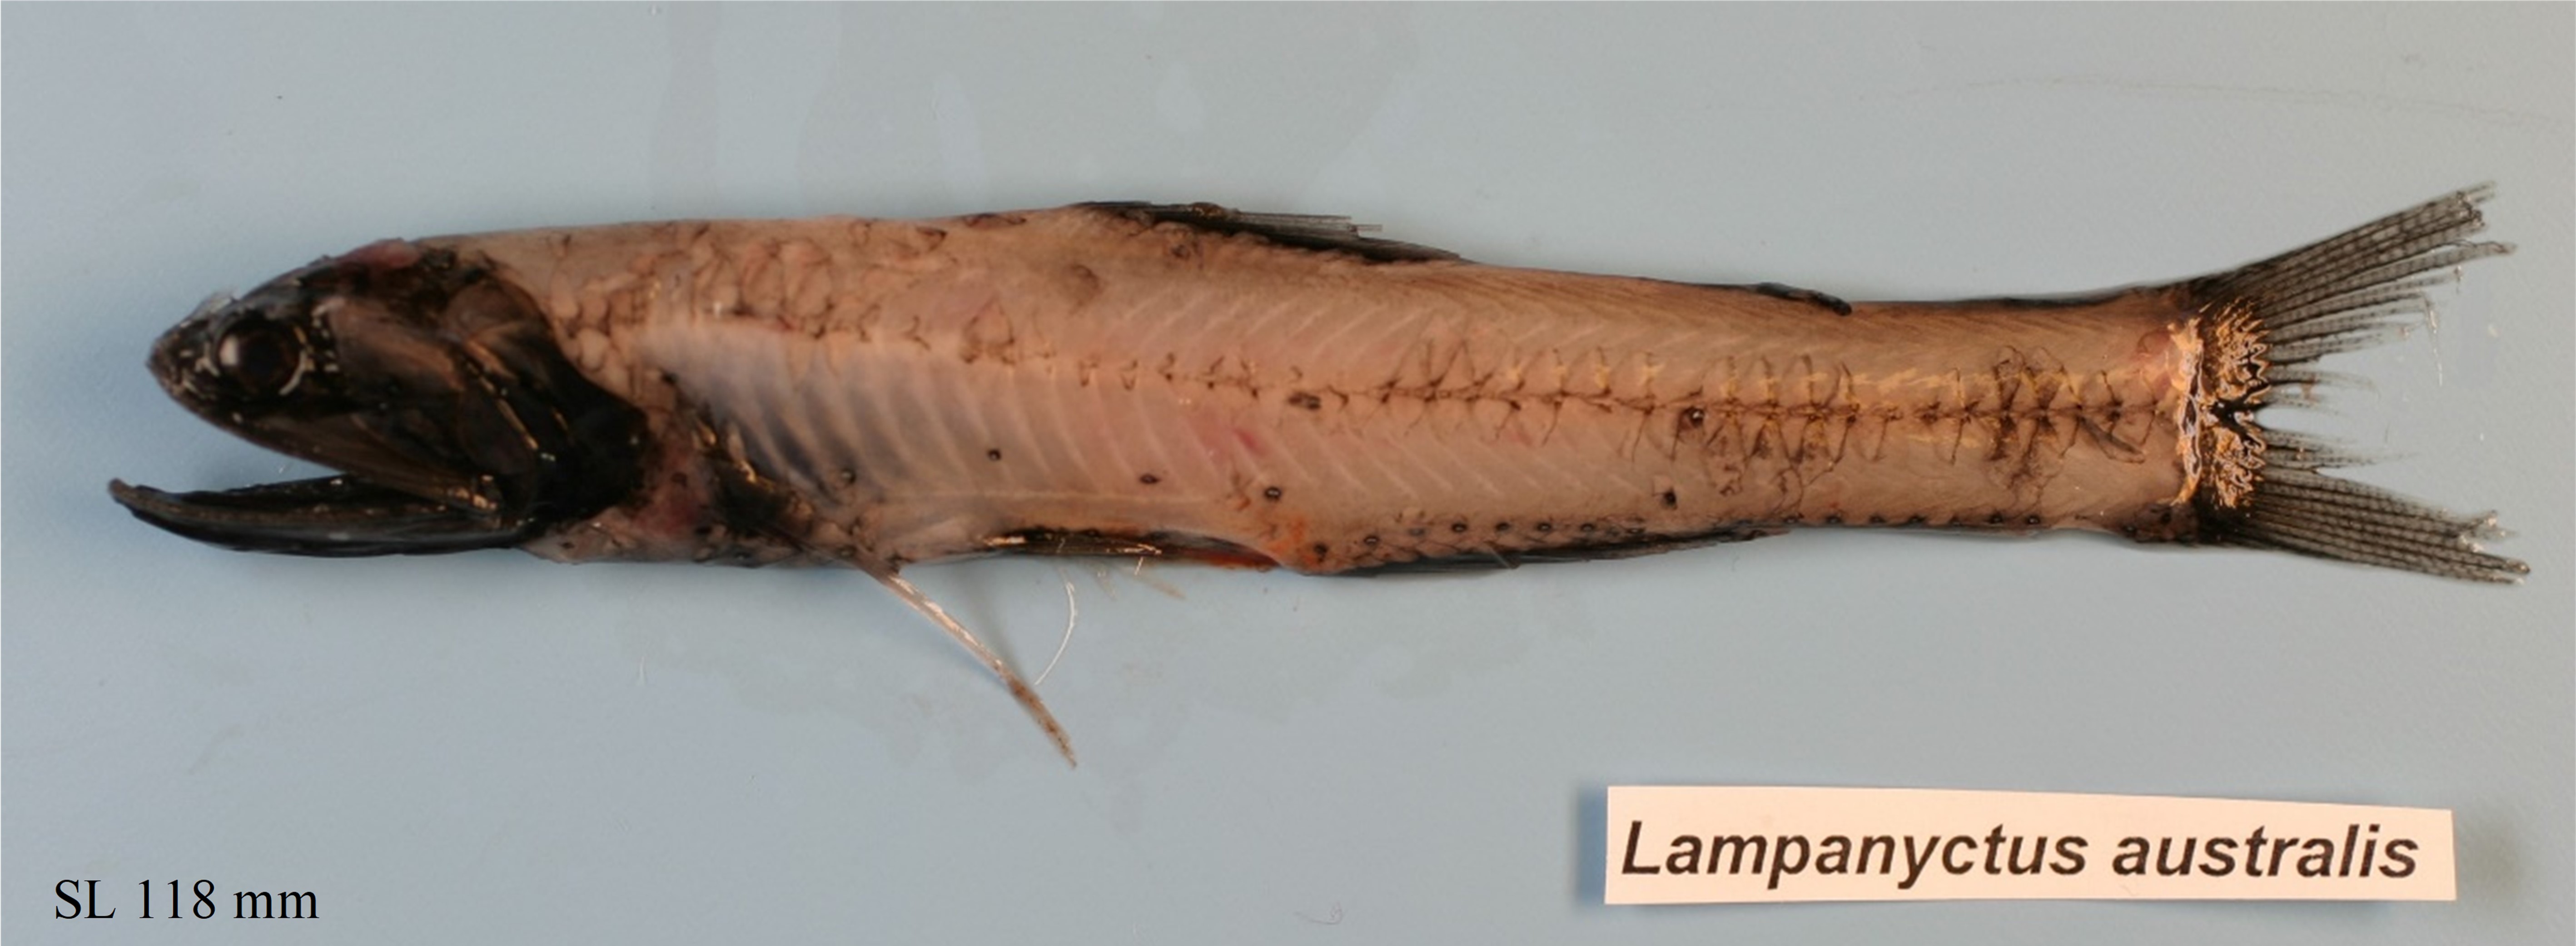
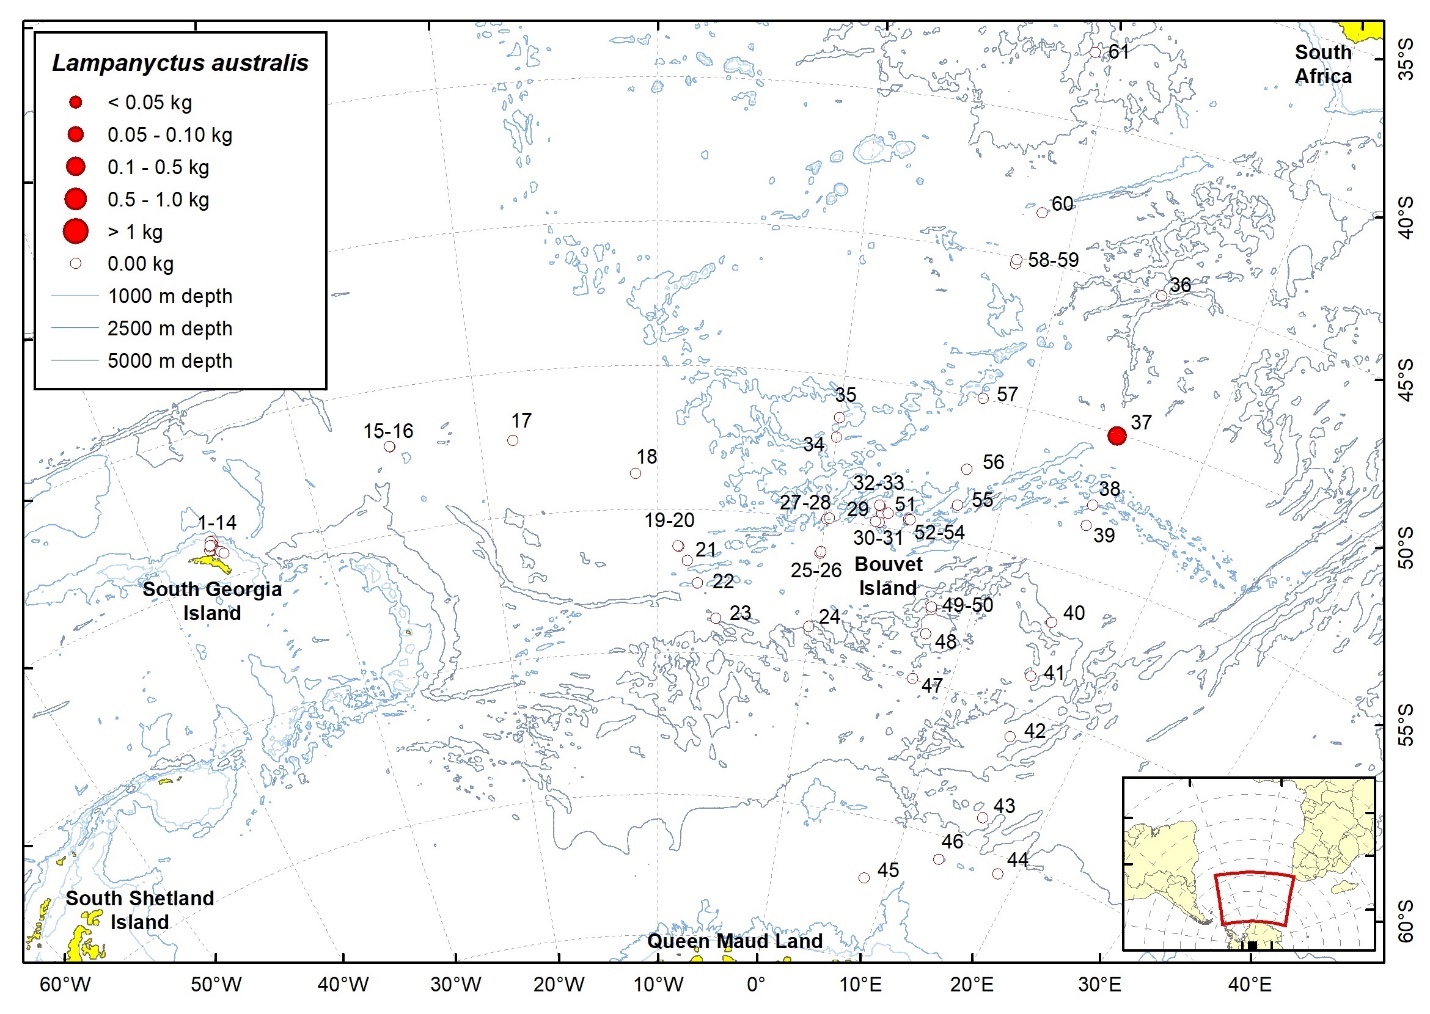
| Station | Date | Latitude | Longitude | Ind. caught | W (g) | TW fish (kg) | TW catch (kg) | ||
| 37 | 24.02.2008 | 50,04 | S | 15,02 | E | 10 | 229,0 | 3,32 | 14,43 |
2.13.20 - Lampanyctus intricarius Tåning, 1928

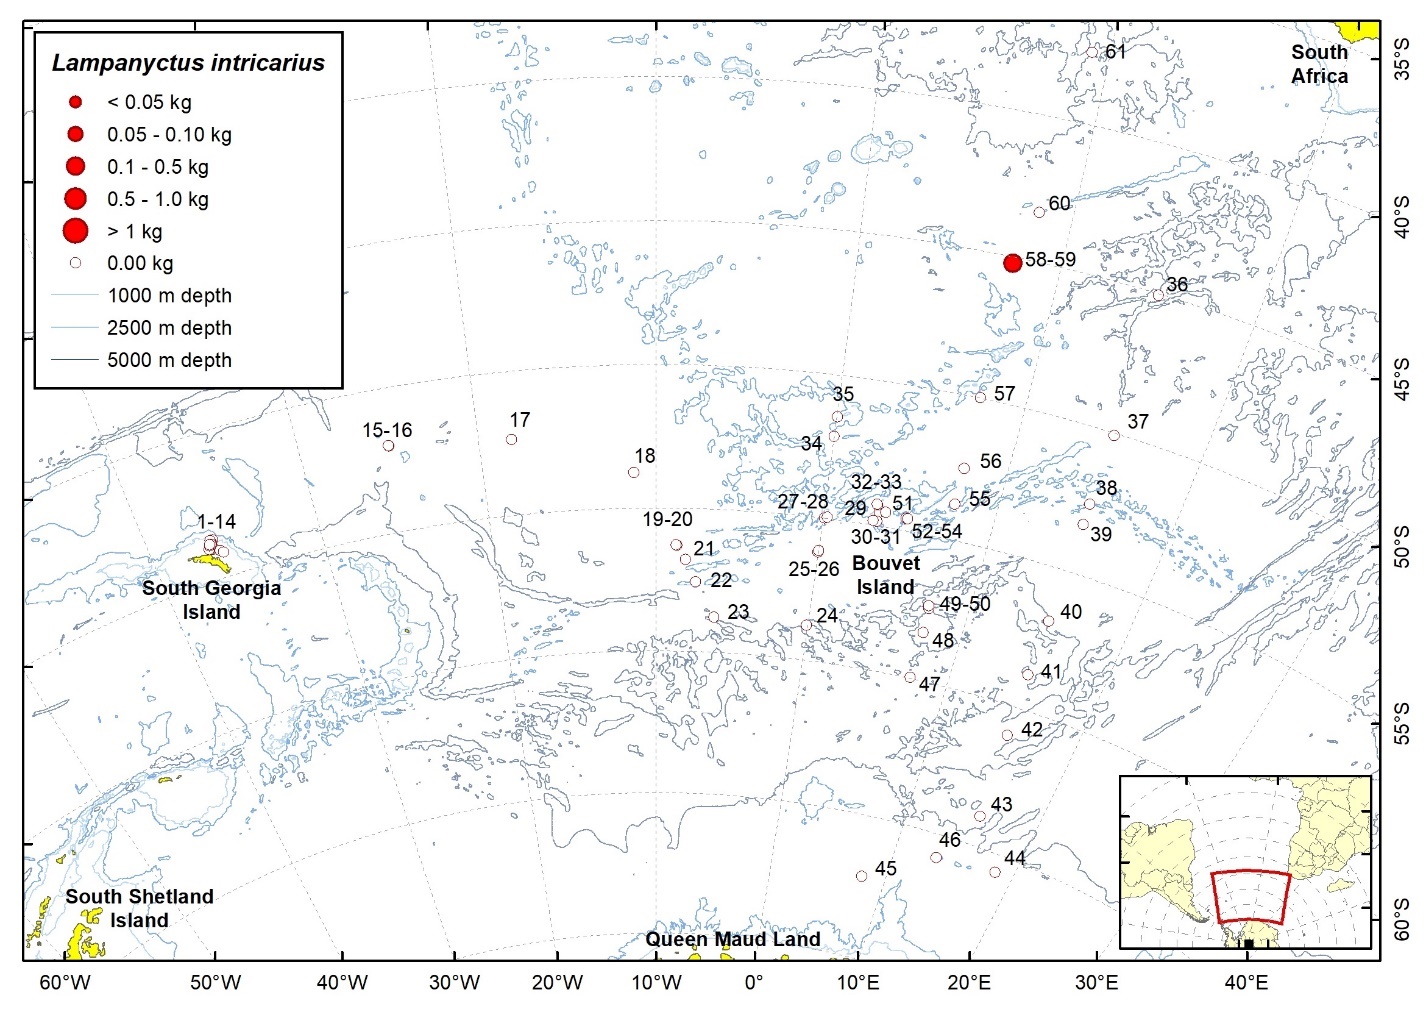
| Station | Date | Latitude | Longitude | Ind. caught | W (g) | TW fish (kg) | TW catch (kg) | ||
| 58 | 17.03.2008 | 45,20 | S | 7,65 | E | 3 | 133,0 | 10,17 | 19,92 |
2.13.21 - Lampanyctus macdonaldi (Goode & Bean, 1896)

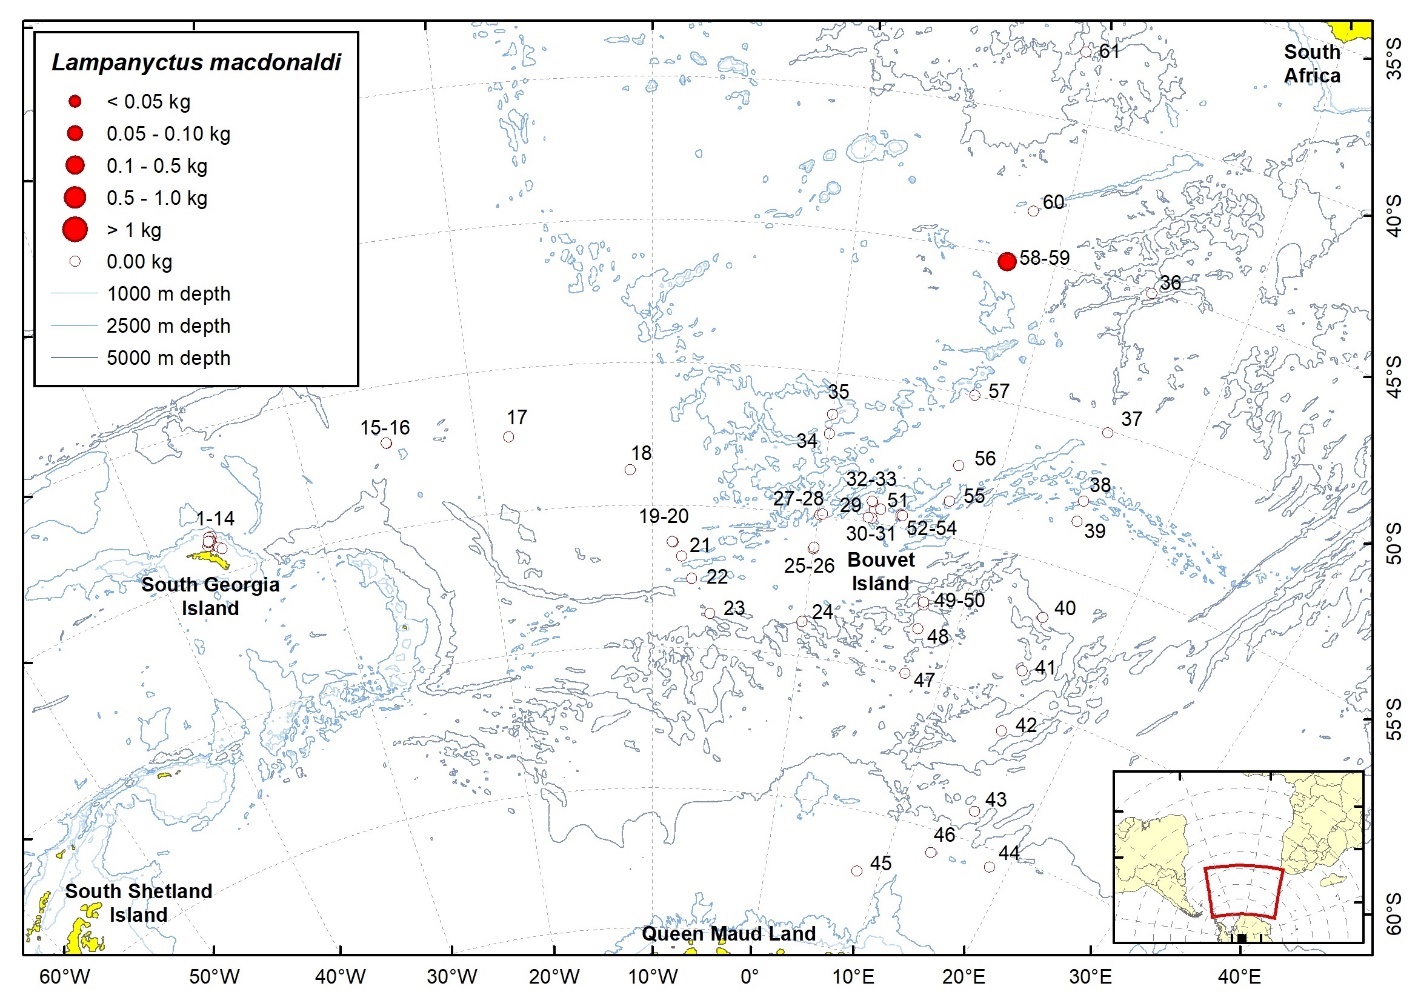
| Station | Date | Latitude | Longitude | Ind. caught | W (g) | TW fish (kg) | TW catch (kg) | ||
| 58 | 17.03.2008 | 45,20 | S | 7,65 | E | 11 | 198,0 | 10,17 | 19,92 |
2.13.22 - Metelectrona spp.
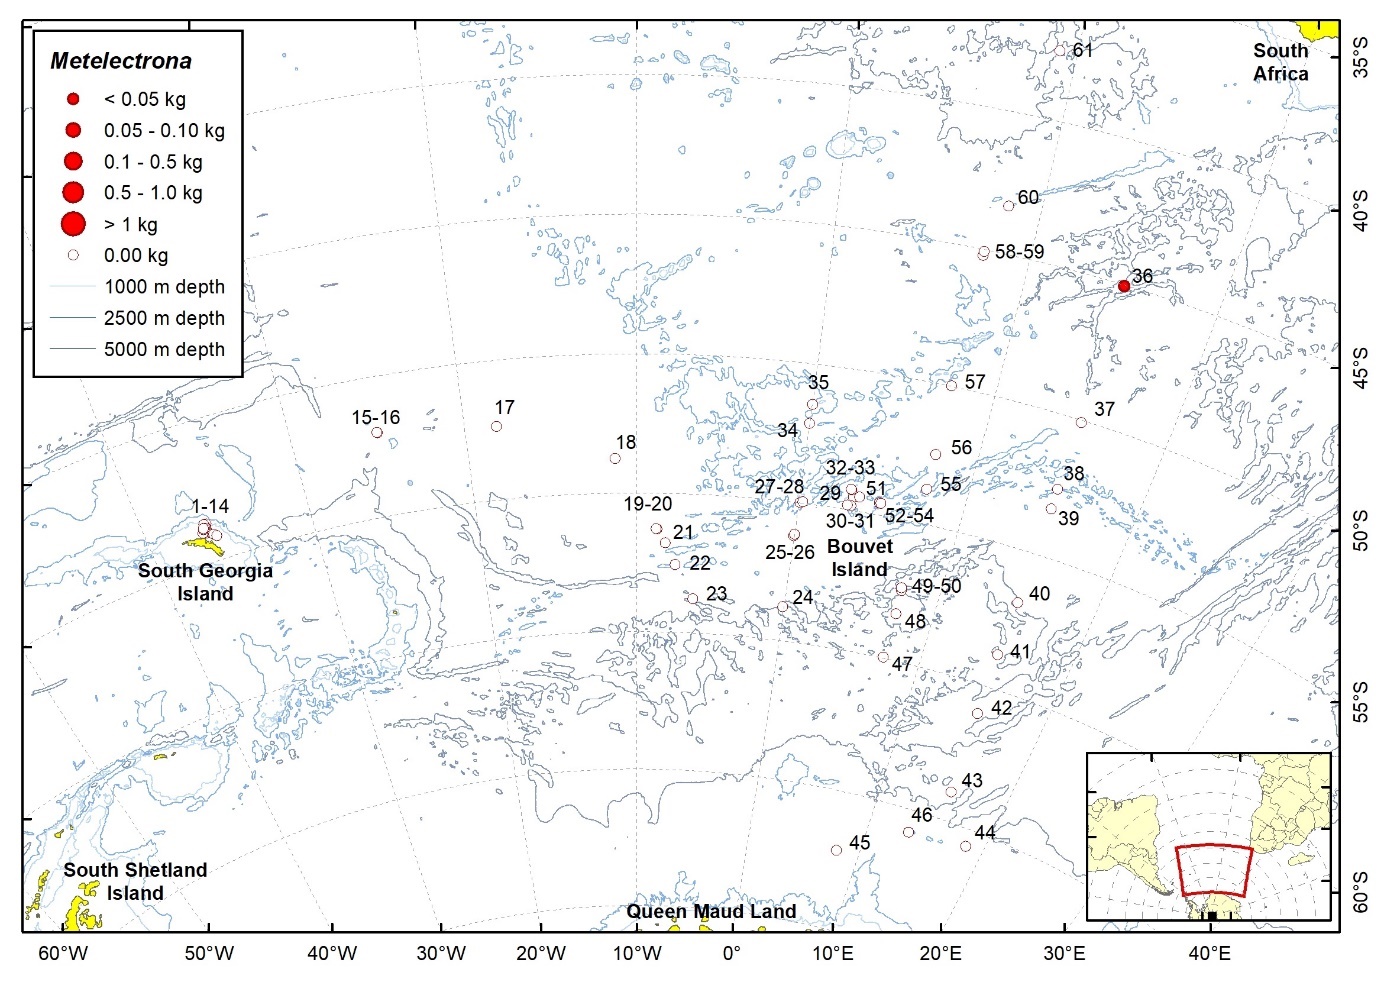
| Station | Date | Latitude | Longitude | Ind. caught | W (g) | TW fish (kg) | TW catch (kg) | ||
| 36 | 22.02.2008 | 45,04 | S | 15,00 | E | 2 | 4,9 | 1,60 | 4,28 |
2.13.23 - Protomyctophum andriashevi Becker, 1963
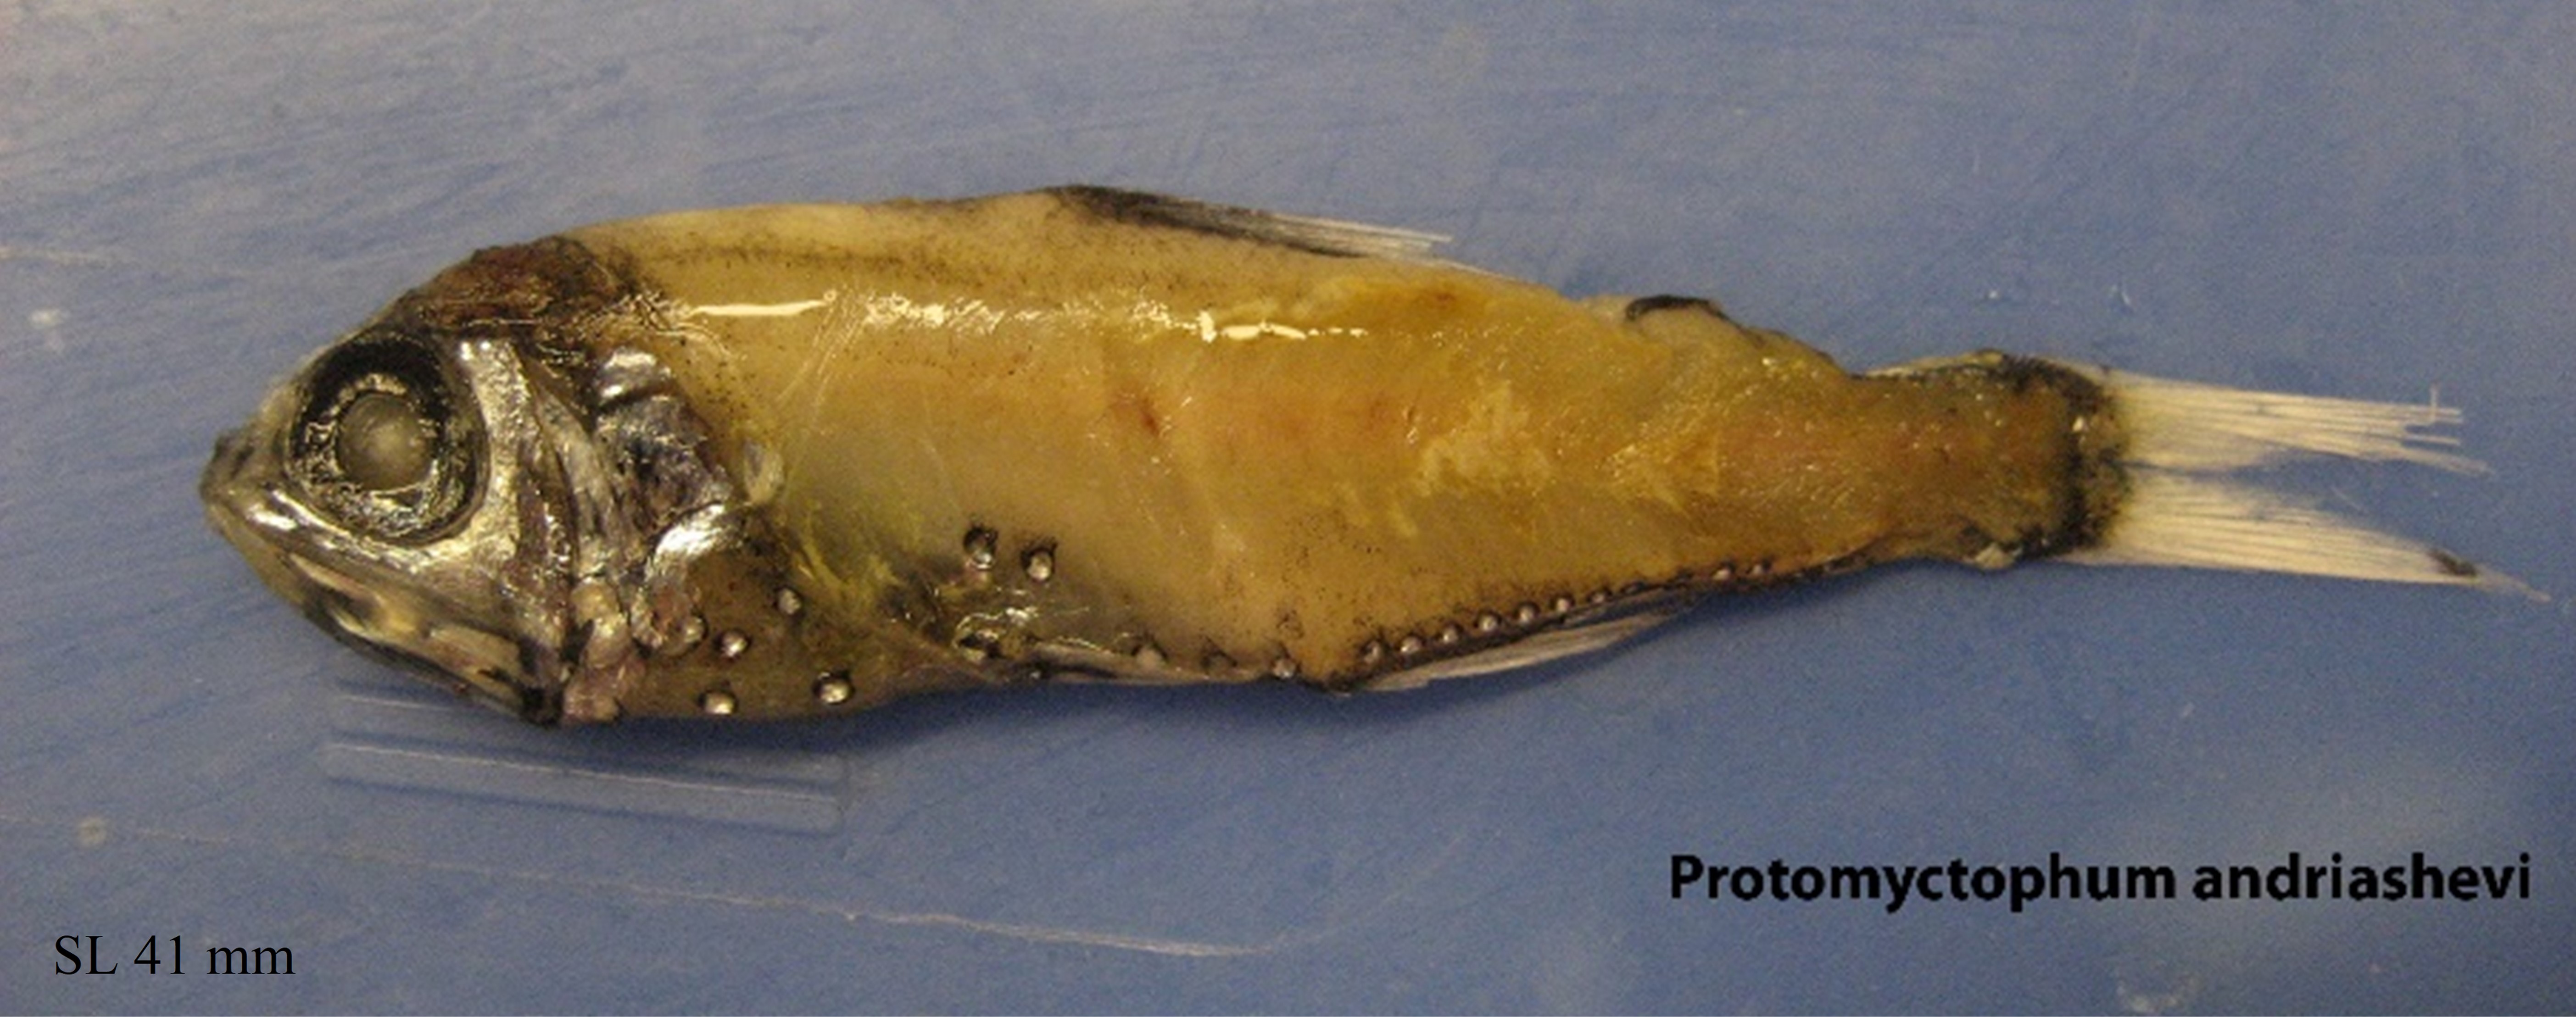
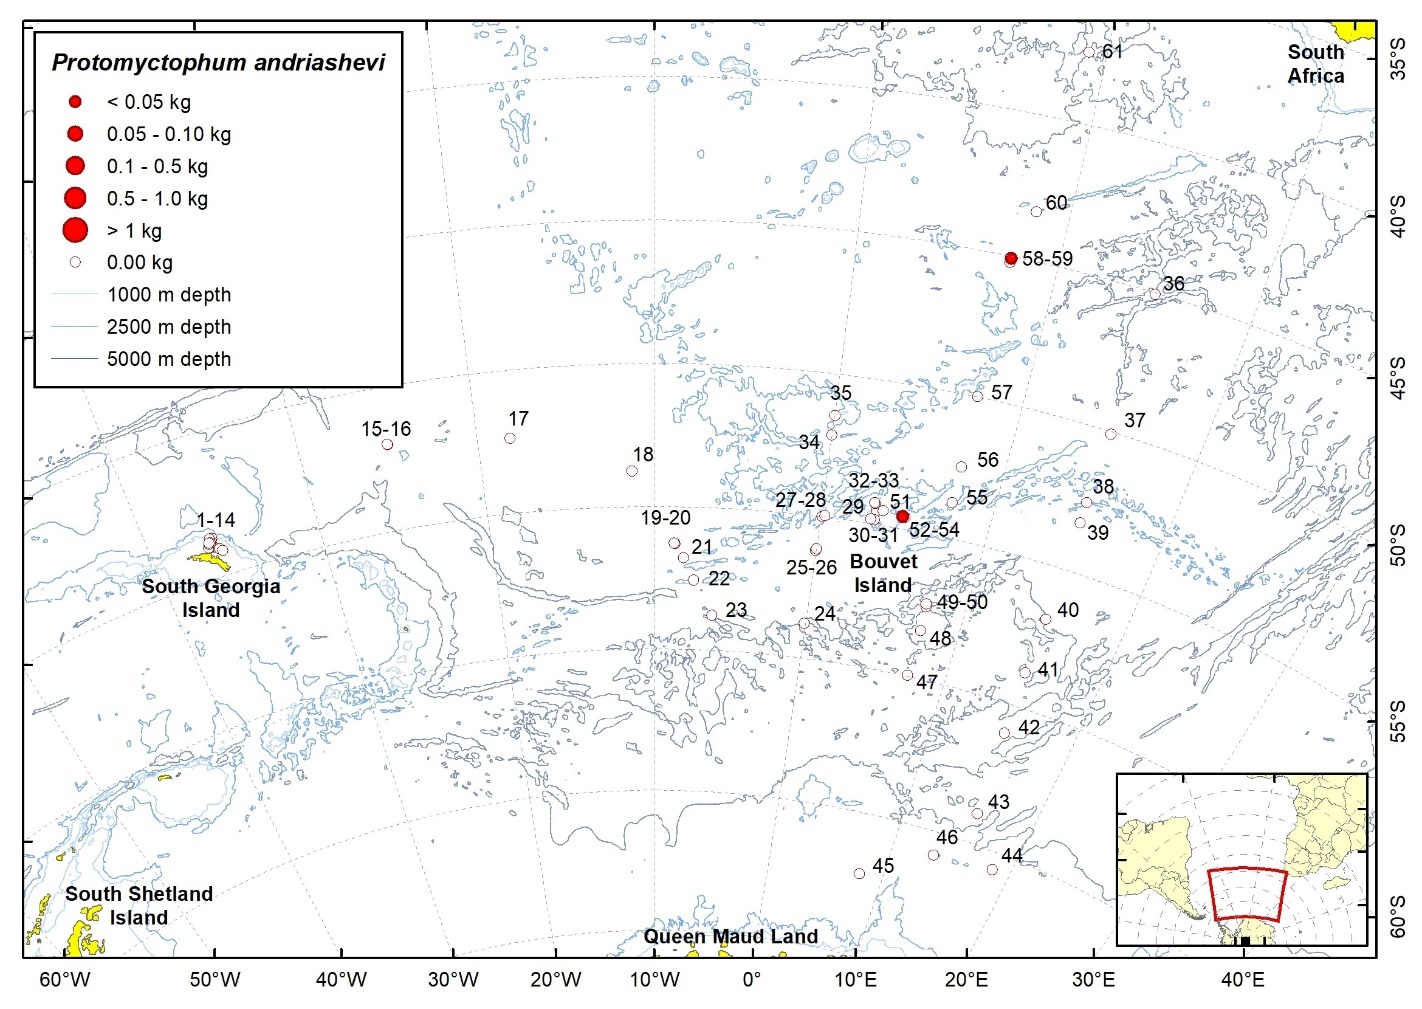
| Station | Date | Latitude | Longitude | Ind. caught | W (g) | TW fish (kg) | TW catch (kg) | ||
| 53 | 12.03.2008 | 54,57 | S | 4,83 | E | 1 | 1,1 | 0,07 | 4,33 |
| 59 | 17.03.2008 | 45,06 | S | 7,67 | E | 4 | 4,3 | 1,02 | 5,63 |
2.13.24 - Protomyctophum bolini (Fraser-Brunner, 1949)
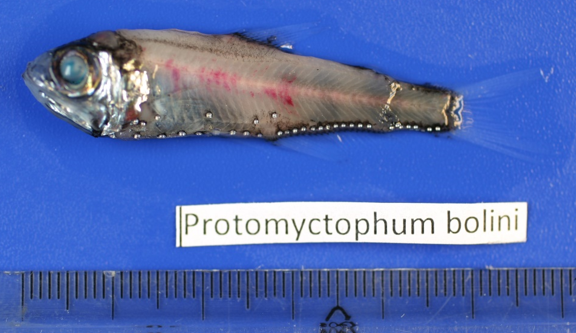
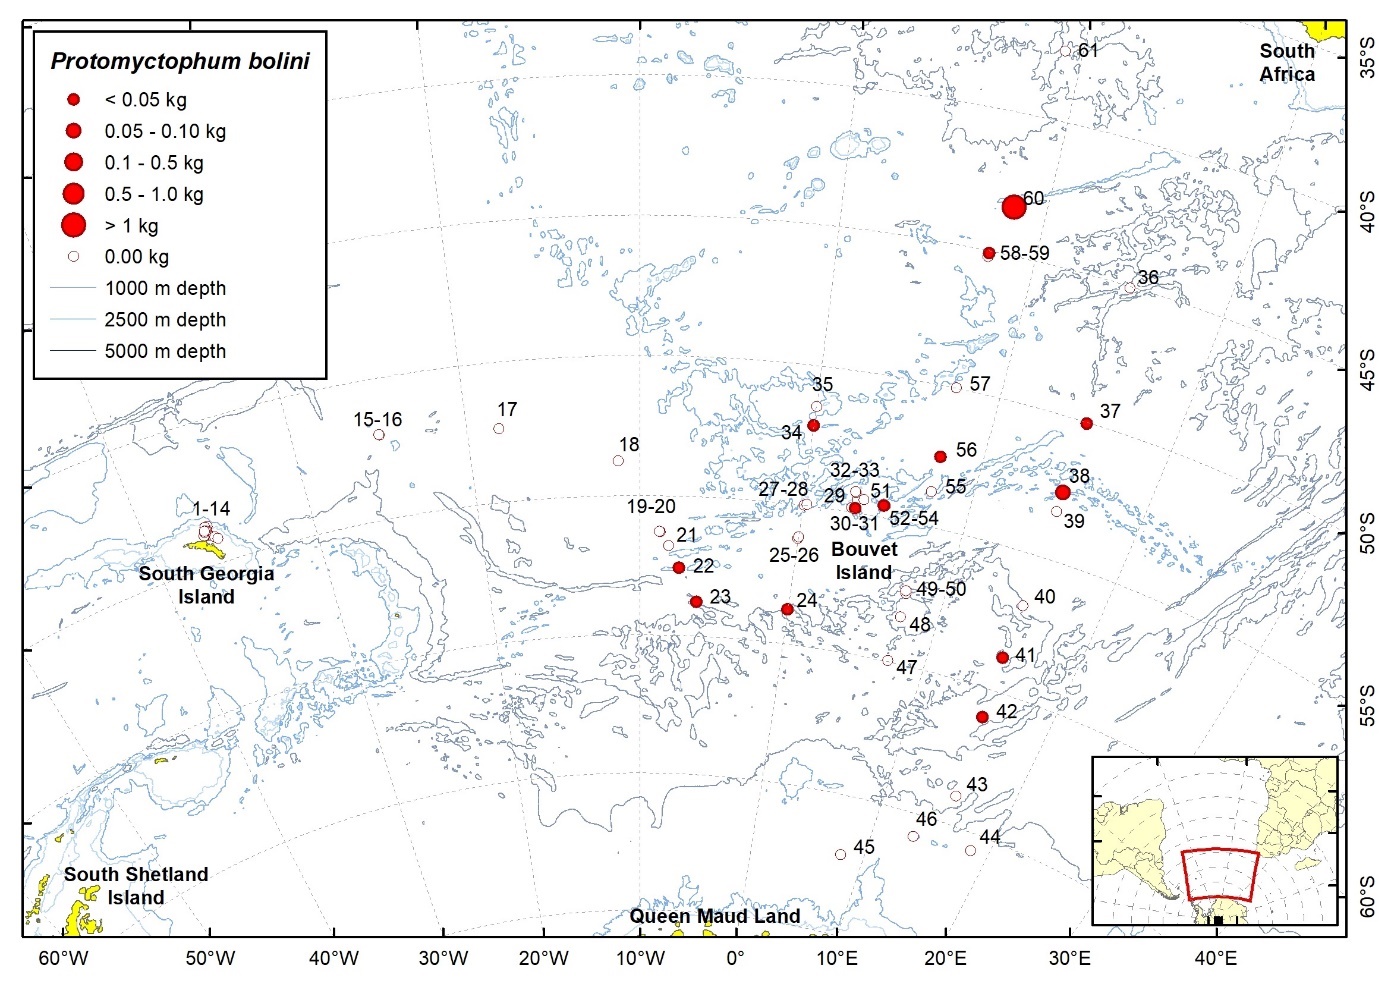
| Station | Date | Latitude | Longitude | Ind. caught | W (g) | TW fish (kg) | TW catch (kg) | ||
| 22 | 30.01.2008 | 57,57 | S | 7,47 | W | 1 | 0,9 | 0,67 | 20,43 |
| 23 | 30.01.2008 | 58,76 | S | 6,22 | W | 10 | 21,6 | 4,14 | 13,02 |
| 24 | 31.01.2008 | 58,76 | S | 0,04 | W | 1 | 3,0 | 1,49 | 29,02 |
| 30 | 03.02.2008 | 54,85 | S | 3,20 | E | 6 | 35,2 | 1,44 | 273,78 |
| 34 | 06.02.2008 | 52,12 | S | 0,02 | W | 16 | 36,0 | 4,15 | 44,70 |
| 37 | 24.02.2008 | 50,04 | S | 15,02 | E | 1 | 2,4 | 3,32 | 14,43 |
| 38 | 25.02.2008 | 52,60 | S | 15,01 | E | 113 | 52,0 | 3,66 | 49,50 |
| 41 | 27.02.2008 | 58,78 | S | 14,99 | E | 6 | 10,2 | 0,34 | 210,17 |
| 42 | 28.02.2008 | 61,00 | S | 15,14 | E | 6 | 4,0 | 0,59 | 50,67 |
| 53 | 12.03.2008 | 54,58 | S | 4,91 | E | 7 | 7,3 | 0,07 | 4,33 |
| 56 | 14.03.2008 | 52,49 | S | 7,54 | E | 9 | 7,0 | 0,44 | 188,87 |
| 59 | 17.03.2008 | 45,11 | S | 7,66 | E | 3 | 12,7 | 1,02 | 5,63 |
| 60 | 18.03.2008 | 43,29 | S | 8,40 | E | 1121 | 110142,5 | 110,70 | 332,36 |
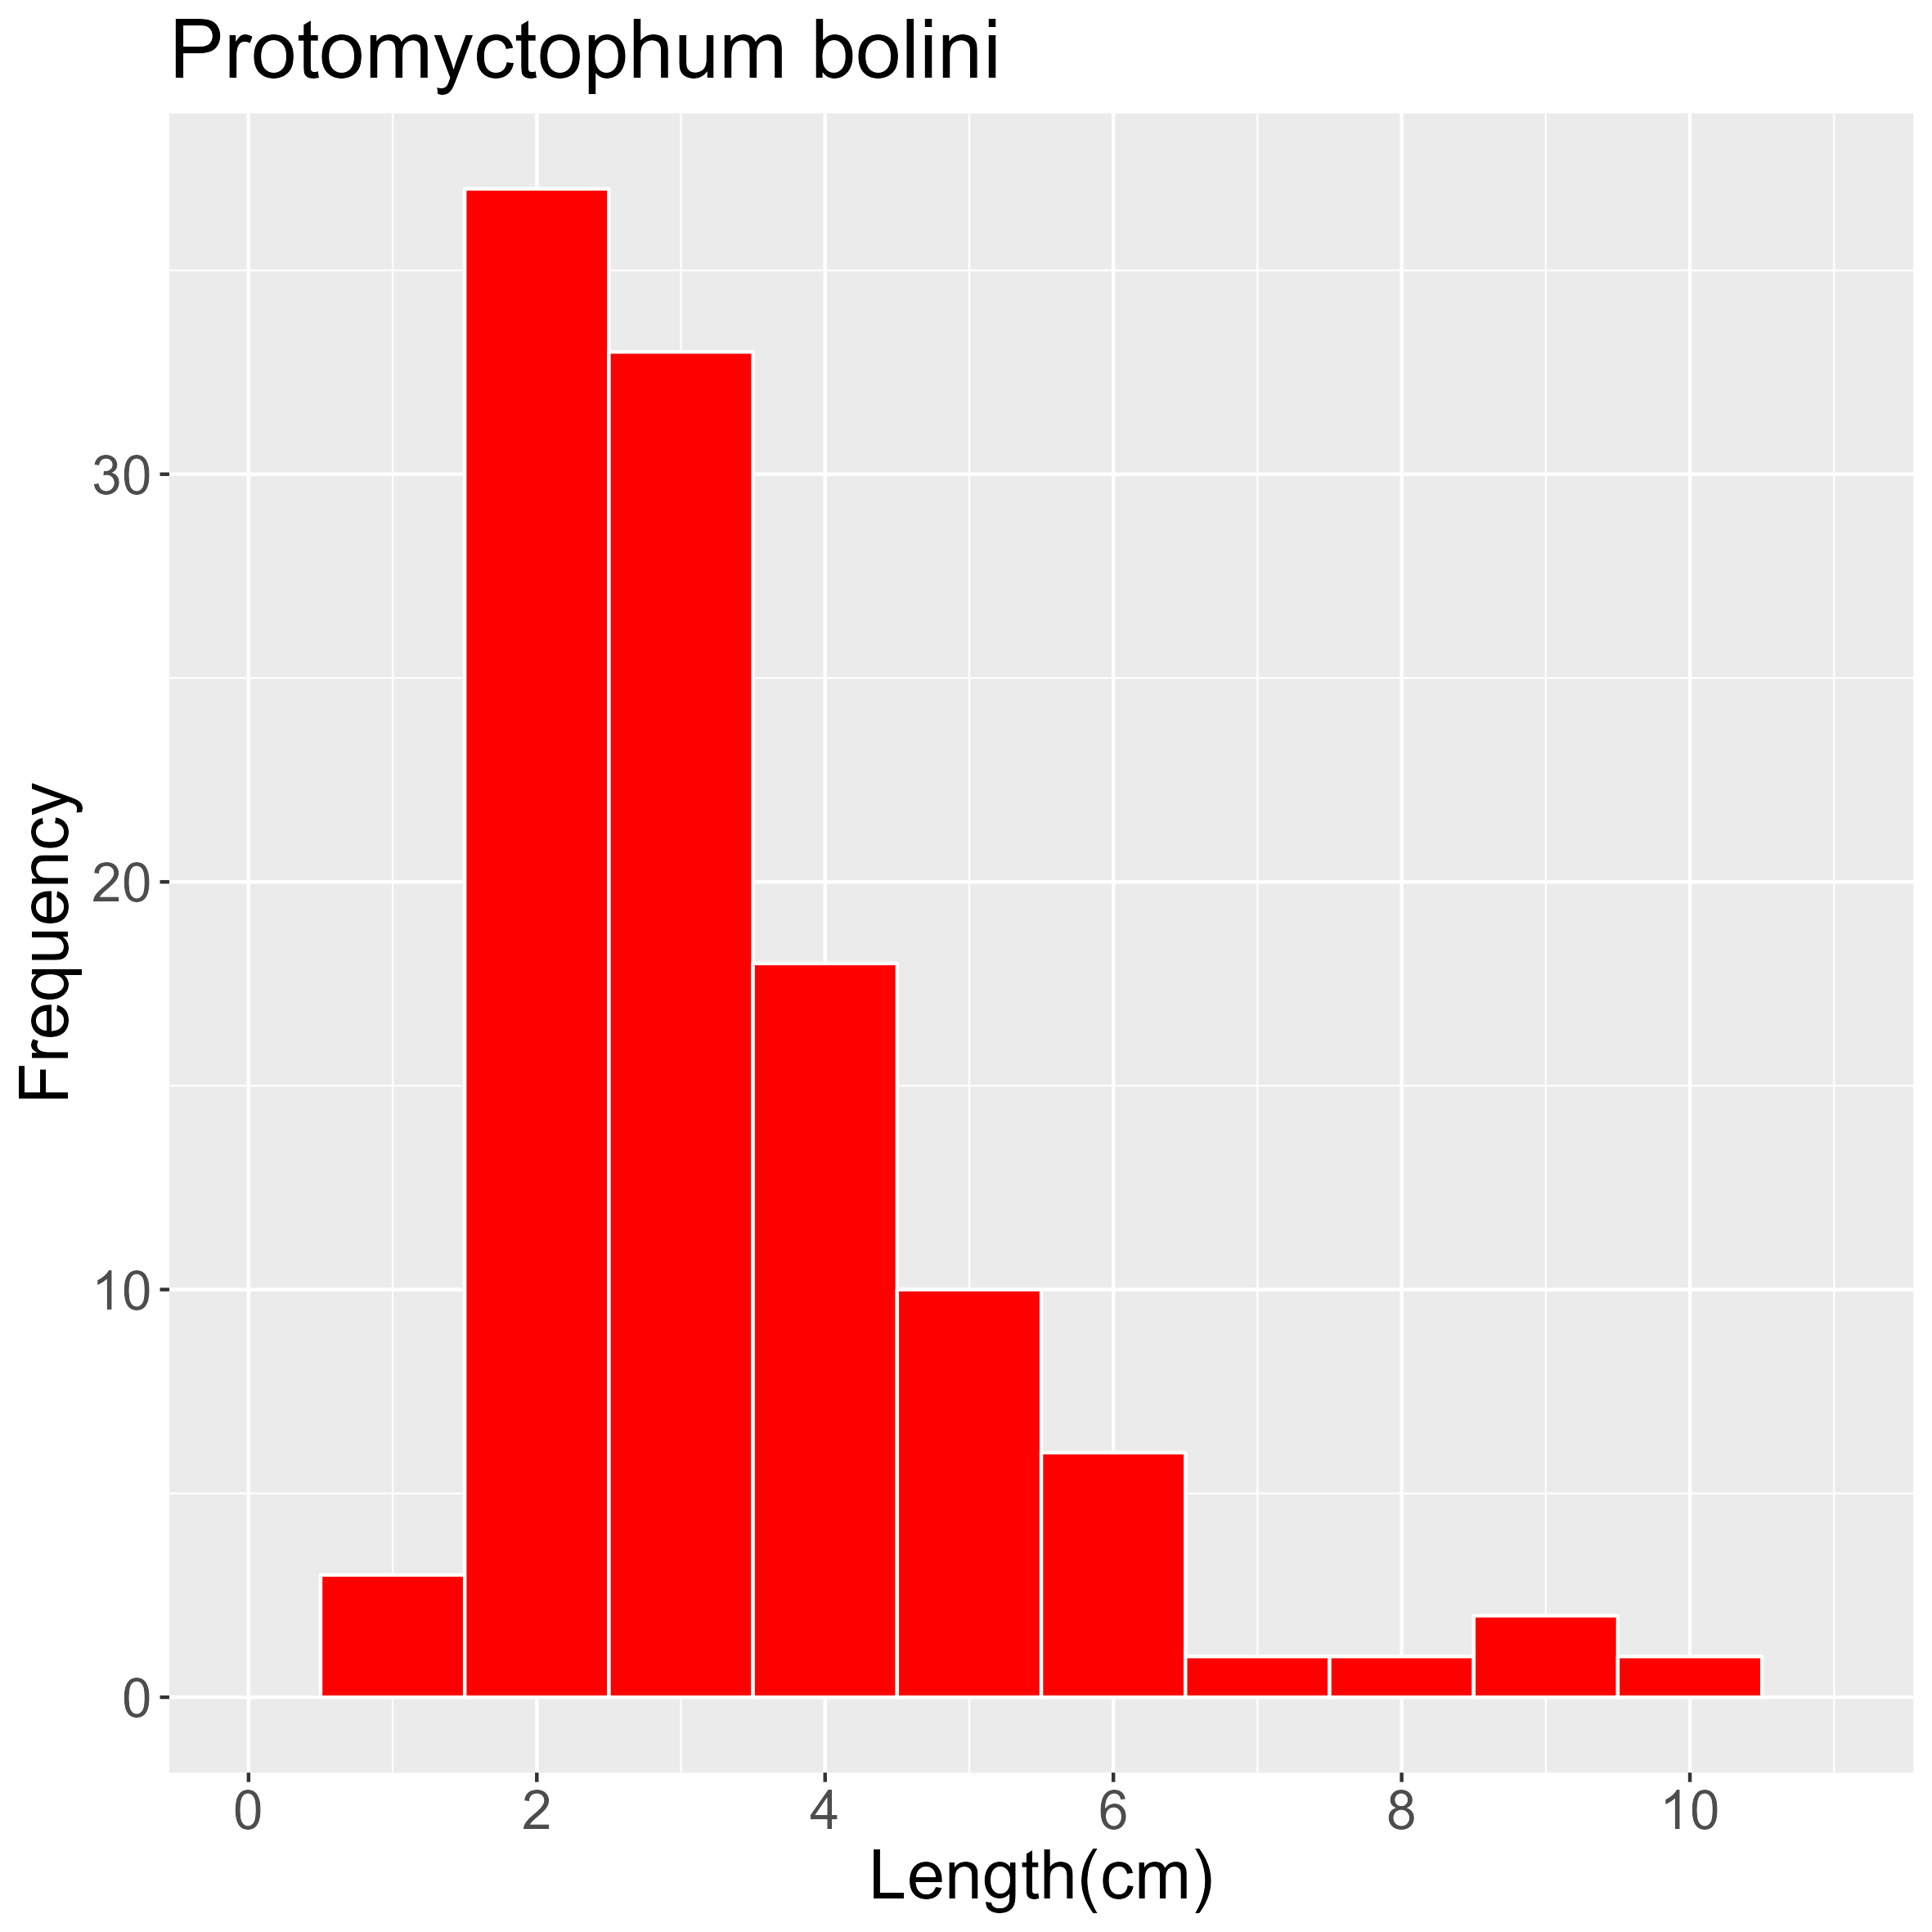
2.13.25 - Protomyctophum choriodon Hulley, 1981
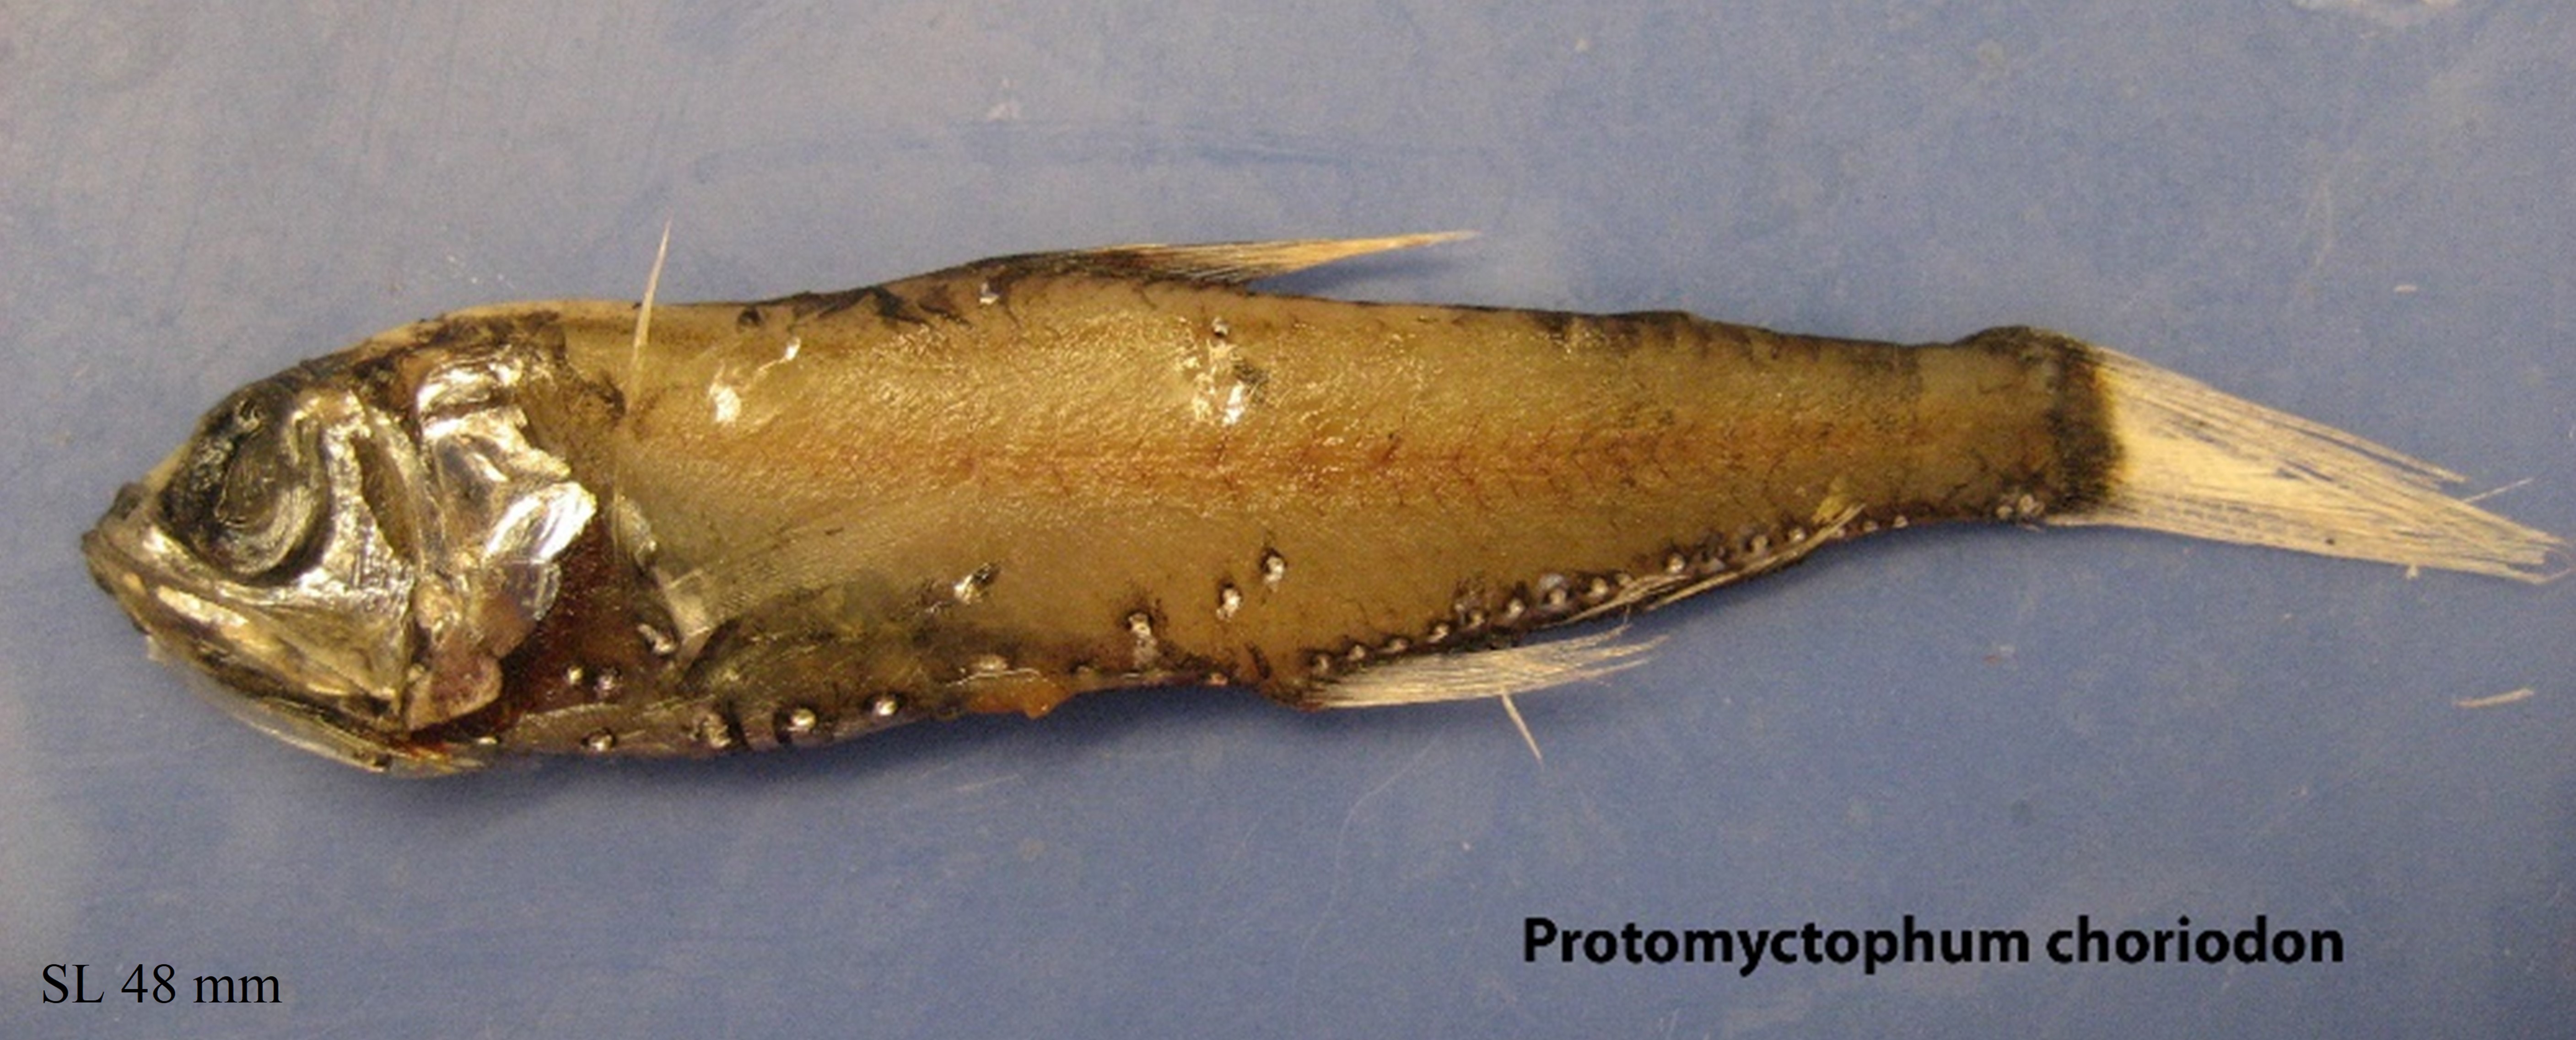
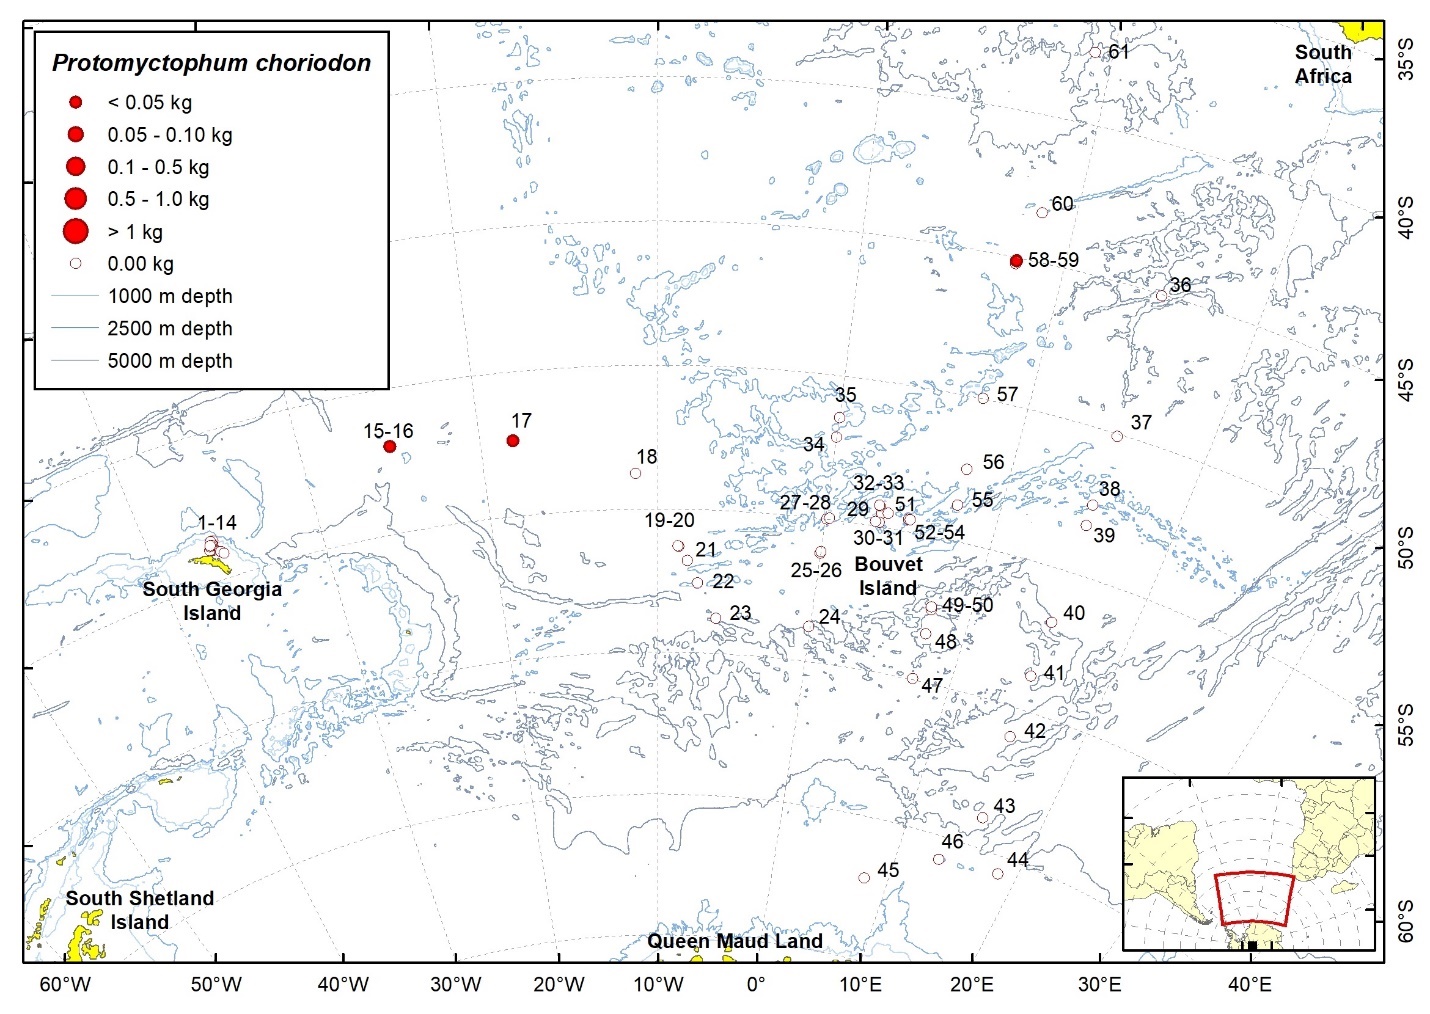
| Station | Date | Latitude | Longitude | Ind. caught | W (g) | TW fish (kg) | TW catch (kg) | ||
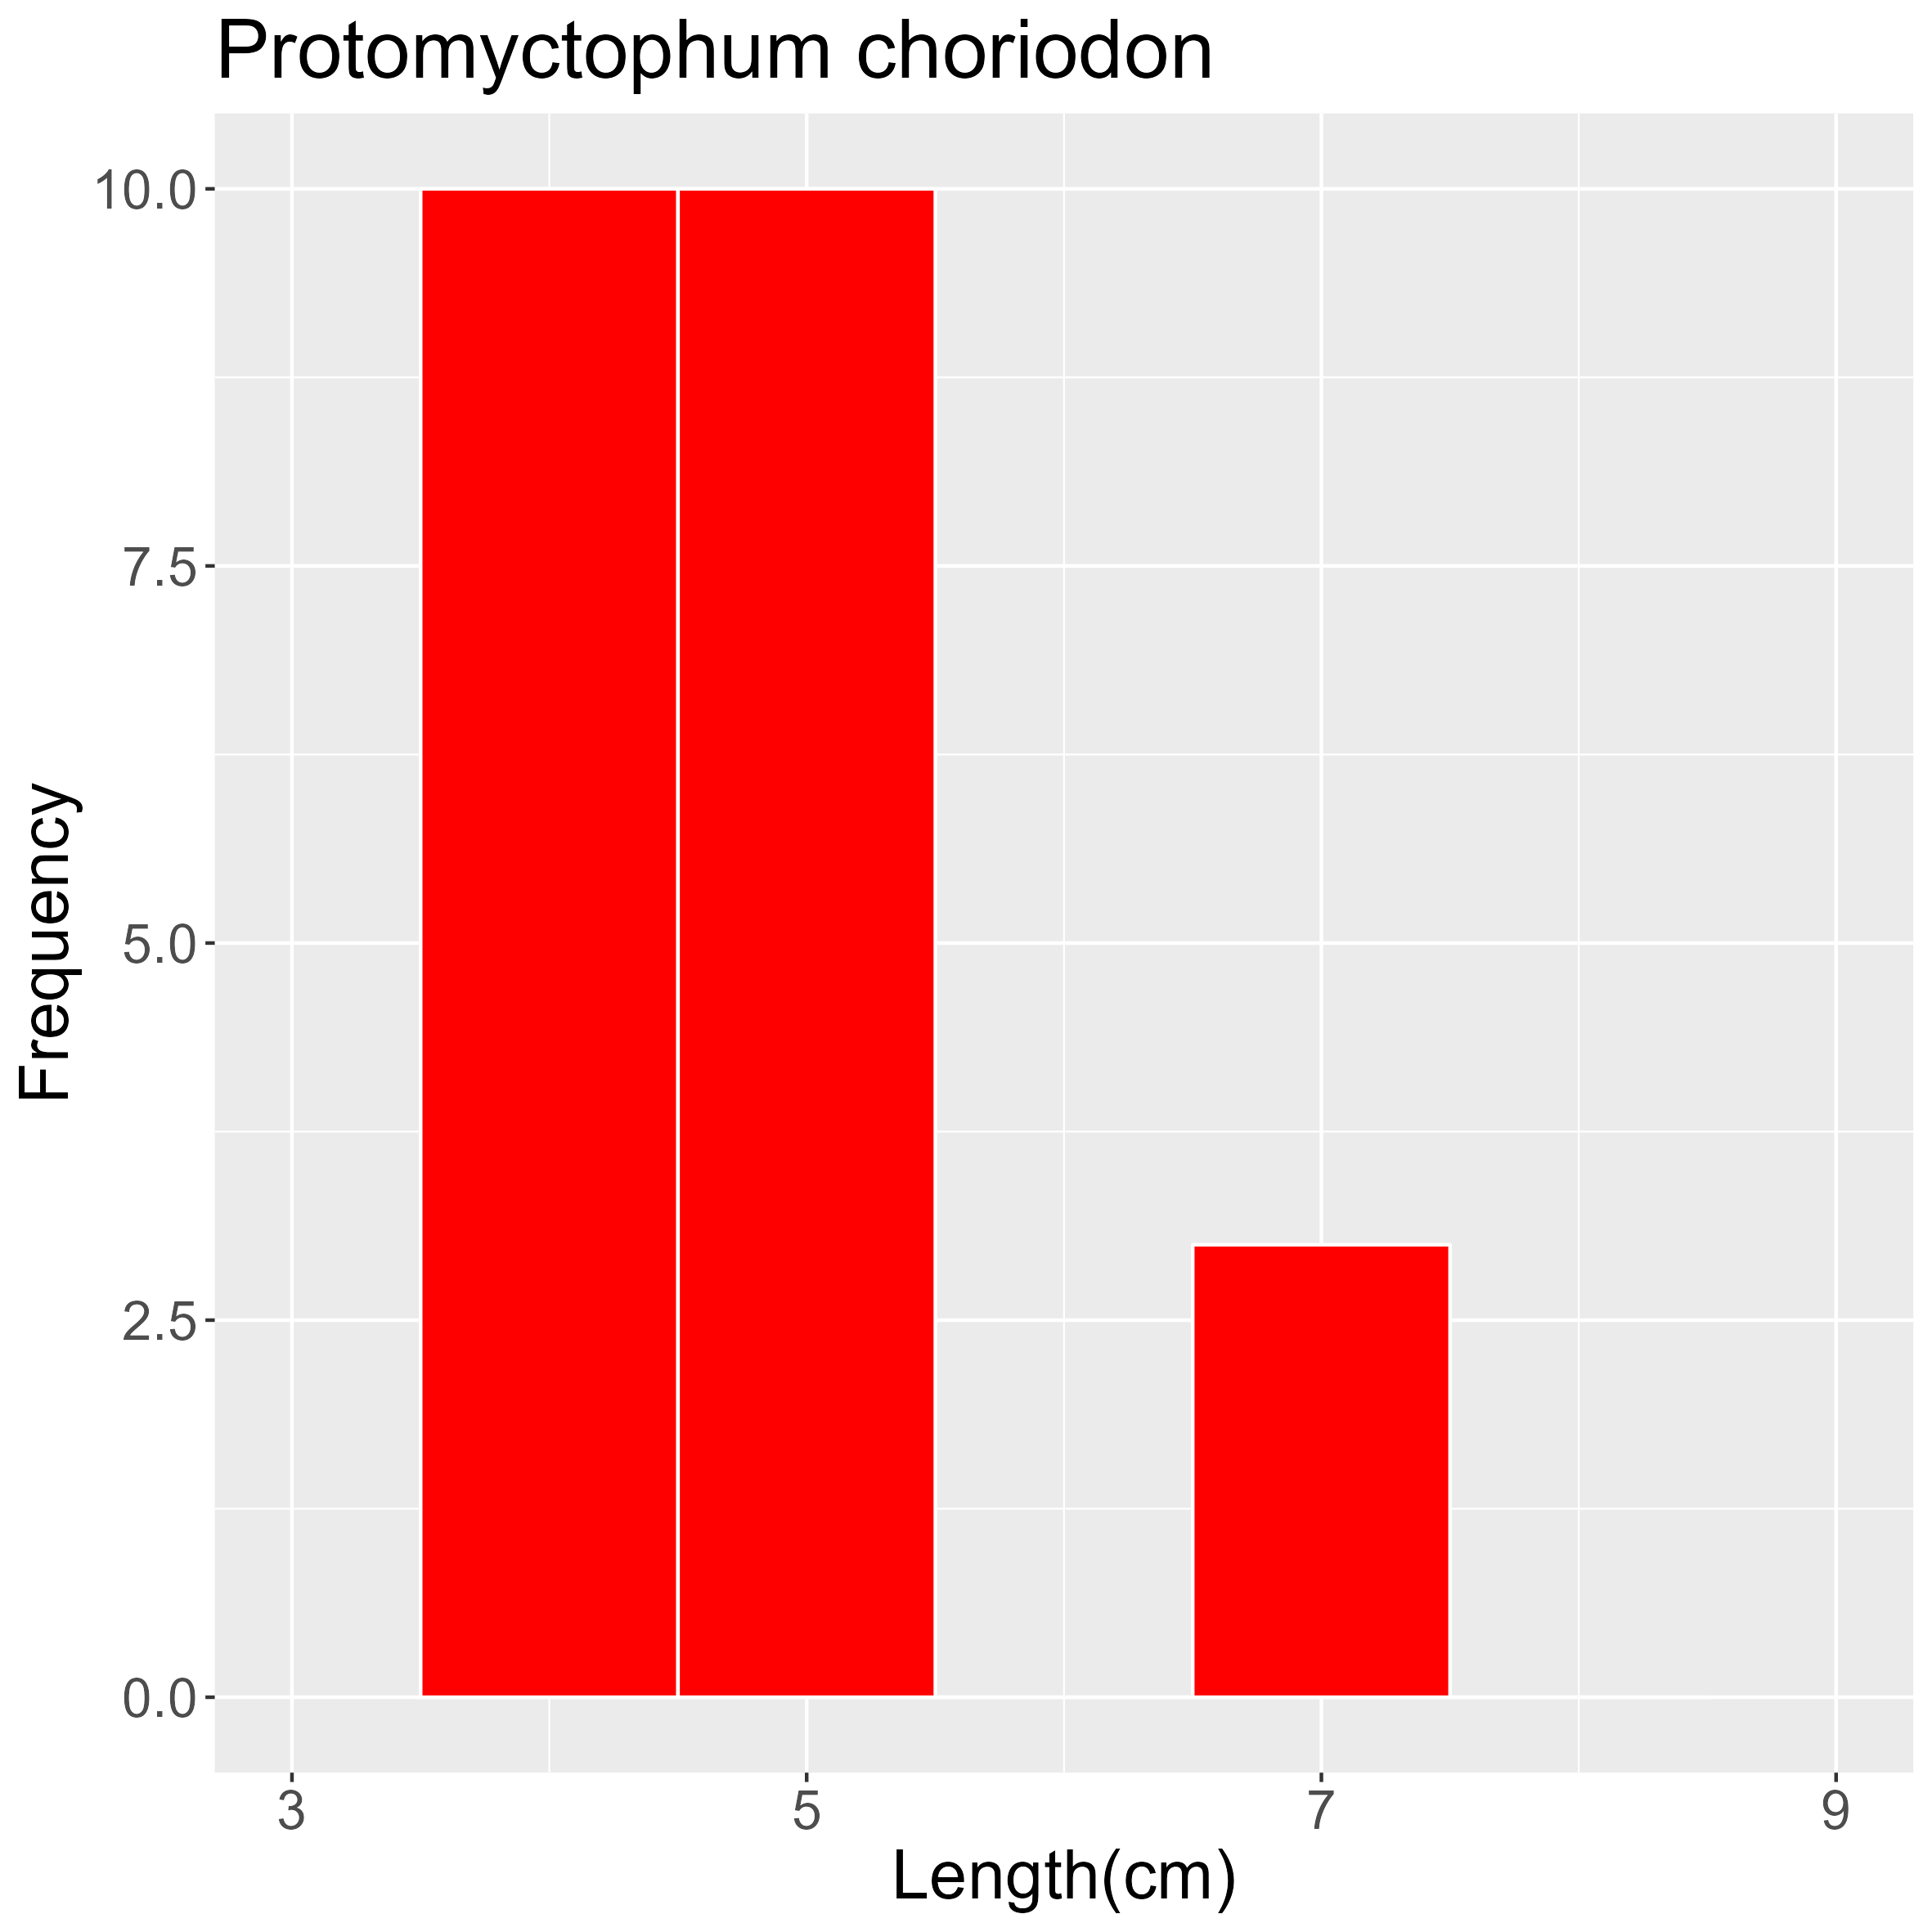
| 16 | 24.01.2008 | 51,99 | S | 25,00 | W | 20 | 22,5 | 3,23 | 45,05 |
| 17 | 26.01.2008 | 52,37 | S | 18,14 | W | 1 | 3,4 | 1,20 | 26,43 |
| 59 | 17.03.2008 | 45,11 | S | 7,66 | E | 2 | 9,0 | 1,02 | 5,63 |
2.13.26 - Protomyctophum gemmatum Hulley, 1981
| Station | Date | Latitude | Longitude | Ind. caught | W (g) | TW fish (kg) | TW catch (kg) | ||
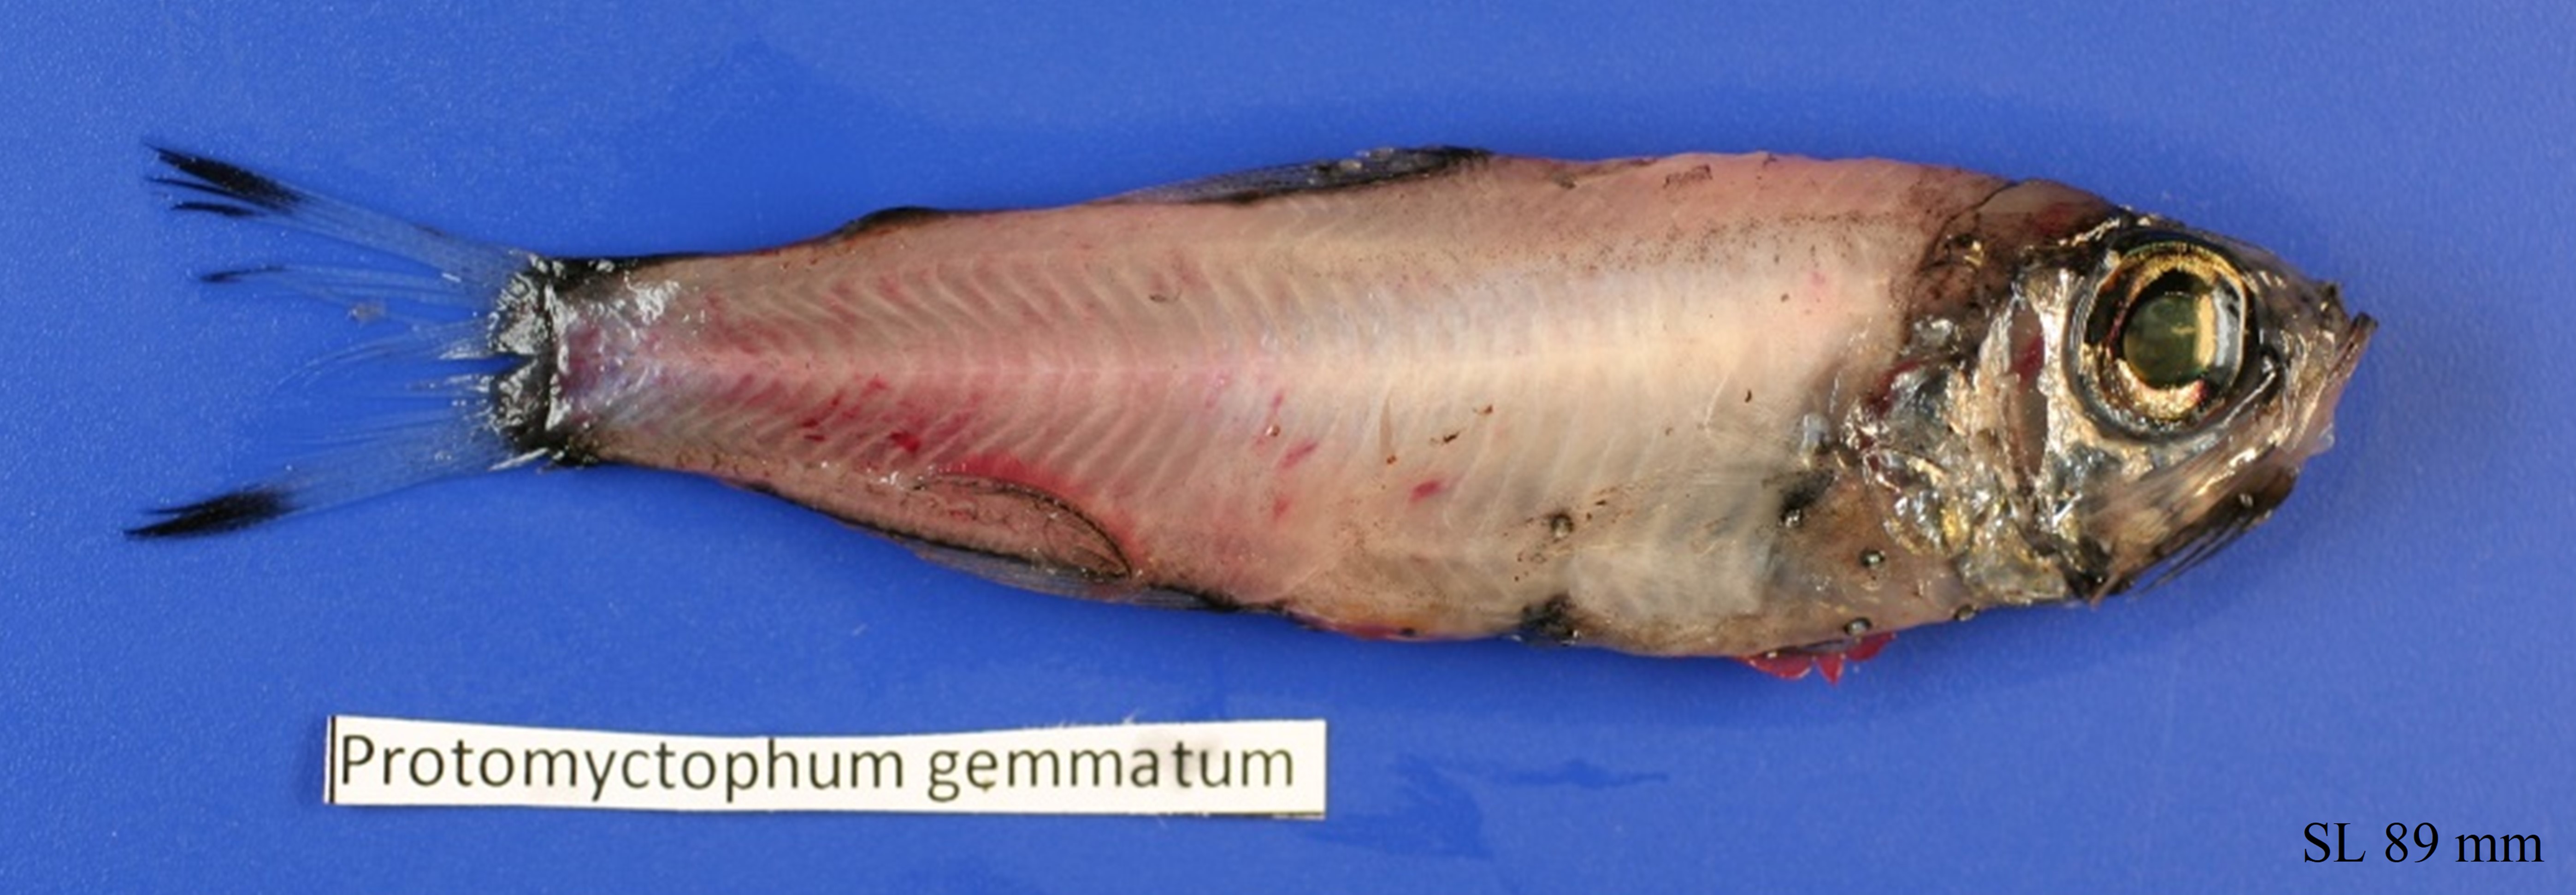
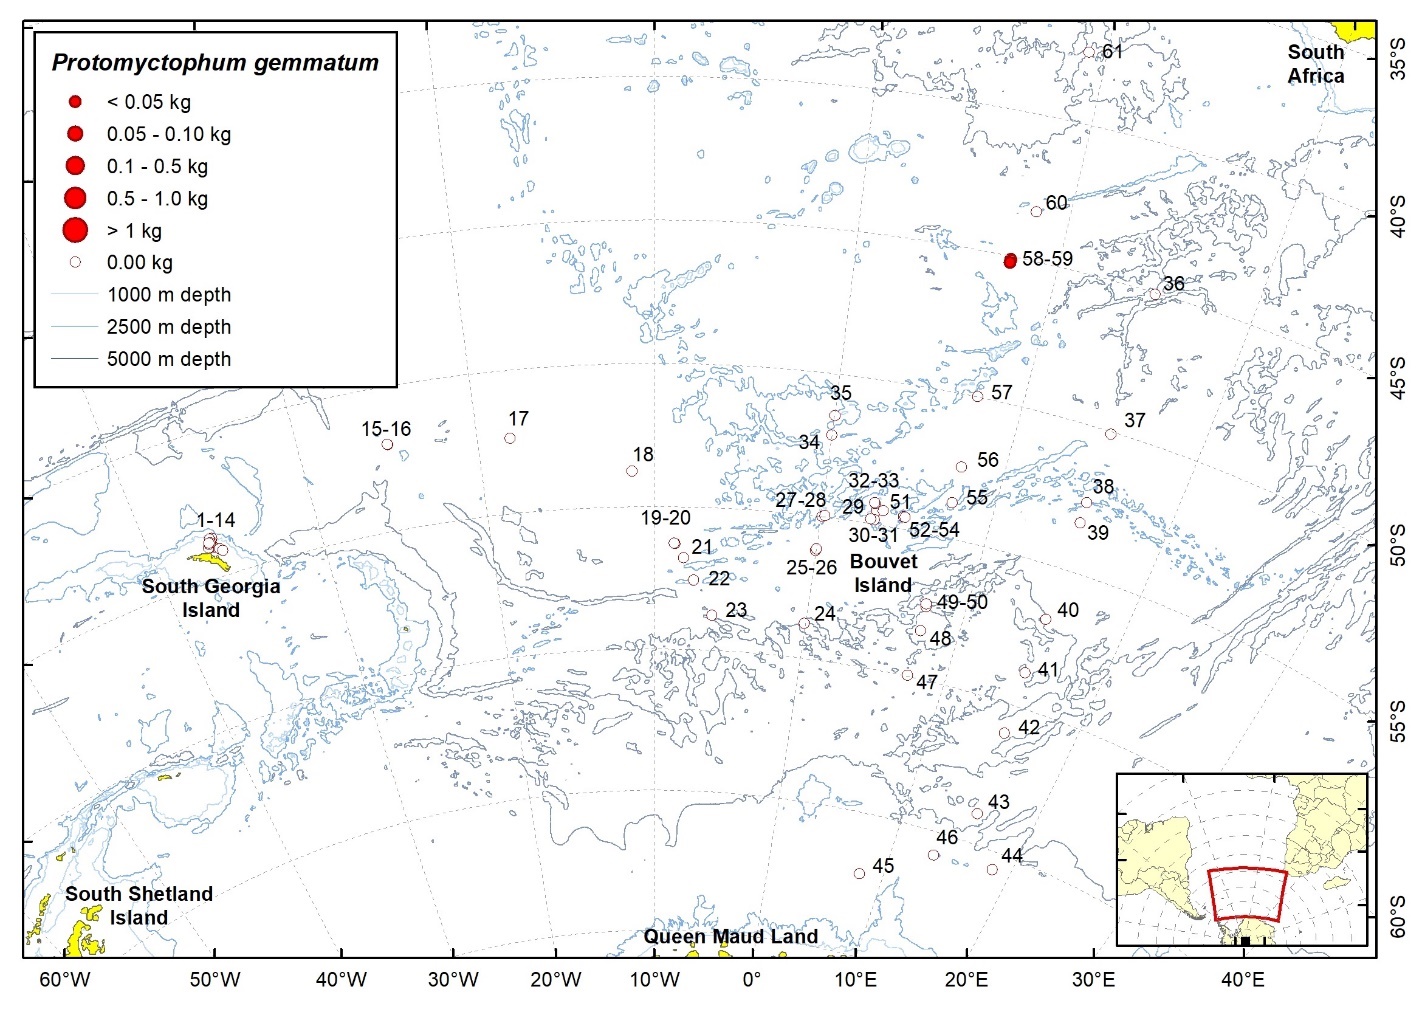
| 58 | 17.03.2008 | 45,20 | S | 7,65 | E | 4 | 13,0 | 10,17 | 19,92 |
| 59 | 17.03.2008 | 45,11 | S | 7,66 | E | 4 | 24,0 | 1,02 | 5,63 |
2.13.27 - Protomyctophum normani (Tåning, 1932)
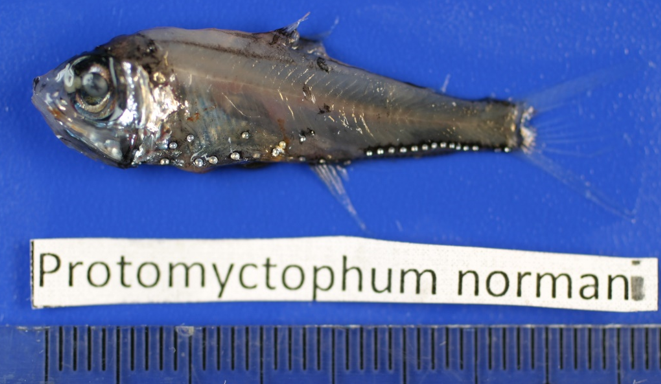
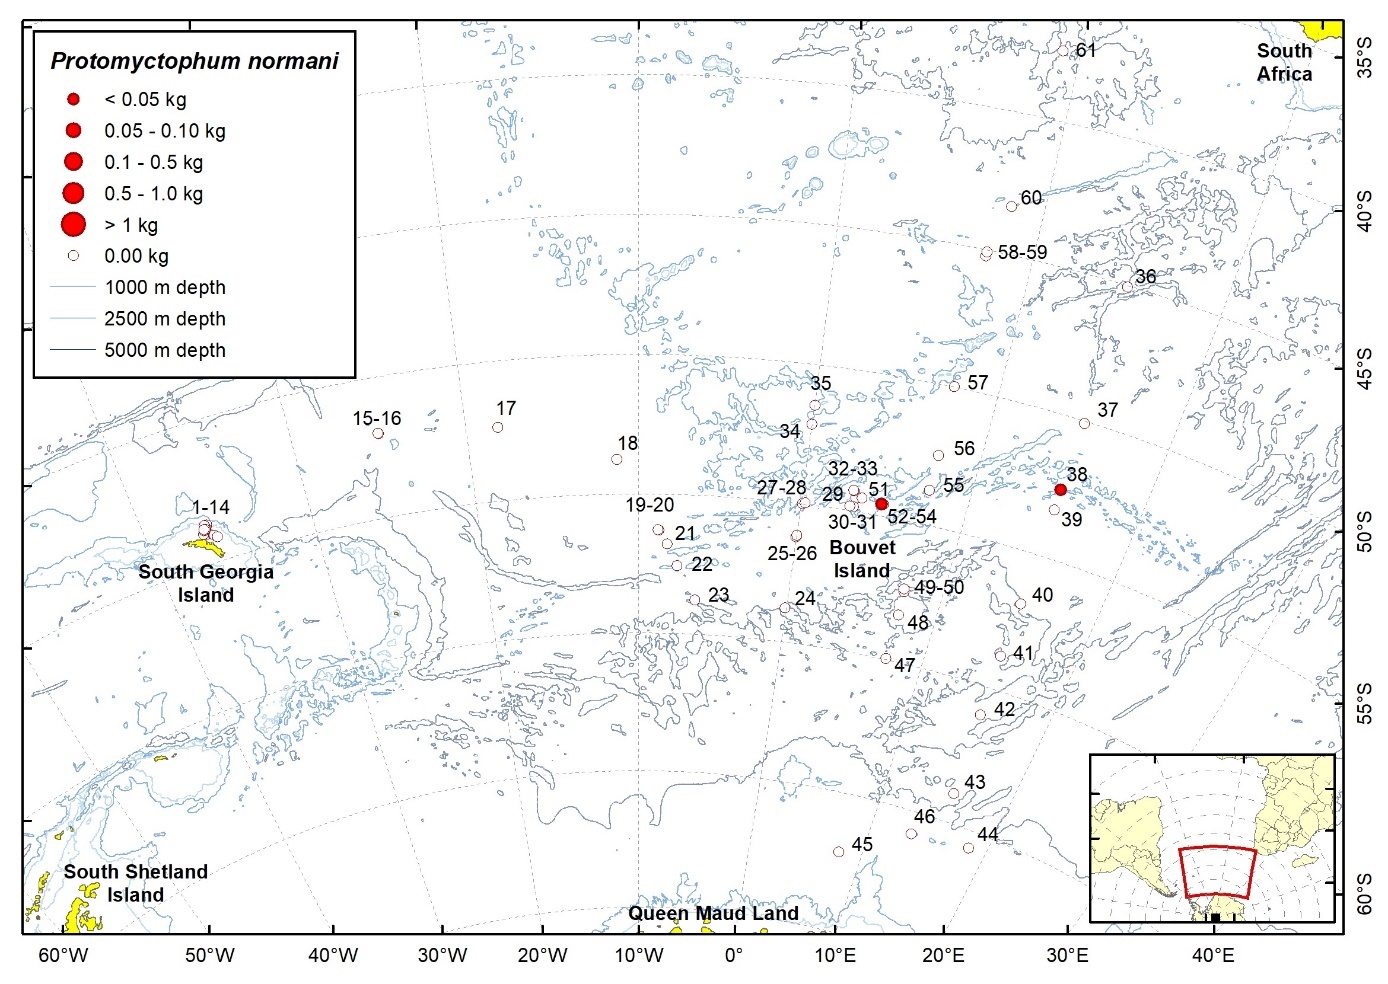
| Station | Date | Latitude | Longitude | Ind. caught | W (g) | TW fish (kg) | TW catch (kg) | ||
| 38 | 25.02.2008 | 52,55 | S | 14,99 | E | 15 | 8,8 | 3,66 | 49,50 |
| 53 | 12.03.2008 | 54,57 | S | 4,83 | E | 6 | 4,1 | 0,07 | 4,33 |
2.13.28 - Protomyctophum parallelum (Lönnberg, 1905)
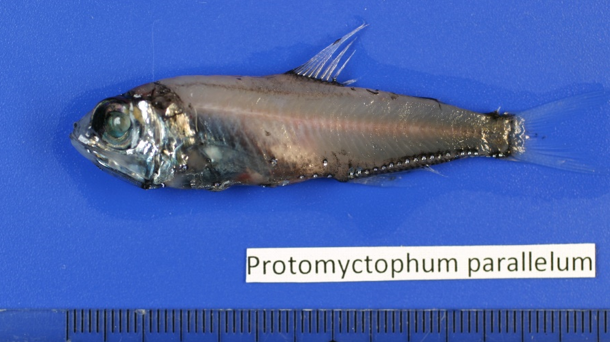
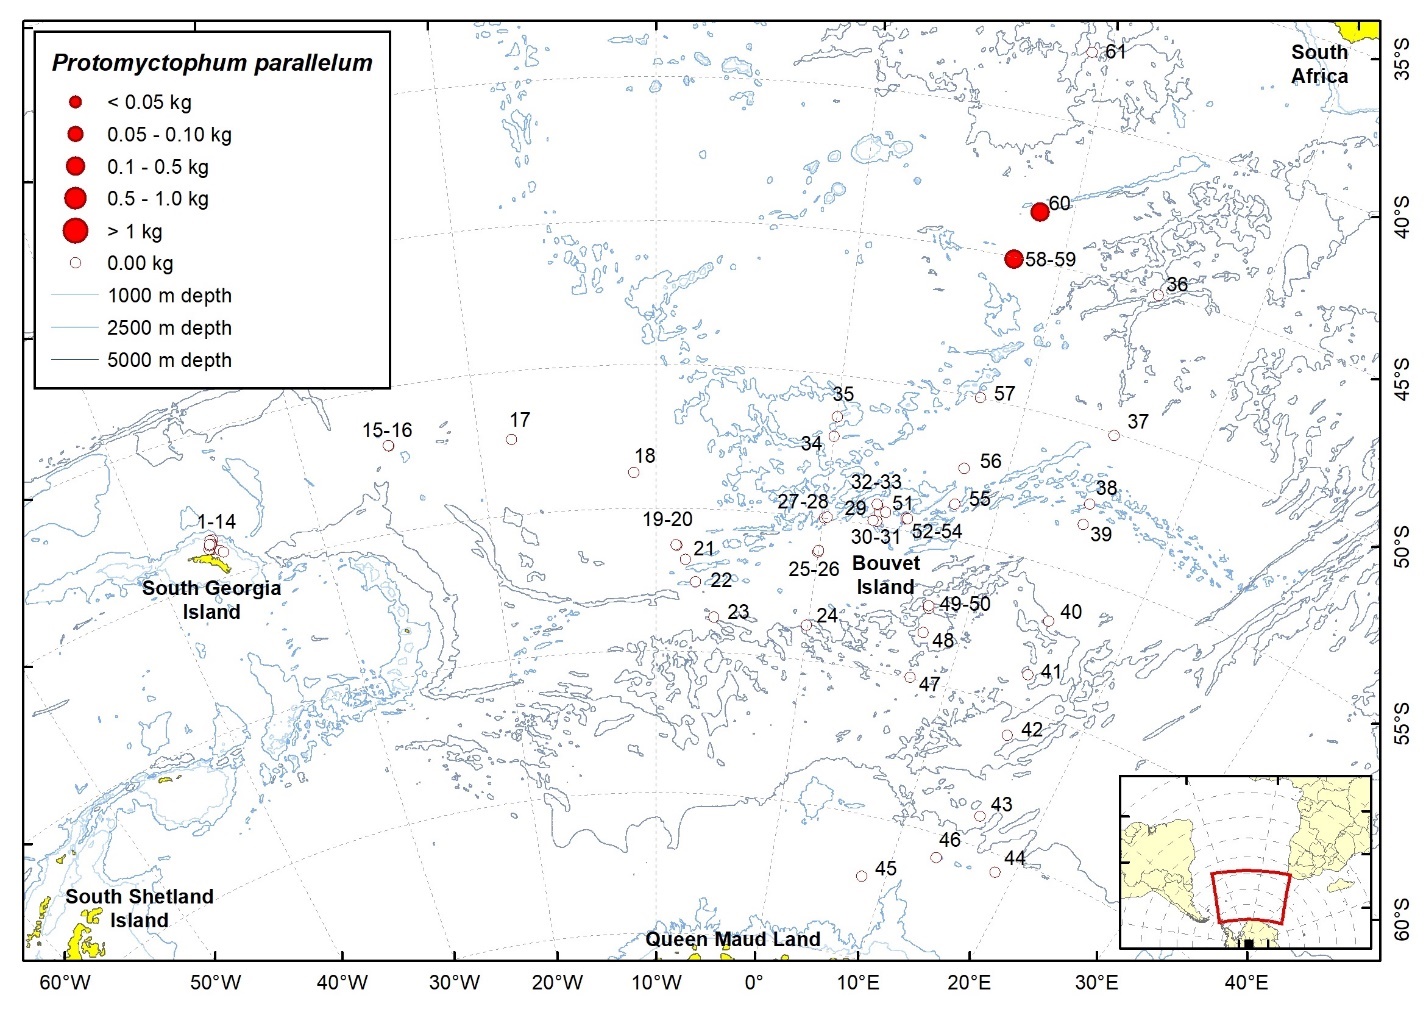
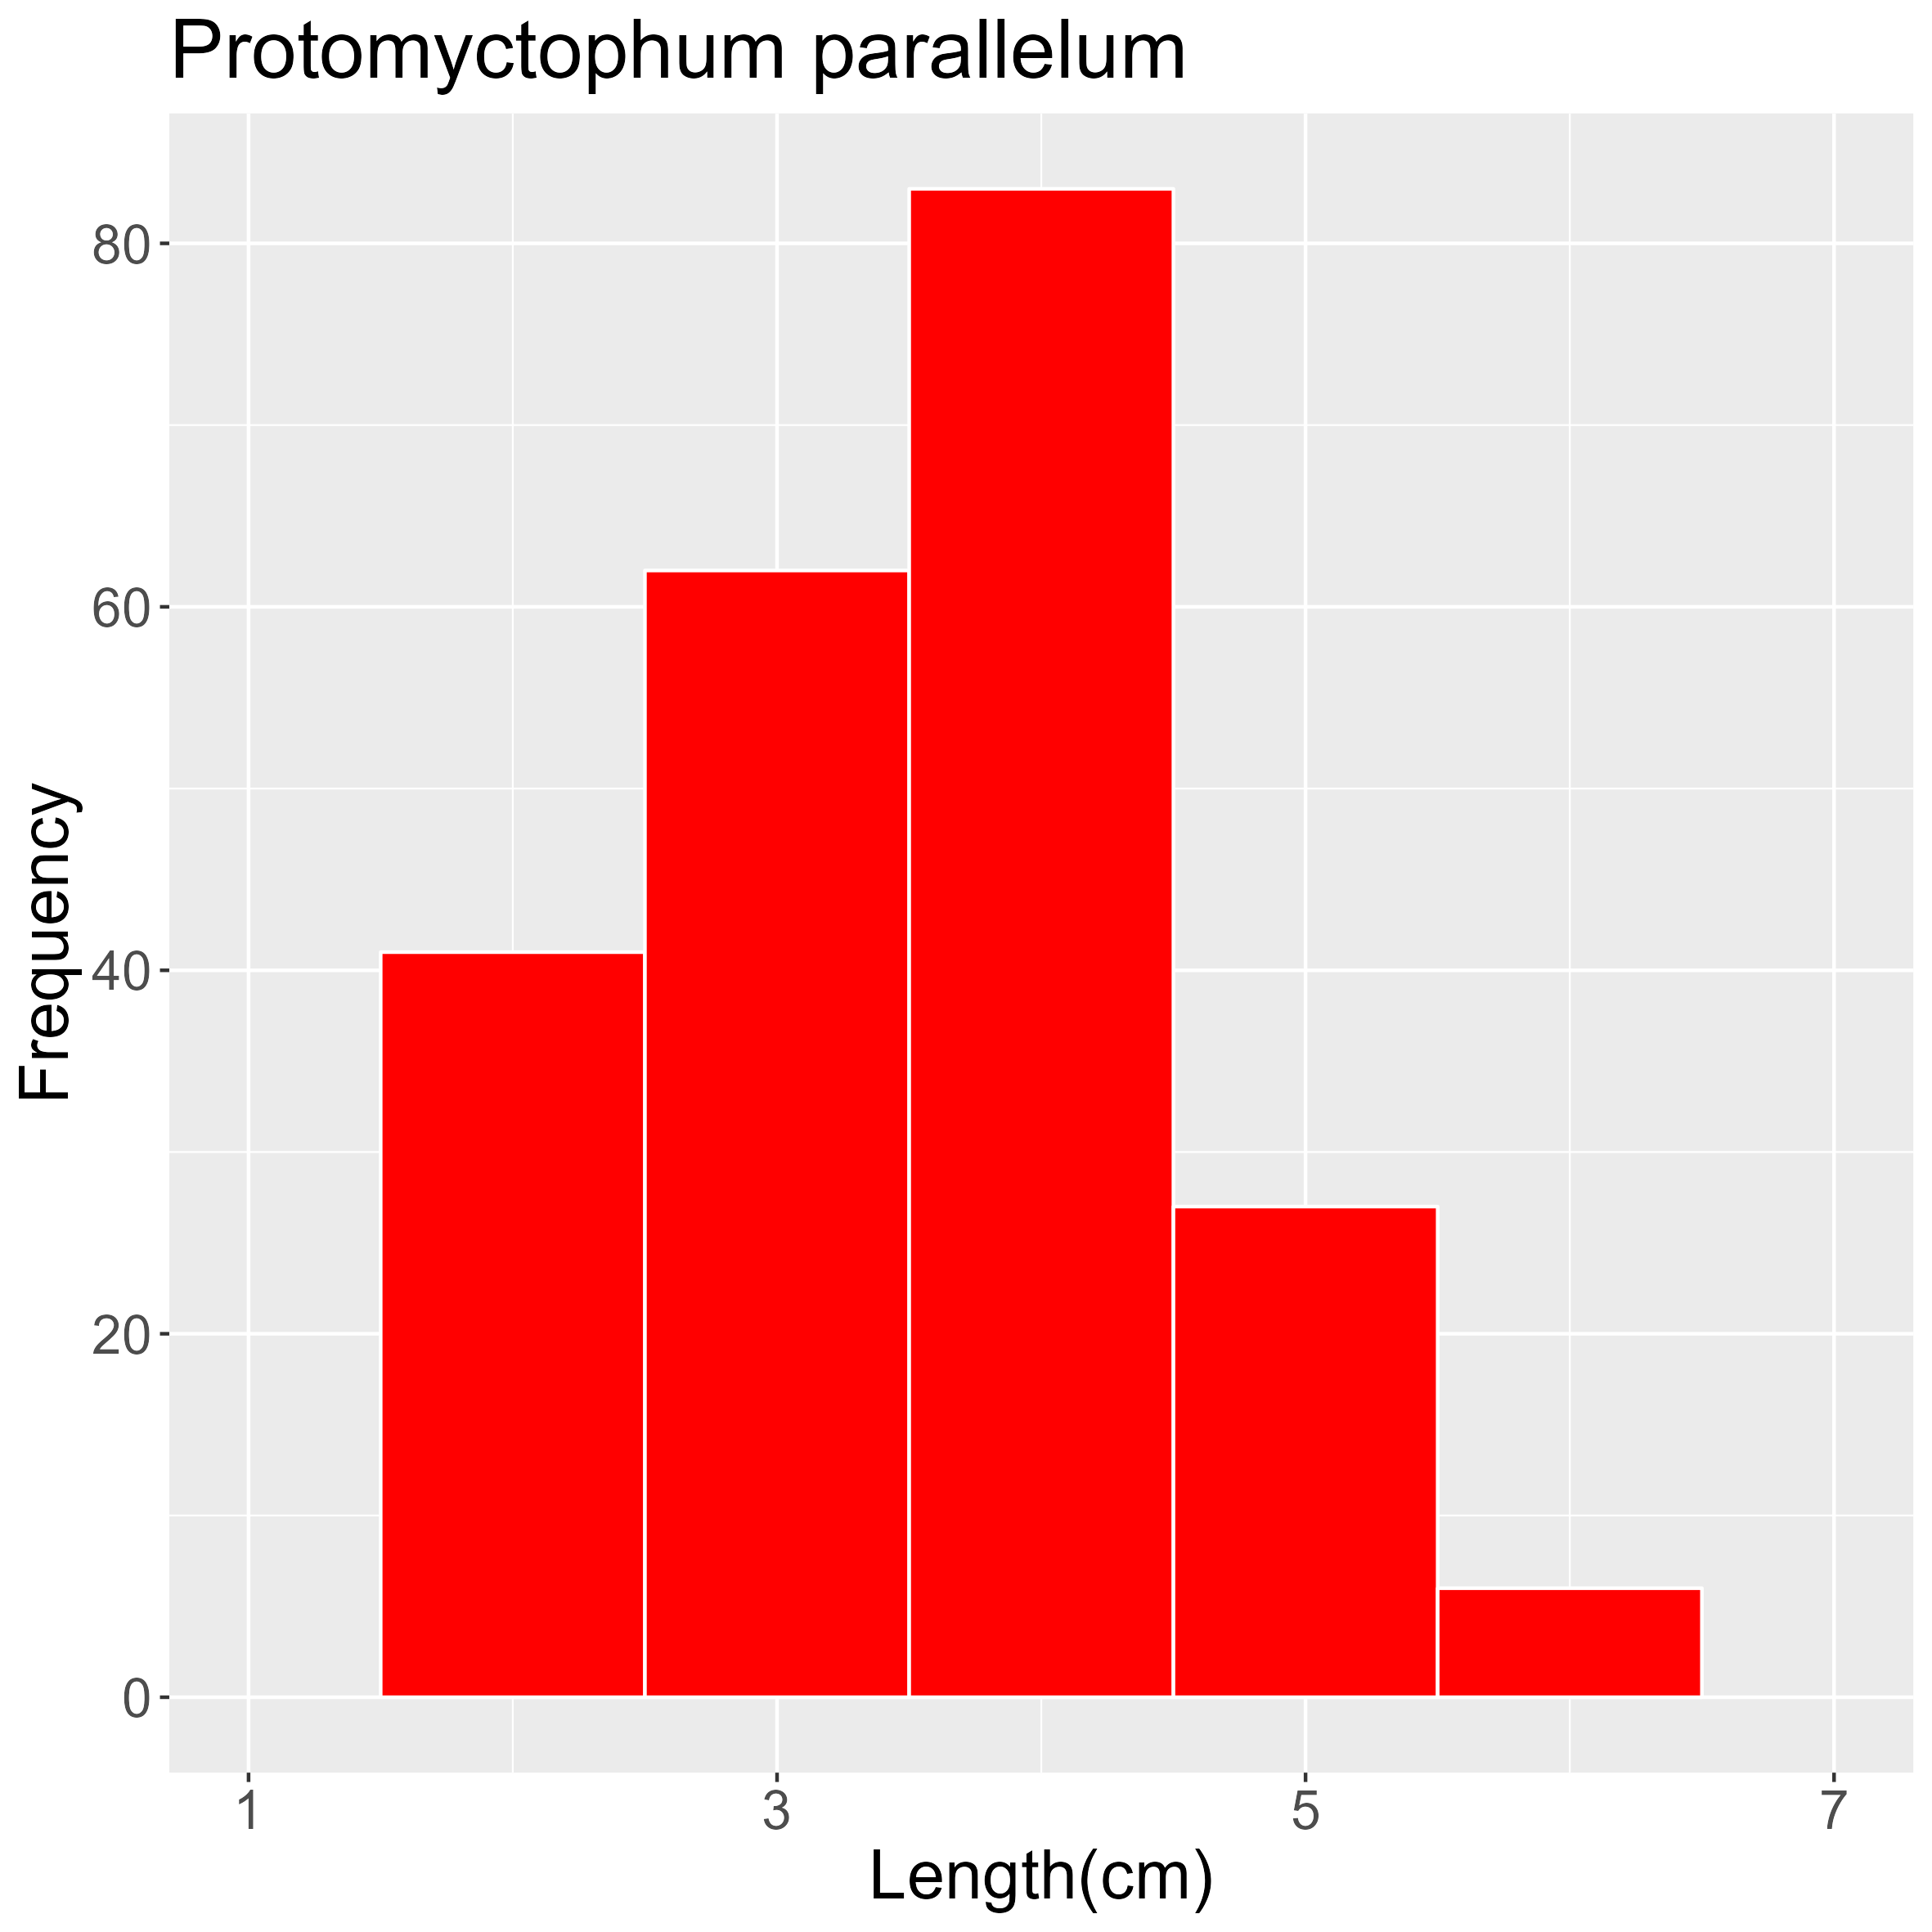
| Station | Date | Latitude | Longitude | Ind. caught | W (g) | TW fish (kg) | TW catch (kg) | ||
| 59 | 17.03.2008 | 45,11 | S | 7,66 | E | 183 | 160,2 | 1,02 | 5,63 |
| 60 | 18.03.2008 | 43,29 | S | 8,40 | E | 818 | 102,3 | 110,70 | 332,36 |
2.13.29 - Protomyctophum tenisoni (Norman, 1930)
| Station | Date | Latitude | Longitude | Ind. caught | W (g) | TW fish (kg) | TW catch (kg) | ||
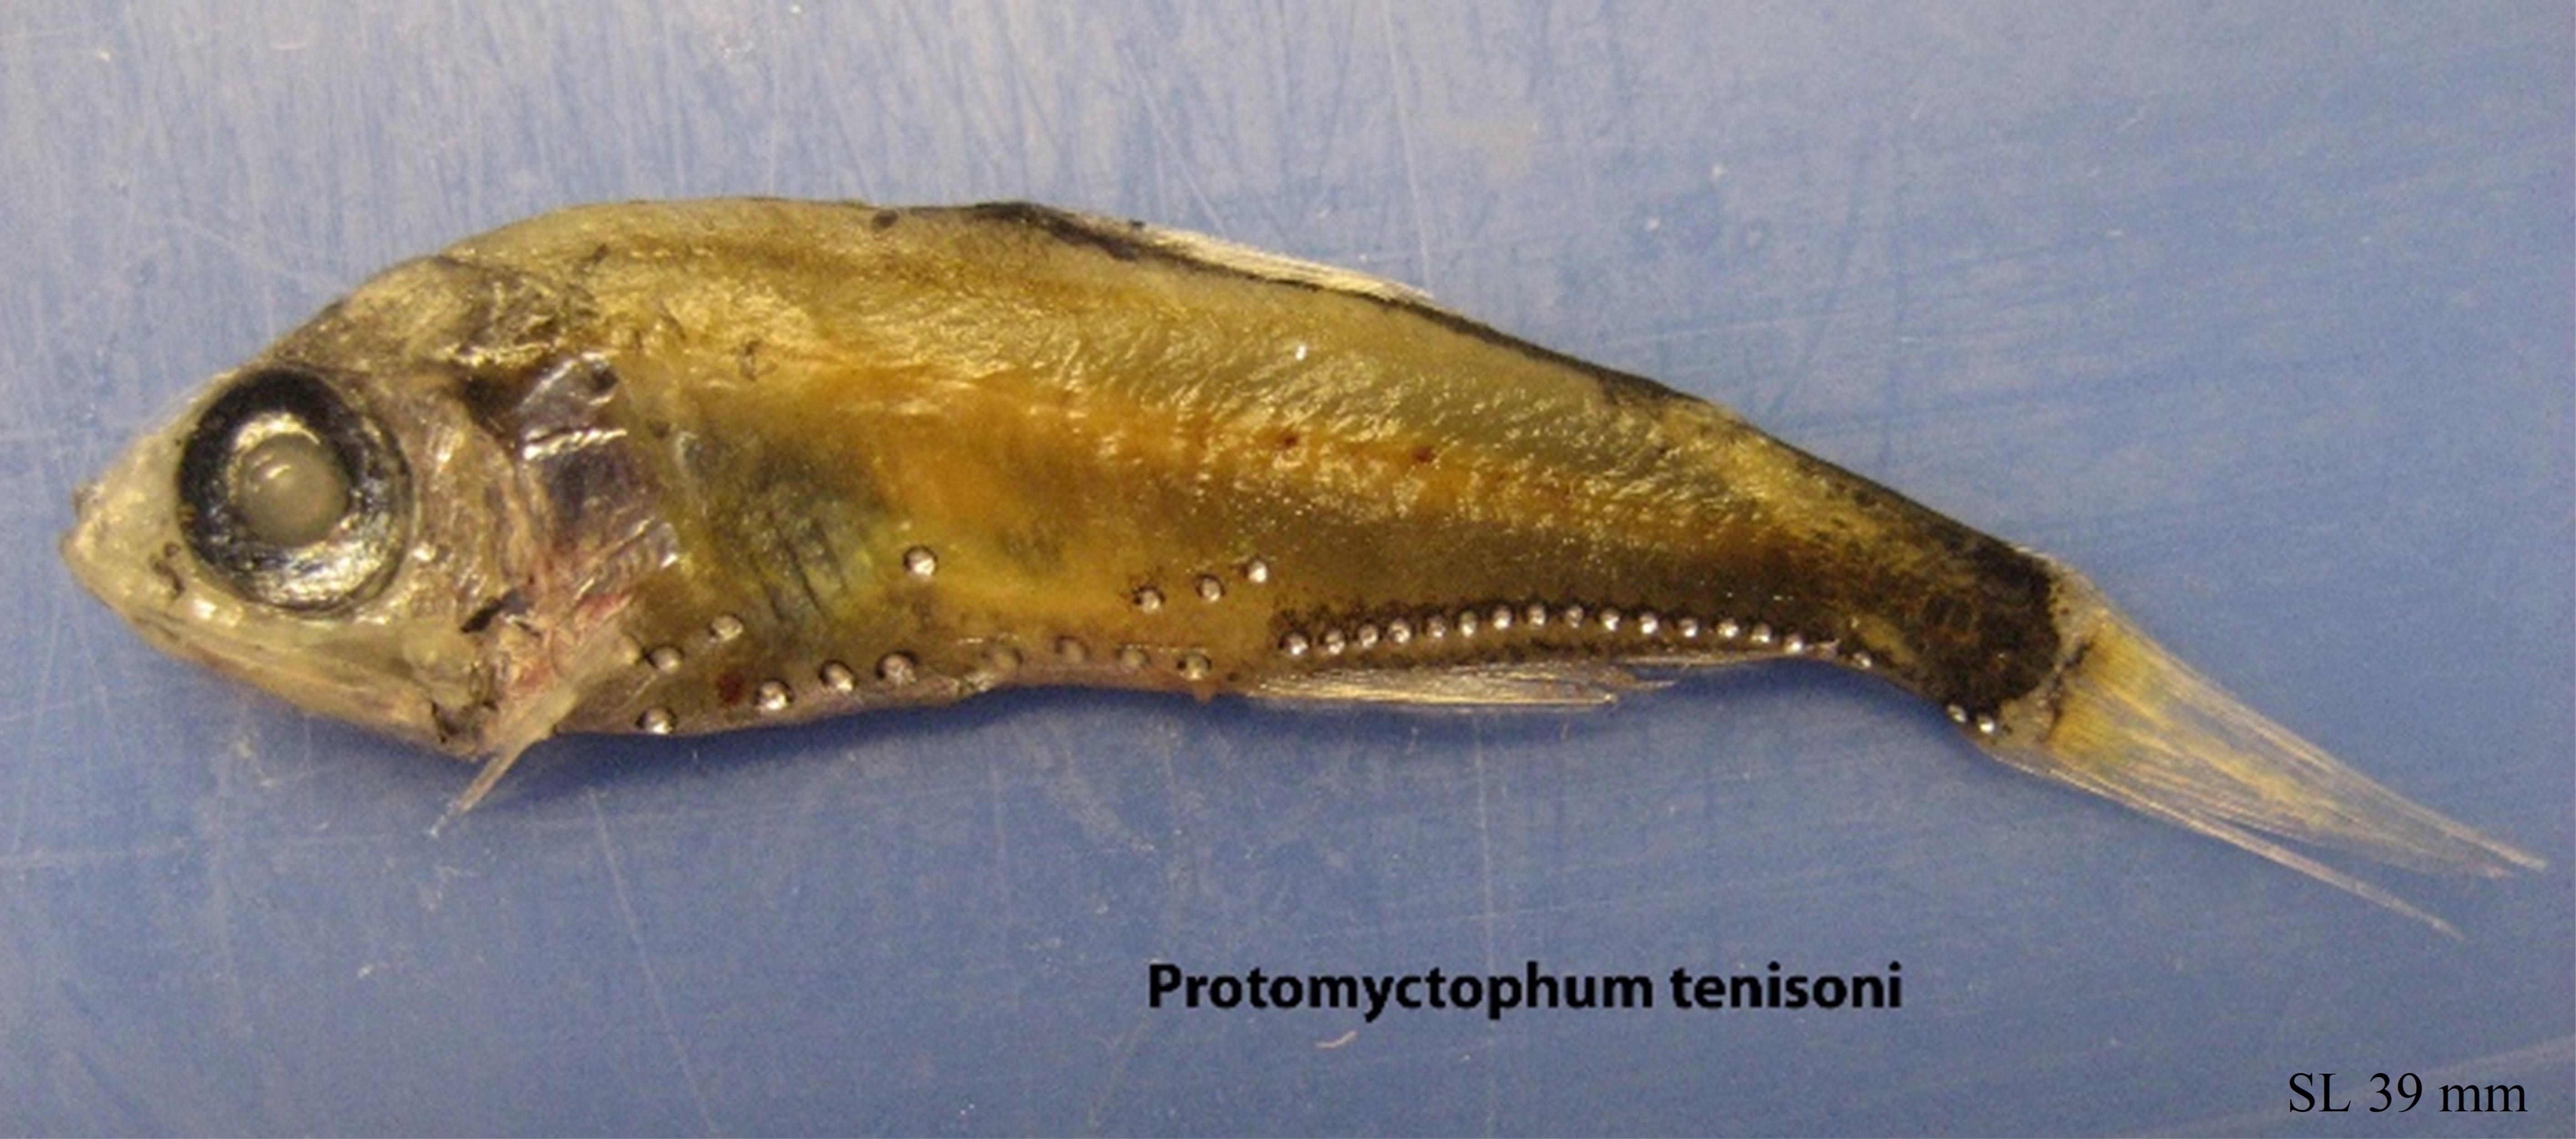
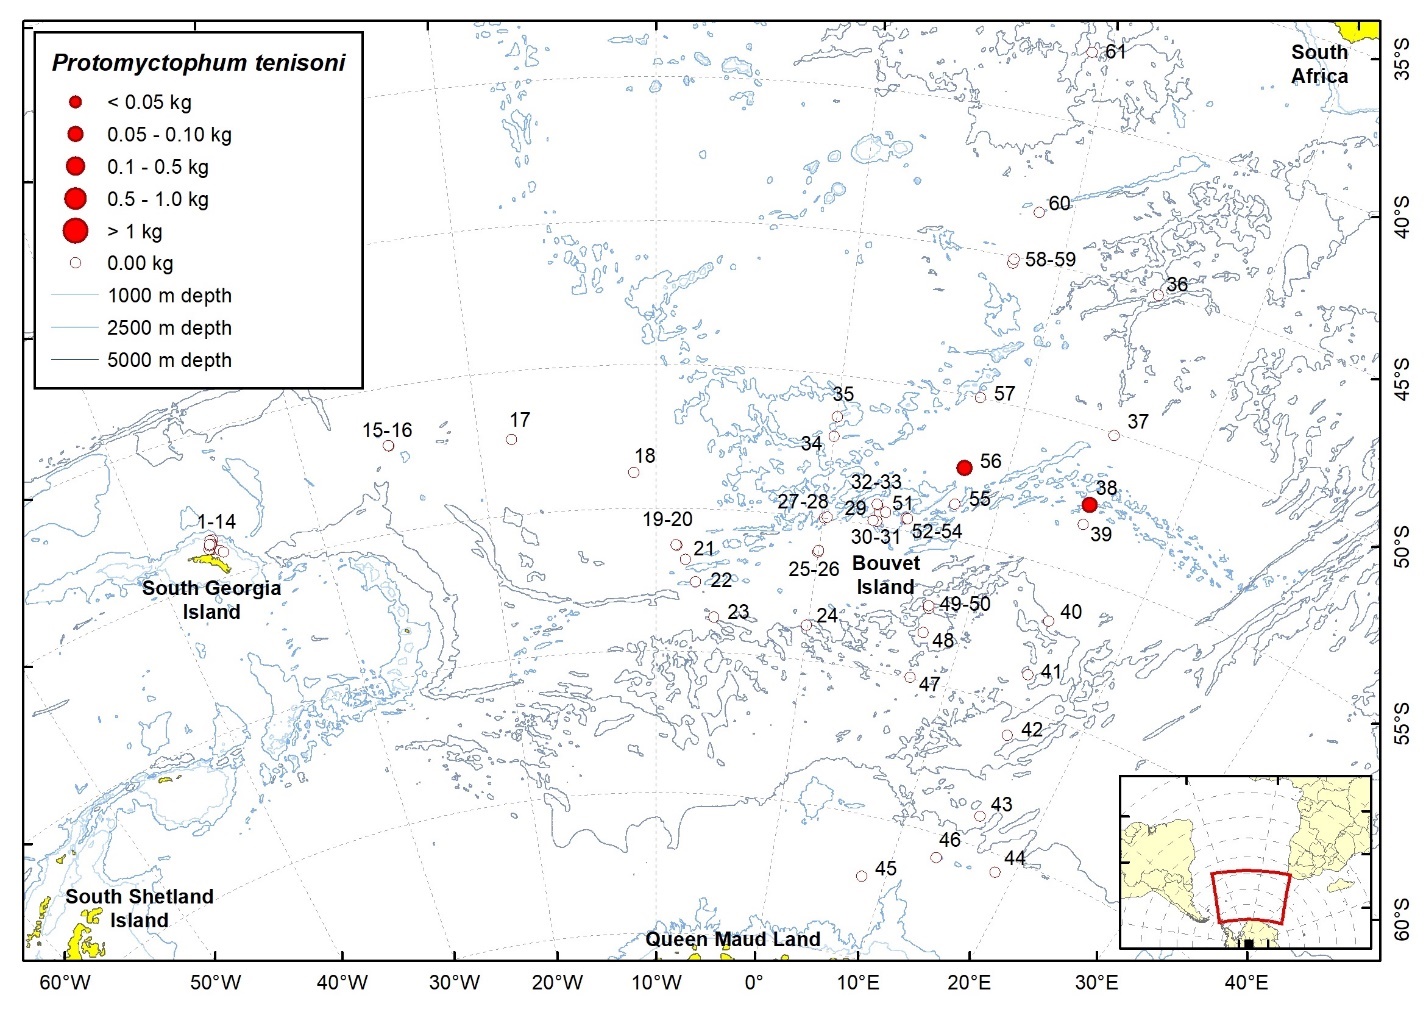
| 38 | 25.02.2008 | 52,58 | S | 15,00 | E | 28 | 69,9 | 3,66 | 49,50 |
| 56 | 14.03.2008 | 52,45 | S | 7,56 | E | 128 | 84,0 | 0,44 | 188,87 |
2.13.30 - Symbolophorus boops (Richardson, 1845)
| Station | Date | Latitude | Longitude | Ind. caught | W (g) | TW fish (kg) | TW catch (kg) | ||
| 58 | 17.03.2008 | 45,20 | S | 7,65 | E | 1 | 13,0 | 10,17 | 19,92 |
| 59 | 17.03.2008 | 45,11 | S | 7,66 | E | 2 | 8,0 | 1,02 | 5,63 |
2.14 - Macrouridae
2.14.1 - Cynomacrurus piriei Dollo, 1909
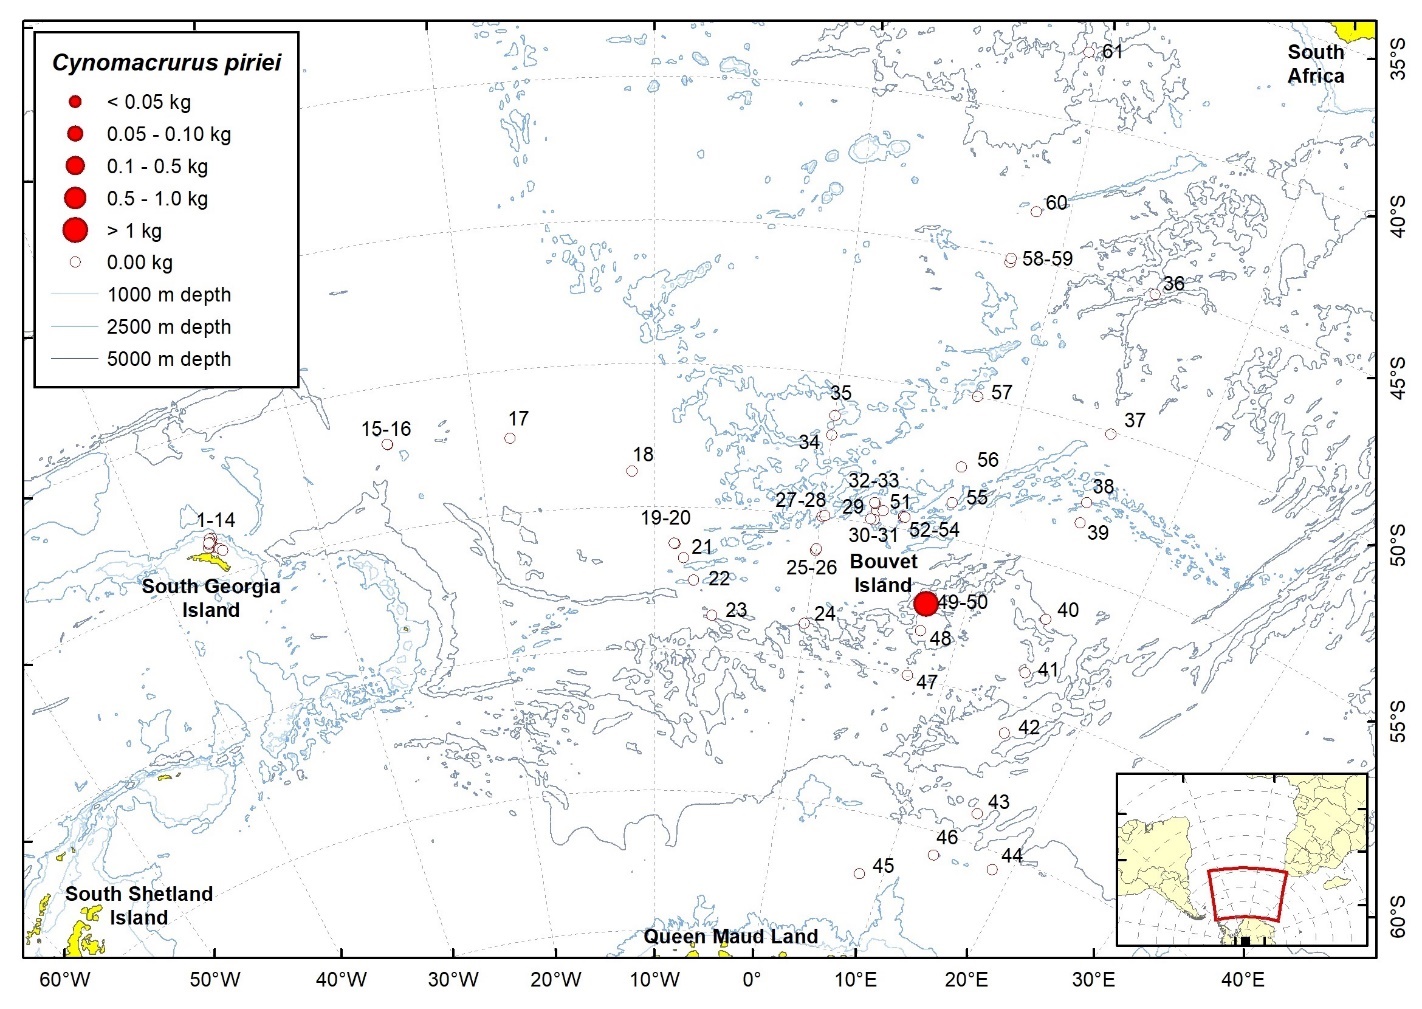
| Station | Date | Latitude | Longitude | Ind. caught | W (g) | TW fish (kg) | TW catch (kg) | ||
| 50 | 08.03.2008 | 57,39 | S | 7,44 | E | 10 | 1200,0 | 26,34 | 31,75 |
2.15 - Melanonidae
2.15.1 - Melanonus gracilis Günther, 1878

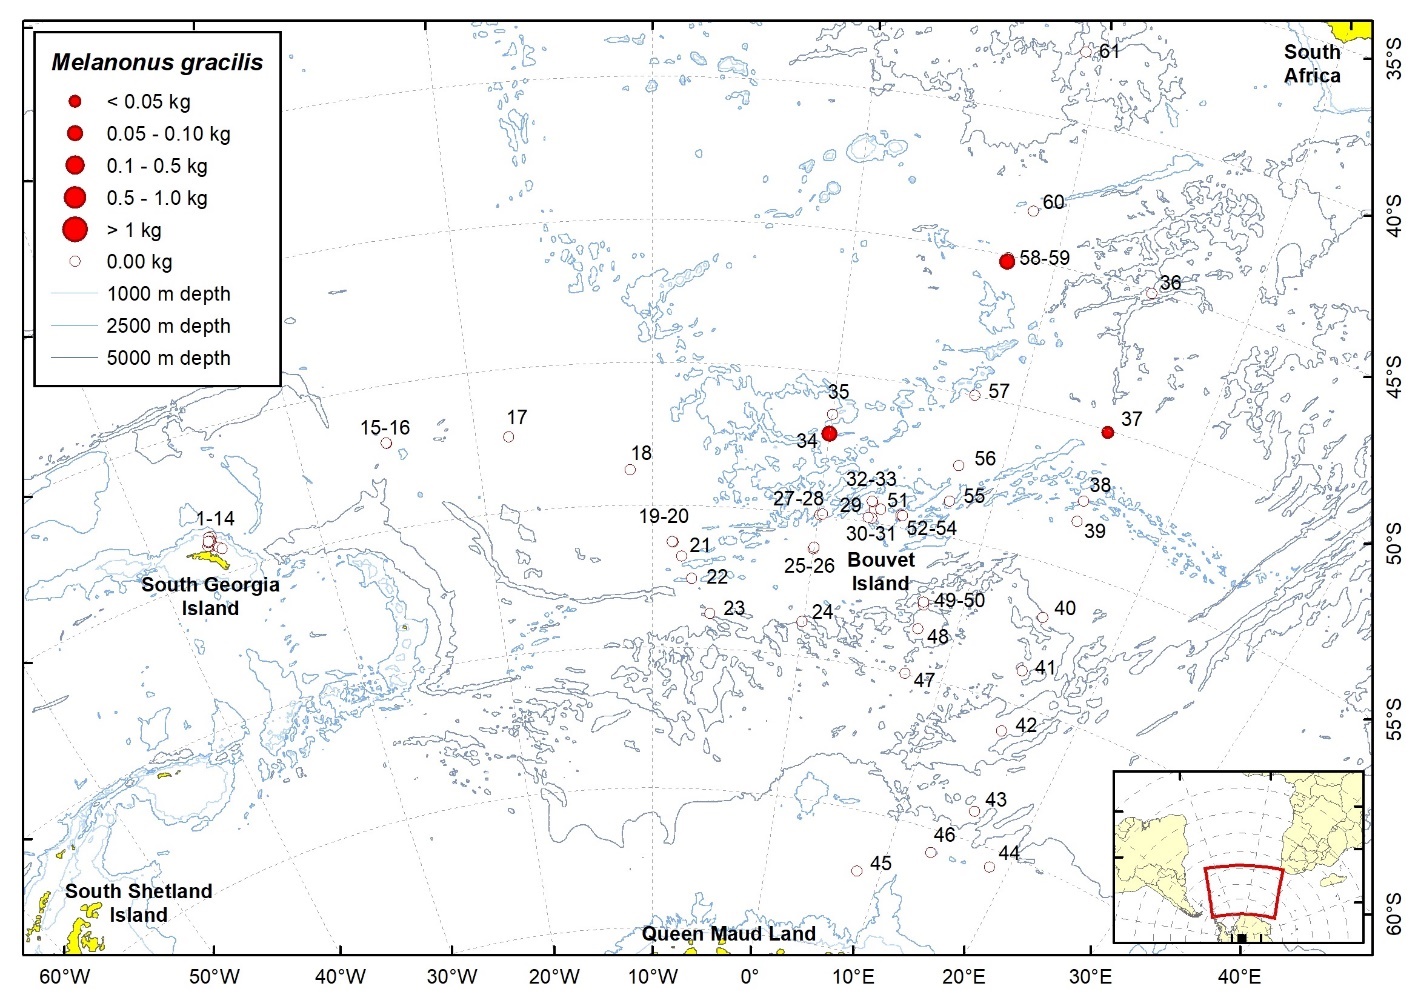
| Station | Date | Latitude | Longitude | Ind. caught | W (g) | TW fish (kg) | TW catch (kg) | ||
| 34 | 06.02.2008 | 52,12 | S | 0,02 | W | 2 | 56,1 | 4,15 | 44,70 |
| 37 | 24.02.2008 | 50,04 | S | 15,02 | E | 2 | 26,0 | 3,32 | 14,43 |
| 58 | 17.03.2008 | 45,20 | S | 7,65 | E | 2 | 59,0 | 10,17 | 19,92 |
2.16 - Melamphaidae
2.16.1 - Melamphaes eulepis Ebeling, 1962
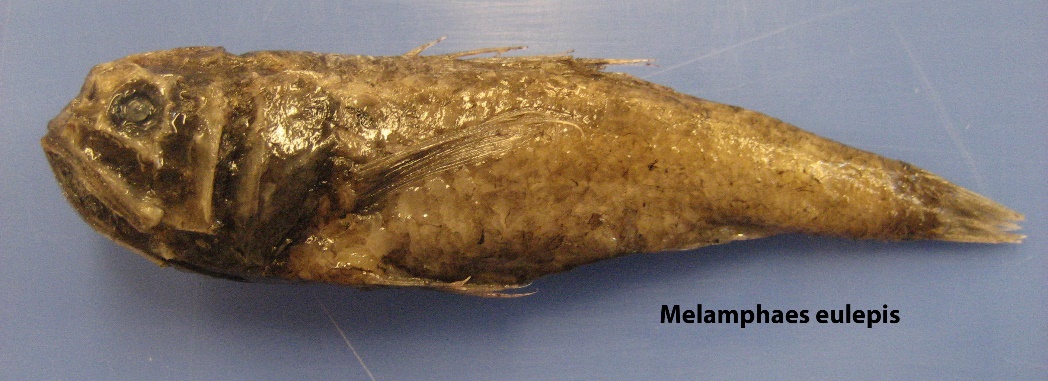
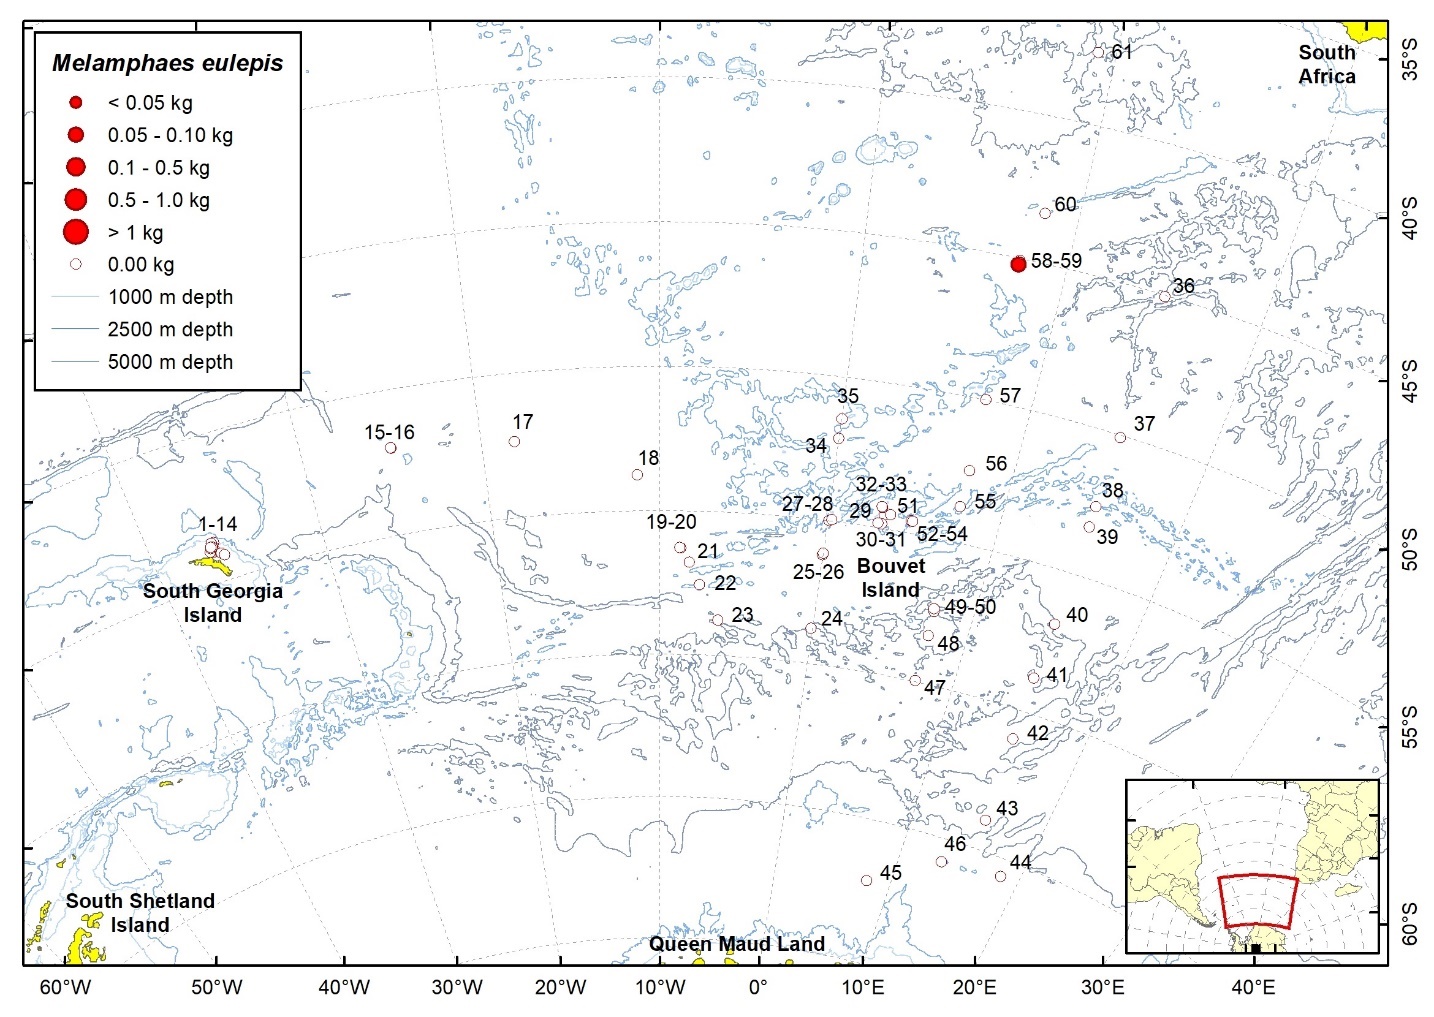
| Station | Date | Latitude | Longitude | Ind. caught | W (g) | TW fish (kg) | TW catch (kg) | ||
| 58 | 17.03.2008 | 45,20 | S | 7,65 | E | 3 | 94,0 | 10,17 | 19,92 |
2.16.2 - Melamphaes microps (Günther, 1878)
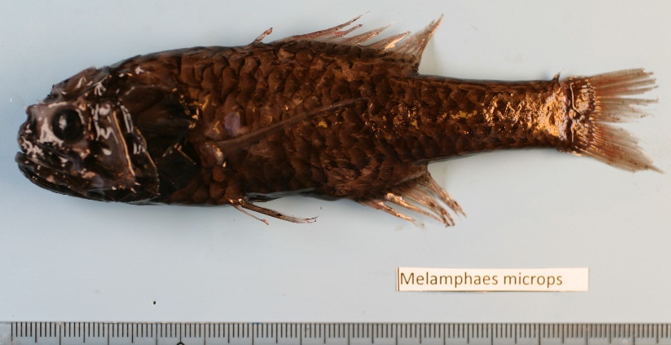
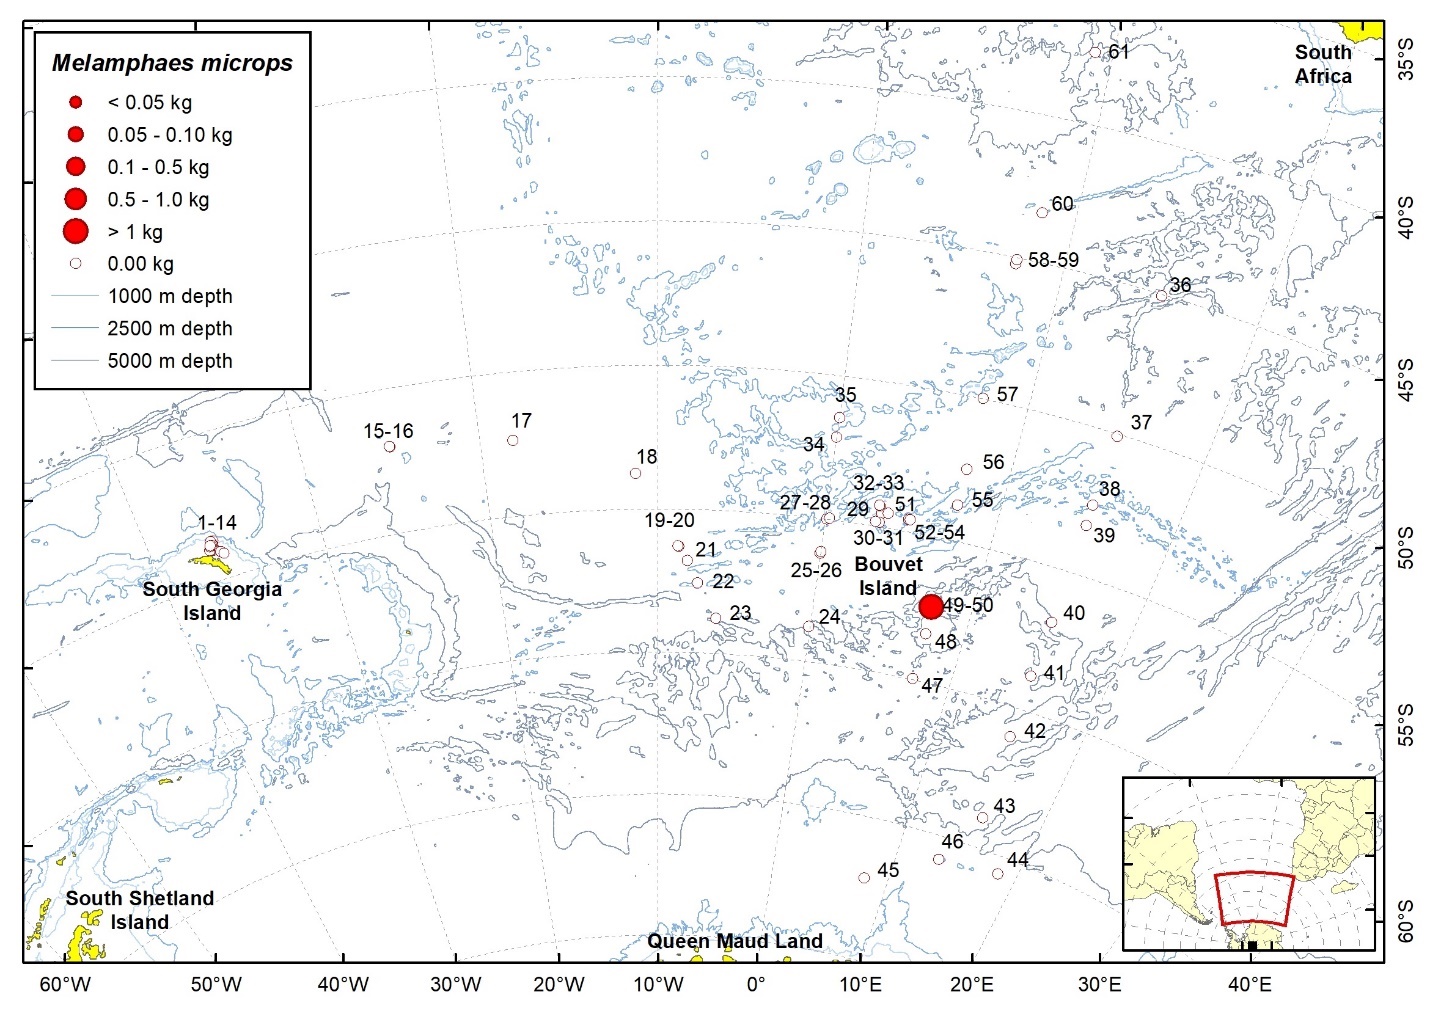
| Station | Date | Latitude | Longitude | Ind. caught | W (g) | TW fish (kg) | TW catch (kg) | ||
| 50 | 08.03.2008 | 57,39 | S | 7,44 | E | 54 | 1328,0 | 26,34 | 31,75 |
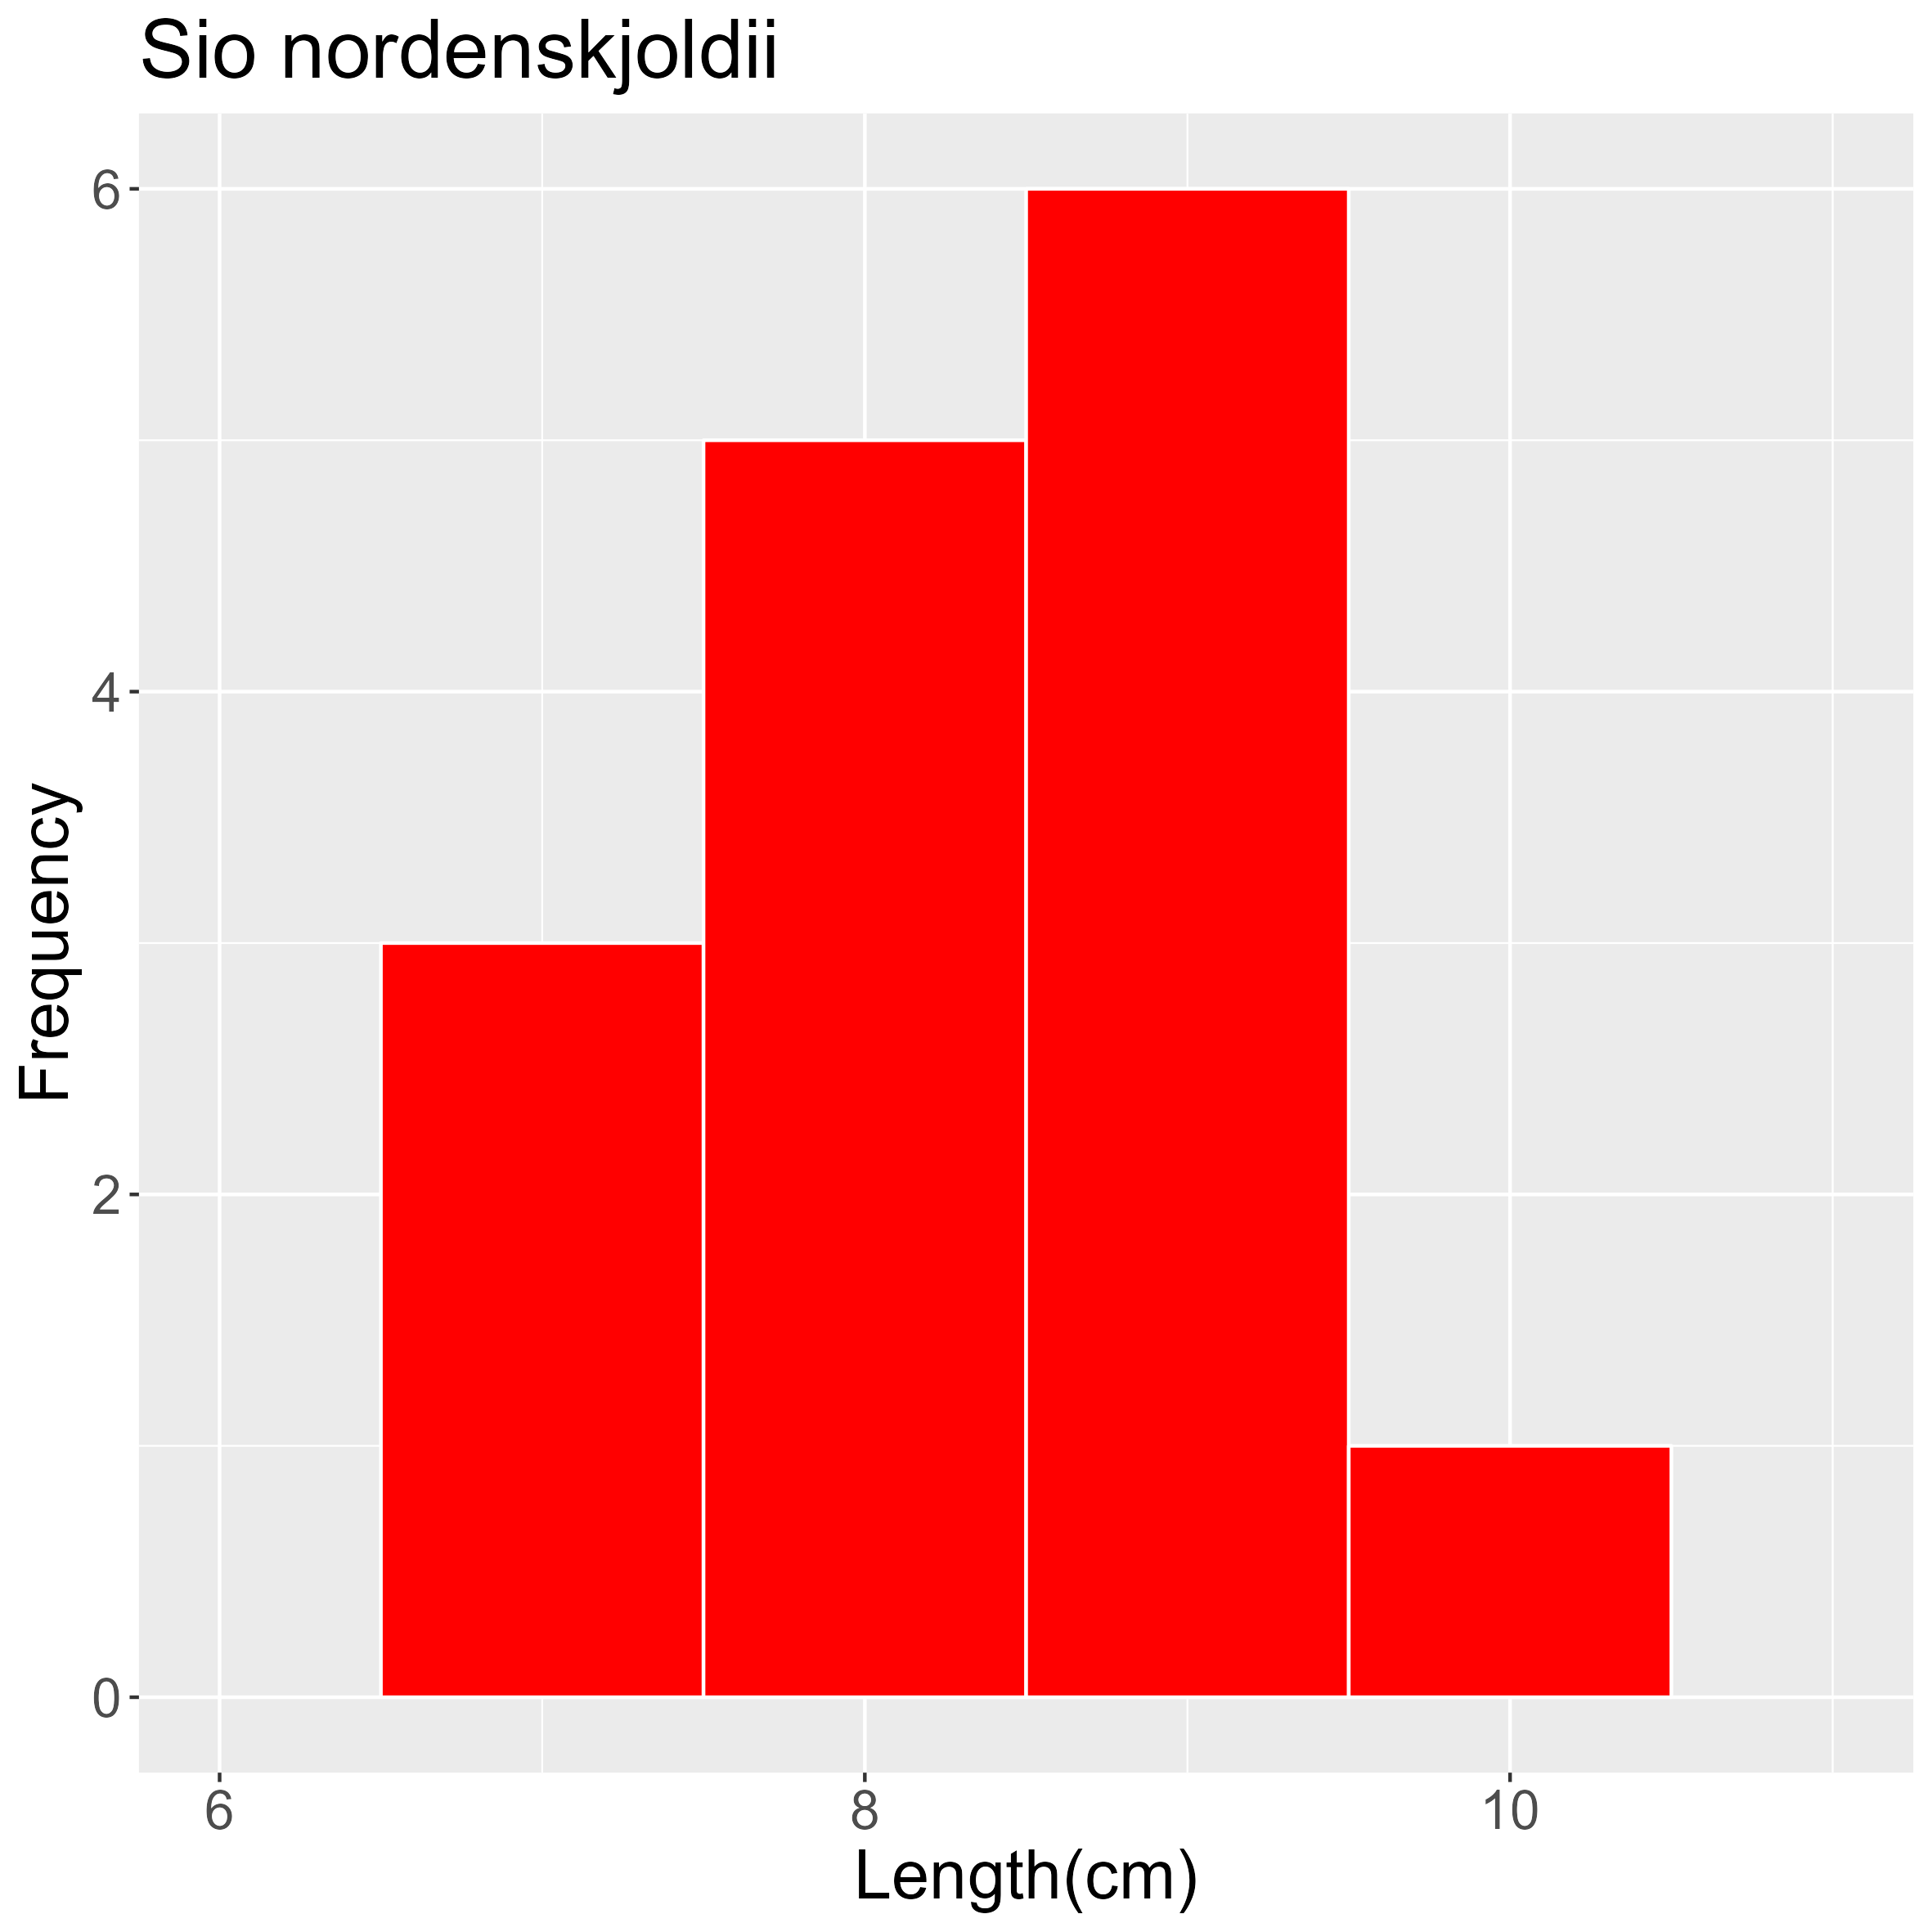
2.16.3 - Sio nordenskjoldii (Lönnberg, 1905)
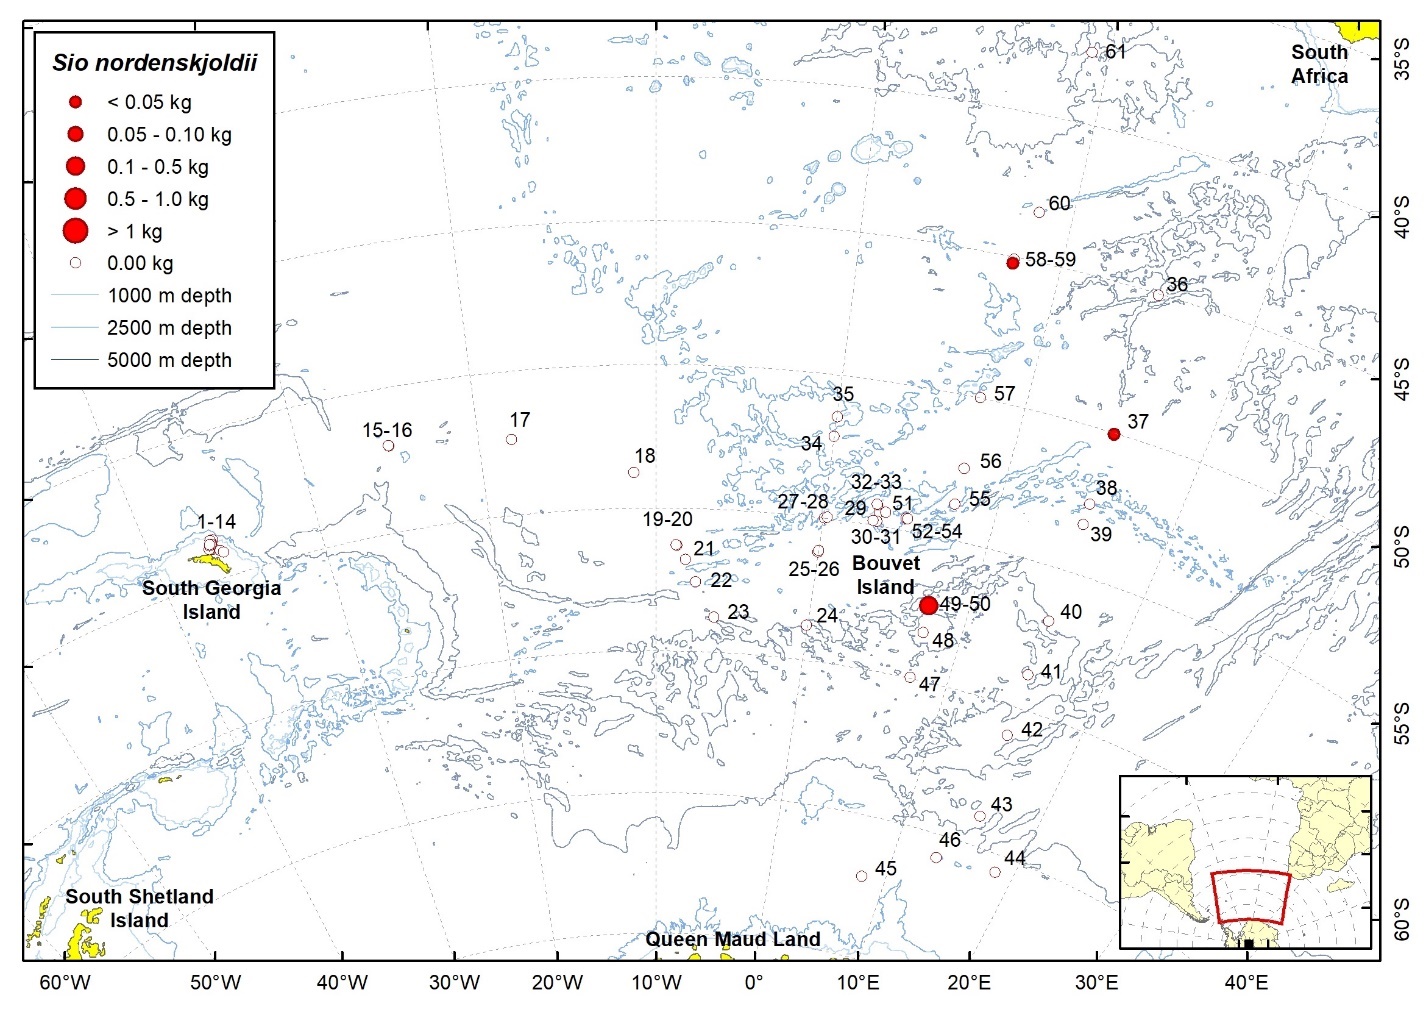
| Station | Date | Latitude | Longitude | Ind. caught | W (g) | TW fish (kg) | TW catch (kg) | ||
| 37 | 24.02.2008 | 50,04 | S | 15,02 | E | 2 | 23,0 | 3,32 | 14,43 |
| 50 | 08.03.2008 | 57,39 | S | 7,44 | E | 16 | 247,0 | 26,34 | 31,75 |
| 58 | 17.03.2008 | 45,20 | S | 7,65 | E | 3 | 24,0 | 10,17 | 19,92 |
2.17 - Gempylidae
2.17.1 - Paradiplospinus antarcticus Andriashev, 1960

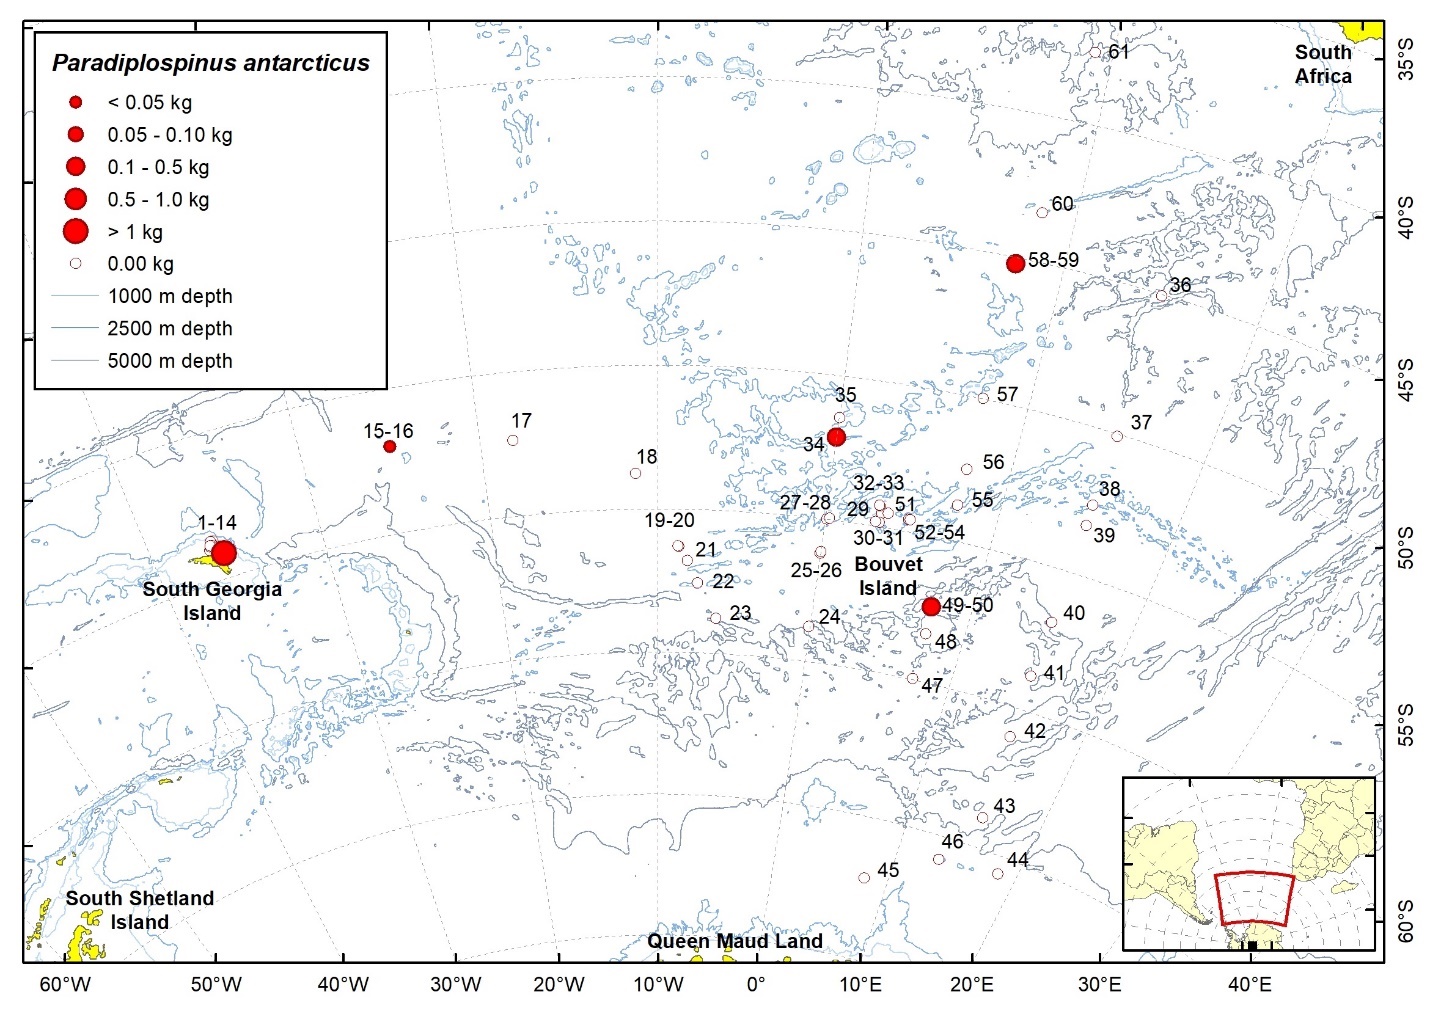
| Station | Date | Latitude | Longitude | Ind. caught | W (g) | TW fish (kg) | TW catch (kg) | ||
| 14 | 23.01.2008 | 54,14 | S | 35,88 | W | 6 | 1326,0 | 311,92 | 311,92 |
| 16 | 24.01.2008 | 51,99 | S | 25,00 | W | 1 | 13,6 | 3,23 | 45,05 |
| 34 | 06.02.2008 | 52,12 | S | 0,02 | W | 19 | 250,4 | 4,15 | 44,70 |
| 50 | 08.03.2008 | 57,39 | S | 7,44 | E | 2 | 152,0 | 26,34 | 31,75 |
| 58 | 17.03.2008 | 45,20 | S | 7,65 | E | 8 | 194,0 | 10,17 | 19,92 |
2.17.2 - Paradiplospinus gracilis (Brauer, 1906)
Remarks: Due to taxonomic confusion both P. antarcticus and P. gracilis were registered, although only P. antarcticus is likely to occur in the area.

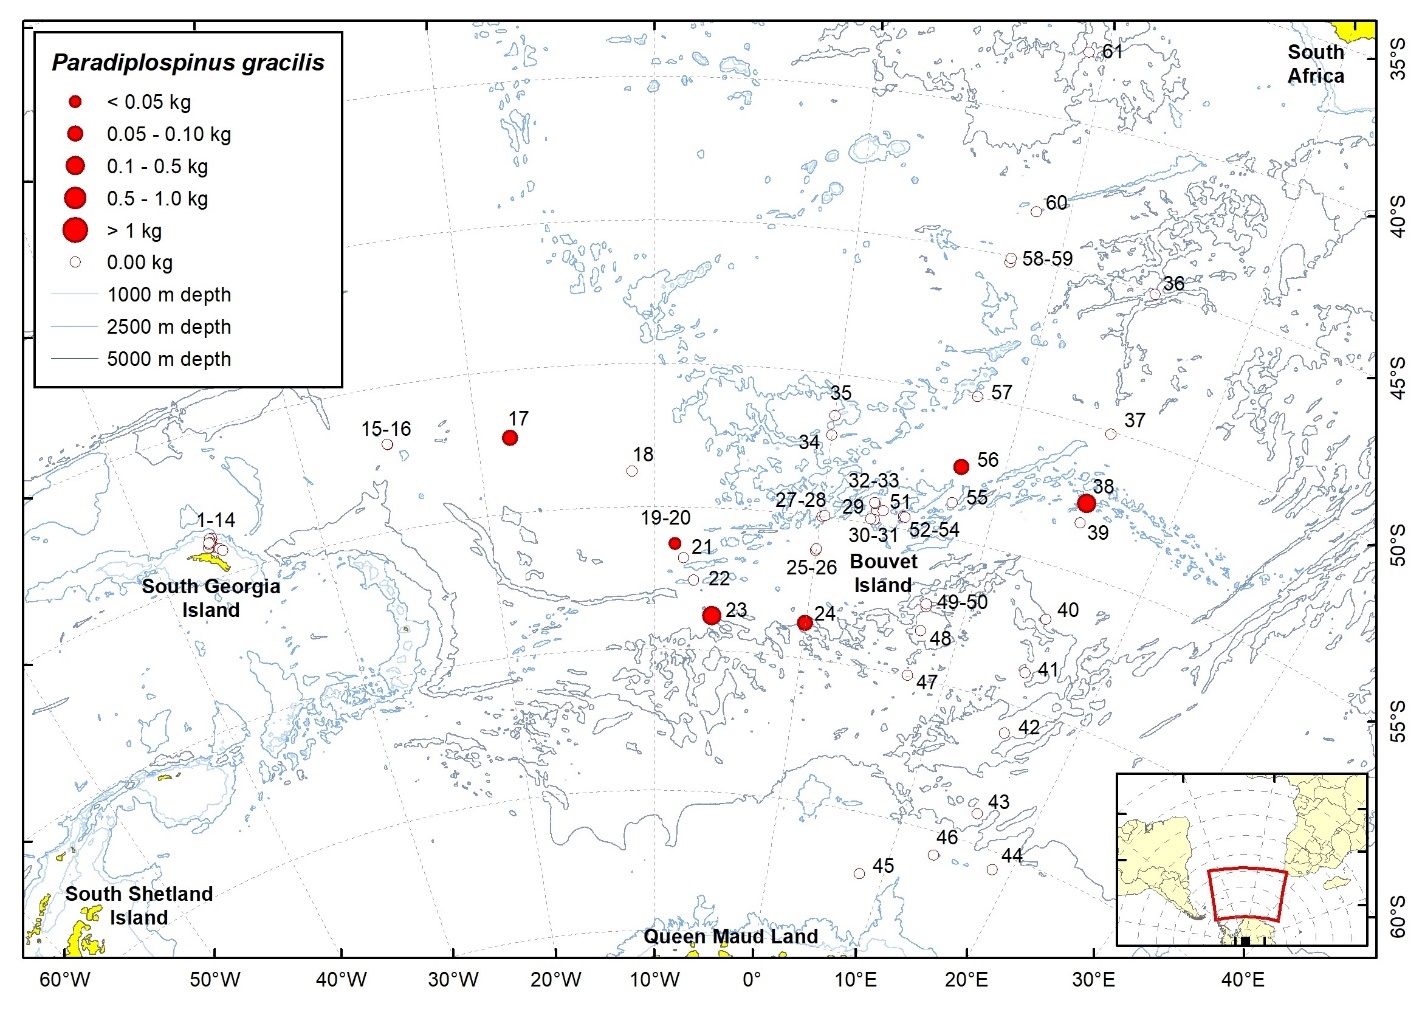
| Station | Date | Latitude | Longitude | Ind. caught | W (g) | TW fish (kg) | TW catch (kg) | ||
| 17 | 26.01.2008 | 52,33 | S | 18,16 | W | 5 | 67,1 | 1,20 | 26,43 |
| 19 | 29.01.2008 | 56,28 | S | 8,71 | W | 1 | 10,8 | 0,16 | 49,45 |
| 23 | 30.01.2008 | 58,77 | S | 6,20 | W | 1 | 113,0 | 4,14 | 13,02 |
| 24 | 31.01.2008 | 58,76 | S | 0,04 | W | 1 | 83,8 | 1,49 | 29,02 |
| 38 | 25.02.2008 | 52,60 | S | 15,01 | E | 5 | 122,0 | 3,66 | 49,50 |
| 56 | 14.03.2008 | 52,45 | S | 7,56 | E | 3 | 53,0 | 0,44 | 188,87 |
2.18 - Centrolophidae
2.18.1 - Icichthys australis (Haedrich, 1966)
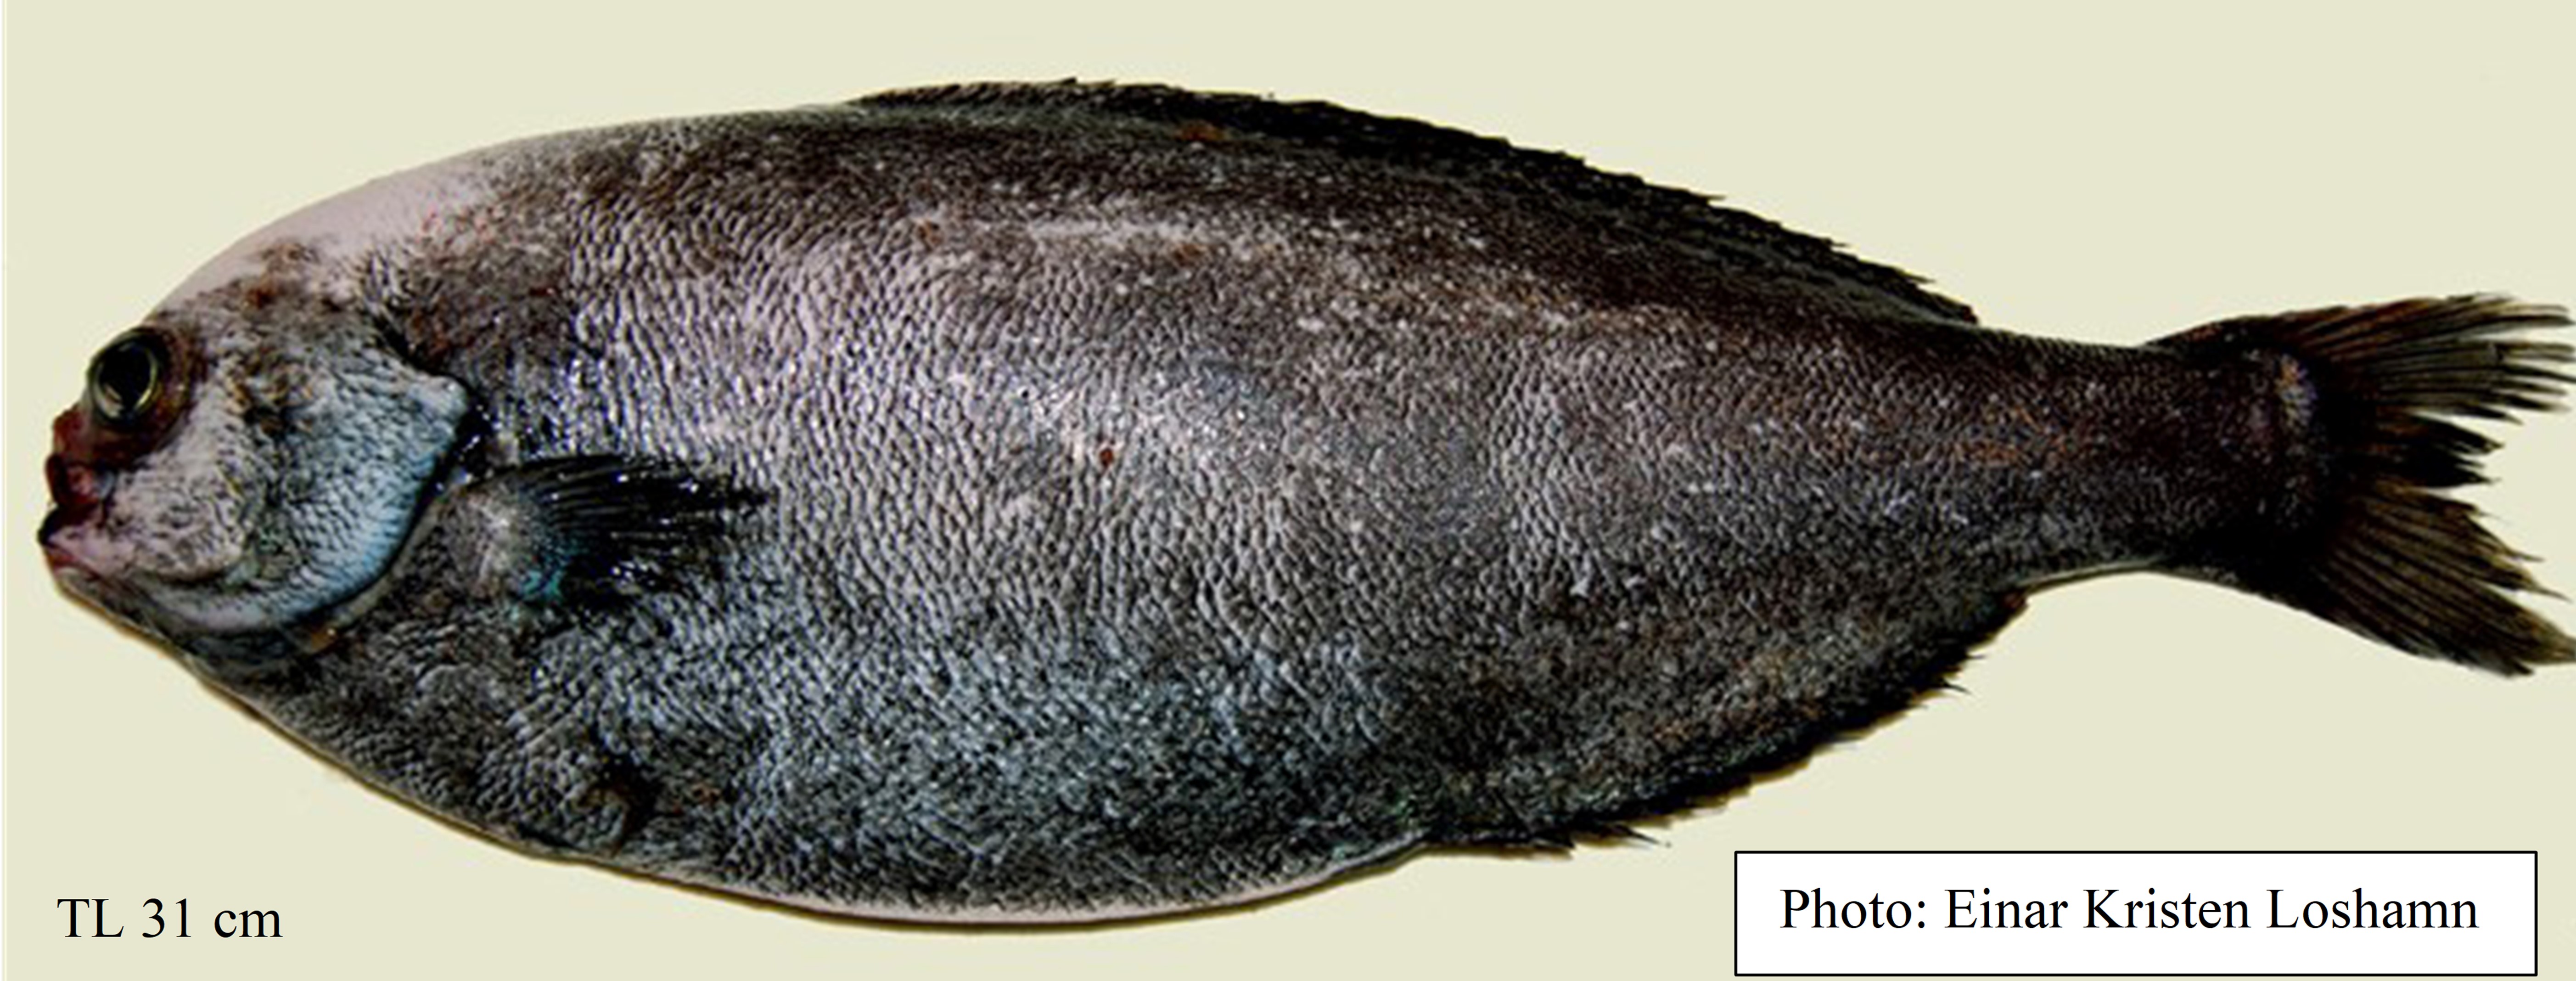
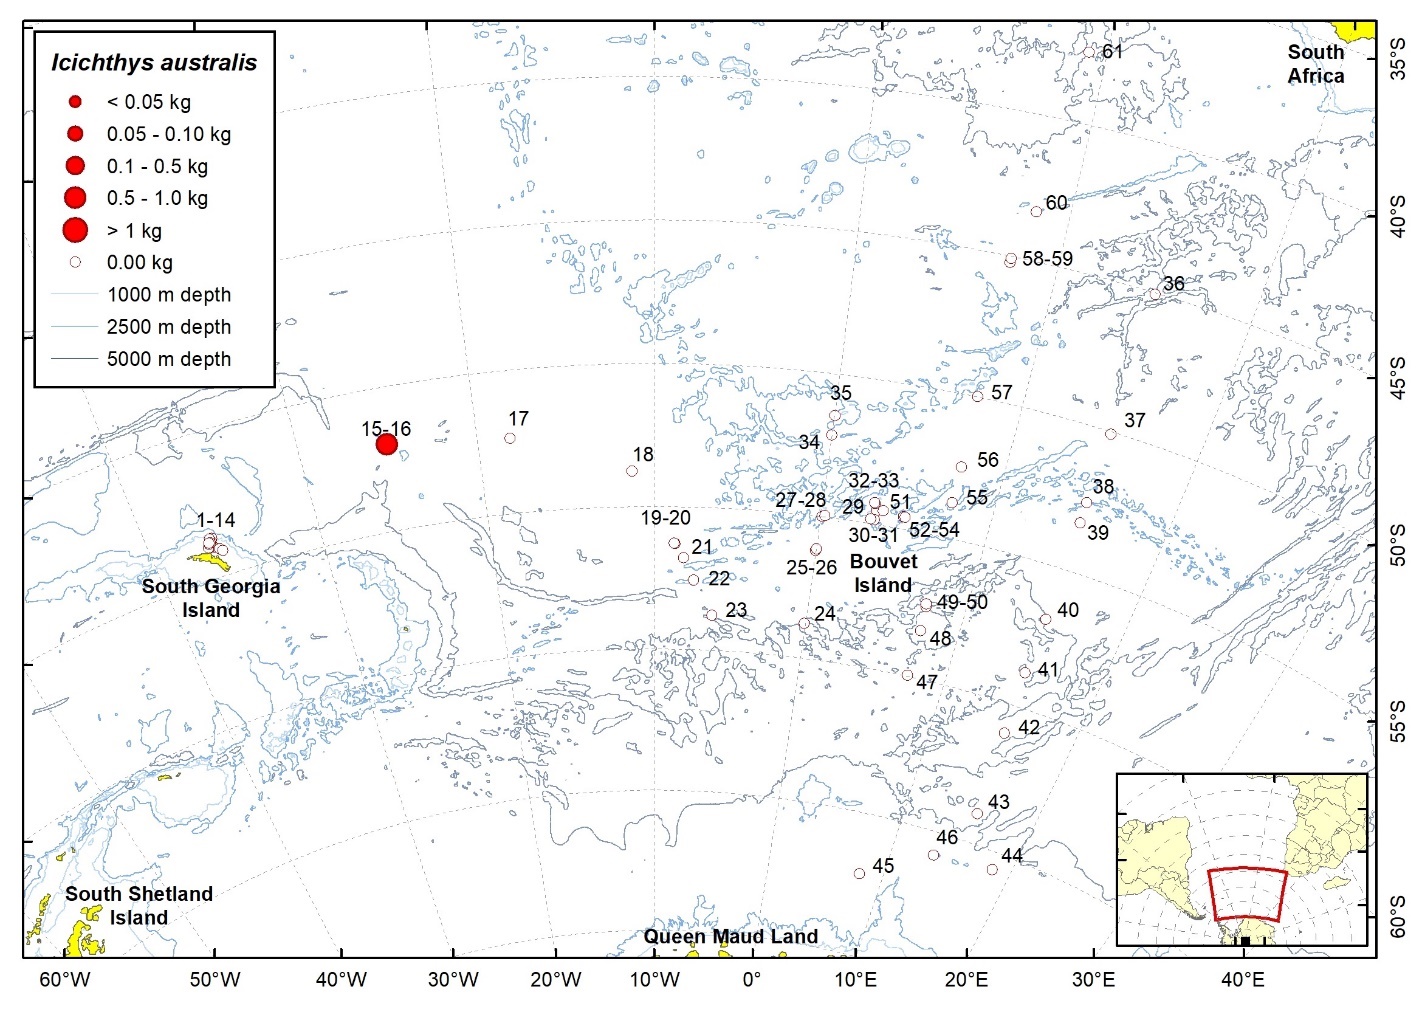
| Station | Date | Latitude | Longitude | Ind. caught | W (g) | TW fish (kg) | TW catch (kg) | ||
| 16 | 25.01.2008 | 51,98 | S | 25,06 | W | 1 | 540,0 | 3,23 | 45,05 |
2.19 - Oneirodidae
2.19.1 - Oneirodes notius Pietsch, 1974
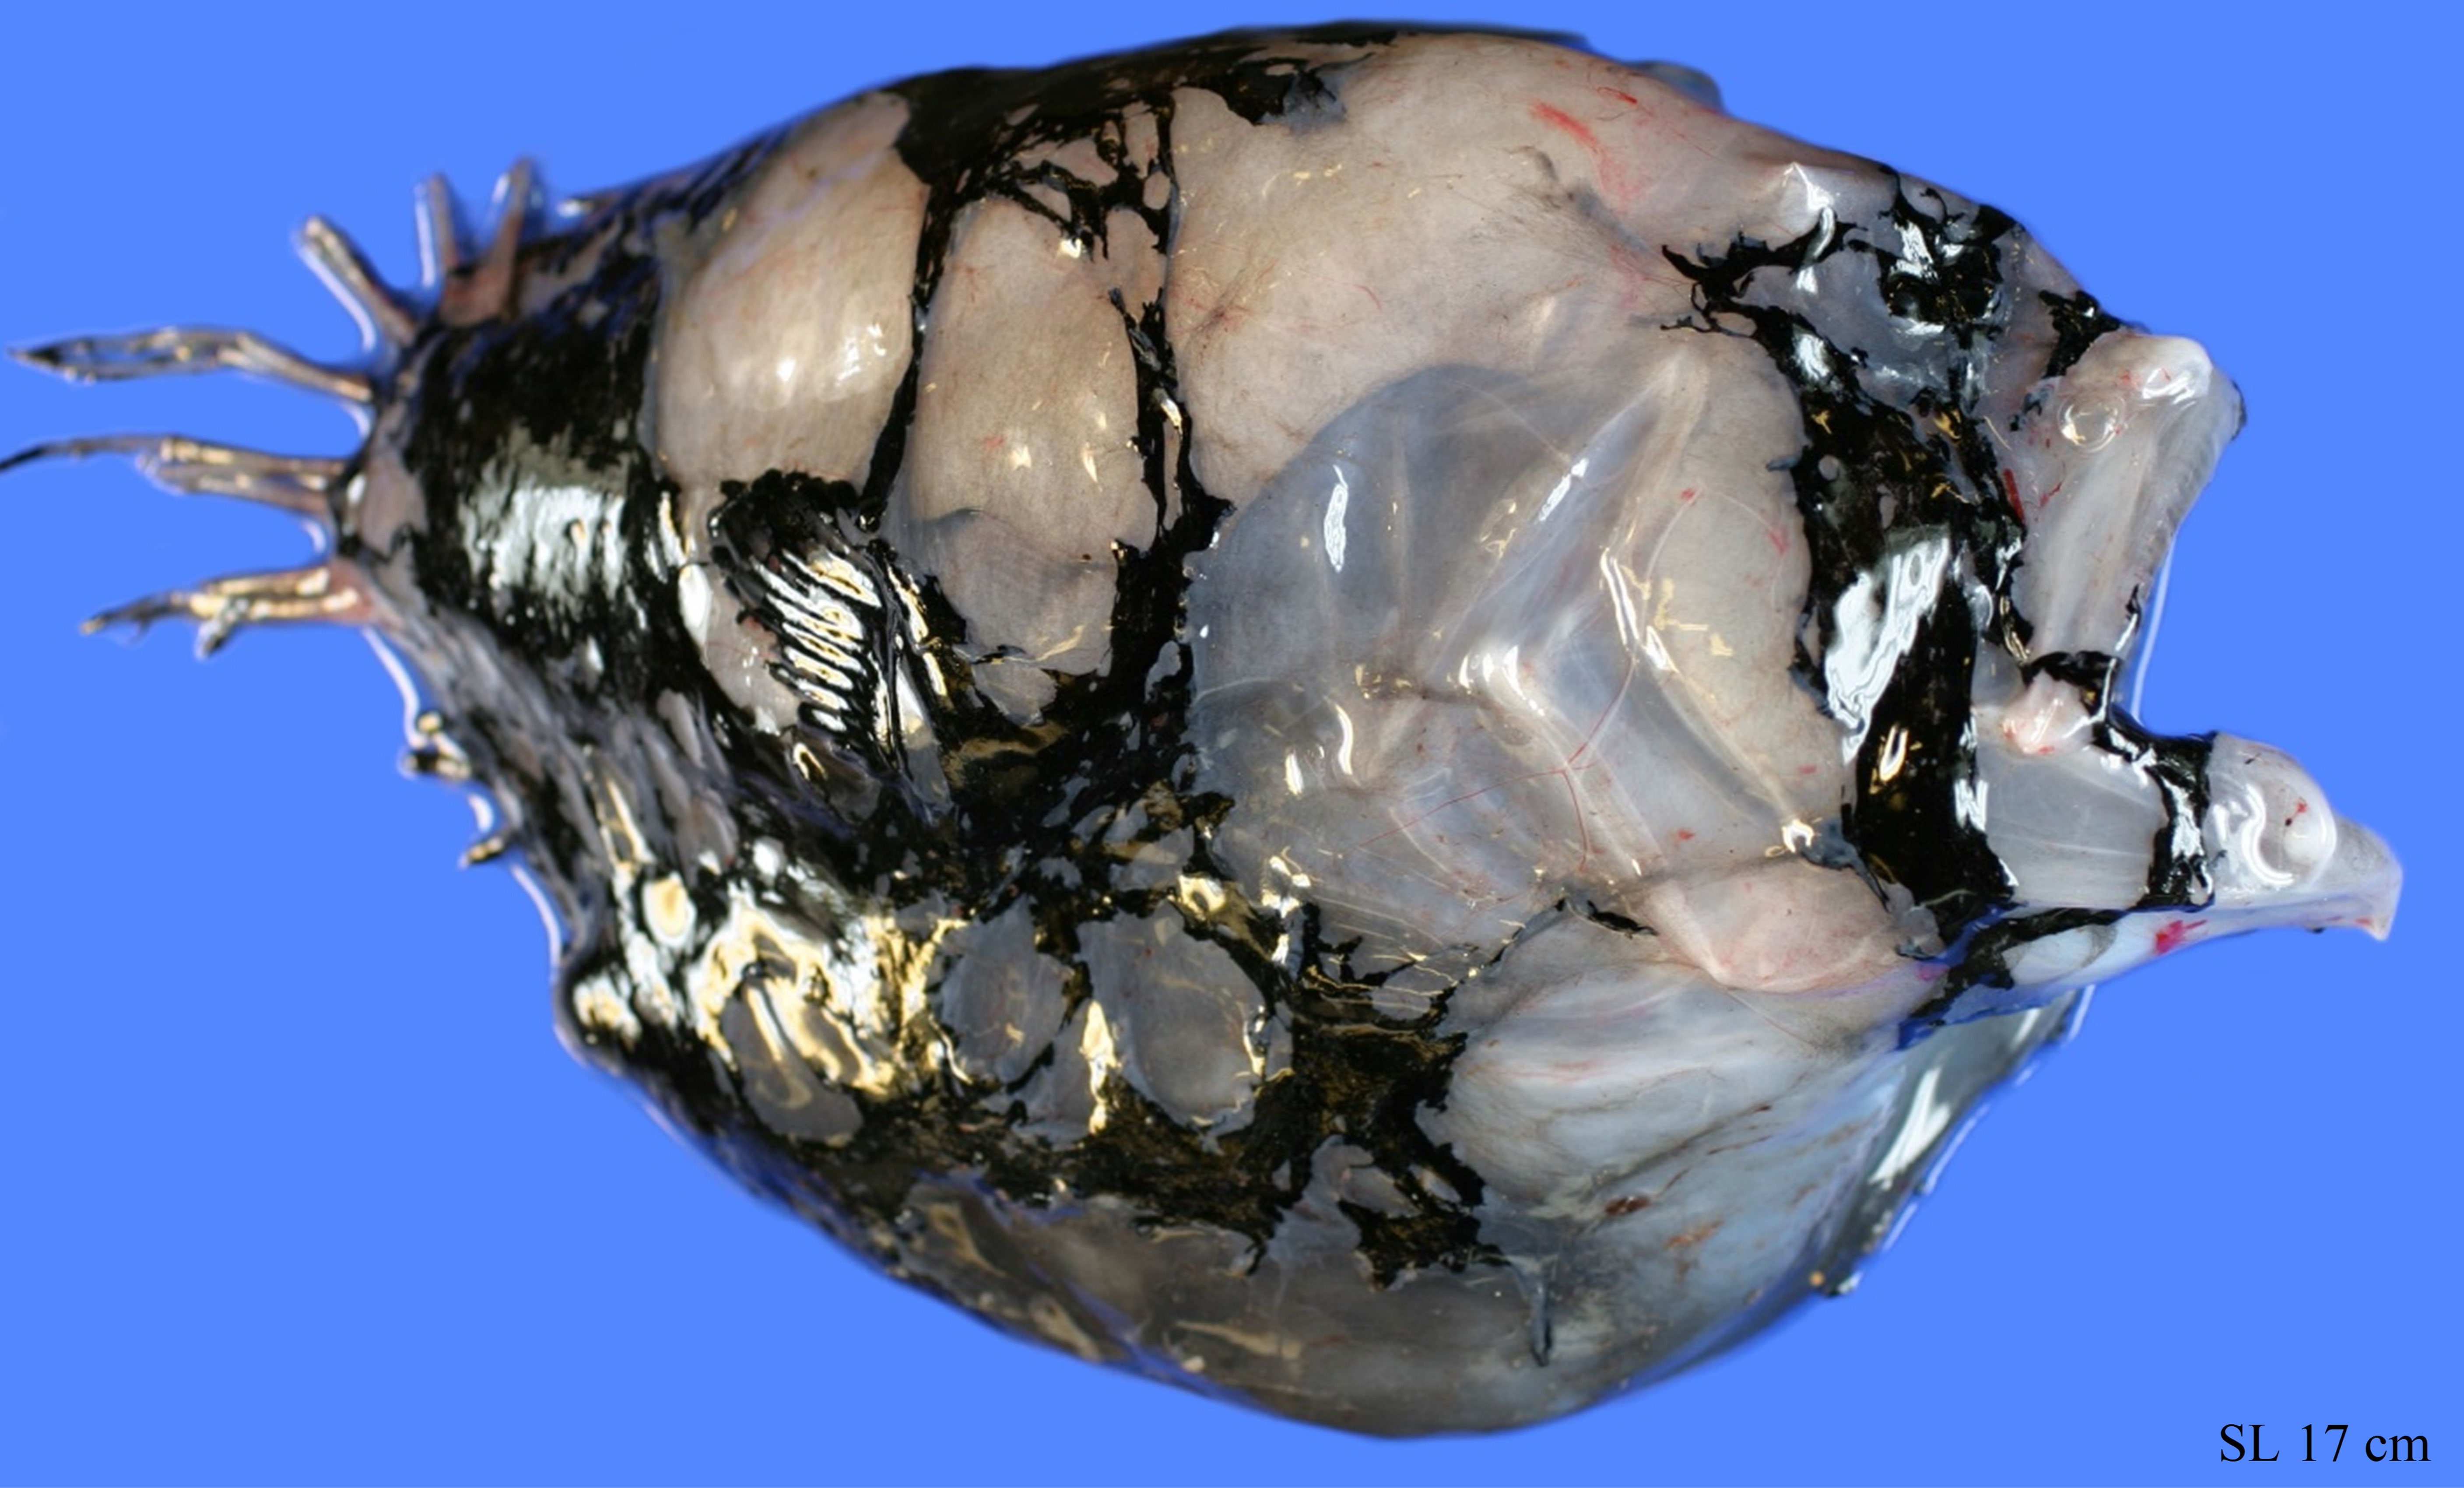
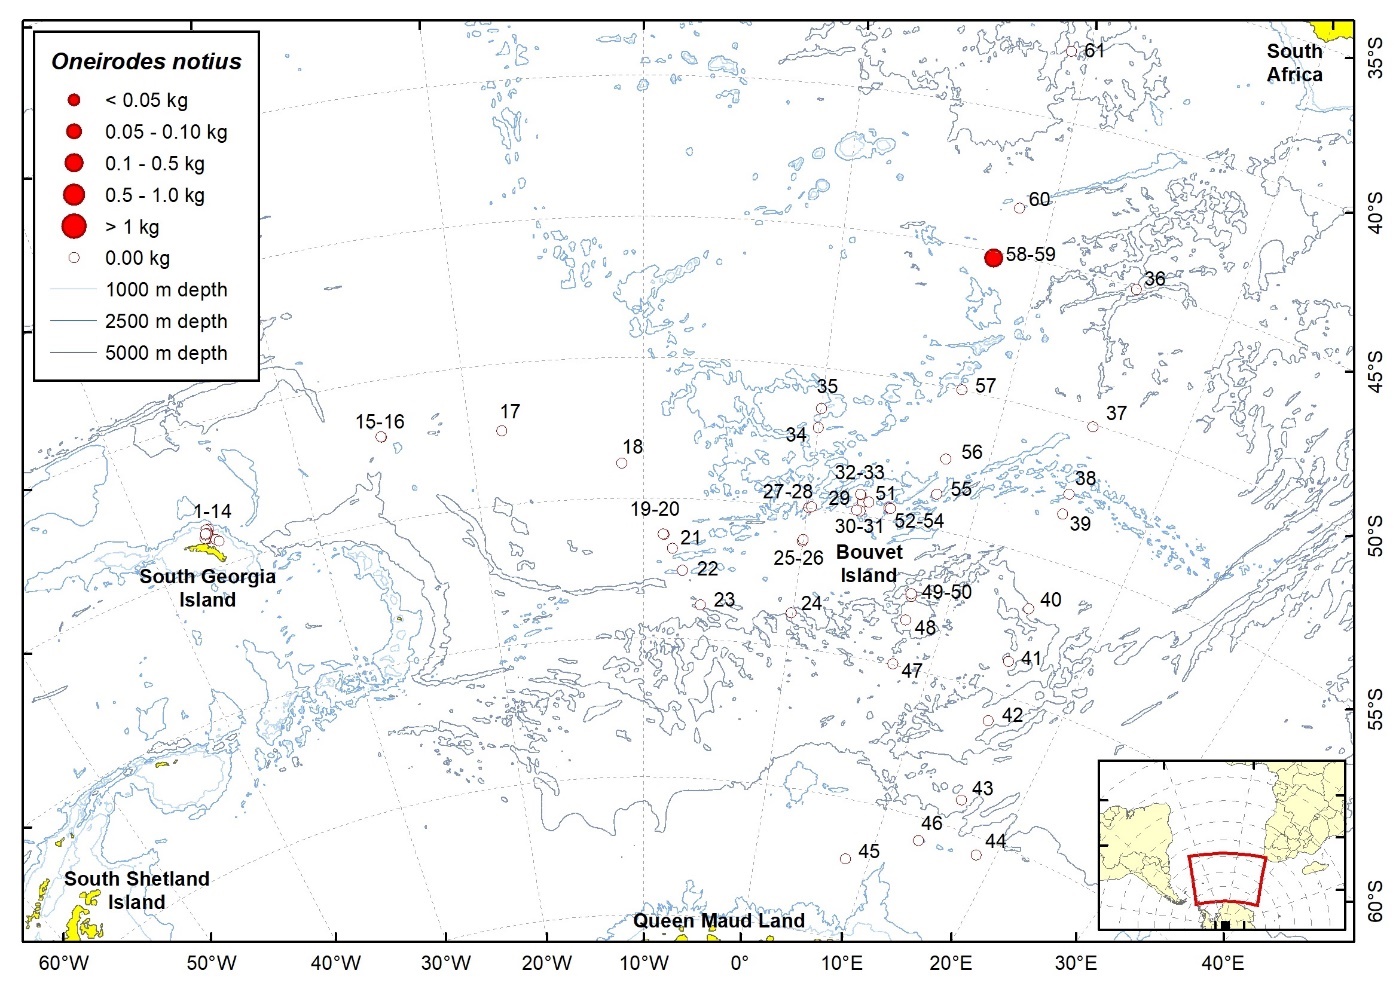
| Station | Date | Latitude | Longitude | Ind. caught | W (g) | TW fish (kg) | TW catch (kg) | ||
| 58 | 17.03.2008 | 45,20 | S | 7,65 | E | 1 | 340,0 | 10,17 | 19,92 |
2.20 - Gigantactinidae
2.20.1 - Gigantactis meadi Bertelsen, Pietsch & Lavenberg, 1981
| Station | Date | Latitude | Longitude | Ind. caught | W (g) | TW fish (kg) | TW catch (kg) | ||
| 58 | 17.03.2008 | 45,20 | S | 7,65 | E | 1 | 9,0 | 10,17 | 19,92 |
2.21 - Epigonidae
2.21.1 - Rosenblattia robusta Mead & De Falla, 1965
| Station | Date | Latitude | Longitude | Ind. caught | W (g) | TW fish (kg) | TW catch (kg) | |||
| 58 | 17.03.2008 | 45,20 | S | 7,65 | E | 3 | 60,0 | 10,17 | 19,92 | |
2.22 - Nototheniidae
2.22.1 - Lepidonotothen squamifrons (Günther, 1880)

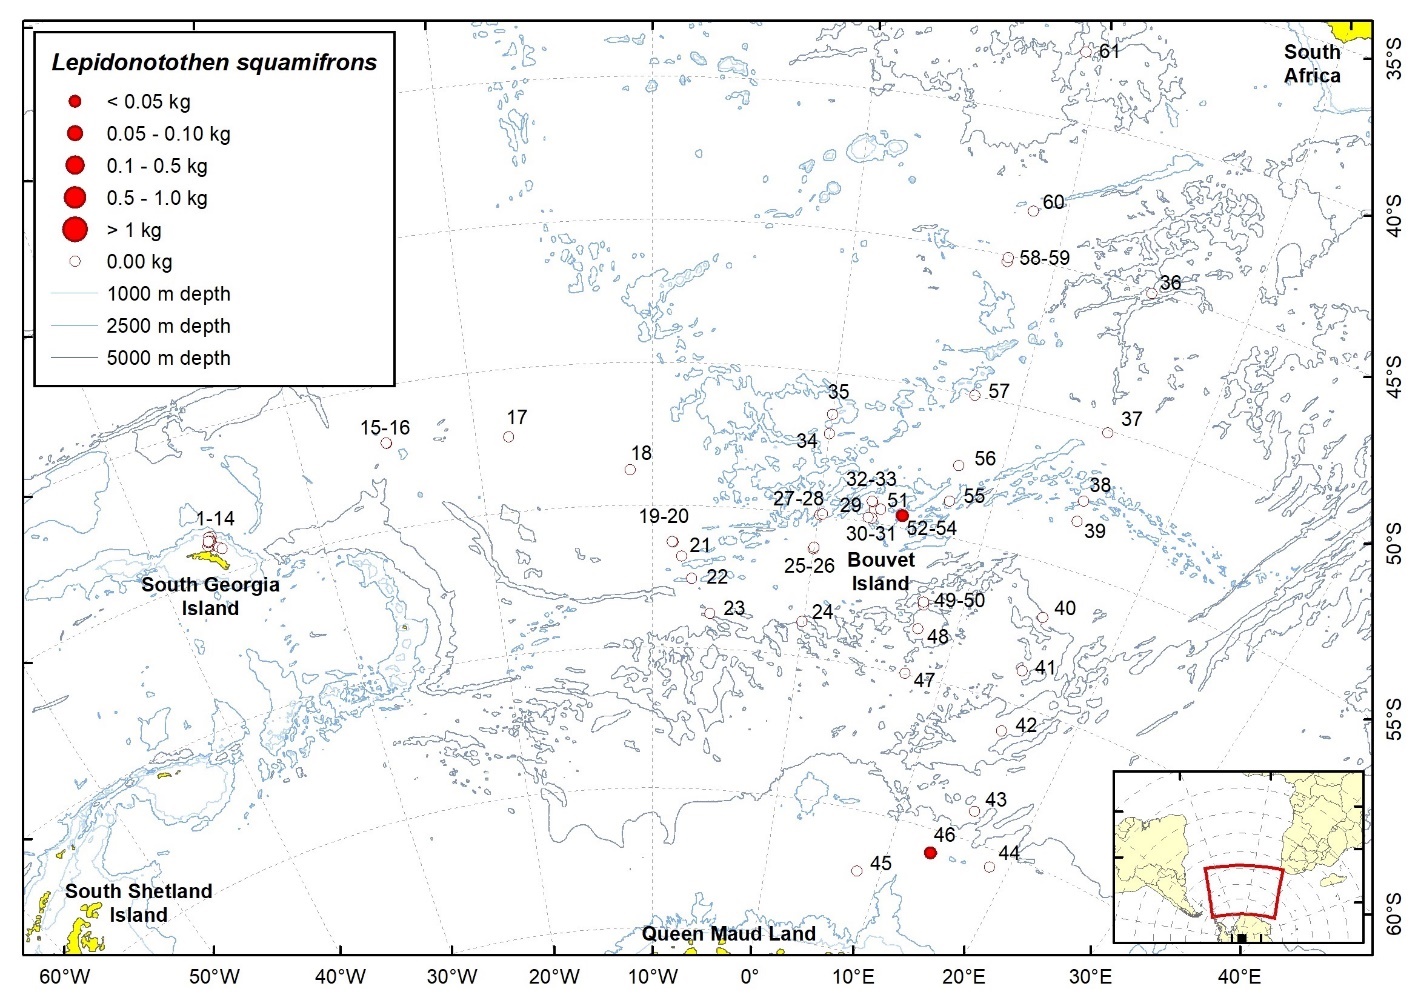
| Station | Date | Latitude | Longitude | Ind. caught | W (g) | TW fish (kg) | TW catch (kg) | ||
| 46 | 05.03.2008 | 65,81 | S | 13,45 | E | 1 | 0,7 | 1,59 | 32,17 |
| 54 | 13.03.2008 | 54,58 | S | 4,98 | E | 1 | 0,7 | 0,26 | 85,64 |
2.22.2 - Nototheniops larseni (Lönnberg, 1905)
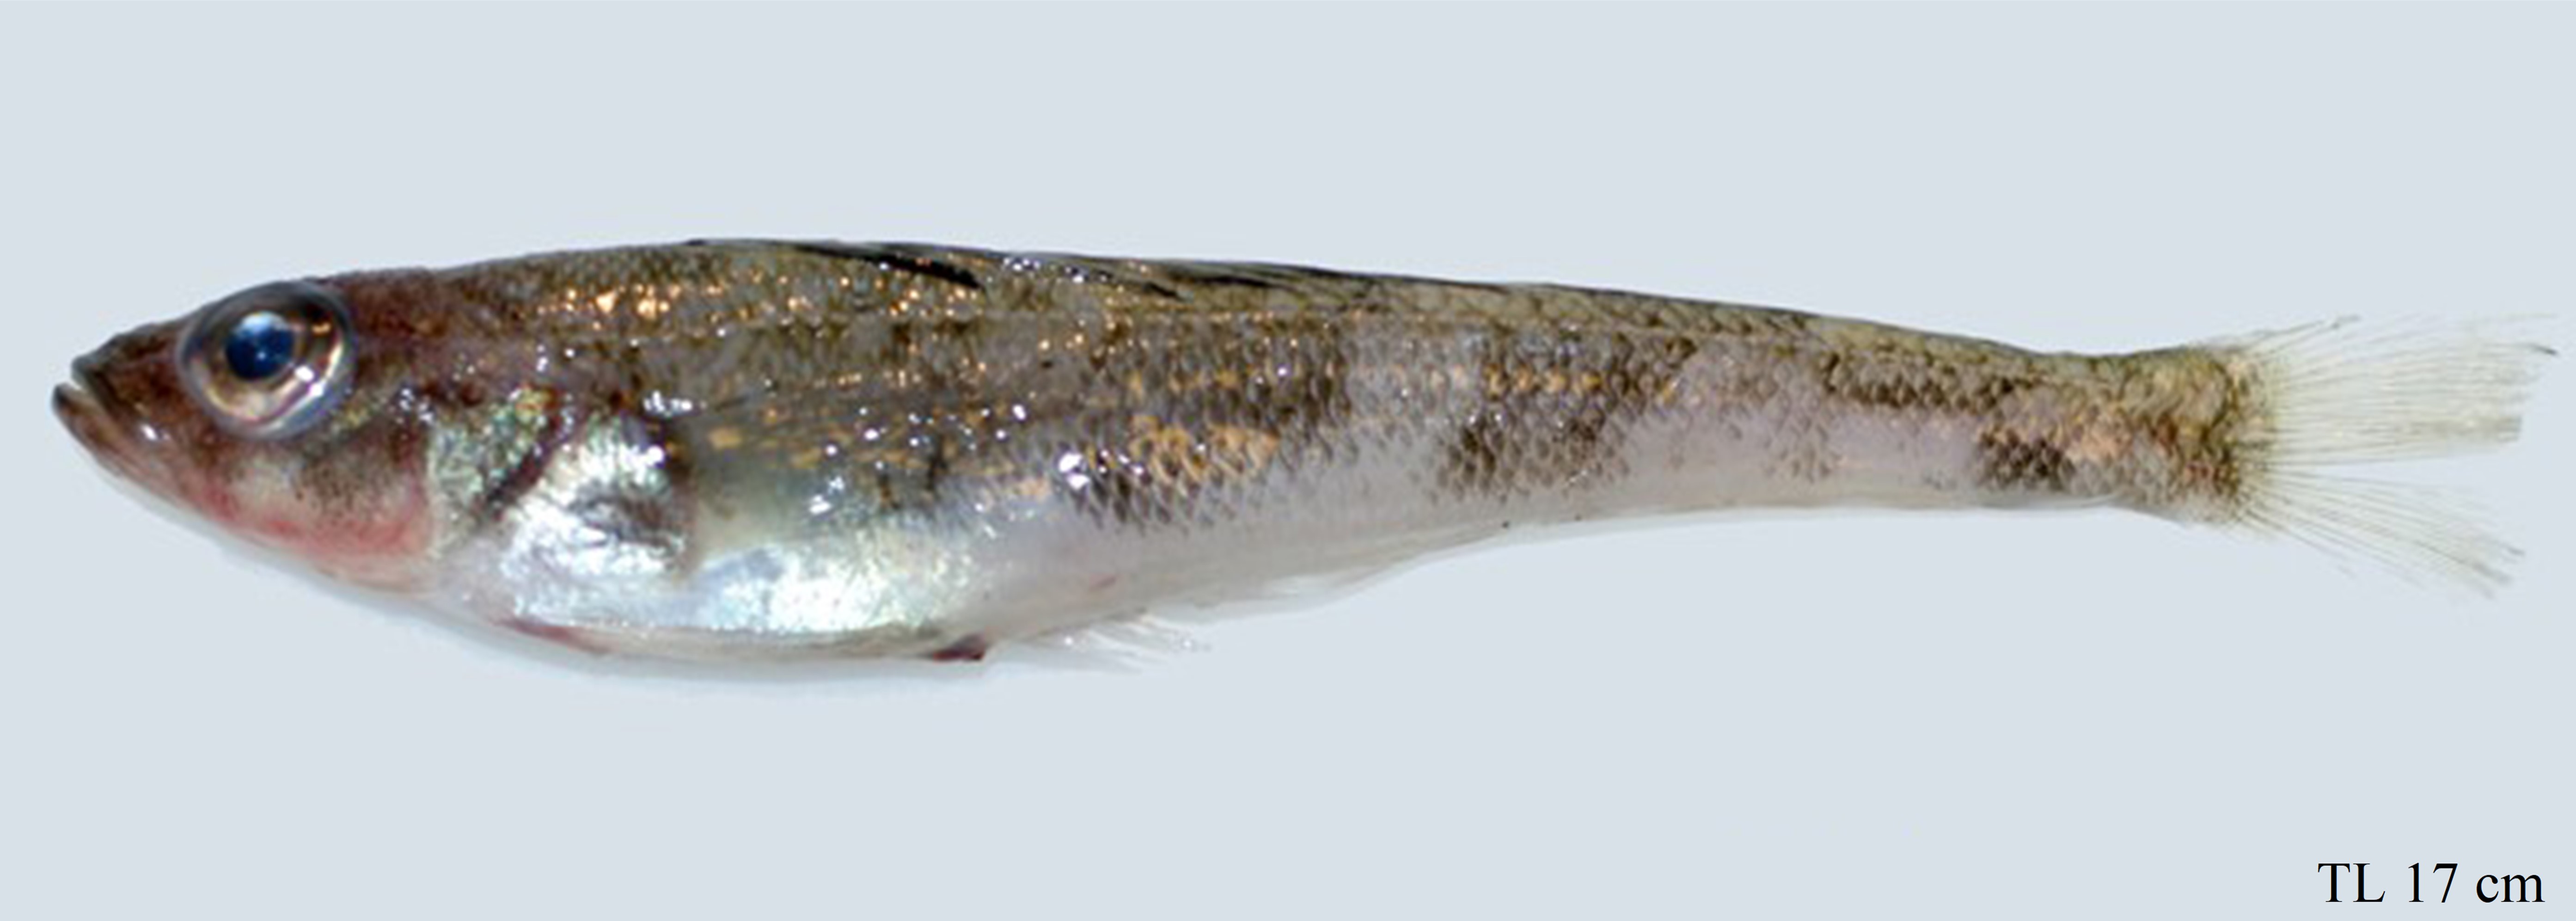
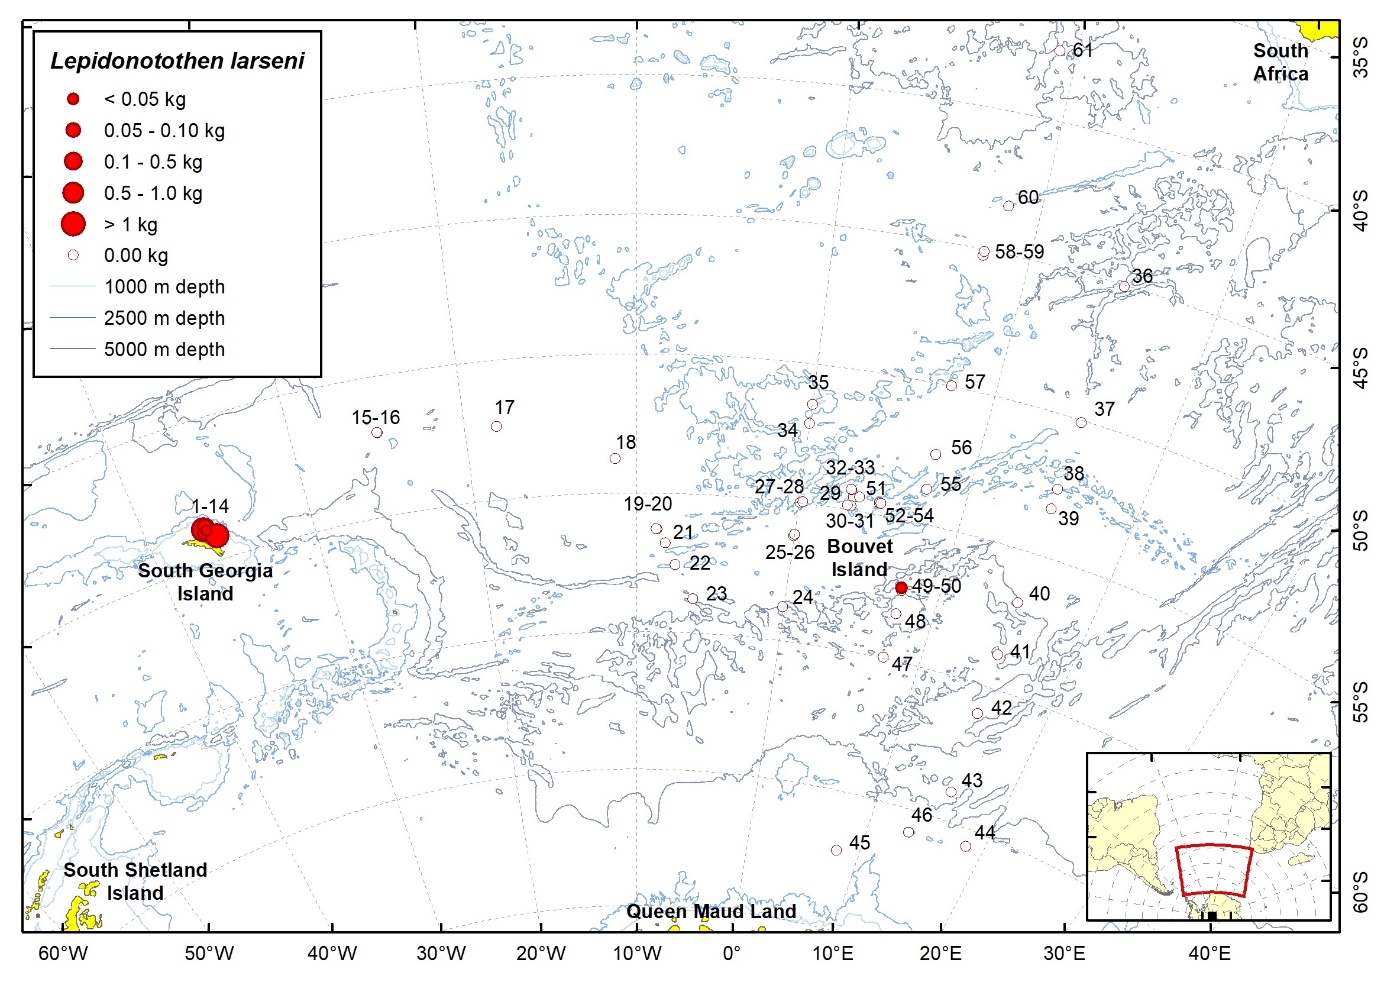
| Station | Date | Latitude | Longitude | Ind. caught | W (g) | TW fish (kg) | TW catch (kg) | ||
| 3 | 19.01.2008 | 53,87 | S | 36,37 | W | 1 | 0,3 | 0,01 | 0,15 |
| 5 | 20.01.2008 | 53,69 | S | 36,37 | W | 175 | 87,6 | 0,09 | 1000,00 |
| 8 | 21.01.2008 | 53,92 | S | 36,63 | W | 71 | 11,0 | 0,57 | 5,56 |
| 10 | 22.01.2008 | 53,79 | S | 36,52 | W | 653 | 10000,0 | 42,18 | 44,88 |
| 14 | 23.01.2008 | 54,14 | S | 35,88 | W | 78 | 1770,0 | 311,92 | 311,92 |
| 50 | 08.03.2008 | 57,39 | S | 7,44 | E | 1 | 28,0 | 26,34 | 31,75 |
2.22.3 - Trematomus eulepidotus (Regan, 1914)
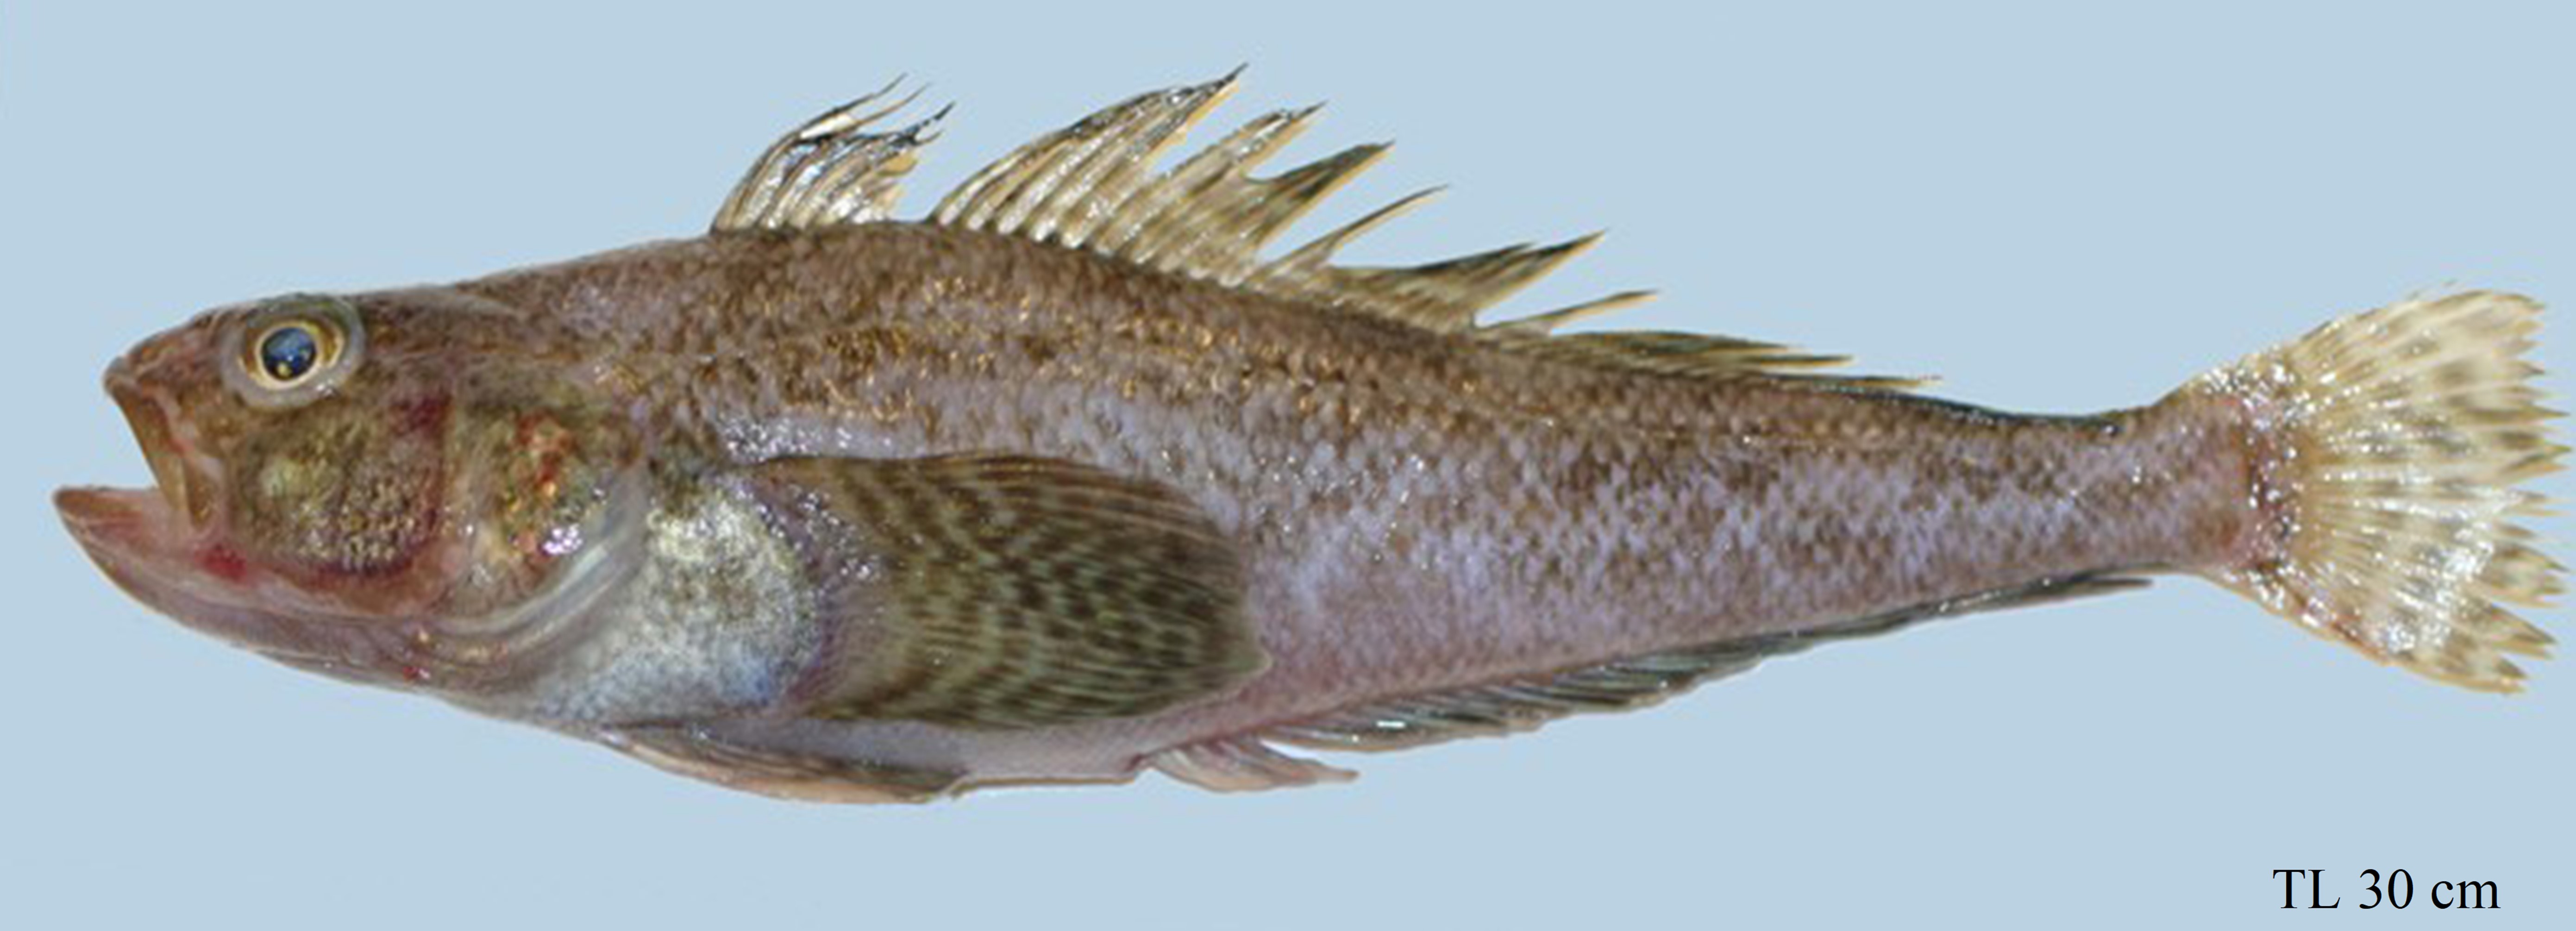
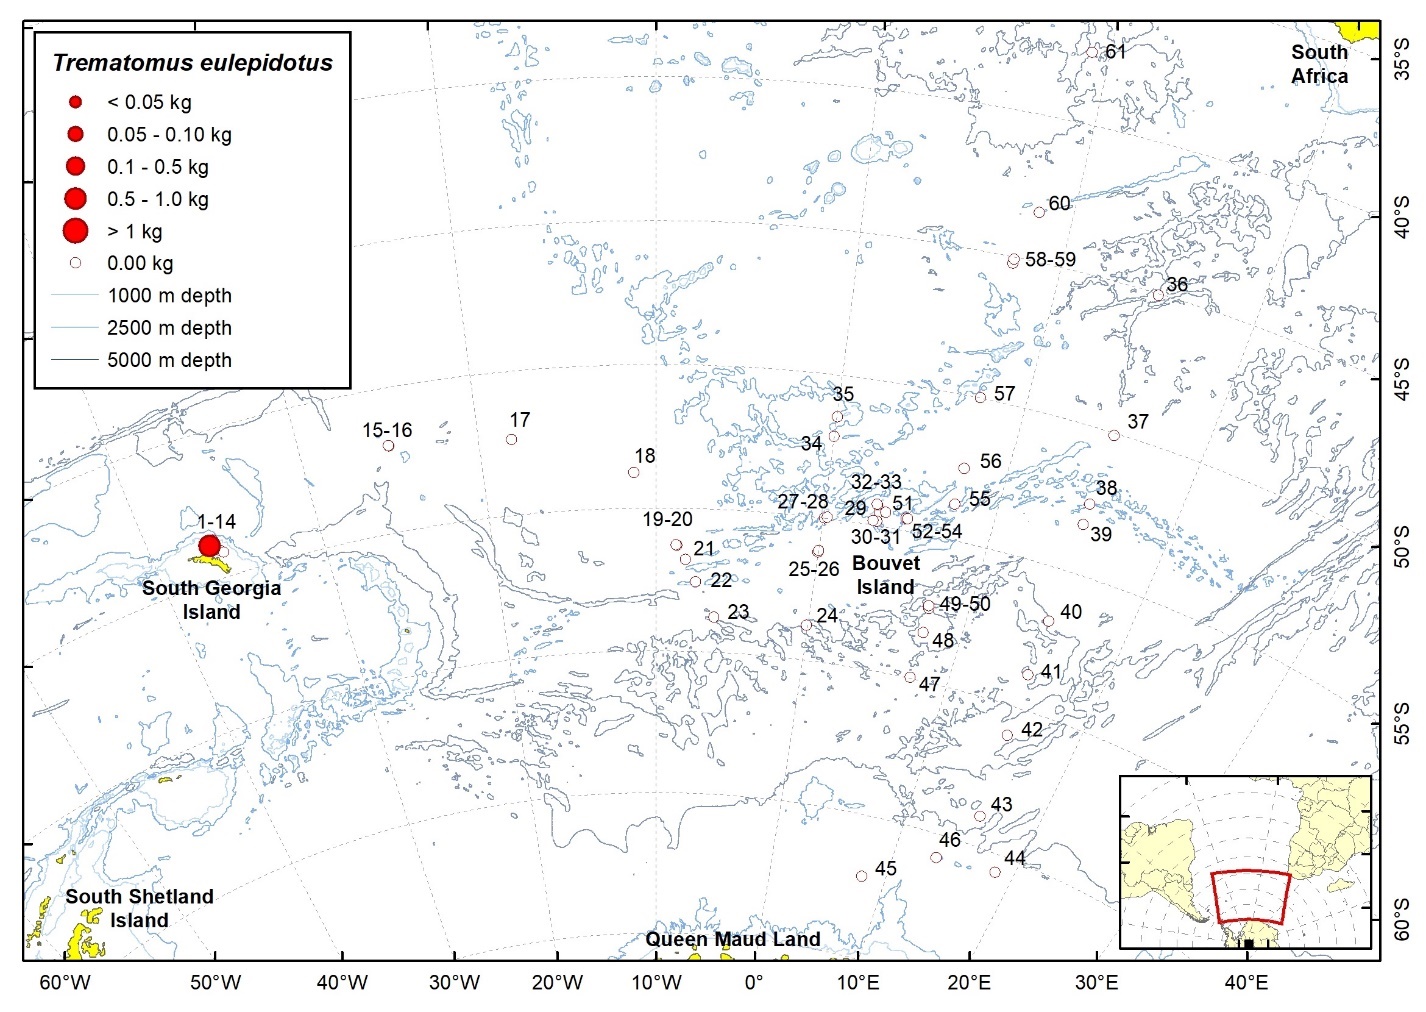
| Station | Date | Latitude | Longitude | Ind. caught | W (g) | TW fish (kg) | TW catch (kg) | ||
| 10 | 22.01.2008 | 53,79 | S | 36,52 | W | 4 | 741,0 | 42,18 | 44,88 |
2.23 - Bathydraconidae

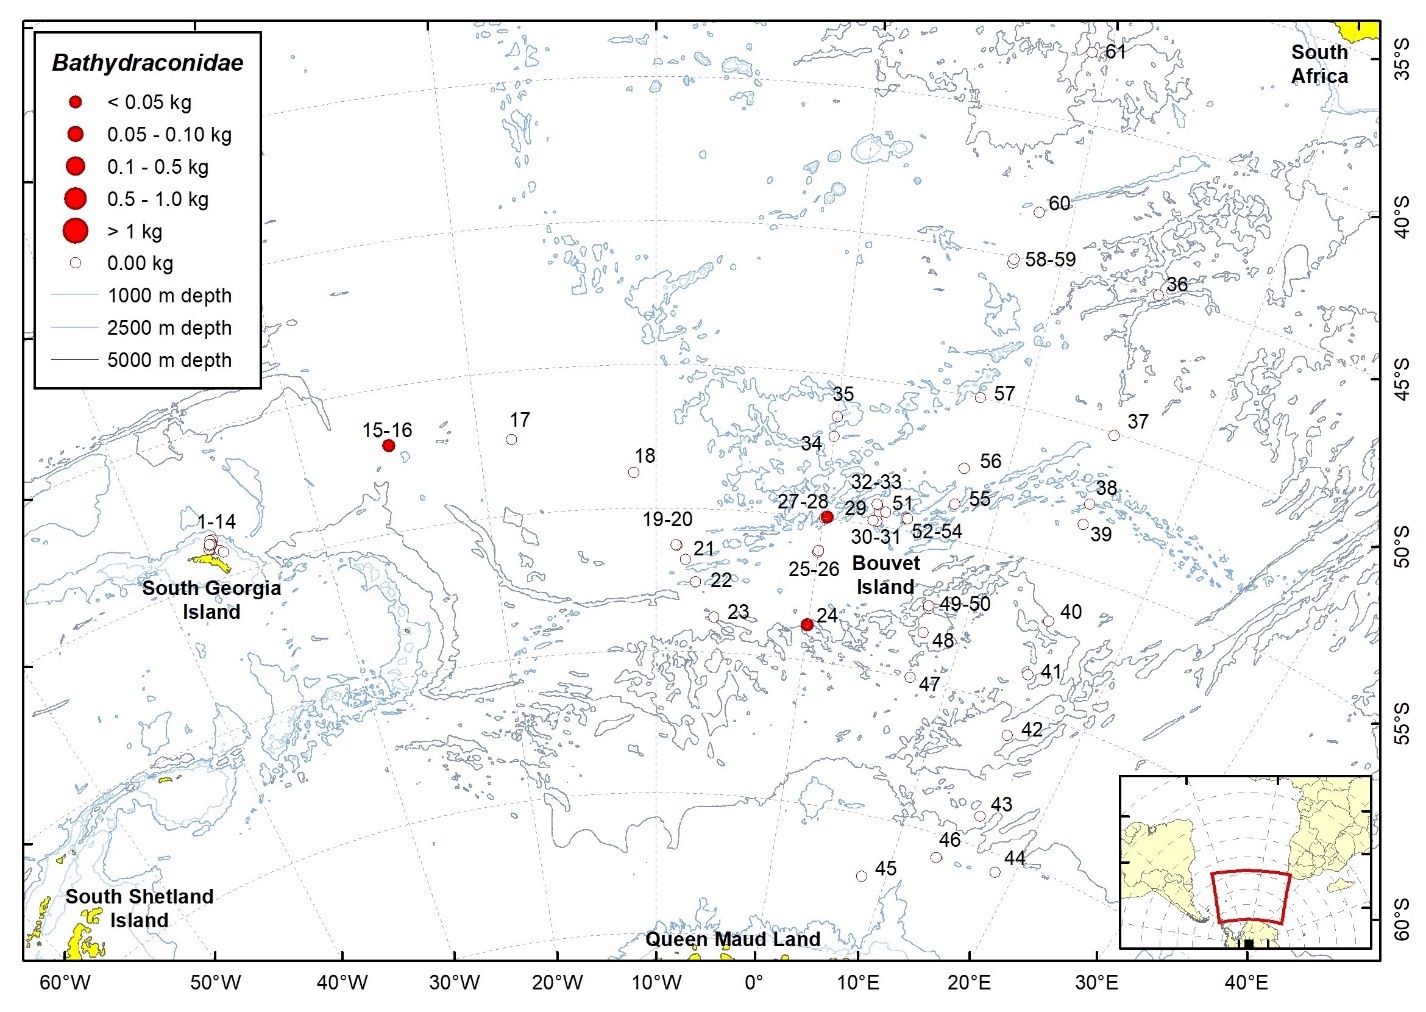
| Station | Date | Latitude | Longitude | Ind. caught | W (g) | TW fish (kg) | TW catch (kg) | ||
| 16 | 24.01.2008 | 51,99 | S | 25,00 | W | 6 | 4,4 | 3,23 | 45,05 |
| 24 | 31.01.2008 | 58,76 | S | 0,04 | W | 1 | 28,3 | 1,49 | 29,02 |
| 28 | 02.02.2008 | 54,94 | S | 0,25 | E | 13 | 5,2 | 0,47 | 89,03 |
2.24 - Channichthyidae
2.24.1 - Chaenocephalus aceratus (Lönnberg, 1906)

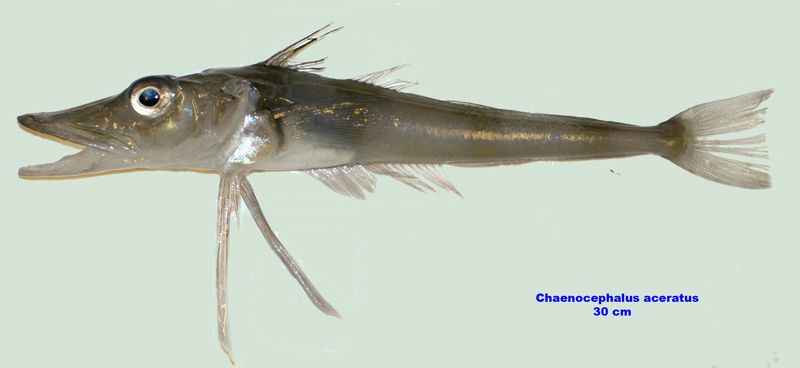
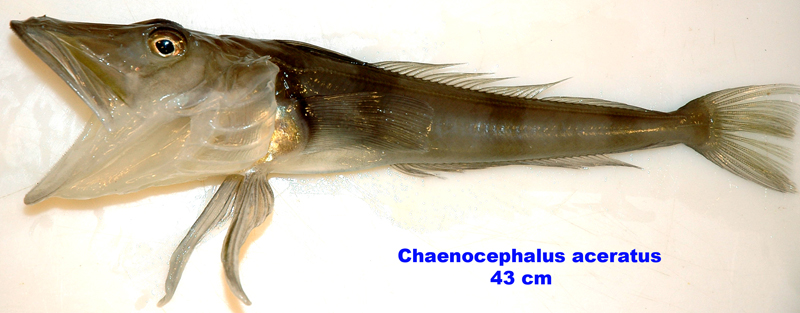
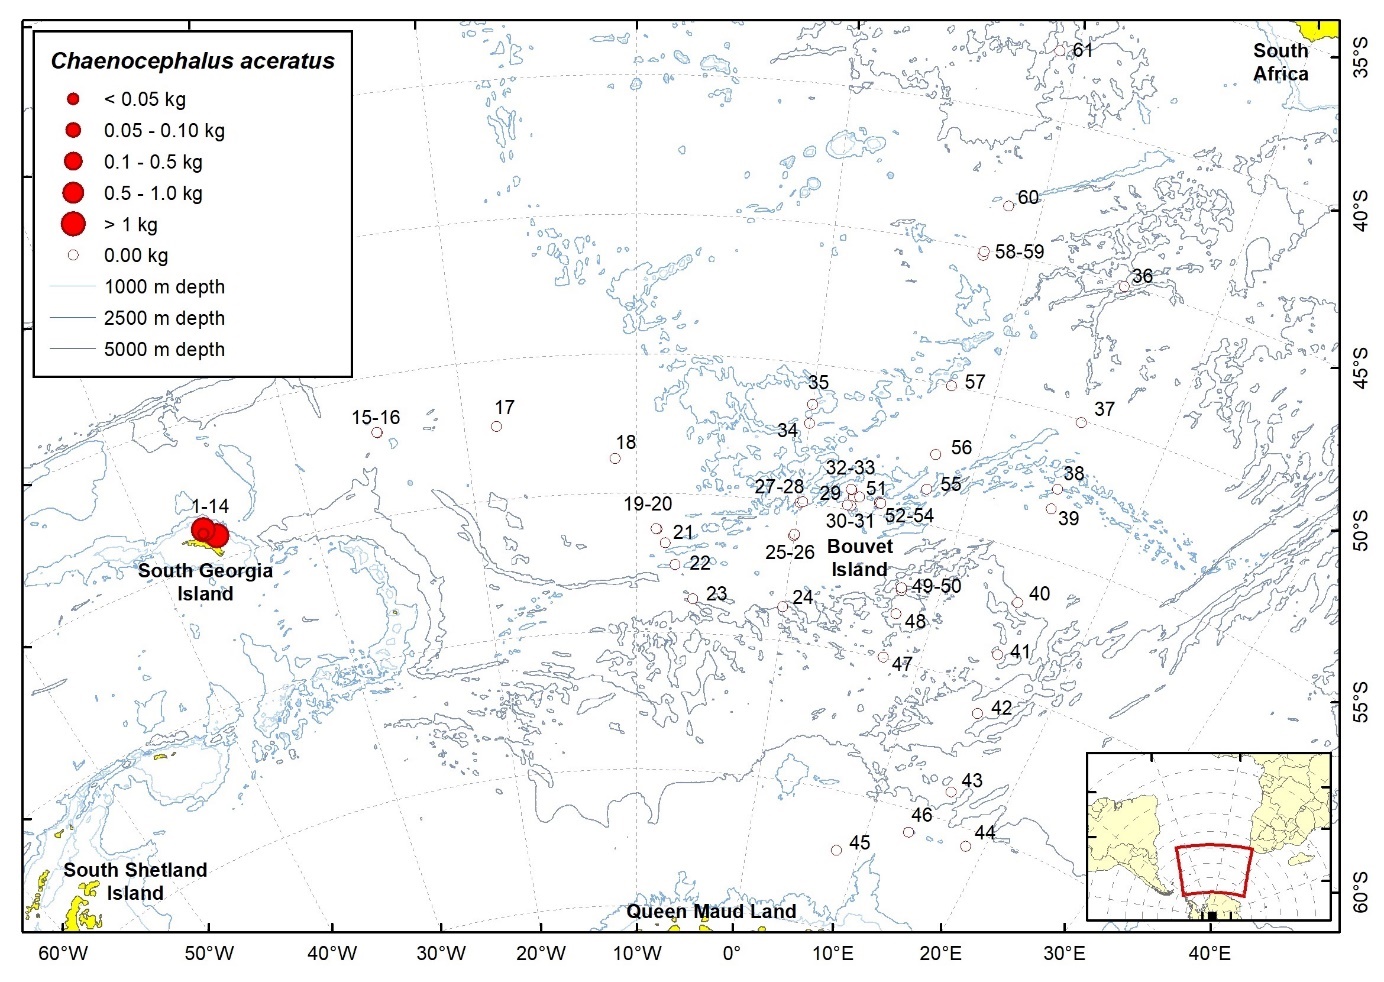
| Station | Date | Latitude | Longitude | Ind. caught | W (g) | TW fish (kg) | TW catch (kg) | ||
| 8 | 21.01.2008 | 53,92 | S | 36,62 | W | 1 | 0,6 | 0,57 | 5,56 |
| 10 | 22.01.2008 | 53,79 | S | 36,52 | W | 45 | 1773,0 | 42,18 | 44,88 |
| 14 | 23.01.2008 | 54,14 | S | 35,88 | W | 26 | 7521,0 | 311,92 | 311,92 |
2.24.2 - Champsocephalus gunnari Lönnberg, 1905

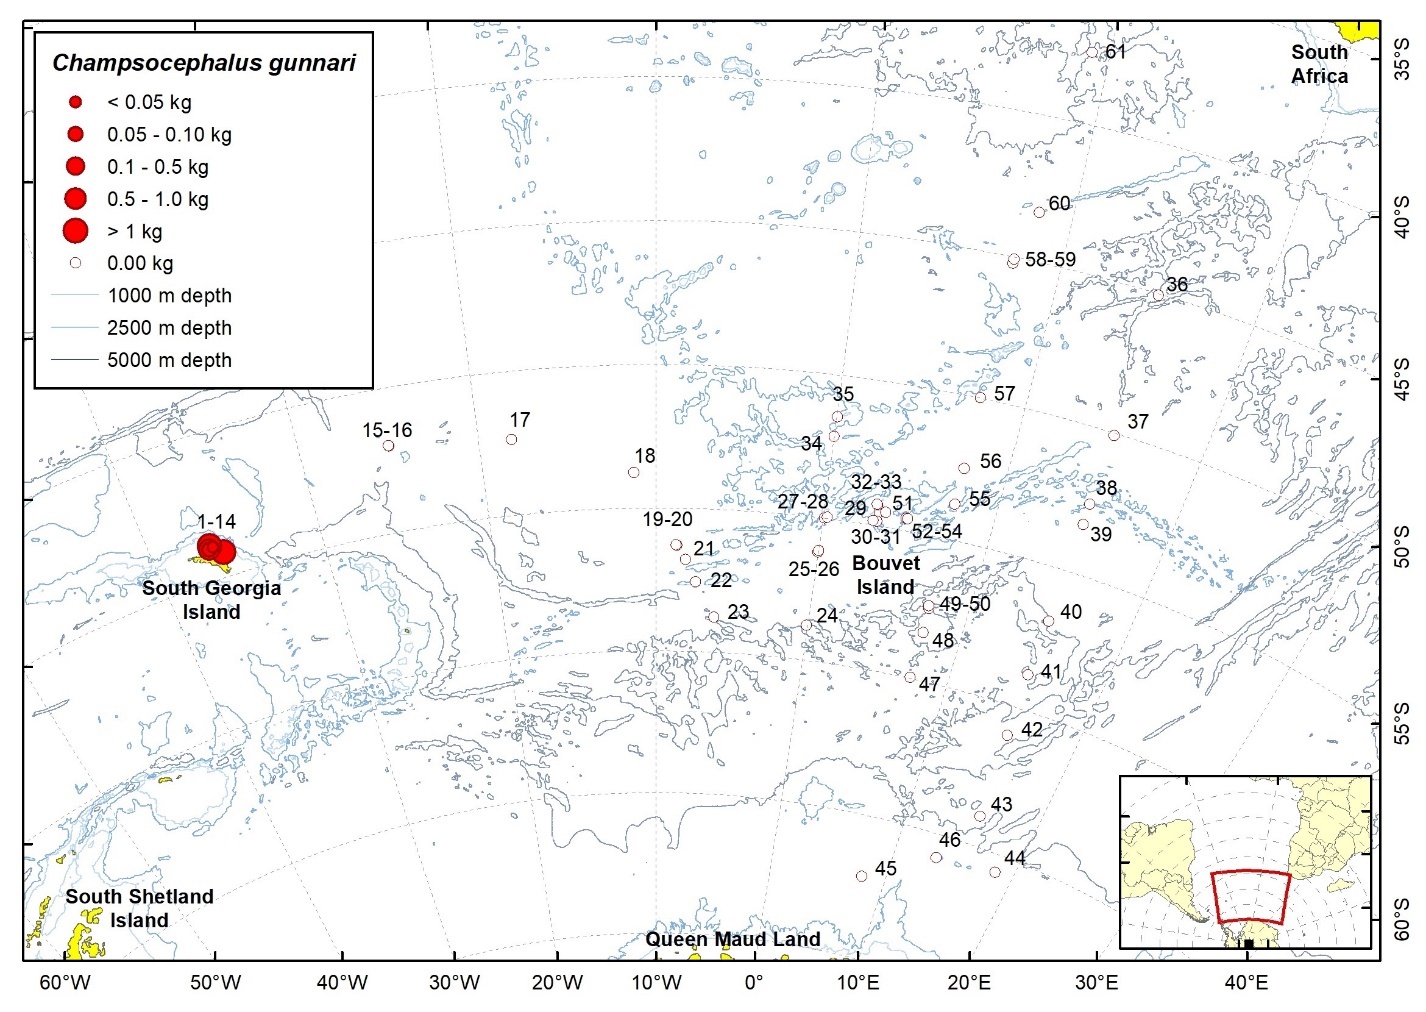
| Station | Date | Latitude | Longitude | Ind. caught | W (g) | TW fish (kg) | TW catch (kg) | ||
| 3 | 19.01.2008 | 53,88 | S | 36,37 | W | 12 | 3,2 | 0,01 | 0,15 |
| 8 | 21.01.2008 | 53,92 | S | 36,62 | W | 2409 | 535,9 | 0,57 | 5,56 |
| 9 | 21.01.2008 | 53,91 | S | 36,60 | W | 30 | 55,2 | 0,06 | 0,62 |
| 10 | 22.01.2008 | 53,79 | S | 36,52 | W | 118 | 14242,0 | 42,18 | 44,88 |
| 14 | 23.01.2008 | 54,14 | S | 35,88 | W | 2654 | 278496,0 | 311,92 | 311,92 |
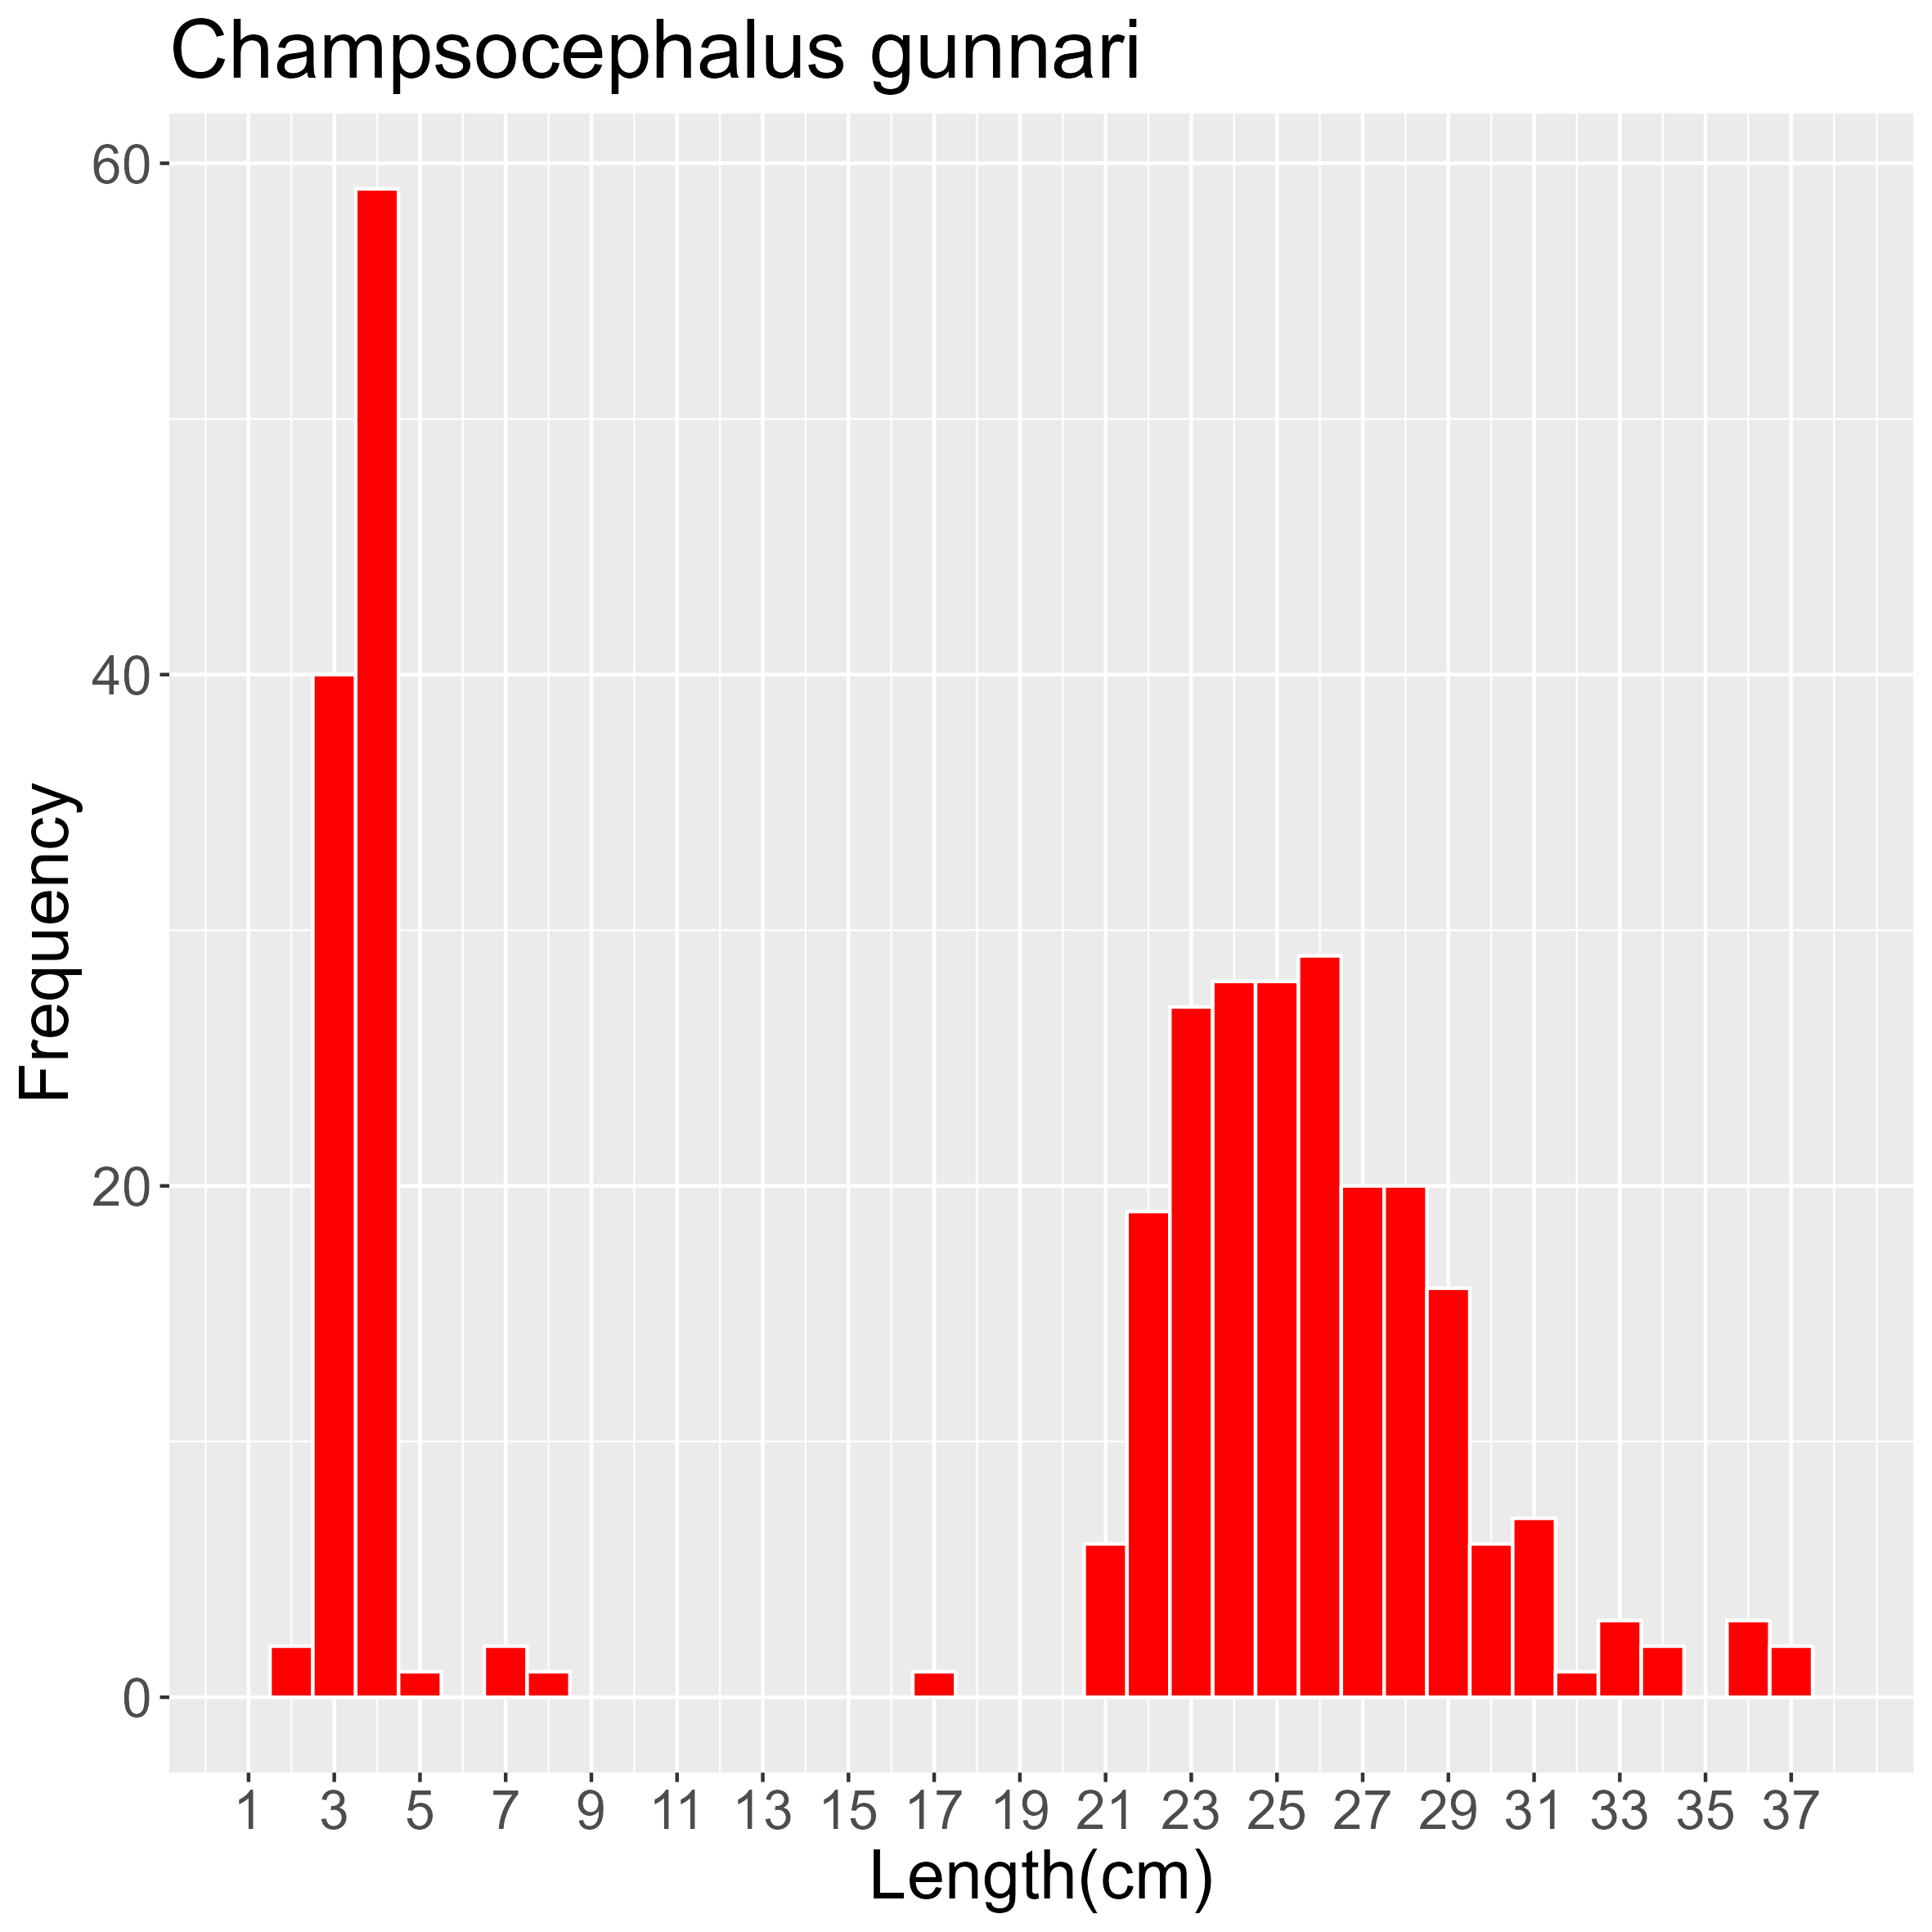
2.24.3 - Dacodraco hunteri Waite, 1916

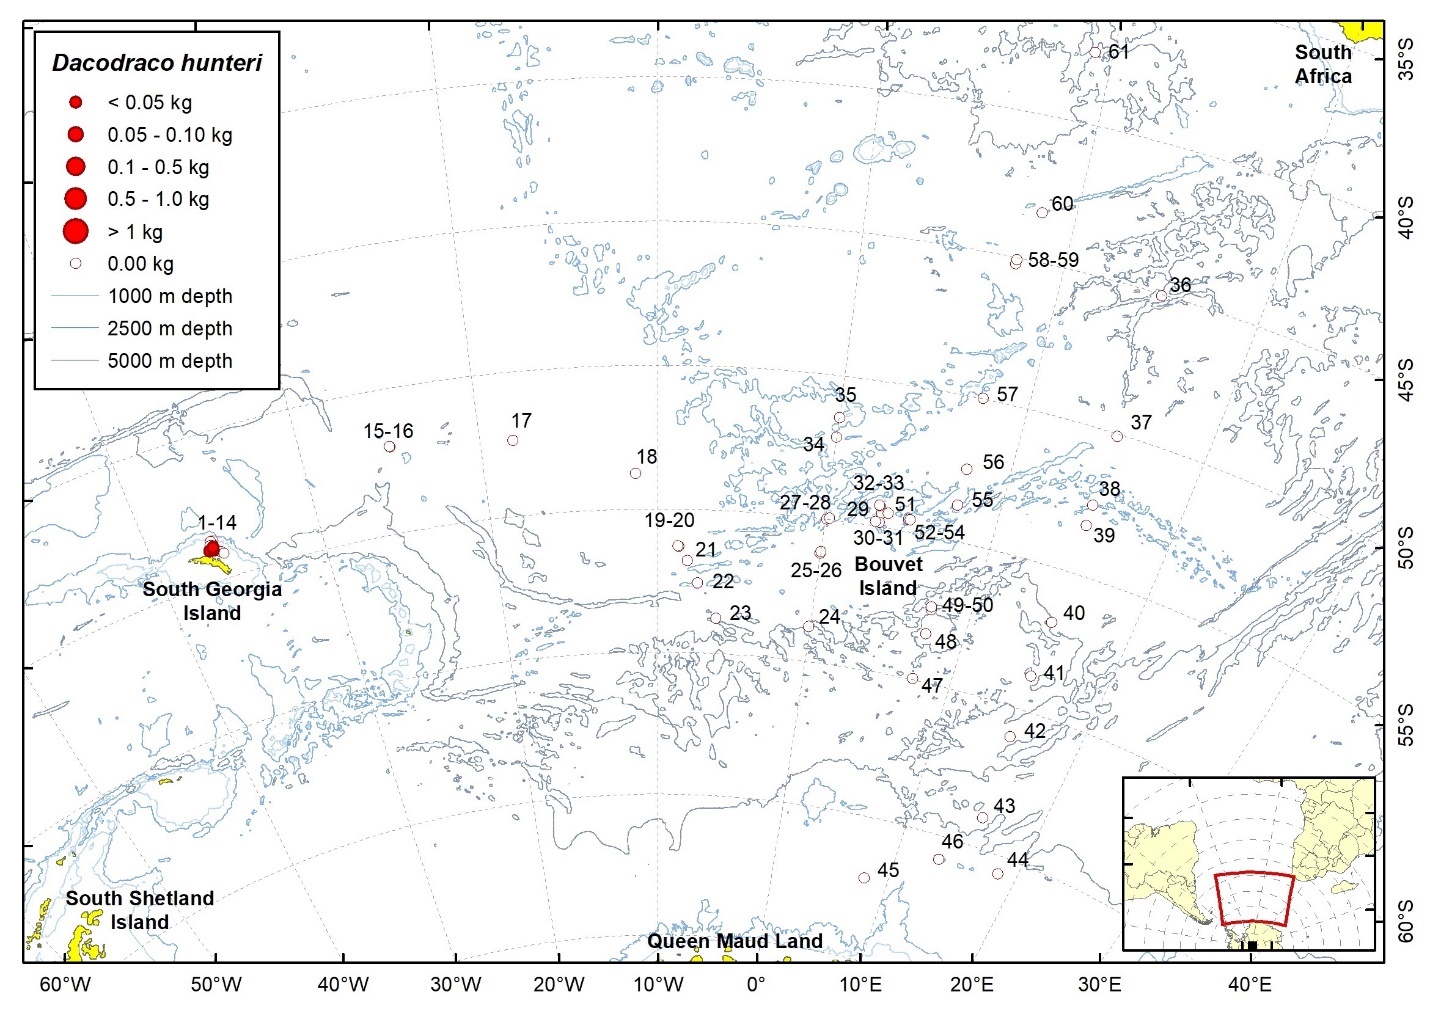
| Station | Date | Latitude | Longitude | Ind. caught | W (g) | TW fish (kg) | TW catch (kg) | ||
| 1 | 18.01.2008 | 53,94 | S | 36,40 | W | 2 | 2,0 | 0,00 | 2000,00 |
| 3 | 19.01.2008 | 53,85 | S | 36,38 | W | 1 | 0,1 | 0,01 | 0,15 |
| 8 | 21.01.2008 | 53,92 | S | 36,63 | W | 26 | 17,4 | 0,57 | 5,56 |
2.24.4 - Pseudochaenichthys georgianus Norman, 1937

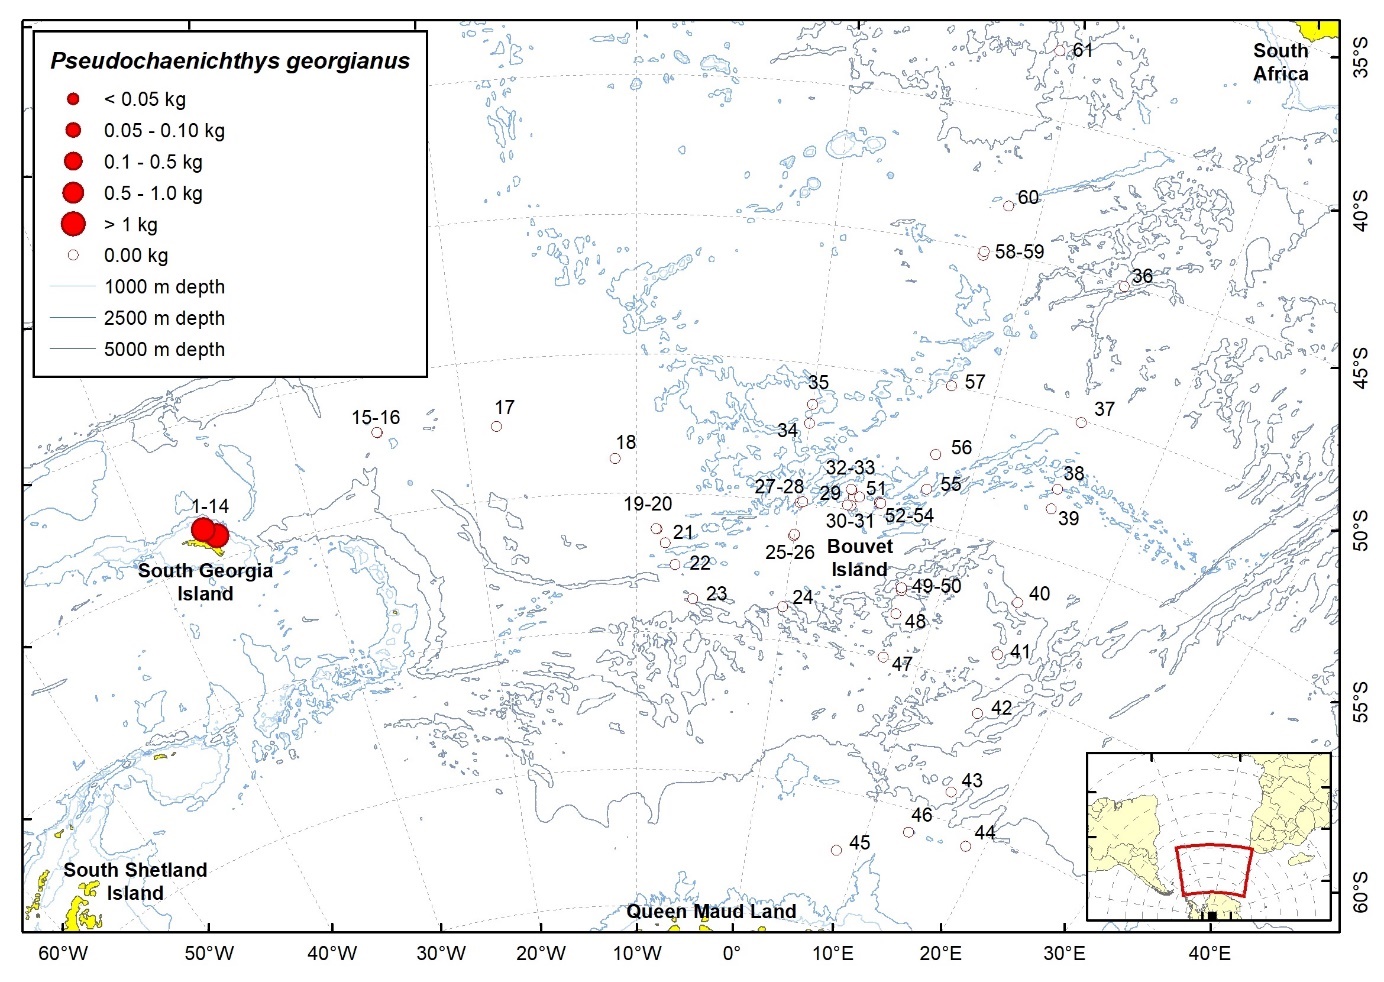
| Station | Date | Latitude | Longitude | Ind. caught | W (g) | TW fish (kg) | TW catch (kg) | ||
| 10 | 22.01.2008 | 53,79 | S | 36,52 | W | 54 | 15423,0 | 42,18 | 44,88 |
| 14 | 23.01.2008 | 54,14 | S | 35,88 | W | 22 | 22807,0 | 311,92 | 311,92 |
2.25 - Chiasmodontidae
2.25.1 - Chiasmodon niger Johnson, 1864

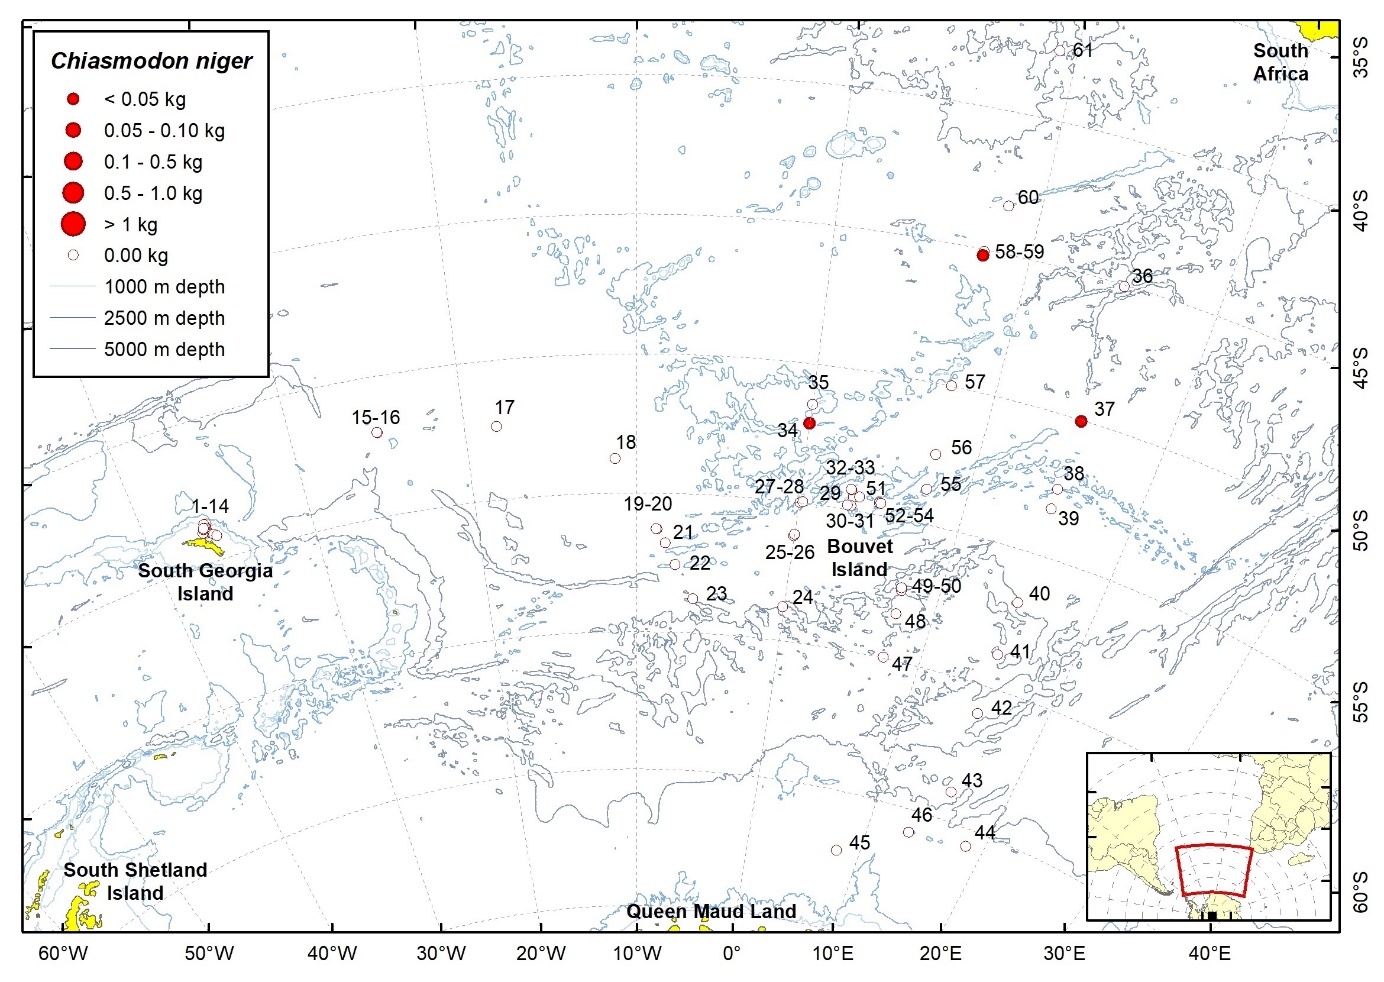
| Station | Date | Latitude | Longitude | Ind. caught | W (g) | TW fish (kg) | TW catch (kg) | ||
| 34 | 06.02.2008 | 52,12 | S | 0,02 | W | 2 | 37,1 | 4,15 | 44,70 |
| 37 | 24.02.2008 | 50,04 | S | 15,02 | E | 1 | 8,4 | 3,32 | 14,43 |
| 58 | 17.03.2008 | 45,20 | S | 7,65 | E | 2 | 44,0 | 10,17 | 19,92 |
3 - Acknowledgements
AKES was supported by the Royal Norwegian Ministry of Fisheries and Coastal affairs, the Institute of Marine Research (IMR), the University of Bergen, the Norwegian Antarctic Research Expeditions (NARE), the Norwegian Research Council, StatoilHydro, and the Norwegian Petroleum Directorate. We thank all the crew on RV GO Sars, the scientists and technical staff participating in the survey and its preparations during 2007- 2008. As part of the preparations for the Large Scale synoptic survey - 2019 in the Southern Ocean area 48, the work requirements for the final preparations and completion of this atlas to be used as a reference tool for future taxonomic work, was funded through the project Antarktis (IMR p.no. 15208).
4 - References
Fricke R, Eschmeyer WN, van der Laan R (eds). 2020. Eschmeyer’s Catalog of Fishes: Genera, Species, References. (http://researcharchive.calacademy.org/research/ichthyology/ catalog/fishcatmain.asp). Electronic version accessed 21 apr 2020.
Froese R, Pauly D (eds). 2019. FishBase. World Wide Web electronic publication. www.fishbase.org, version (12/2019), accessed 21 apr 2020.
Gon O, Heemstra PC (eds). 1990. Fishes of the Southern Ocean. J.L.B. Smith Institute of Ichthyology, Grahamstown, 462 pp.
Iversen, S.A., Melle, W., Bagøien, E., Chu, D., Edvardsen, B., Ellertsen, B., Grønningsæter, E., Jørstad, K., Karslbakk, E., Klevjer, T., Knutsen, T., Korneliussen, R., Kowall, H., Krafft, B., Kaartvedt, S., Lona, P.B., Murray, S., Naustvoll, L., Nøttestad, L., Ostrowski, M., Siegel, V., Skagseth, Ø., Skaret, G., Søiland, H. (2008). The Antarctic Krill and Ecosystem Survey with R/V “G.O. Sars” in 2008. CCAMLR WG-EMM-08/28, pp. 1-21.
Krafft BA, Melle W, Knutsen T, Bagøien E, Broms C, Ellertsen B, Siegel V. 2010. Distribution and demography of Antarctic krill in the Southeast Atlantic sector of the Southern Ocean during the austral summer 2008. Polar Biology 33:957-968.
van der Laan R, Fricke R, Eschmeyer WN (eds). 2020. Eschmeyer’s Catalog of Fishes: Classification. (http://www.calacademy.org/scientists/catalog-of-fishes-classification). Electronic version accessed 21 apr 2020.
Mjanger H, Hestenes K, Svendsen BV, de Lange Wenneck T. 2007. Håndbok for prøvetaking av fisk og krepsdyr. Versjon 3.16. Havforskningsinstituttets kvalitetssystem, 185 pp, (in Norwegian).
