Stock Name: Northeast Arctic haddock (ICES areas 1 and 2)
Advice on fishing opportunities
The Joint Russian-Norwegian working group on Arctic Fisheries (JRN-AFWG) advises that when the Joint Norwegian–Russian Fisheries Commission management plan is applied, catches in 2023 should be no more than 170 067 tonnes.
Stock development over time
Fishing pressure on the stock is between Fpa and Flim and above F msy , and the spawning stock biomass is above Bpa and Blim.
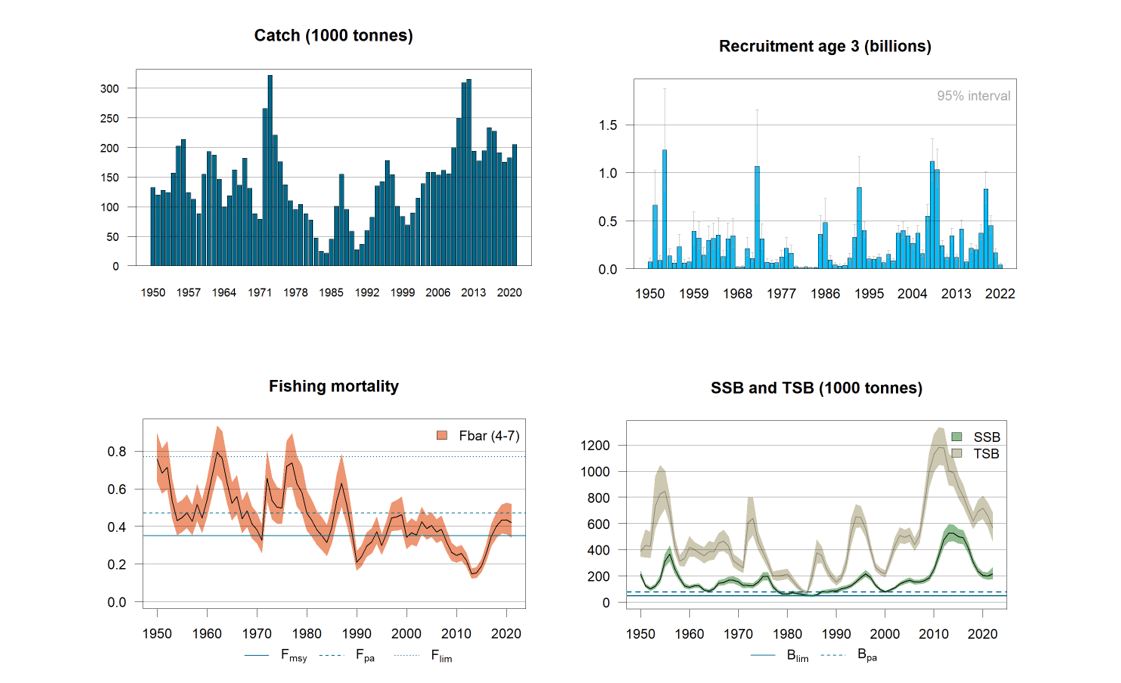
The stock is declining and is expected to continue to decline. This decline is expected to continue at least until the 2021 year-class enters the fishery.
Catch scenarios
| Variable | Value | Notes |
|---|---|---|
| F ages 4–7 (2022) | 0.303 | TAC constraint |
| SSB (2023) | 231 868 | |
| Rage 3 (2022) | 38 431 | SAM estimates |
| Rage 3 (2023) | 89 327 | RCT3 estimates |
| Rage 3 (2024) | 303 267 | RCT3 estimates |
| Total catch (2022) | 178 532 | TAC set by 51 st JRNFC |
| Basis | Total catch (2023) | F ages 4-7 (2023) | SSB (2024) | % SSB change* | % TAC change** | % Advice change*** |
|---|---|---|---|---|---|---|
| Advice basis | ||||||
| Management plan | 170 067 | 0.35 | 205 549 | -11 | -5 | -5 |
| Other scenarios | ||||||
| MSY approach: FMSY | 170 067 | 0.35 | 205 549 | -11 | -5 | -5 |
| F = 0 | 0 | 0.00 | 321 974 | 39 | -100 | -100 |
| F 2023 = F2022 | 151 269 | 0.30 | 218 188 | -6 | -15 | -15 |
| F = Fpa | 213 495 | 0.47 | 176 638 | -24 | 20 | 20 |
| F = Flim | 298 284 | 0.77 | 121 687 | -48 | 67 | 67 |
* SSB 2024 relative to SSB 2023
** Catch in 2023 relative to TAC in 2022 (178 532 t).
*** Advice value for 2023 relative to advice value for 2022
The advice for 2023 is 5 % lower than the advice and TAC for 2022 due to a declining stock trend.
Basis of the advice
| Advice basis | Joint Norwegian-Russian Fisheries Commission management plan |
|---|---|
| Management plan | The current harvest control rule (HCR) for haddock is as follows (see details in Protocol of the 46th Session of the Joint Norwegian–Russian Fisheries Commission [JNRFC, 2016]):
|
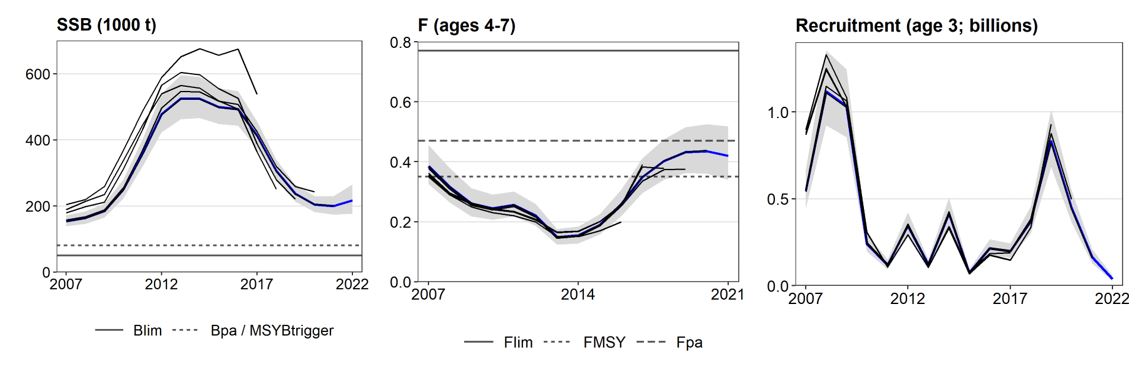
Quality of the assessment
Issues relevant for the advice
Due to the temporary suspension of Russian scientists from ICES this assessment was conducted by a Joint Russian-Norwegian working group on Arctic Fisheries (JRN-AFWG) consisting of scientists from VNIRO (Russia), and IMR (Norway) (Howell et al. 2022).
This advice has been conducted outside ICES and should not be considered as ICES advice. However, this assessment and advice has been produced following the methodology agreed at the ICES benchmark in 2020 (ICES, 2020).
Fbar(4-7) has been above FMSY from 2018 and onwards. The assessments from 2017 to 2019 on which the TAC advice for 2018-2020 were based, had large positive retrospective biases for TSB and SSB, implying that the stock sizes were overestimated. The retrospective bias was reduced after the revision at the 2020 benchmark.
The catch in 2021 was 12% lower than the TAC.
Reference points
| Framework | Reference point | Value | Technical basis | Source |
|---|---|---|---|---|
| MSY approach | MSY Btrigger | 80 000 tonnes | Bpa | ICES (2020) |
| FMSY | 0.35 | Stochastic long-term simulations | ICES (2020) | |
| Precautionary approach | Blim | 50 000 tonnes | Bloss | ICES (2020) |
| Bpa | 80 000 tonnes | Blim × exp (1.645 × σ ), where σ = 0.3 | ICES (2020) | |
| Flim | 0.77 | Determined from replacement line leading from SSB = 0 to the geometric mean recruitment at SSB = Blim | ICES (2020) | |
| Fpa | 0.47 | Flim × exp (−1.645 × σ ), where σ = 0.3 | ICES (2020) | |
| Management plan | SSBMGT | 80 000 tonnes | Bpa | ICES (2020) |
| FMGT | 0.35 | FMSY | ICES (2020) |
Basis of the assessment
| ICES stock data category | 1 |
|---|---|
| Assessment type | Age-based analytical assessment (SAM) that uses catches in the model. |
| Input data | Commercial landings (international landings, ages, and length frequencies from catch sampling); four survey indices (RU-BTr-Q4 (Btr), BS-NoRU-Q1(Aco), BS-NoRu-Q1 (BTr), and Eco-NoRu-Q3 (Btr)); annual maturity and stock weight-at-age data from surveys; from 1984, the natural mortalities are derived from the consumption of haddock (ages 3–6) by cod. |
| Discards and bycatch | Discarding is considered negligible in recent years. |
| Indicators | None. |
| Other information | Last benchmarked in February 2020 (ICES, 2020). |
| Working group | Joint Russian-Norwegian working group on Arctic Fisheries (JRN-AFWG) |
History of the advice, catch, and management
| Year | ICES advice | Catch corresponding to advice | Agreed TAC | Official catches | Unreported landings (included in ICES catches) | ICES catches |
|---|---|---|---|---|---|---|
| 1987 | No increase in F; TAC | 160000 | 250000 | 154916 | 154916 | |
| 1988 | No increase in F | < 240000 | 240000 | 95255 | 95255 | |
| 1989 | Large reduction in F | 69000 | 83000 | 58518 | 58518 | |
| 1990 | No directed fishery | - | 25000 | 27182 | 27182 | |
| 1991 | No directed fishery | - | 28000 | 36216 | 36216 | |
| 1992 | Within safe biological limits | 35000 | 63000 | 59922 | 59922 | |
| 1993 | No long-term gains in increasing F | 56000 | 72000 | 82379 | 82379 | |
| 1994 | No long-term gains in F > Fmed | 97000** | 120000 | 135186 | 135186 | |
| 1995 | No long-term gains in F > Fmed | 122000** | 130000 | 142448 | 142448 | |
| 1996 | No long-term gains in F > Fmed | 169000** | 170000 | 178128 | 178128 | |
| 1997 | Well below Fmed | < 242000 | 210000 | 154359 | 154359 | |
| 1998 | Below Fmed | < 120000 | 130000 | 100630 | 100630 | |
| 1999 | Reduce F below Fpa | < 74000 | 78000 | 83195 | 83195 | |
| 2000 | Reduce F below Fpa | < 37000 | 62000 | 68944 | 68944 | |
| 2001 | Reduce F below Fpa | < 66000 | 85000 | 89640 | 89640 | |
| 2002 | Reduce F below Fpa | < 64000 | 85000 | 96062 | 18736 | 114798 |
| 2003 | Reduce F below Fpa | < 101000 | 101000 | 105700 | 33226 | 138926 |
| 2004 | Reduce F below Fpa | < 120000 | 130000 | 124502 | 33777 | 158279 |
| 2005 | Reduce F below Fpa | < 106000 | 117000 | 118015 | 40283 | 158298 |
| 2006 | Reduce F below Fpa | < 112000 | 120000 | 131706 | 21451 | 153157 |
| 2007 | Limit catches | < 130000 | 150000 | 146972 | 14553 | 161525 |
| 2008 | Limit catches to 2001–2004 average | < 130000 | 155000 | 149776 | 5828 | 155604 |
| 2009 | Apply management plan | < 194000 | 194000 | 200061 | 0 | 200061 |
| 2010 | Apply management plan | < 243000 | 243000 | 249200 | 0 | 249200 |
| 2011 | Apply management plan | < 303000 | 303000 | 309785 | 0 | 309785 |
| 2012 | Apply management plan | < 318000 | 318000 | 315627 | 0 | 315627 |
| 2013 | Apply management plan | < 238000 | 200000 | 193744 | 0 | 193744 |
| 2014 | Apply management plan | < 150000 | 178500 | 177522 | 0 | 177522 |
| 2015 | Apply management plan | < 165000 | 223000 | 194756 | 0 | 194756 |
| 2016 | Apply management plan | < 244000^ | 244000 | 233416 | 0 | 233416 |
| 2017 | Apply management plan | ≤ 233000 | 233000 | 227588 | 0 | 227588 |
| 2018 | Apply management plan | ≤ 202305 | 202305 | 191276 | 0 | 191276 |
| 2019 | Apply management plan | ≤ 152000 | 172000 | 175402 | 0 | 175402 |
| 2020 | Apply management plan | ≤ 215000 | 215000 | 182468 | 0 | 182468 |
| 2021 | Apply management plan | ≤ 232537 | 232537 | 204743 | 0 | 204743 ^^ |
| 2022 | Apply management plan | ≤ 178532 | 178532 | |||
| 2023 | Apply management plan | ≤ 170067 ^^ |
* Coastal haddock in Norwegian statistical areas 06 and 07 (south of Lofoten) are included.
** Predicted landings at Fmed .
^ This advice was updated on 7 July 2015 in response to a special request (ICES, 2015) after a mid-year change in TAC in 2015 (from 178500 tonnes to 223000 tonnes) .
^^ In 2022 assessment and advice was carried out by the Joint Russian-Norwegian working group on Arctic Fisheries (JRN-AFWG) which compiled catches for 2021 and gave advice for 2023.
History of catch and landings
| Year | Faroe Islands | France | Fed. Rep. Germany. | Greenland | Norway^ | Russia** | Spain | United Kingdom | Others | Unreported catches*** | Total |
|---|---|---|---|---|---|---|---|---|---|---|---|
| 1960 | 172 | - | 5597 | 46263 | 57025 | 45469 | 125 | - | 154651 | ||
| 1961 | 285 | 220 | 6304 | 60862 | 85345 | 39650 | 558 | - | 193224 | ||
| 1962 | 83 | 409 | 2895 | 54567 | 91910 | 37486 | 58 | - | 187408 | ||
| 1963 | 17 | 363 | 2554 | 59955 | 63526 | 19809 | - | - | 146224 | ||
| 1964 | - | 208 | 1482 | 38695 | 43870 | 14653 | 250 | - | 99158 | ||
| 1965 | - | 226 | 1568 | 60447 | 41750 | 14345 | 242 | - | 118578 | ||
| 1966 | - | 1072 | 2098 | 82090 | 48710 | 27723 | 85 | - | 161778 | ||
| 1967 | - | 1208 | 1705 | 51954 | 57346 | 24158 | 26 | - | 136397 | ||
| 1968 | - | - | 1867 | 64076 | 75654 | 40129 | 0 | - | 181726 | ||
| 1969 | 2 | - | 1490 | 67549 | 24211 | 37234 | 334 | - | 130820 | ||
| 1970 | 541 | - | 2119 | 37716 | 26802 | 20423 | 656 | - | 88257 | ||
| 1971 | 81 | - | 896 | 45715 | 15778 | 16373 | 62 | - | 78905 | ||
| 1972 | 137 | - | 1433 | 46700 | 196224 | 17166 | 4493 | - | 266153 | ||
| 1973 | 1212 | 3214 | 9534 | 86767 | 186534 | 32408 | 2557 | - | 322226 | ||
| 1974 | 925 | 3601 | 23409 | 66164 | 78548 | 37663 | 10847 | - | 221157 | ||
| 1975 | 299 | 5191 | 15930 | 55966 | 65015 | 28677 | 4680 | - | 175758 | ||
| 1976 | 536 | 4459 | 16660 | 49492 | 42485 | 16940 | 6692 | - | 137264 | ||
| 1977 | 213 | 1510 | 4798 | 40118 | 52210 | 10878 | 431 | - | 110158 | ||
| 1978 | 466 | 1411 | 1521 | 39955 | 45895 | 5766 | 408 | - | 95422 | ||
| 1979 | 343 | 1198 | 1948 | 66849 | 26365 | 6454 | 466 | - | 103623 | ||
| 1980 | 497 | 226 | 1365 | 66501 | 20706 | 2948 | 261 | - | 92504 | ||
| 1981 | 381 | 414 | 2402 | 63435 | 13400 | 1682 | 22 | - | 81736 | ||
| 1982 | 496 | 53 | 1258 | 43702 | 2900 | - | 827 | 0 | - | 49236 | |
| 1983 | 428 | - | 729 | 22364 | 680 | 139 | 259 | 1 | - | 24600 | |
| 1984 | 297 | 15 | 400 | 18813 | 1103 | 37 | 276 | 4 | - | 20945 | |
| 1985 | 424 | 21 | 395 | 21272 | 22690 | 77 | 153 | 20 | - | 45052 | |
| 1986 | 893 | 12 | 1079 | 52313 | 45738 | 22 | 431 | 75 | - | 100563 | |
| 1987 | 464 | 7 | 3105 | 72419 | 78211 | 59 | 563 | 88 | - | 154916 | |
| 1988 | 1113 | 116 | 1323 | 60823 | 31293 | 72 | 435 | 80 | - | 95255 | |
| 1989 | 1217 | - | 171 | 36451 | 20062 | 1 | 590 | 26 | - | 58518 | |
| 1990 | 705 | - | 167 | 20621 | 5190 | - | 494 | 5 | - | 27182 | |
| 1991 | 1117 | - | 213 | 22178 | 12177 | - | 514 | 17 | - | 36216 | |
| 1992 | 1093 | 151 | 387 | 1719 | 36238 | 19699 | 38 | 596 | 1 | - | 59922 |
| 1993 | 546 | 1215 | 1165 | 880 | 40978 | 35071 | 76 | 1802 | 646 | - | 82379 |
| 1994 | 2761 | 678 | 2412 | 770 | 71171 | 51822 | 22 | 4673 | 877 | - | 135186 |
| 1995 | 2833 | 598 | 2675 | 1097 | 76886 | 54516 | 14 | 3111 | 718 | - | 142448 |
| 1996 | 3743 | 6 | 942 | 1510 | 94527 | 74239 | 669 | 2275 | 217 | - | 178128 |
| 1997 | 3327 | 540 | 972 | 1877 | 103407 | 41228 | 364 | 2340 | 304 | - | 154359 |
| 1998 | 1903 | 241 | 385 | 854 | 75108 | 20559 | 257 | 1229 | 94 | - | 100630 |
| 1999 | 1913 | 64 | 641 | 437 | 48182 | 30520 | 652 | 694 | 92 | - | 83195 |
| 2000 | 631 | 178 | 880 | 432 | 42009 | 22738 | 502 | 747 | 827 | - | 68944 |
| 2001 | 1210 | 324 | 554 | 553 | 49067 | 34307 | 1497 | 1068 | 1060 | - | 89640 |
| 2002 | 1564 | 297 | 627 | 858 | 52247 | 37157 | 1505 | 1125 | 682 | 18736 | 114798 |
| 2003 | 1959 | 382 | 918 | 1363 | 56485 | 41142 | 1330 | 1018 | 1103 | 33226 | 138926 |
| 2004 | 2484 | 103 | 823 | 1680 | 62192 | 54347 | 54 | 1250 | 1569 | 33777 | 158279 |
| 2005 | 2138 | 333 | 996 | 15 | 60850 | 50012 | 963 | 1899 | 1262 | 40283 | 158751 |
| 2006 | 2390 | 883 | 989 | 1830 | 69272 | 53313 | 703 | 1164 | 1162 | 21451 | 153157 |
| 2007 | 2307 | 277 | 1123 | 1464 | 71244 | 66569 | 125 | 1351 | 2511 | 14553 | 161525 |
| 2008 | 2687 | 311 | 535 | 1659 | 72779 | 68792 | 283 | 971 | 1759 | 5828 | 155604 |
| 2009 | 2820 | 529 | 1957 | 1410 | 104354 | 85514 | 317 | 1315 | 1845 | 0 | 200061 |
| 2010 | 3173 | 764 | 3539 | 1970 | 123384 | 111372 | 379 | 1758 | 2862 | 0 | 249200 |
| 2011 | 1759 | 268 | 1724 | 2110 | 158202 | 139912 | 502 | 1379 | 3929 | 0 | 309785 |
| 2012 | 2055 | 322 | 1111 | 3984 | 159602 | 143886 | 441 | 833 | 3393 | 0 | 315627 |
| 2013 | 1886 | 342 | 500 | 1795 | 99215 | 85668 | 439 | 639 | 3260 | 0 | 193744 |
| 2014 | 1470 | 198 | 340 | 1150 | 91306 | 78725 | 187 | 355 | 3791 | 0 | 177522 |
| 2015 | 2459 | 145 | 124 | 1047 | 95094 | 91864 | 246 | 450 | 3327 | 0 | 194756 |
| 2016 | 2460 | 340 | 170 | 1401 | 108718 | 115710 | 200 | 575 | 3838 | 0 | 233416 |
| 2017 | 2776 | 108 | 170 | 1810 | 113132 | 106714 | 228 | 372 | 2279 | 0 | 227588 |
| 2018 | 2333 | 183 | 385 | 1317 | 93839 | 90486 | 169 | 453 | 2173 | 0 | 191276 |
| 2019 | 1515 | 143 | 204 | 1208 | 93860 | 76125 | 280 | 456 | 1611 | 0 | 175402 |
| 2020 | 1392 | 96 | 282 | 910 | 88108 | 89030 | 45 | 320 | 2286 | 0 | 182468 |
| 2021*^^ | 1722 | 105 | 365 | 1101 | 100673 | 98296 | 131 | 78 | 2272 | 0 | 204743 |
* Provisional figures.
** USSR prior to 1991.
*** Figures based on Norwegian/Russian illegal, unreported, and unregulated fisheries (IUU) estimates.
^ Landings of coastal haddock in Norwegian statistical areas 06 and 07 (south of Lofoten) are included from 1983.
^^In 2022 assessment and advice was carried out by the Joint Russian-Norwegian working group on Arctic Fisheries (JRN-AFWG) which compiled catches for 2021 and gave advice for 2023.
Summary of the assessment
| Year | Recruitment (thousands) | SSB (tonnes) | Total catch (tonnes) | F | ||||||
|---|---|---|---|---|---|---|---|---|---|---|
| Age 3 | High | Low | SSB | High | Low | Ages 4–7 | High | Low | ||
| 1950 | 71954 | 46160 | 112161 | 214279 | 192049 | 239082 | 132125 | 0.757 | 0.64 | 0.895 |
| 1951 | 662668 | 429436 | 1022572 | 126110 | 112047 | 141939 | 120077 | 0.683 | 0.576 | 0.811 |
| 1952 | 87684 | 56210 | 136781 | 101799 | 88941 | 116517 | 127660 | 0.713 | 0.597 | 0.852 |
| 1953 | 1236112 | 814474 | 1876024 | 120561 | 104157 | 139550 | 123920 | 0.536 | 0.443 | 0.648 |
| 1954 | 132692 | 85171 | 206726 | 174538 | 148014 | 205816 | 156788 | 0.43 | 0.354 | 0.522 |
| 1955 | 58481 | 37134 | 92100 | 313360 | 267430 | 367179 | 202286 | 0.447 | 0.371 | 0.539 |
| 1956 | 229412 | 146973 | 358093 | 367219 | 312961 | 430885 | 213924 | 0.472 | 0.392 | 0.569 |
| 1957 | 60191 | 38357 | 94452 | 253094 | 217114 | 295035 | 123583 | 0.426 | 0.355 | 0.512 |
| 1958 | 72727 | 46696 | 113271 | 181736 | 157983 | 209059 | 112672 | 0.517 | 0.43 | 0.622 |
| 1959 | 388917 | 256300 | 590152 | 125293 | 108818 | 144263 | 88211 | 0.444 | 0.366 | 0.538 |
| 1960 | 319617 | 209398 | 487852 | 112867 | 99564 | 127948 | 154651 | 0.54 | 0.45 | 0.646 |
| 1961 | 144191 | 94743 | 219445 | 124747 | 111163 | 139991 | 193224 | 0.663 | 0.561 | 0.785 |
| 1962 | 294721 | 194343 | 446943 | 125047 | 111195 | 140626 | 187408 | 0.793 | 0.674 | 0.934 |
| 1963 | 313728 | 208414 | 472257 | 94205 | 82955 | 106980 | 146224 | 0.761 | 0.638 | 0.907 |
| 1964 | 352219 | 232640 | 533263 | 84357 | 74141 | 95980 | 99158 | 0.632 | 0.525 | 0.762 |
| 1965 | 126309 | 82135 | 194241 | 103060 | 89956 | 118073 | 118578 | 0.524 | 0.433 | 0.633 |
| 1966 | 313027 | 205139 | 477656 | 145581 | 126799 | 167144 | 161778 | 0.559 | 0.465 | 0.671 |
| 1967 | 341917 | 223471 | 523142 | 151115 | 130284 | 175276 | 136397 | 0.441 | 0.364 | 0.534 |
| 1968 | 18033 | 11181 | 29084 | 168049 | 145535 | 194044 | 181726 | 0.483 | 0.398 | 0.585 |
| 1969 | 20492 | 12780 | 32859 | 167756 | 144118 | 195271 | 130820 | 0.412 | 0.336 | 0.504 |
| 1970 | 209907 | 135812 | 324426 | 155327 | 131740 | 183137 | 88257 | 0.383 | 0.31 | 0.473 |
| 1971 | 108513 | 69785 | 168732 | 127578 | 107522 | 151376 | 78905 | 0.326 | 0.261 | 0.407 |
| 1972 | 1066297 | 686314 | 1656659 | 128558 | 111671 | 147997 | 266153 | 0.655 | 0.536 | 0.8 |
| 1973 | 309863 | 204061 | 470519 | 125538 | 107980 | 145951 | 322226 | 0.537 | 0.439 | 0.657 |
| 1974 | 65777 | 42815 | 101054 | 153803 | 134044 | 176476 | 221157 | 0.502 | 0.414 | 0.609 |
| 1975 | 59215 | 38571 | 90908 | 195116 | 167179 | 227722 | 175758 | 0.497 | 0.415 | 0.595 |
| 1976 | 61657 | 39505 | 96230 | 196497 | 168938 | 228551 | 137264 | 0.72 | 0.606 | 0.854 |
| 1977 | 120878 | 76578 | 190806 | 118927 | 100298 | 141017 | 110158 | 0.738 | 0.609 | 0.894 |
| 1978 | 214299 | 141229 | 325173 | 81230 | 67275 | 98081 | 95422 | 0.625 | 0.507 | 0.769 |
| 1979 | 161196 | 105893 | 245381 | 62550 | 52626 | 74344 | 103623 | 0.582 | 0.468 | 0.722 |
| 1980 | 22214 | 13770 | 35836 | 62876 | 53385 | 74055 | 87889 | 0.472 | 0.378 | 0.588 |
| 1981 | 10373 | 6182 | 17404 | 72926 | 61649 | 86267 | 77153 | 0.433 | 0.347 | 0.54 |
| 1982 | 16685 | 10270 | 27106 | 68721 | 56827 | 83105 | 46955 | 0.38 | 0.302 | 0.478 |
| 1983 | 8517 | 5013 | 14472 | 58413 | 47945 | 71166 | 24600 | 0.35 | 0.274 | 0.448 |
| 1984 | 13170 | 8117 | 21369 | 53238 | 43378 | 65339 | 20945 | 0.315 | 0.244 | 0.406 |
| 1985 | 360421 | 236188 | 550001 | 49175 | 40893 | 59134 | 45052 | 0.395 | 0.31 | 0.504 |
| 1986 | 480423 | 315598 | 731331 | 54932 | 46581 | 64781 | 100563 | 0.535 | 0.425 | 0.673 |
| 1987 | 90168 | 58164 | 139782 | 77886 | 66612 | 91068 | 154916 | 0.63 | 0.506 | 0.784 |
| 1988 | 39086 | 24572 | 62172 | 79981 | 67314 | 95032 | 95255 | 0.51 | 0.408 | 0.637 |
| 1989 | 28690 | 17838 | 46145 | 84497 | 69604 | 102576 | 58518 | 0.373 | 0.296 | 0.47 |
| 1990 | 36995 | 23783 | 57547 | 85921 | 69888 | 105632 | 27182 | 0.211 | 0.165 | 0.269 |
| 1991 | 111064 | 78155 | 157832 | 100599 | 84419 | 119880 | 36216 | 0.239 | 0.191 | 0.3 |
| 1992 | 328345 | 233437 | 461840 | 111029 | 95914 | 128527 | 59922 | 0.295 | 0.238 | 0.365 |
| 1993 | 847060 | 614155 | 1168288 | 125586 | 110671 | 142511 | 82379 | 0.317 | 0.258 | 0.39 |
| 1994 | 398541 | 321655 | 493805 | 154808 | 138283 | 173307 | 135186 | 0.372 | 0.307 | 0.451 |
| 1995 | 101169 | 79053 | 129473 | 188058 | 167539 | 211090 | 142448 | 0.298 | 0.25 | 0.355 |
| 1996 | 100698 | 79043 | 128284 | 217720 | 194150 | 244150 | 178128 | 0.365 | 0.31 | 0.429 |
| 1997 | 120498 | 94753 | 153239 | 188657 | 168178 | 211630 | 154359 | 0.444 | 0.376 | 0.525 |
| 1998 | 63525 | 49193 | 82032 | 131664 | 116654 | 148606 | 100630 | 0.451 | 0.378 | 0.539 |
| 1999 | 151800 | 121599 | 189502 | 95277 | 84396 | 107561 | 83195 | 0.463 | 0.384 | 0.557 |
| 2000 | 83531 | 65493 | 106537 | 78591 | 69508 | 88860 | 68944 | 0.341 | 0.28 | 0.417 |
| 2001 | 369908 | 302935 | 451687 | 92000 | 82049 | 103159 | 89640 | 0.367 | 0.305 | 0.442 |
| 2002 | 397842 | 324975 | 487048 | 109706 | 97927 | 122903 | 114798 | 0.353 | 0.294 | 0.425 |
| 2003 | 342420 | 275510 | 425581 | 137919 | 123784 | 153669 | 138926 | 0.425 | 0.359 | 0.503 |
| 2004 | 262688 | 214934 | 321052 | 156548 | 140497 | 174432 | 158279 | 0.388 | 0.33 | 0.457 |
| 2005 | 369114 | 303533 | 448865 | 168006 | 150852 | 187110 | 158298 | 0.404 | 0.344 | 0.475 |
| 2006 | 158484 | 128452 | 195538 | 152111 | 136464 | 169553 | 153157 | 0.369 | 0.313 | 0.436 |
| 2007 | 546307 | 446462 | 668482 | 154138 | 138541 | 171491 | 161525 | 0.385 | 0.326 | 0.456 |
| 2008 | 1118238 | 923680 | 1353778 | 163581 | 145927 | 183371 | 155604 | 0.316 | 0.264 | 0.379 |
| 2009 | 1032328 | 855199 | 1246143 | 184743 | 164860 | 207025 | 200061 | 0.261 | 0.218 | 0.312 |
| 2010 | 242169 | 197117 | 297516 | 250124 | 222925 | 280640 | 249200 | 0.245 | 0.207 | 0.291 |
| 2011 | 118630 | 94061 | 149618 | 358639 | 319475 | 402603 | 309785 | 0.256 | 0.218 | 0.301 |
| 2012 | 343696 | 280562 | 421036 | 477985 | 422713 | 540483 | 315627 | 0.221 | 0.187 | 0.26 |
| 2013 | 120201 | 95747 | 150901 | 525035 | 462748 | 595705 | 193744 | 0.148 | 0.124 | 0.176 |
| 2014 | 415161 | 340548 | 506123 | 524516 | 465653 | 590819 | 177522 | 0.154 | 0.128 | 0.184 |
| 2015 | 73229 | 57412 | 93404 | 499511 | 448301 | 556572 | 194756 | 0.189 | 0.158 | 0.225 |
| 2016 | 214907 | 173580 | 266072 | 492548 | 442909 | 547750 | 233183 | 0.259 | 0.219 | 0.307 |
| 2017 | 197724 | 160085 | 244212 | 412857 | 373794 | 456002 | 227588 | 0.349 | 0.296 | 0.412 |
| 2018 | 370008 | 299579 | 456994 | 306676 | 276535 | 340103 | 191276 | 0.402 | 0.34 | 0.475 |
| 2019 | 831409 | 682866 | 1012264 | 237709 | 213456 | 264719 | 175402 | 0.432 | 0.362 | 0.515 |
| 2020 | 449467 | 366822 | 550732 | 204215 | 181387 | 229916 | 182468 | 0.435 | 0.36 | 0.525 |
| 2021 | 164246 | 128805 | 209438 | 199550 | 173606 | 229372 | 204743 | 0.42 | 0.34 | 0.518 |
| 2022 | 38431 | 25191 | 58630 | 216456 | 176604 | 265300 | ||||
References
ICES. 2015. Norway and Russia request to ICES for revised advice for Haddock in Subareas I and II . In Report of the ICES Advisory Committee, 2015. ICES Advice 2015, Book 3, Section 3.2.3.1. 9 pp. http://www.ices.dk/sites/pub/Publication%20Reports/Advice/2015/Special_Requests/Norway_Russia_had-arct_update.pdf .
ICES 2016. Report of the second Workshop on Management Plan Evaluation on Northeast Arctic cod and haddock and Barents Sea capelin (WKNEAMP-2) , 25-28 January 2016, Kirkenes, Norway. ICES CM 2016/ACOM:47, 76 pp.
JNRFC. 2016. Protocol of the 46th Session of the Joint Norwegian–Russian Fisheries Commission, 17–20 October 2016 (In Russian). 117 pp. Available at: http://www.jointfish.com/rus/content/download/502/6357/file/46-russisk.pdf .
ICES. 2020. Benchmark Workshop for Demersal Species (WKDEM). ICES Scientific Reports, 2:31. 136 pp. http://doi.org/10.17895/ices.pub.5548 .
ICES. 2021. Arctic Fisheries Working Group (AFWG). ICES Scientific Reports. 3:58. https://doi.org/10.17895/ices.pub.8196.