Lakselus er en av hovedutfordringene for oppdrett og ville laksefisk. Dette har medført at både oppdrettsnæringen og forvaltningen har igangsatt en rekke tiltak for å kontrollere lakselusbelastningen, inkludert «trafikklyssystemet» som regulerer produksjonskapasiteten. Lakselusinfeksjonspresset estimers i dag gjennom en tverdisiplinær innsats som inkluderer data fra tellinger på anlegg, lusespredningsmodellering, telling av lakselus på villfisk og telling av lus på fisk i fast plasserte overvåkingsbur. Alle disse observasjoner er imidlertid indirekte på den måten at de observerer antall luselarver på fisk og ikke det faktiske antall lakselus i sjøen. Direkte estimater forutsetter telling av lakseluslarver i vansøylen. Dessverre er direkte telling med tradisjonell metodikk så ressurskrevende at det ikke er gjennomførbart for overvåking. Vi har tidligere uttestet et antall alternative tellingsmetoder: kvantitativ PCR, eDNA analyse, kvantitativ fraktion-PCR og billedanalyse med FlowCam. De molekylærbiologiske metodene synes å være noe følsomme for variabilitet imellom prøver og krever derfor omfattende validering mens resultatene fra FlowCam var for upresise den lave forekomst av luselarver tatt i betraktning. Fluorescens mikroskopering ble foreslått som en mulig løsning 2017, men metodikken som opprinnelig ble presentert ga variable resultater som indikerte at ytterligere metodeutvikling var nødvendig. Fluoroliceprosjektet ble derfor igangsatt for å kartlegge lakselusens fluorescensprofil, og denne profilens avhengighet av parametere som alder, behandling. I prosjektet ble det undersøkt om lakselus-profilen overlapper med andre planktonorganismer og løsninger for videreutvikling og automatisering ble sondert. Fluorolice-prosjektet identifiserte det mest lovende fluoresenssignal til å ha en eksitasjonsbølgelengde på 470 ± 40 nm og en fluorescensbølgelengde på 525 ± 50 nm. Det praktiske arbeide vist at det var svært viktig å ha jevn og kraftig belysning av hele det synlige feltet. Prosjektet viste videre at levende lakseluslarver hadde meget svak fluorescens mens spritpreserverte prøver hadde meget variabel fluorescens. Fluorescens synes derfor ikke å være umiddelbart anvendelig på ferske og levende prøver. Formalinfiksering av lakseluslarver medførte et sterkt og spesifikt fluorescenssignal som var fraværende i de fleste andre planktonorganismer. Imidlertid var det en overlapp med fluoresensprofilen til enkelte andre planktonarter og det er derfor nødvendig å kombinere fluorescens med morfologi. Tester indikerer imidlertid at å bruke fluorescens reduserer tidsbruk ved telling og identifisering med en faktor på ca. 10. Tentative tester indikerte at det er mulig å prosessere prøver automatisk, men videreutvikling av denne tilnærmingen forutsetter analyse av tusenvis av bilder og var ikke mulig å gjennomføre under prosjektet. Fluoroliceprosjektet har dokumentert lett gjennomførlig metodikk for hurtig analyse av planktonprøver, men metodikken forutsetter tilgang på spesialisert utstyr. Rutinemessig bruk av metoden for å tilveiebringe lett sammenliknelige data forutsetter tilgang til opparbeidingsfasiliteter, standardisert prøvetaking og en videreutvikling bør muligvis suppleres av utvikling av metodikk for automatisk prosessering.
Fluorolice
— Final report for FHF project 901508
Report series:
Rapport fra havforskningen 2021-30
ISSN: 1893-4536
Published: 16.07.2021
Project No.: 15400
On request by: FHF
Reference: 901508
Research group(s):
Smittespredning og sykdom
Subject:
Lakselus
Program:
Miljøeffekter av akvakultur
Approved by:
Research Director(s):
Geir Lasse Taranger og Karin Kroon Boxaspen
Program leader(s):
Terje Svåsand
Norsk sammendrag
Summary
The salmon louse is identified as one of the main challenges for salmon aquaculture and wild salmonids. Consequently, management measures have been invoked to control salmon louse infestation pressure including the inclusion of information of sea lice burdens on production limits through what is known as the “traffic light system”. Presently the most accurate estimates of infestation pressure is acquired through a multidisciplinary effort that includes lice counts from the aquaculture industry, modelling of sea lice production and dispersal, surveillance of salmon lice on wild salmonids and measuring infection levels on fish in sentinel cages. However, these data are all indirect in that they observe lice on fish and not the lice larvae actually present in the plankton. Identifying and enumerating salmon lice larvae in plankton is the only way to obtain direct measures. Alas, enumeration and identification by traditional methodology is too resource demanding for routine application and there have therefore been a number of efforts to develop more efficient methodologies including; quantitative real time PCR, eDNA analysis, quantitative fraction PCR and automated image analysis (FlowCam). The molecular methodologies suffer from being vulnerable to variability between samples and therefore requiring extensive validation while automated image analysis methods previously tested were too imprecise for the purpose. Fluorescence microscopy was suggested as a solution in 2017, but the presented methodology yielded variable results indicating that further development was needed. The Fluorolice project was designed to develop the methodology by investigating the salmon louse fluorescence profiles and their dependence on treatments, age etc. Flourolice would furthermore investigate the fluorescence profile with respect to other zooplankton organisms and explore the possibilities for further development and automatization of sample processing. The project identified the most promising fluorescence peak to be at an excitation wavelength of 470 ± 40 nm and an emission wavelength of 525 ± 50 nm and it was found that illumination was required to be even across the entire field of view. The fluorescence was found to be weak in unpreserved samples and to be variable in samples stored on ethanol. This indicate that live fluorescence will not be readily applicable to live samples. Formalin fixation, in contrast yielded strong and specific fluorescence that did not overlap with most other plankton species. A few species did overlap, however, and it is therefore necessary to consider also morphology in identification. Tests indicated that the processing speed for plankton samples can be increased by a factor of 10 in manual sample processing. Preliminary tests suggested that automated identification should be possible as well, but the development of this requires algorithms trained on a very large number of pictures which was beyond the reach of the present project. While the results enable much faster processing of plankton samples, widespread implementation of the methodology requires standardized sampling of large volumes and optional development of algorism for sample analyses.
1 - Fluorolice background (Introduction)
Salmon lice ( Lepeophtheirus salmonis ) represent a substantial obstacle for the sustainability of salmon farming (Torrissen, et al. 2013; Vollset, et al. 2018). As such, there are many avenues of research that aim to improve understanding of lice biology and ecology in order to combat the epidemic or predict the distribution of infective larvae. The latter remains increasingly important as passive non-chemical prevention measures, comprising cage structure modifications or new technologies (Grøntvedt, et al. 2015; Oppedal, et al. 2017; Stien, et al. 2018), become increasingly favored. Many of these technological innovations (e.g. skirts, snorkel cages, submerged cages, depth position of feeding and artificial lights) as well as area management and site locations are founded on knowledge of vertical and horizontal distribution of sea lice larvae. Understanding the fluctuations in abundance and behavior of lice larvae is also required to develop predictive tools to assist farmers in management of preventative measures, as well as for validating models of larval dispersion which in turn can be used for area management and choice of production site locations. However, larval distribution (both spatially and temporally) is heavily influenced by factors such as environmental conditions ( e.g . temperature, salinity, and light), hydrodynamics, connectivity between farms, and natural mortality (Kristoffersen, et al. 2014; Johnsen, et al. 2016; Samsing, et al. 2016; Brooker, et al. 2018). Addressing these parameters in the field requires enumeration of salmon lice larvae in complex plankton samples. Furthermore, to answer questions about larval distribution, large numbers of plankton samples are required to be processed (Nelson, et al. 2017). The ability to meet the desire for knowledge on the planktonic distribution of salmon lice has hitherto been restrained by the resource intensive effort required to identify copepodids in a plankton sample (Bui, et al. 2021). To circumvent this, indirect methods of enumerating lice abundance in coastal waters have been attempted, including assessment of site-specific lice abundance in farms (Jansen, et al. 2012), use of sentinel cages (Bjorn, et al. 2011), and enumeration of lice abundance on migrating wild salmonids (Serra-Llinares, et al. 2014). Ultimately, these approaches operate by using lice on fish as a proxy and do not fill the knowledge gap concerning actual planktonic abundance of sea lice larvae.
Traditionally, microscopy has been the method by which nauplii and copepodids were identified in samples. However, this is time consuming, requires specialist training and will always be limited in capacity to restricted water volumes and limited sample numbers. This approach is therefore undesirably demanding in terms of labor and represents a limiting factor in salmon louse surveillance and research (Bui, et al. 2021). It was therefore desirable to develop a method accessible to both science and industry; a technique that would require minimal training and little previous experience. Bui and colleagues recently performed comparisons and evaluations of multiple enumeration methods for planktonic lice including traditional microscopy, three genetic methods (fPCR, qPCR, and ddPCR), automated fluid imaging, and fluorescence microscopy. In comparing the relative efficiencies and time requirement between methods, conclusions were drawn about the accessibility of each method for the diverse range of possible end-users. For instance, ddPCR was not satisfactorily accurate but had the fastest processing time, while requiring access to highly specialized (and expensive) equipment. From this study preliminary results suggested fluorescence microscopy as an approach with potential for automation and widespread use (Bui, et al. 2021). The approach used at the time worked similarly to regular light microscopy in that the user processes plankton samples under a stereomicroscope, but with the addition of excitation lights and emission filters according to Fordyce (Fordyce 2017). Using this equipment L. salmonis , nauplii and copepodids would often exhibit a different color fluorescence to non-target planktonic organisms and could therefore be more easily identifiable to the user. However, a thorough analysis revealed the results produced according to the description by Fordyce (2017) to be rather variable (Bui, et al. 2021). The reasons for this, and the remedies to the causes, have since been resolved by the Fluorolice project.
2 - Fluorolice ambition and structure (Objectives)
The Fluorolice project was designed to investigate the feasibility of rapid, large-scale quantification of planktonic sea lice larvae using fluorescence and to develop a prototype protocol for industrial and scientific use. The preliminary results presented by Fordyce (Fordyce 2017) and Bui (Bui, et al. 2021) demonstrated the potential of the approach, but simultaneously showed that questions had to be addressed. Specifically, it was clear that it was necessary to investigate:
-
Optimal excitation/emission wavelengths
-
Fluorescence in different species, including Caligus elongatus
-
Causes of variability in fluorescence
-
If and how the methodological approach could be automated
These questions were addressed through 3 work packages:
WP1 - Fluorescence in sea lice and environmental background
WP1 was designed to retrieve Excitation-Emission Matrices (EEMs) for L. salmonis , C. elongatus and common north Atlantic zooplankton species. In addition, WP1 was designed to investigate the effect of storage time, louse developmental stage, and preservation method. Finally, WP1 would develop a protocol for sample processing to be used in WP2.
WP2 – Method Benchmarking
The objective of WP2 was to validate the protocol devised by WP1 with samples containing a realistic variability of background species. To this end, the equipment required for the protocol setup specified by WP1 was acquired and used to analyze samples from Norway, Scotland and the Faeroe Islands spiked with known numbers of copepodids. This allowed WP2 to determine accuracy and precision of the fluorescence method (Bui, et al. 2021).
WP3 – Operationalization of findings in sea lice surveillance and research
The objective of WP3 was to integrate the knowledge and experience from WPs 1&2 into recommendations towards the most efficient approach to salmon louse larvae enumeration – if possible, in the form of a blueprint for an automated unit. Optoscale AS, the commercial partner in Fluorolice, was closely involved in WPs 1&2 to ensure that the considerations arising from a commercial applied perspective were addressed throughout the project.
The findings and conclusions from the WPs will be presented in the next sections followed by a general discussion and recommendations for future actions.
3 - Fluorescence in sea lice and environmental background (WP1)
The initial investigations into the use of fluorescence to distinguish sea lice larvae in plankton samples were promising, yet needed further work to optimize the technique (Fordyce 2017; Bui, et al. 2021). The results from these previous works pointed towards the unknown factors, that then formed the basis for Fluorolice’s WP1. This WP focused on finding the species-specific peak emission and excitation wavelengths to induce fluorescence, and the conditions that would induce the highest and most stable fluorescence signal. Through profiling extensive ranges of samples, we determined the wavelengths that best distinguished salmon lice copepodids from background plankton species, and found the preservation method that facilitated this fluorescence signal. Additionally, the lack of (or weak) unique fluorescence signal was recorded for C. elongatus . These results facilitated the further development of an microscopy application that could be used to enumerate salmon lice in real plankton samples, tested in WP2.
3.1 - Background
Identifying and enumerating planktonic L. salmonis stages in plankton samples is a laborious task (Nilsen 2016; Nelson, et al. 2018). Therefore, several methodologies have been employed to that effect, with mixed results (Bui, et al. 2021). Amongst them, fluorescence microscopy has been shown to increase the visibility of L. salmonis copepodids in comparison with other species (Fordyce 2017; Bui, et al. 2021). However, the reliability of the fluorescence signal has not been investigated nor has the optimal method been described in detail. Ideally, a specific combination of excitation and emission filters would result in L. salmonis fluorescing, while non-target animals are unaffected. In fluorescence, a molecule is exposed to an incident light and photons are absorbed by the molecule raising its energy level (excitation), but rather than returning to the ground level immediately, the molecule reduces its energy state by releasing photons at a lower energy level with longer wavelengths (emission). The fluorescing molecule, the fluorophore, is characterized by its excitation spectrum, its emission spectrum, and its quantum yield or the amount of energy emitted divided by the energy absorbed. Thus, fluorescence is a predictable phenomenon that can be harnessed by spectroscopy to identify and quantify fluorophores (Lakowicz 2013). In a mixed solution where it is not possible to purify the fluorophores, the relative contribution of various compounds can be described by an excitation and emission matrix (EEM, Figure 1), in which the fluorescence intensity is recorded for each pair of excitation and emission wavelengths. EEM measurements have been used to characterize the dissolved organic matter in sea water, terrestrial water and waste water; classify phytoplankton communities; and identify the origin of food products (Coble 1996; Hudson, et al. 2007; Sádecká and Tóthová 2007; Richardson, et al. 2010; Andrade-Eiroa, et al. 2013; Carstea, et al. 2016). We used the EEM measurements to explore the fluorescence profiles of the target sea lice species and non-target copepods and identified the wavelengths where the greatest contrast in the fluorescence occurred. The fluorescence intensity exhibited by the animals was then quantified at those wavelengths through fluorescence microscopy and analysed for statistical differences. The reliability of those fluorescence signals was further examined by investigating factors that might influence them, including storage time in formalin, host fish origin, copepodid age and developmental stage. 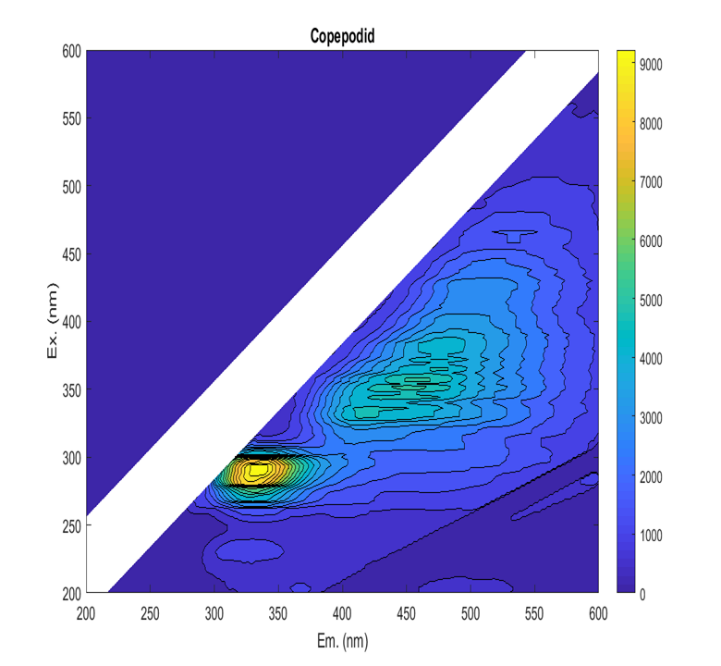
Figure 1 . A Lepeophtheirus salmonis copepodid EEM. The figure shows the emitted fluorescent light (wavelength on the horisontal axis) as a function of the excitation light (wavelength on the vertical axis). The intensity of the of the signal is indicated by color, as shown in the right-hand legend.
3.2 - Methods
The methodology will be described in an abbreviated version here, while a detailed description can be found in the peer reviewed article presenting the results (Thompson, et al. 2021).
L. salmonis were sourced from farmed Atlantic salmon ( Salmo salar ), wild Atlantic salmon and sea trout ( Salmo trutta ). C. elongatus females with egg strings were collected from wild fish along with L. salmonis , and additional egg strings were sourced from a laboratory culture. Salmon lice eggs were sourced primarily from three laboratory strains of L. salmonis: LsGulen, LsOslo and Ls1A (Hamre et al., 2009). Additional C. elongatus were provided by the University of Bergen (UIB) Sea Lice Research Center. L. salmonis and C. elongatus were also collected from wild fish trapped with fyke nets in various fjords in Western Norway during the spring 2019 and 2020. Additional L. salmonis eggs were provided by salmon farms located in Austevoll, Norway, and the Faroe Islands.
Copepodids were obtained by hatching eggs in flow-through incubators as described by Hamre (Hamre, et al. 2009). Egg strings were detached from the female louse and placed into incubation chambers where they hatched and developed through the planktonic stages (Faeroese strains were hatched and incubated at Fiskaaling Aquaculture Research Station in the Faroe Islands using a similar methodology). During the hatching phase, unhatched eggs were moved to a new incubation chamber every 24 hr, while nauplii remained in the original chamber. This allowed the hatch time of lice in each chamber to be defined within a 12-hr error margin. N1 stage nauplii were sampled immediately, while N2 stage nauplii were sampled 3 days post-hatch (DPH), with young and old copepodids sampled at 6 DPH and 12 DPH, respectively. Nauplii and copepodids were sampled from each collection of egg strings and either measured immediately or fixed in either 70% saline ethanol (34 ppt) or 10% formalin buffered with 9% (w/v) sodium tetraborate. Non-target copepod spp., for use as comparators with respect to target sea lice species, were collected with a vertical plankton net with a 0.5 m diameter frame and 140 μm mesh size. Repeated tows to a depth of 10–30 m were made in coastal area in the Bergen vicinity. The dominant non-target copepod found in the tows and sorted for measurement included Calanus finmarchicus , Acartia spp ., Pseudocalanus spp ., Temora spp ., Oithona spp . and Centropages spp .
Fluorescence intensity and profile was measured with a Shimadzu RF-6000 Spectrofluorophotometer using the 3D analysis application. By sequentially changing the filter wavelengths this instrument can be used to produce EEMs. The number of animals in the sample influenced the stability of the measurement: while too many animals would disrupt the suspension, too few animals would not provide a homogenous mixture. The number of animals needed for a stable measurement depended on the species, stage and ultimately the body size of the animals. Lepeophtheirus salmonis samples contained a mean of 150 animals, while non-target copepod samples contained between 25 (late stage Centropages spp.) and 250 ( Oithona spp.) animals. Metadata for each formalin and live sample measured can be found in (Thompson, et al. 2021). All L. salmonis and C. elongatus samples comprised animals from a single stage and age. Non-target copepods were sorted to genus, and samples contained a mix of copepodid and adult stages. Animals stored in formalin were removed from preservation and transferred through saltwater rinses before measurement. EEM measurements made on animals stored in ethanol were highly variable between samples of the same species. Further examination suggested that the fluorophore, which originates from L. salmonis , leaches into the ethanol solution, separating the fluorescence signal from the animal. Thus, ethanol preservation hinders the identification and enumeration of the animals and ethanol EEM measurements were therefore excluded from further analysis. Fluorescence peaks specific for L. salmonis were identified from the EEM data set through a systematic sectioning of EEMs into emission light bands. Fluorescence intensity within each section was evaluated for the relative fluorescence intensity difference between L. salmonis and non-target copepod samples. L. salmonis fluorescence was EEMs were scrutinized in nauplii (N1 and N2 stages combined), young and old copepodids (sampled respectively 6 and 12 after hatching). Since the duration of formalin storage affects fluorescence intensity L. salmonis the initial comparisons were done using samples that had been in storage for more than 60 days. The peak intensity distances identified from the EEMs were then evaluated manually to select the fluorescence peaks where the greatest and most reliable fluorescence difference between L. salmonis and non-target copepods occurred. Generating EEMs on a large number of animals is time consuming and the identified peaks were therefore validated as discriminatory on a high number of animals by fluorescence microscopy using appropriate filters. Animals from formalin samples were handled in the same manner as during the EEM measurements. When measuring live animals, these were placed in a solution of filtered sea water and methyl cellulose, which inhibited their movement but did not produce any fluorescence in the spectra measured. The fluorescence was then analysed according to storage duration, animal size, sea louse species, origin and host fish, development stage, storage temperature and animal age.
3.3 - Results
EEM measurements showed that the fluorescence profile of L. salmonis generally differed from non-target copepods. Although all samples exhibited a wide fluorescence peak near excitation at 290 nm and emission at 320 nm, L. salmonis also exhibited increased fluorescence at higher wavelengths (Figure 1) that was absent in other included species. The fluorescence profiles of the live samples were weaker than those stored in formalin, and the fluorescence profile of L. salmonis varied in relation to stage, age of the animal, host fish and duration of formalin preservation.
The fluorescence peak best suited for distinguishing live L. salmonis from non-target intensity decreased rapidly after an excitation wavelength of 380 nm. At the most promising fluorescence peak (Ex. 330 nm and Em. 418), the greatest fluorescence intensity was found in the young copepodids and the lowest was found in the non-target copepods and L. salmonis NI nauplii. The copepodids originating from sea trout had lower fluorescence intensities than copepodids from salmon, but greater fluorescence than the mean of non-target copepods. The C. elongatus samples also exhibited greater fluorescence than the non-target samples with but had a lower intensity than the L. salmonis copepodids. However, the fluorescence intensity in live copepodids was not deemed sufficiently high, neither in absolute intensity or intensity difference relative to background species, to facilitate reliable identification or to make manual identification more expedient.
Spectrum section analysis of formalin preserved samples indicated that L. salmonis could be distinguished from non-target copepods in the 310 and 510 nm range of emitted fluorescent light. Along those wavelengths, the fluorescence intensity of the young copepodid group increased to a peak at 380 nm and then decreased. The lowest difference in intensity relative to background species was observed in copepodids from sea trout, while the highest difference was observed in nauplii copepodids from salmon. Closer inspection of two identified local peaks (Ex. 380 nm and Em. 474 nm and Ex. 450 nm and Em. 516 nm) showed that although fluorescence intensity was higher at 380 nm excitation, the difference relative to background species was more pronounced using excitation light around 450 nm wavelength. At both peaks the fluorescence intensities of nauplii (N1 and N2) and copepodids were greater than those of non-target copepods. The sea trout copepodid samples were occasionally indistinguishable from the non-target copepod samples with some having lower intensity than the Temora spp . measurements. However, the copepodids from trout had higher than average fluorescence and was readily discerned from background species under a microscope. C. elongatus fluorescence was not distinguishable from the non-target copepod fluorescence.
The mean fluorescence intensity of salmon lice increased with storage duration in formalin. Fluorescence intensity rapidly increased in the first 30 days of storage and more slowly thereafter. It may be impractical to have to wait for a month before analyzing samples, and it was therefore investigated if a similar increase could be achieved by heat treatment at 42 °C. A 7 day heat treatment was shown to be even more efficacious in enhancing fluorescence than extended storage. The fluorescence intensity of non-target copepods exhibited a significant, but weak linear relationship with storage duration in formalin. The fluorescence intensity of non-target copepods was significantly different from the salmon lice but the variance in mean fluorescence intensity may result in the occasional measurement of a L. salmonis copepodid below that of a non-target copepod. Also, species not included in the study may be show fluorescence comparable to salmon lice. Several additional factors were investigated to determine their relationship to the measured fluorescence intensity, including host fish, development stage and age. No significant differences were found between copepodids originating from Atlantic salmon hosts raised under laboratory conditions or taken from a farm. Nauplius stages N1 and N2 exhibited more intense fluorescence than the copepodid stage. Age of the L. salmonis copepodids also significantly affected the fluorescence intensity. Although these factors affected the fluorescence none of them caused the fluorescence to decrease to levels deemed undiscernible from background species.
3.4 - Discussion and conclusion
The fluorescence signal induced by formalin fixation appeared to be a reliable differentiator of planktonic L. salmonis in mixed zooplankton samples. WP1 indicated that fluorescence microscopy using excitation light around 450 nm wavelength and emission filters around 516 nm wavelength would be appropriate. A statistical difference was also observed between L. salmonis and non-target copepod spp. in live samples (Thompson, et al. 2021), but the small increase in fluorescence is not likely to be sufficient for routine identification. A modification of traditional taxonomic methods with fluorescence would aid in the locating and identifying of L. salmonis in formalin samples, greatly reducing processing times. Automated identification may also be possible through the use of fluorescence, but multiple filter sets would be needed along with copious training of machine learning algorithms. The non-target copepod spp. examined are commonly found in the zooplankton assemblage along with the relatively rare L. salmonis . However, not all common copepod species were examined, such as Metridia spp. and Microcalanus spp., nor were the many other less common copepod species, cryptic species and non-copepod zooplankton examined. Any number of species with an unknown fluorescence profile could be found in a mixed zooplankton sample along with L. salmonis . While the non-target copepod spp. provided useful comparators for examining the differences in fluorescence to L. salmonis , they did not constitute an exhaustive survey. Considering the number and variability of species present in any given zooplankton sample, it would be impossible to individually assess the fluorescence profiles of all species. Instead, the reliability of a fluorescence identification method was assessed with trials on a variety of zooplankton samples spiked with a known number of salmon lice in WP2.
4 - Method benchmarking (WP2)
With the successful identification of the peak fluorescent conditions for L. salmonis , the practical application of fluorescence identification was tested using representative plankton samples spiked with copepodids. The methodology for fluorescence microscopy was tested in seasonal samples and across three users with different experience with plankton enumeration. The processing time was relatively fast, however there was large variability between users depending on their experience, and possibly due to handling time of the sample (i.e. effects of photobleaching). With some optimization of the sample handling and fluorescence microscopy protocol, this method could be easily adopted across laboratories and increase processing capacity for studies on planktonic lice distributions.
4.1 - Background
The identification of the salmon louse fluorescence fingerprint established in WP1 allowed determining the specifications of a setup that expectedly would facilitate rapid and precise enumeration of salmon lice larvae in plankton samples. However , as the number of background species included in WP1 was limited it was necessary evaluate whether the protocol was efficient when undertaken in the context of a broad range of potential plankton diversity. To do this, and to assess the efficacy and speed, we tested the protocol in a ‘ring test’ with three people counting natural plankton samples that had been spiked with a known number of L. salmonis copepodids. The test was planned as a ring-test performed at independent laboratories. Unfortunately COVID-19 restrictions led to logistical challenges that resulted in a decision to perform the test in Bergen only, but with independent operators counting the samples.
4.2 - Sampling
During spring and autumn of 2019, zooplankton samples were collected from 5 sites in Norway, Scotland, and the Faroe Islands (Fig. 2). At the 4 sites in Norway and Faroe Islands, 10 replicate vertical tows were made to a depth of 40 m using a 50 cm diameter ring net with 140 um mesh. Half of the replicate tows were preserved with 10% buffered formalin while the other half were preserved in 70% saline ethanol, however after WP1 results became apparent, only the formalin samples were used for fluorescence identification. The Norway sites were sampled twice in the spring and twice in the autumn. Access to the Faroe Island sites was limited by seasonal weather patterns and one or the other site was visited twice each season. The Scottish samples were collected as part of an ongoing monitoring effort with a single sample collected during 10 separate cruises between May 7 and November 13, 2019. At the Scottish site, vertical hauls were made to a depth of 40 – 50 m using a 40 cm diameter bongo net fitted with a 68 um and 200 um mesh net. The sample collected with the 200 u m mesh net was taxonomically enumerated by Scotland Marine Science, and the 68 m sample was reserved for the fluorescence ‘ring-test’. All samples were stored in 10% formalin buffered with borax and transported to IMR facilities in Bergen Norway for processing. 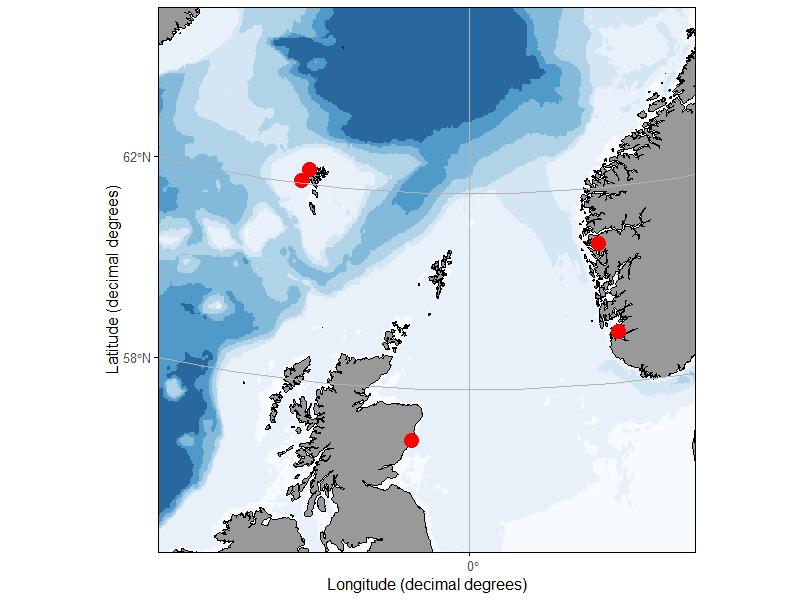
Figure 2. Sampling sites in Norway, Faeroe Islands and Scotland.
4.3 - Zooplankton Community
The Scottish samples collected with the 200 m net from the paired bongo tow were taxonomically identified and enumerated as part of the ongoing monitoring program. One ethanol sample from each set of replicates from the Norwegian and Faroese stations was processed for zooplankton taxonomy and enumeration at the Fiskaaling Aquaculture Research Station in the Faroe Islands. In all cases, a subsample was taken and all animals in the subsample were identified to the lowest achievable taxonomical level. The zooplankton community data was then harmonized by combining animal counts from lower taxonomic levels into higher taxonomic groupings that were shared across analyses. Total dry weight of the zooplankton biomass was measured for each of the formalin replicates analyzed in the fluorescence ring test. Lice Spike and Enumeration
The zooplankton samples were spiked with formalin preserved 6 day post-hatch salmon lice copepodids which were sourced from three laboratory strains of L. salmonis : LsGulen, LsOslo and Ls1A (Hamre, et al. 2009), cultured at the Institute of Marine Research (IMR) facility in Bergen, Norway in May 2019. The number of copepodids added to each sample was determined by randomly generating numbers following a Poisson distribution with an average of ≈15. The participating salmon lice enumerators in the ring test were blind to the spiking range until after they submitted their count number for each sample. The enumeration order of the samples was randomized.
Samples were prepared for enumeration by first filtering and rinsing using filtered sea water (FSW). The samples were then transferred to 6-well plate dishes. The number of well plate dishes used for each sample depended upon the density of the sample with a minimum number used which allowed the sample contents to be distributed in a single layer in the wells. The enumeration is described below. After enumeration, the samples were transferred back into the original sample containers. The first round of counts was done concurrently by two enumerators (Ashoka and Boudica), and required a single sample handling. The third count (Cleopatra) was done 2 to 4 weeks later and necessitated another sample preparation for a total of three handling events. In the first round of counts 4 of the replicate samples from Norway and the Faroe Islands were enumerated, and in the later round 3 of those were enumerated. The lice counters had differing levels of experience and expertise with microscopy and zooplankton taxonomy. Prior to beginning the trial, a 3 – 5 hour training session was conducted in which the participants were coached on how to identify a salmon louse copepodid using the fluorescence aided method. Under illumination a subset of the sample will fluoresce, using approximate size and shape as cues potential targets draw the participants’ attention, and positive identification is assessed via morphology - under high magnification if necessary. The time taken for each participant to enumerate samples was recorded via stopwatch starting just prior to examination of the first well plate under the microscope and ending with the last well examined. Counters enumerated the spiked copepodid salmon lice and any wild lice copepodids which were unintentionally collected in the sample. Where counts were above the spike number the excess lice were identified as Caligus elongatus and removed from the total count. In four of the samples, a single Nauplius was found during the count, but these were not added to the total as only copepodids were used for spiking. The count total was compared against the spike number and a proportion correct was calculated.
4.4 - Fluorescence Microscopy and Imaging
Samples were examined with a Nikon SMZ18 stereomicroscope. Fluorescence illumination was provided by the Lumen 200 and a standard ET-FGP filter cube was used to specify an excitation wavelength of 470 ± 40 nm and an emission wavelength of 525 ± 50 nm. Among the lessons learned was that even illumination of the samples in the entire field of view is essential for efficient sample processing. We find the described setup to be satisfactory in providing this. The microscope system was placed in a darkroom and examination and imaging was done without extraneous lighting. After the first enumeration, every well that was examined was imaged with at the minimum zoom setting and standardized camera settings to allow mean and total fluorescence intensity and fluorescing pixels to be calculated for each sample.
4.5 - Photobleaching
Fluorescence intensity declined due to regular handling and enumeration, this bleaching effect was examined in a set of 127 of the spike copepodids followed by constant illumination of a subset of 48 copepodids for 120 minutes. Regular handling and enumeration was simulated by removing the copepodids from formalin and placing them in seawater, imagining them immediately, and examining them under illumination for 3 minutes. They were then left in the darkroom for 90 minutes before being imaged again, at which point the copepodids’ mean fluorescence intensity above the 3500 threshold had decreased to 6061, 95.6% of the initial 6337. The subset of 48 were left under fluorescence illumination and imaged 6 times over 120 minutes. Mean fluorescence intensity decreased rapidly and then steadily from the starting 6061, at 33 minutes it was 72.7% of the start, then 68.6% at 53 minutes, and finally 62.2% at 120 minutes.
4.6 - Results and discussion
The data showed that sample processing was manageable and averaged a little less than 30 minutes pr. sample independent of the operator. This should allows for processing a large number of samples at a reasonable cost. The counts were performed by three anonymized counters referred to as Ashoka, Boudica and Cleopatra. The accuracy data (sensu (Bui, et al. 2021)) suggested that inter-operator variability may be significant (Figure 3). The counters Ashoka and Boudica had comparable and highly satisfactory accuracy. The accuracy of the last of the counters, Cleopatra, was too variable to produce reliable results. Operator dependency in sample processing is not uncommon, at it may be necessary to perform a counter accuracy test to ensure that the results are reliable. However, the results produced by Cleopatra may be explained by the samples being enumerated on a later date after the samples were placed back in formalin and then processed again. Thus, the additional handling steps could have contributed to a loss of animals and any photobleaching would have had a greater effect on the fluorescence intensity of the target copepods. In any event, validation of counter precision is recommended.
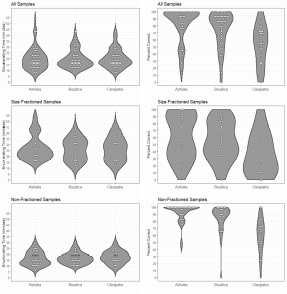
Figure 3. Handling time and enumeration accuracy for three counters.
The operator is not the only factor affecting the precision and accuracy of the counts. The accuracy is inversely correlated with the total fluorescence in the samples (Figure 4). Since detritus from e.g. salmon feed may be highly fluorescent this indicates that choice of sampling site should take this into account.
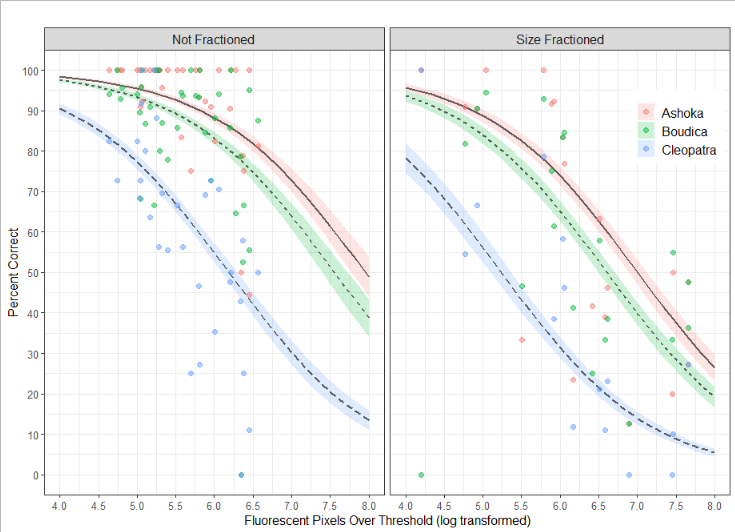
Figure 4. The GLM model is used to predict the percent correct as a function of the background fluorescence, the counter, and whether the sample was size fractioned. Predicted values are shown with lines and accompanying standard error of the mean, observed values are shown with colored points.
During blooms the plankton community may be excessively dense. At such instances size fractioning and prefiltration may be necessary to avoid gelatinous plankton and extreme plankton densities. As seen in Figure 3 size fractioning greatly reduced the percent correct of the count. Best practice is to do the size fractioning prior to fixing the sample, this is especially important for removing large gelatinous plankton. The jellies disintegrate in the preservation but leave behind a sticky material which can cause animals to clump together and those clumps will be retained in size fraction even if some of the animals within it would normally pass through. In some cases the samples are overwhelmingly dominated by Calanus . Seemingly, lipid rich copepods, including Calanus , have highly fluorescent oil sacs and while a size fraction will remove the larger stages of Calanus many small stages will remain in the sample and could overwhelm the sample with fluorescence. This may be remedied by daytime surface sampling ( Calanus along with many other copepods have a diel vertical migration).
The results demonstrate that fluorescence can facilitate sample processing at a scale previously unachievable. However, the method is not without weaknesses. Inter-operator variability may be significant. This may be addressed by establishing a routine for validating the counters’ reliability, or by developing fully automated counting procedures – for instance by training an AI to analyse pictures of samples. Furthermore, samples may be of a character (density, presence of fluorescent detritus, presence of a gelatinous plankton derived flocculating agent, etc.) that requires special attention.
5 - Operationalization of findings in sea lice surveillance and research (WP3)
The preliminary method developed in WP2 can pave the path for further procedural development that can then provide an invaluable enumeration tool for research and industry. The practical factors to consider in method advancement are accuracy and reliability in complex plankton samples, processing ease and time, ability to distinguish live copepodids or else the requirement for preservation, and equipment required. In a broader perspective, the regime for collecting plankton samples should be considered respective to purpose (e.g. surveillance or research questions) to ensure representative sampling covering temporal and spatial variability, and the resources available to the end user (i.e. use by farmers, management bodies or researchers). The method developed in WP2 is a proof-of-concept technique, and therefore the next method iteration to navigate potential commercial applications is likely to be the automation of sampling and accessibility of enumeration. This would require both process structuring and extensive engineering and product development, and the feasibility of this goal is addressed here.
5.1 - Advantages and limitations
The results from WPs 1 and 2 show that formalin-preserved L. salmonis larvae develop a fluorescence profile that is sufficiently distinct and pronounced to facilitate identification in complex plankton samples. Live L. salmonis larvae also have a distinct profile but it is deemed too weak to be useful for practical applications. The implication of this is that fluorescence-based enumeration will in practice likely work on preserved samples only. Heat treating samples allows the fluorescence to develop in less than a week and the reliance on preserved samples does therefore not preclude a realistic monitoring of the extant lice abundances on a relevant spatiotemporal scale.
The quality and nature of the samples to be analyzed affect accuracy and processing speed. Among the primary challenges is the fact that salmon lice larvae are relatively rare in the plankton community. Thus, samples must be large in volume, and invokes a need for size selective sampling to avoid overly dense samples. It therefore appears that there is a need for standardized sampling to ensure that the sample quality is appropriate and to enhance comparability. Other factors will vary from sample to sample and require tailored approaches for their resolve. In the majority of cases, these approaches will be adoptable from plankton research methodologies.
A limiting factor when samples have been obtained, will be sample processing. Although the sample processing time is very manageable using the fluorescence methodology identified, the project has demonstrated that specialized equipment, appropriate laboratory conditions (ventilation and light) and validated counters are essential for manual processing.
5.2 - Areas of use
The application of the methods developed in this project enables fast and efficient counting of lice in water sample significantly decrease the amount of time needed for analysis. In reality the project results has changed the possibilities for analysis of such samples from being a method that could only be applied to a very limited number of samples using highly skilled counters to a method that can be used as a routinely in laboratories only requiring appropriate equipment and non-expert counters. The use of the method opens the door to a significant increase in the knowledge on the ecology and distribution of salmon lice larvae. This knowledge may be seen a contributor towards three main areas: Industry, science and surveillance.
Industrial applications:
Knowing the distribution of lice will affect and improve a range of short and long-term management decisions in the aquaculture industry. A recent report has emphasized that preventing salmon lice infestation is a much more effective control measure than treating already infested fish (Jeong et al 2021). Knowledge on lice distribution include better positioning of future sites in locations with low naturally occurring lice densities. Similarly, predicting the vertical distribution of incoming infection pressures could be coupled with deployment of depth-based prevention technologies (e.g. skirts, or submerged or snorkel cages; see (Barrett, et al. 2020). Knowing the general infestation pressure in an area may also improve the possibility for scheduling delousing and facilitate informed use of various preventive measures to shielding net pens from incoming larvae.
On-site monitoring strategies of planktonic larvae could include continuous surveillance of L. salmonis nauplii around or downstream from salmon farms – an approach earlier tested in the Faeroe islands (Nordi, et al. 2016)(á Norði et al. 2016), and attempted in various studies where abundances were approximated using qPCR (McBeath, et al. 2006; Ingebrigtsen 2017; Bui, et al. 2021). Widespread use of a monitoring program across the industry requires a processing method that is accessible to all users (i.e. not only those who have access to a laboratory), and such accessibility of plankton analyses is most likely to be achieved through automated sampling and fluorescence-based sample processing.
Scientific applications:
Salmon lice behavior and biology can be studied in great detail in the laboratory, but ultimately such findings need to be validated in a natural environment. An example of this is the newer studies of behavior that have been conducted in controlled small-scale conditions (Crosbie, et al. 2019; Coates, et al. 2020; Crosbie, et al. 2020) that then require plankton sampling from fjords and the coast to confirm the results of specific factors that are considered to influence distribution (salinity, temperature and depth). Several studies have also shown differences in phenotypic traits (e.g. depth preference, salinity tolerance, temperature tolerances) among lineages of lice (Ljungfeldt, et al. 2017; Andrews and Horsberg 2020; Coates, et al. 2020). While mapping the molecular mechanisms is a task requiring laboratory experiments, lice from plankton samples are required for confirmation of the expected distribution patterns. Fluorescence based sample processing facilitates the identification and isolation of specimens from samples for further processing.
Surveillance applications:
Norway has an international responsibility to protect its wild salmon stocks. To fulfill these, comprehensive surveillance programs monitoring both Atlantic salmon and sea trout are performed every year (Nilsen, et al. 2019). In addition to the costs associated with this, this monitoring program includes suboptimal activities such as catching and killing of wild fish and keeping farmed fish in sentinel cages with significant negative welfare effects. Sentinel cages in particular is a problematic proxy – there are animal welfare considerations of keeping fish in small areas where they cannot choose optimal swimming depths, causing further potential artefacts with the use of very small net pens. Appropriate sampling schemes can provide an alternative solution to current surveillance strategies, and fluorescence-based sample processing allows direct observation of lice larvae in the water column and may after due refinement be applicable in routine surveillance (Thompson, et al. 2021). However, surveillance by direct observations of sea lice burdens on wild fish integrates the infectivity pressure and the mitigating effects of the host responses (Nilsen, et al. 2019) and may prove more difficult to replace by direct sampling of sea lice. Nevertheless, supplementary plankton samples in surveyed regions may facilitate correlation between actual lice copepodid abundance and infestations observed on wild or farmed salmonids.
5.3 - Operationalization of fluorescence-based applications
Fluorescence-based analysis allows for a processing high numbers of samples and hence provides a platform for comprehensive descriptions of the planktonic distribution of lice. However, the development of this technique to be accepted for widespread implementation requires some optimization and standardization in the method itself, and the approach to collecting samples. Operationalization therefore requires solutions to two factors: sample acquisition and sample analysis.
Sample acquisition:
Regardless of the intended purpose for salmon louse larvae monitoring, sampling of plankton is required and must be processed in a way that meets the requirements for subsequent sample processing L. salmonis larvae are scarce even when abundant (i.e. a few individuals pr. m 3 ), which is vastly contrasting to e.g. Calanus spp . which may reach abundances of thousands of individuals pr. m 3 (Thompson, et al. 2021)). Because of their low abundance, large volumes of water are likely needed to be sampled. Furthermore, since L. salmonis larvae are not evenly distributed in the water column, stratified sampling or sampling integrating across depths would be required to acquire a representative result. At the same time, it is desirable to avoid overly-dense samples, so the plankton collection method must utilise a measure to selectively sample organisms of relevant size.
To achieve stratified sampling (i.e. fixed depth sampling) requires horizontal plankton hauls, likely using specialized equipment too heavy for manual deployment (Fig?). This would then incur considerable cost to engage appropriate personnel and sizable vessels to conduct the sampling. An alternative approach could be repeated vertical hauls with smaller plankton nets, but the sample volume would be substantially less than a horizontal haul The third major tool for plankton sampling is pumping systems, which can potentially move large volumes of water in short periods but are generally static in position. Traditional use of plankton hauls or pumps are logistically demanding, whereby individual samples are collected sequentially and then collected plankton must be handled, filtered, and preserved. Essentially, the traditional methods require labour and equipment that renders them not the most parsimonious solution for extensive routine monitoring objectives. There is an evident need for a platform that samples autonomously – either stratified or by integrating the water column – with intermittent supervision. Development of such a platform should have priority, and the technical requirements will be discussed below (Section 5.4).
Sample analysis:
The fluorescence-based approach generated in Fluorolice has initially been developed as a manual processing technique, as is the first natural iteration. Preliminary attempts on selected photographs of samples indicates that further development towards automated or semi-automated analysis is possible. Samples will need to be processed for visualization by video or still photography, and so it is uncertain how much there is to gain in terms of speed by automated processing. However, automated analysis would remove the human/counter-induced variability, and such standardization may therefore be preferable, even without a reduction of sample processing time or cost.
Manual counting using the method in WP2 requires no further development for implementation. That said, manual processing requires a laboratory with appropriate equipment, and staff that have been verified in terms of counting accuracy and precision. The demand for this function is likely to rise in the near future, and one should expect that this service will become increasingly common and lead to more commercially available options.
Automated sample analysis will require development and verification, but is an attractive solution that removes operator-induced variability, while possibly increasing processing capacity. A market product would facilitate widespread adoption of automated analyses among the farm sites and companies, and lead to standard protocols that allow quantitative comparison within and among production zones. Development of automated sample processing should therefore be prioritised, and the technical requirements for the development will be discussed below.
5.4 - Automated sampling platform
As argued in the previous section there is an evident requirement for a semiautonomous sampling unit manageable from a small vessel. The platform must meet the following requirements:
-
It must be able to sample large volumes
-
It must take into consideration the regular presence of gelatinous plankton
-
It must be able to address patchy distribution.
Large volumes.
As stated earlier; lice are scarce even when abundant. Hence, large volumes – tens of m 3 – must be sampled. This will produce samples that can be very dense, particularly during productive seasons. The sampling approach must therefore tolerate this and enrich samples for the organismal size fraction relevant when looking for salmon lice larvae.
Gelatinous plankton.
As described in WP2, gelatinous plankton represents a challenge when abundant. The sampling approach should therefore include measures to reduce the amount of gelatinous plankton sampled, to avoid fluorescence issues but also the risk of clogging by larger gelatinous plankton.
Patchy distribution.
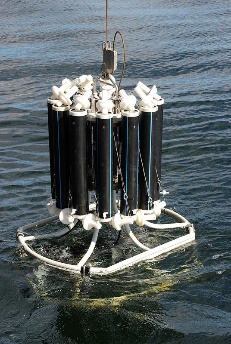
Figure 6. Conventional 12-liter water bottles.
Unresolving the effects of patchy distribution requires many samples from many locations (Nelson, et al. 2018). This dictates a need for mobility of the platform(s) and a capacity to produce a high number of samples. Consequently, the sampling strategy must be either sufficiently inexpensive to allow for deployment of a large number of samplers simultaneously, or designed to allow equipment to be rapidly redeployed multiple times over a short period of time. The requirement for large volumes excludes conventional water samplers, such as the Niskin Water Bottles which generally sample 0.03 m 3 or less (Figure 6). Hence there is a need for development of a sampling platform either de novo or combining devices already available.
5.5 - Automated sample processing
One of the goals of the current project was to investigate the feasibility of a real-time in-situ counting device, that would allow fish farmers, governmental agencies, and other to have live data on the spread of salmon lice larvae. After the consideration of practical and logistical requirements for representative sample collections, it became clear that substantial investments into further research and product development would be needed to generate an automated analytical tool that could cope with the large and dense plankton samples. The project group thus found that building an in situ device that was able to concentrate, preserve, store and analyze automatically was well beyond the scope of this project’s ambition.
Quite early in the processing of WP1 data it was shown that the untreated nauplii were not detectable and/or discernable from other organisms with the use of fluorescent excitation. However, further investigations revealed that they were discernable after being stored in formalin. So, while the group had abandoned the idea of a real-time in situ measurement device, it became apparent that the method of counting nauplii using the information from fluorescence had the capacity to improve on today’s manual techniques. There was potential for further developing the method established in the current project, thus enabling a semi-automated counting device for L. salmonis larvae. This device would realistically only be suitable for laboratory use, but might in itself improve counting efficiency so much that high throughput L. salmonis larval analyses becomes a more feasible task, and may become commercially available.
Although not within the scope of Fluorolice to fully develop an automated system, the combined project team suggests a workflow that could be the first steps towards automation of the counting process:
-
Parallel to manual counting using fluorescence information, as introduced by the current project, images from the microscope should be taken and labelled according to their contents.
-
Machine learning experts should be consulted in deciding the type of machine learning approach to use and how to label the images. One suggestion would be to use an object detection neural network, for instance YOLO (You Only Look Once, https://arxiv.org/abs/1506.02640)
-
Plankton and machine learning experts must jointly investigate if there is a variation in the appearance of the larvae in formalin samples that affects the automated processing. In general, machine learning algorithms perform very well in known settings, but can be expected to underperform if conditions change significantly from the contents in its training data.
-
Training sets needs to be created in order to gauge the precision of the created network. A pre-decided ambition for precision should be set, making sure the automated counting is comparable or better than human counters.
The project industry partner, Optoscale AS, deemed the above steps achievable given enough training data, time and resources. They suggest the following simplified pipeline towards and automated process:
-
Microscope captures images (human involved)
-
Images are analyzed by neural network or similar (automated)
-
The results are presented as counts of larvae with associated information that allow optional human verification (statistics and captured images).
In parallel to the machine learning aspect of automation, there needs to be investigation into the visual capacity of the equipment to separate and detect individual particles well enough to be imaged. Similarly, the size of the cell where images are taken would need to accommodate the possible attenuation of fluorescent light.
The above workflow aims at facilitating L. salmonis larval enumeration in plankton samples in a 2-step process where sampling and enumeration are separated processes. It should be noted that this section refers to the analysis of formalin-preserved lice. The task of converting the fluorescence identification approach into a 1-step system that can be housed in a commercially available in situ instrument would require extensive product development. It would require engineering of a device that can perform the complex process in an evironmentally safe manner in the marine environment. Such a unit would require regular maintenance (eg. cleaning filters, removing formalin samples, cleaning lenses, supplying new formalin), and it is therefore unlikely that the additional complexity of the unit is desirable.
6 - Main Findings / Hovedfunn
Main findings:
-
The Fluorolice project has established a microscopy based methodology that increase the number of samples that can be analyzed for salmon louse larvae by a factor of 10 compared to traditional microscopy.
-
The developed protocols require formalin-fixation of samples and access to fluorescence microscopes with very even stage illumination as well as the appropriate filters.
-
Future development of the methodology should include automated and standardized sampling equipment and optionally methodology or automated sample analysis.
Hovedfunn:
-
Prosjektet har etablert fluorescensmikroskopibasert metodikk som øker antall planktonprøver som kan analyseres for luselarver med en faktor på 10 sammenlignet med tradisjonell metodikk.
-
Metodikken forutsetter at prøvene er formalinfikserte og at mikroskopet som anvendes har jevn belysning og den korrekte filtersammensetning.
-
Videreutvikling av tilnærmingen bør omfatte utvikling av prøvetakingsutstyr og med fordel også algoritmebasert prøveanalyse.
7 - Deliverables
The Fluorolice-project included 5 identified external deliverables.
Deliverable 1: Scientific paper from WP1.
This has been published as an open access paper:
Thompson CRS, Bron JE, Bui S, Dalvin S, Fordyce MJ, Furmanek T, Noroi GA, Skern-Mauritzen R. 2021. Illuminating the planktonic stages of salmon lice: A unique fluorescence signal for rapid identification of a rare copepod in zooplankton assemblages. Journal of Fish Diseases. ( https://doi.org/10.1111/jfd.13345 )
Deliverable 2: Scientific paper from WP2.
This is presently unsubmitted, but the findings are included in an abbreviated form in the present report (Section 4). The manuscript will be submitted later this year.
Deliverable 3: Popular science article from WP2.
This is presently under publication and will appear shortly in Fish Farming Expert with the title: “ The future of salmon lice research and monitoring is bright and fluorescent green “.
Deliverable 4: Description of the elements and conclusions from WP3 concerning developmental steps required towards general accessibility of the methodology.
This is included in the present report (Section 5): “Operationalization of findings in sea lice surveillance and research (WP3)”.
Deliverable 5: Project summary as a popular science article. This will be followed by an online workshop. Both will appear autumn 2021.
8 - References
Andrade-Eiroa A, Canle M, Cerda V. 2013. Environmental Applications of Excitation-Emission Spectrofluorimetry: An In-Depth Review II. Applied Spectroscopy Reviews 48:77-141.
Andrews M, Horsberg TE. 2020. Sensitivity towards low salinity determined by bioassay in the salmon louse, Lepeophtheirus salmonis (Copepoda: Caligidae). Aquaculture 514.
Barrett LT, Oppedal F, Robinson N, Dempster T. 2020. Prevention not cure: a review of methods to avoid sea lice infestations in salmon aquaculture. Reviews in Aquaculture 12:2527-2543.
Bjorn PA, Sivertsgard R, Finstad B, Nilsen R, Serra-Llinares RM, Kristoffersen R. 2011. Area protection may reduce salmon louse infection risk to wild salmonids. Aquaculture Environment Interactions 1:233-244.
Brooker AJ, R. S-M, Bron JE. 2018. Production, mortality, and infectivity of planktonic larval sea lice, Lepeophtheirus salmonis (Krøyer, 1837): current knowledge and implications for epidemiological modelling Ices Journal of Marine Science.
Bui S, Dalvin S, Vagseth T, Oppedal F, Fossoy F, Brandsegg H, Jacobsen A, Nordi GA, Fordyce MJ, Michelsen HK, et al. 2021. Finding the needle in the haystack: Comparison of methods for salmon louse enumeration in plankton samples. Aquaculture Research.
Carstea EM, Bridgeman J, Baker A, Reynolds DM. 2016. Fluorescence spectroscopy for wastewater monitoring: A review. Water Research 95:205-219.
Coates A, Phillips BL, Oppedal F, Bui S, Overton K, Dempster T. 2020. Parasites under pressure: salmon lice have the capacity to adapt to depth-based preventions in aquaculture. Int J Parasitol 50:865-872.
Coble PG. 1996. Characterization of marine and terrestrial DOM in seawater using excitation emission matrix spectroscopy. Marine Chemistry 51:325-346.
Crosbie T, Wright DW, Oppedal F, Dalvin S, Myksvoll MS, Dempster T. 2020. Impact of thermoclines on the vertical distribution of salmon lice larvae. Aquaculture Environment Interactions 12:1-10.
Crosbie T, Wright DW, Oppedal F, Johnsen IA, Samsing F, Dempster T. 2019. Effects of step salinity gradients on salmon lice larvae behaviour and dispersal. Aquaculture Environment Interactions 11:181-190.
Fordyce M. 2017. An improved method for the visualisation of salmon louse Lepeophtheirus salmonis copepodids from plankton samples by fluorescence stereomicroscopy. In. EAFP 18th International Conference on Diseases of Fish and Shellfish, Belfast, UK.: Marine Scotland.
Grøntvedt RN, Nerbøvik I-KG, Viljugrein H, Lillehaug A, Nilsen H, Gjevre A-G. 2015. Thermal de-licing of salmonid fish - documentation og fish welfare and effect. In. Veterinærinstituttets rapportserie. Oslo: Veterinærinstituttet. p. 33.
Hamre LA, Glover KA, Nilsen F. 2009. Establishment and characterisation of salmon louse (Lepeophtheirus salmonis (Kroyer 1837)) laboratory strains. Parasitology International 58:451-460.
Hudson N, Baker A, Reynolds D. 2007. Fluorescence analysis of dissolved organic matter in natural, waste and polluted waters - A review. River Research and Applications 23:631-649.
Ingebrigtsen H. 2017. Molecular quantification of sea lice in and around sea cages. [[Trondheim]: Norwegian University of Science and Technology.
Jansen PA, Kristoffersen AB, Viljugrein H, Jimenez D, Aldrin M, Stien A. 2012. Sea lice as a density-dependent constraint to salmonid farming. Proc Biol Sci 279:2330-2338.
Johnsen IA, Asplin LC, Sandvik AD, Serra-Llinares RM. 2016. Salmon lice dispersion in a northern Norwegian fjord system and the impact of vertical movements. Aquaculture Environment Interactions 8:99-116.
Kristoffersen AB, Jimenez D, Viljugrein H, Grontvedt R, Stien A, Jansen PA. 2014. Large scale modelling of salmon lice (Lepeophtheirus salmonis) infection pressure based on lice monitoring data from Norwegian salmonid farms. Epidemics 9:31-39.
Lakowicz JR. 2013. Principles of fluorescence spectroscopy.
Ljungfeldt LER, Quintela M, Besnier F, Nilsen F, Glover KA. 2017. A pedigree-based experiment reveals variation in salinity andthermal tolerance in the salmon louse, Lepeophtheirus salmonis. Evolutionary Applications 10:1007-1019.
McBeath AJ, Penston MJ, Snow M, Cook PF, Bricknell IR, Cunningham CO. 2006. Development and application of real-time PCR for specific detection of Lepeophtheirus salmonis and Caligus elongatus larvae in Scottish plankton samples. Dis Aquat Organ 73:141-150.
Nelson EJ, Robinson SMC, Feindel N, Sterling A, Byrne A, Pee Ang K. 2017. Horizontal and vertical distribution of sea lice larvae (Lepeophtheirus salmonis) in and around salmon farms in the Bay of Fundy, Canada. J Fish Dis.
Nelson EJ, Robinson SMC, Feindel N, Sterling A, Byrne A, Pee Ang K. 2018. Horizontal and vertical distribution of sea lice larvae (Lepeophtheirus salmonis) in and around salmon farms in the Bay of Fundy, Canada. J Fish Dis 41:885-899.
Nilsen MK. 2016. Sampling strategies, distribution and concentration of planktonic salmon lice copepods in the Outer Hardangerfjord and the Altafjord. [[Tromsø]: University of Tromsø.
Nilsen R, Serra RML, Sandvik AD, Elvik KMS, Kjær R, Karlsen Ø, Finstad B. 2019. Lakselusinfestasjon på vill laksefisk langs Norskekysten i 2019. In. Rapport fra Havforskningen. Bergen, Norway: Institue of Marine Research. p. 97.
Nordi GA, Simonsen K, Patursson O. 2016. A method of estimating in situ salmon louse nauplii production at fish farms. Aquaculture Environment Interactions 8:397-405.
Oppedal F, Samsing F, Dempster T, Wright DW, Bui S, Stien LH. 2017. Sea lice infestation levels decrease with deeper "snorkel' barriers in Atlantic salmon sea-cages. Pest Management Science 73:1935-1943.
Richardson TL, Lawrenz E, Pinckney JL, Guajardo RC, Walker EA, Paerl HW, MacIntyre HL. 2010. Spectral fluorometric characterization of phytoplankton community composition using the Algae Online Analyser (R). Water Research 44:2461-2472.
Sádecká J, Tóthová J. 2007. Fluorescence spectroscopy and chemometrics in the food classification - a review. Czech Journal of Food Sciences 25:159-173.
Samsing F, Oppedal F, Dalvin S, Johnsen I, Vagseth T, Dempster T. 2016. Salmon lice (Lepeophtheirus salmonis) development times, body size, and reproductive outputs follow universal models of temperature dependence. Canadian Journal of Fisheries and Aquatic Sciences 73:1841-1851.
Serra-Llinares RM, Bjorn PA, Finstad B, Nilsen R, Harbitz A, Berg M, Asplin L. 2014. Salmon lice infection on wild salmonids in marine protected areas: an evaluation of the Norwegian 'National Salmon Fjords'. Aquaculture Environment Interactions 5:1-16.
Stien LH, Lind MB, Oppedal F, Wright DW, Seternes T. 2018. Skirts on salmon production cages reduced salmon lice infestations without affecting fish welfare. Aquaculture 490:281-287.
Thompson CRS, Bron JE, Bui S, Dalvin S, Fordyce MJ, Furmanek T, Noroi GA, Skern-Mauritzen R. 2021. Illuminating the planktonic stages of salmon lice: A unique fluorescence signal for rapid identification of a rare copepod in zooplankton assemblages. Journal of Fish Diseases.
Torrissen O, Jones S, Asche F, Guttormsen A, Skilbrei OT, Nilsen F, Horsberg TE, Jackson D. 2013. Salmon lice--impact on wild salmonids and salmon aquaculture. J Fish Dis 36:171-194.
Vollset KW, Dohoo I, Karlsen O, Halttunen E, Kvamme BO, Finstad B, Wennevik V, Diserud OH, Bateman A, Friedland KD, et al. 2018. Disentangling the role of sea lice on the marine survival of Atlantic salmon. Ices Journal of Marine Science