Om vinteren er utbredelsen av lodde i Barentshavet svært dynamisk i tid og rom. På denne tiden av året starter den modne lodda gytevandringen til kysten av Norge og Russland, og skilles dermed fra den umodne lodda. Siden det er vanskelig å dekke fordelingen av lodde på denne tid av året, baserer man bestandsvurderingen av lodde på data fra økosystemtoktet om høsten da fordelingen av lodde er bedre egnet for akustisk mengdemåling. Man bruker så en prediksjonsmodell for å beregne hvor stor del av bestanden som vil være igjen og tilgjengelig for fiske kommende vinter. Det har lenge blitt diskutert om et tokt om vinteren kan brukes for å forbedre nøyaktigheten av denne prediksjonen ved å estimere den modne delen av bestanden like før fiskeriet begynner. Estimat basert på eksperimentelle tokt om vinteren har så langt ikke gitt resultater som har vært gode nok til å oppfylle denne målsettingen. For å forbedre metodikken, trengs det mer informasjon om loddefordeling om vinteren. I denne rapporten har vi utforsket data på geografisk fordeling av lodde fra vintertoktet i Barentshavet i årene 2004-2017, et tokt som har torsk og hyse som målarter. Vi har brukt data fra akustikk, bunntrål og mageinnhold hos torsk til å studere endringer i fordelingsmønster og korrelasjoner mellom tettheter fra ulike datakilder i løpet av toktperioden (januar-mars), med en overordnet målsetting om å evaluere påliteligheten av slike data for loddeundersøkelser. Alle samplingmetoder unntatt akustikk viste at lodda flytter seg sørover fra januar til mars, og korrelasjonene mellom loddetettheter fra ulike datakilder varierte betydelig, noe som gjenspeiler vandringen. Våre resultater støtter hypotesen om at lodde kan vandre i de akustiske dødsonene, spesielt nær bunnen, mens den beveger seg mot kysten. Avviket mellom resultatene fra ulike samplingmetoder og variabiliteten i dataene økte gjennom perioden etter hvert som lodda flyttet seg sørover. Vi anbefaler videre analyser av vertikalfordelingen av lodde for å utforske i hvilken grad data fra bunntrål og akustikk kan kombineres for å mengdemåle lodde.
Capelin distribution in winter 2004-2017: spatiotemporal correlation between density estimates from different sampling methods
Report series:
Fisken og havet 2019-3
ISSN: 1894-5031
Published: 06.08.2019
Updated: 08.11.2025
Project No.: 84126
On request by: Faglig utvalg for ressursforskning (FUR)
Research group(s):
Demersal fish
,
Pelagic fish
,
Ecosystem processes
Subject:
Cod – Northeast Arctic,
Capelin in the Barents Sea
Program:
The Barents Sea and Arctic Ocean Ecosystems
Approved by:
Research Director(s):
Geir Huse
Program leader(s):
Maria Fossheim
Norsk sammendrag
Summary
The winter distribution of Barents Sea capelin is highly dynamic in space and time, as this is the time of year when mature individuals separate from the immatures and start their spawning migration to the Norwegian and Russian coasts. Due to the difficulty of sampling the entire distribution at this time of year, the stock assessment of capelin is based on data from the ecosystem survey in autumn when capelin has a more favourable distribution for acoustic abundance estimation. A stock projection model is then used to predict how much of the stock will be left and available for the fishery the coming winter. It has long been discussed if a winter survey could be used to improve accuracy of the stock prediction by estimating the maturing part of the stock just before the fishery starts. Estimations based on experimental winter surveys for capelin have so far not been able to achieve this goal. To improve on future attempts, more information on capelin distribution in winter is needed. Here we explore data on capelin distribution collected during the winter survey of the Barents Sea in 2004-2017, a survey primarily collecting data on cod and haddock. Using data from acoustics, demersal trawls, and cod stomachs, we study changes in capelin distribution patterns and correlations between densities from the different data sources during the January-March survey period, with the overarching aim of evaluating the reliability of data sources for capelin investigations. All sampling methods except acoustics showed that capelin shifted toward the south from January-March, and the correlations between capelin densities from different sampling methods varied substantially, reflecting this migration. We found support for the hypothesis that capelin may migrate in the acoustic dead zones, in particularly in the bottom zone, as they move closer to the coast. The discrepancy between sampling methods and variability in the data increased later in the period when capelin shifted south. We recommend further analysis on the vertical distribution of capelin to examine the possibility of combining demersal trawl and acoustic data for abundance estimation of maturing capelin.
1 - Background
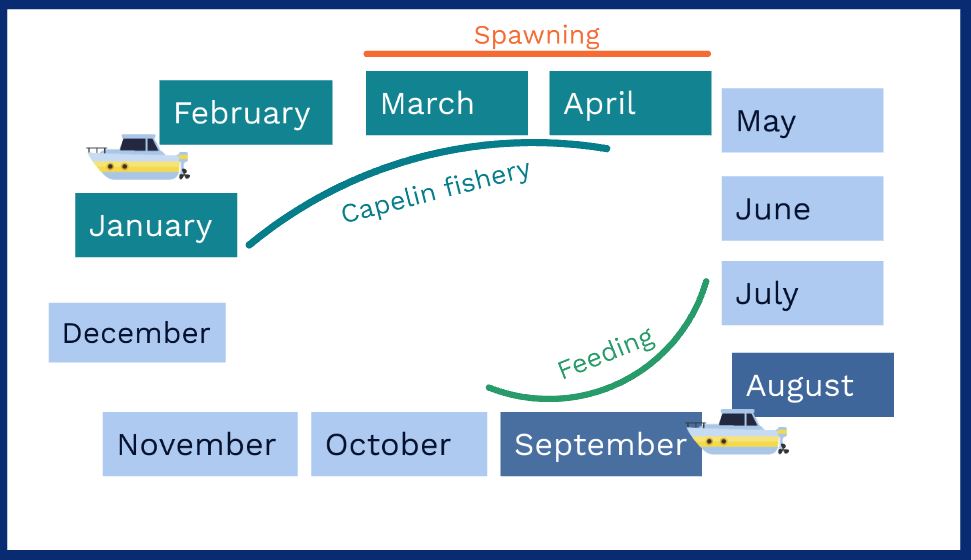
The fishery on Barents Sea capelin (Mallotus villosus) takes place at the time of maturation and subsequent spawning in January-April, while the stock is assessed based on data from the IMR-PINRO Joint Ecosystem survey that runs in August-September (Figure 1.1). This is mainly because the behaviour of capelin during the autumn feeding season is more suitable for acoustic estimation. In winter, mature capelin migrate to the Norwegian/Russian coasts to spawn, while the immatures stay behind farther north (Gjøsæter, 1998). The factors influencing the timing and route of migration is not fully understood, and capelin depth distribution, fat content, and mixing with other species may also differ from the autumn situation (Jangaard, 1974; Eriksen et al., 2009; Fall et al., 2018). As currently implemented, the capelin stock projection model therefore estimates the proportion of the stock that will survive though winter, in order to give advice on fishing quotas for the following year. This projection includes estimation of natural mortality caused by cod (Gadus morhua), the main predator on capelin (Bogstad and Gjøsæter, 1994). While this method has been largely successful (Gjøsæter et al., 2015), the idea of adjusting the stock estimate according to a winter survey remains interesting for fishers and managers, as it could reduce uncertainty around the estimate. Adjusting the estimate based on repeated surveys in winter has proven successful in Iceland, where the capelin spawning migration occurs over a relatively smaller area (Gjøsæter et al., 2002).
In an attempt at estimating the maturing part of the capelin stock with a dedicated survey in winter, Eriksen et al. (2009) concluded that the uncertainty around this estimate was much larger than for the projection based on ecosystem survey data. They also tried including acoustic data on capelin from the winter survey, which gathers data on cod and haddock for stock assessment, in their estimates, but this did not change their conclusions. They pointed out the challenge of surveying a large area before the fishery starts, especially if it is to be combined with the winter survey; combining the objectives of pelagic and demersal fish estimation is a challenge, while adding a new survey is costly and difficult to design due to the uncertainties regarding the timing of capelin spawning migrations.
Nevertheless, data on capelin distribution is collected during the winter survey, and while the quality of this data is lower than the ecosystem survey data, it does capture the overall trends of capelin distribution in winter (Fauchald et al., 2000; Fall et al., 2018). Other sampling methods than acoustics are also available from the winter survey; capelin are caught in demersal trawls and are frequently found in cod stomachs. Before we can fully assess the possibility of capelin abundance estimation in winter, it is important to understand how capelin distribution varies in time and space at this time of year. The objectives of this study were therefore to examine how the distribution of capelin assessed with different winter survey sampling methods differ, and how the spatial correlations between data sources changed throughout the January-March winter survey periods of 2004-2017. In appendices to this report, we also revisit the data from the 2007-2009 dedicated survey, mapping it together with winter survey and fishery data, and show results from 2016 and 2018 pilot projects collecting data on capelin in cod stomachs from fish landing facilities as a means of tracking the capelin spawning migration (Appendices 2-4).
2 - Methods
2.1 - Aim and choice of method
We analysed data on capelin distribution from demersal trawl hauls, cod stomachs, and acoustic registrations. The aim of the analyses was twofold; 1. To identify spatial and temporal variation in capelin distribution during the winter survey period from late January to late March, and 2. To calculate correlations between capelin density estimates from different sampling methods in the same time period. To achieve this aim, we took the following approach:
- Statistical modelling of capelin distribution from each data source: identifies how capelin distributions vary in space and time, accounting for interannual and diel sampling variation and large-scale spatial autocorrelation in the data.
- Standardization of capelin densities on a regular grid of the study area: places different-scaled capelin estimates at the same scale and harmonizes the geographic locations of values.
- Calculation of spatial and temporal correlation between grid predictions of capelin density.
The ability of trawl and acoustic methods to detect fish can vary with time of day due to, e.g., vertical migrations (Casey and Myers, 1998; Huse and Korneliussen, 2000; Ono et al., 2018), and there is additional variation in the geographic location and timing of trawl hauls and acoustic transects between years. We therefore considered it appropriate to first evaluate and control for this variation with statistical models (Thorson et al., 2016) before estimating the correlation (Step 1). Hjellvik et al. (2011) took a similar approach when calculating a joint variance estimate for cod densities from demersal trawl and acoustics. The scale of data collection is different for trawl and acoustics; cod stomach data and capelin trawl data come from the same demersal trawl hauls, spaced 15-35 nautical miles (nmi) apart, while the acoustic registrations are resolved at the much finer scale of 1 nmi. Data from the two sampling scales need to be compared for a given location in order to estimate the correlation, which we achieve by predicting capelin densities from the statistical models onto the regular grid (Steps 2 and 3). With the chosen approach, we study large-scale correlations between capelin distributions from different data sources, while leaving on-station correlations outside the scope of our analyses.
2.2 - Data selection
Data from Norwegian and Russian vessels participating in the winter survey 2004-2017 were used here (Table 2.1). Acoustic and demersal trawl data were extracted from the Norwegian Marine Data Center database using RStox (Holmin, 2018), while cod stomach data is available internally at IMR at U:\Assessmentforum\magedata. Data were organized in a long format, with one line representing an observation at a geographic location in a given year. For stomach data where several cod were sampled at each station, each line represented capelin in the stomach of a cod individual at a given station and year, and zeroes were constructed from stomachs that did not contain capelin. Data sampled north of approximately 78 degrees (or a northing of 200 nmi, using stereographic projection with centre in 75 N and 35 E) was excluded to get a more balanced data set, as these areas were sampled in the last years only. This excluded 1.4% of the total number of trawl stations, and 1.2% of scrutinized acoustic observations.
| Year | Vessel | Cruise number | Start date | End date | Total number of demersal trawl stations (number removed) |
2004 | G. O. Sars Johan Hjort Smolensk | 2004106 2004203 0090_2004_UFJJ_SMOLE | 02.02 31.01 24.02 | 10.03 14.03 09.03 | 360 (0) |
2005 | G. O. Sars Johan Hjort Smolensk | 2005104 2005203 0091_2005_UFJJ_SMOLE | 01.02 01.02 08.02 | 07.03 14.03 01.03 | 354 (0) |
2006 | G. O. Sars Johan Hjort | 2006103 2006203 | 01.02 01.02 | 10.03 14.03 | 268 (0) |
2007 | G. O. Sars Johan Hjort | 2007103 2007203 | 12.02 04.02 | 14.03 11.03 | 268 (0) |
2008 | Johan Hjort Jan Mayen Fridtjof Nansen Smolensk | 2008202 2008701 0101_2008_UANA_NANSE 0102_2008_UFJJ_SMOLE | 02.02 02.02 05.02 27.01 | 13.03 05.03 24.02 11.02 | 239 (0) |
2009 | Johan Hjort Jan Mayen Fridtjof Nansen Vilnyus | 2009202 2009701 0104_2009_UANA_NANSE 0121_2009_UFJN_VILNY | 08.02 02.02 26.02 27.02 | 12.03 06.03 04.03 12.03 | 334 (0) |
2010 | Johan Hjort Jan Mayen Fridtjof Nansen | 2010202 2010701 0122_2010_UANA_NANSE | 07.02 03.02 27.02 | 16.03 04.03 10.03 | 367 (0) |
2011 | Johan Hjort Jan Mayen Fridtjof Nansen | 2011202 2011702 0108_2011_UANA_NANSE | 05.02 01.02 03.02 | 13.03 28.02 18.02 | 384 (0) |
2012 | Helmer Hanssen Libas Fridtjof Nansen | 2012839 2012841 0111_2012_UANA_NANSE | 24.01 24.02 02.05 | 20.02 14.03 17.02 | 293 (0) |
2013 | Johan Hjort Vilnyus | 2013201 0113_2013_UFJN_VILNY | 01.02 08.02 | 14.03 02.03 | 297 (0) |
2014 | Johan Hjort Helmer Hanssen Fridtjof Nansen | 2014202 2014805 0114_2014_UANA_NANSE | 31.01 22.01 30.01 | 11.03 02.03 17.02 | 475 (17) |
2015 | Johan Hjort Helmer Hanssen Fridtjof Nansen | 2015202 2015841 0120_2015_UANA_NANSE | 28.01 21.01 03.02 | 12.03 15.02 02.03 | 356 (14) |
2016 | Johan Hjort Helmer Hanssen Fridtjof Nansen | 2016202 2016846 0123_2016_UANA_NANSE | 24.01 28.01 05.02 | 12.03 08.02 26.02 | 425 (23) |
2017 | G. O. Sars Johan Hjort | 2017102 2017201 | 07.02 18.01 | 24.03 23.02 | 308 (14) |
2.3 - Preparation of data for analysis
To study within-year temporal correlations between sampling methods, four periods of data collection were defined (Table 2.2). The length of these periods was set to minimize the computational cost of the more complex cod stomach data sets, while still giving information on changes during the survey period. The proportion of samples taken in each period varied between years, and the survey started earlier in later years (Table 2.2.). Capelin distribution during period 1 could therefore only be inferred based on distributions in later years, adding some uncertainty.
Year | Period 1: 21/1-31/1 | Period 2: 1/2-15/2 | Period 3: 16/2-29/2 | Period 4: 1/3-23/3 |
2004 | 0 | 0.30 | 0.32 | 0.38 |
2005 | 0 | 0.31 | 0.45 | 0.24 |
2006 | 0 | 0.18 | 0.38 | 0.44 |
2007 | 0 | 0.29 | 0.58 | 0.13 |
2008 | 0 | 0.26 | 0.55 | 0.20 |
2009 | 0 | 0.29 | 0.39 | 0.32 |
2010 | 0 | 0.32 | 0.36 | 0.32 |
2011 | 0 | 0.58 | 0.37 | 0.06 |
2012 | 0.19 | 0.43 | 0.23 | 0.14 |
2013 | 0 | 0.42 | 0.35 | 0.23 |
2014 | 0.18 | 0.51 | 0.22 | 0.09 |
2015 | 0.25 | 0.25 | 0.28 | 0.23 |
2016 | 0.15 | 0.37 | 0.32 | 0.16 |
2017 | 0.18 | 0.26 | 0.07 | 0.50 |
Total | 0.07 | 0.35 | 0.34 | 0.24 |
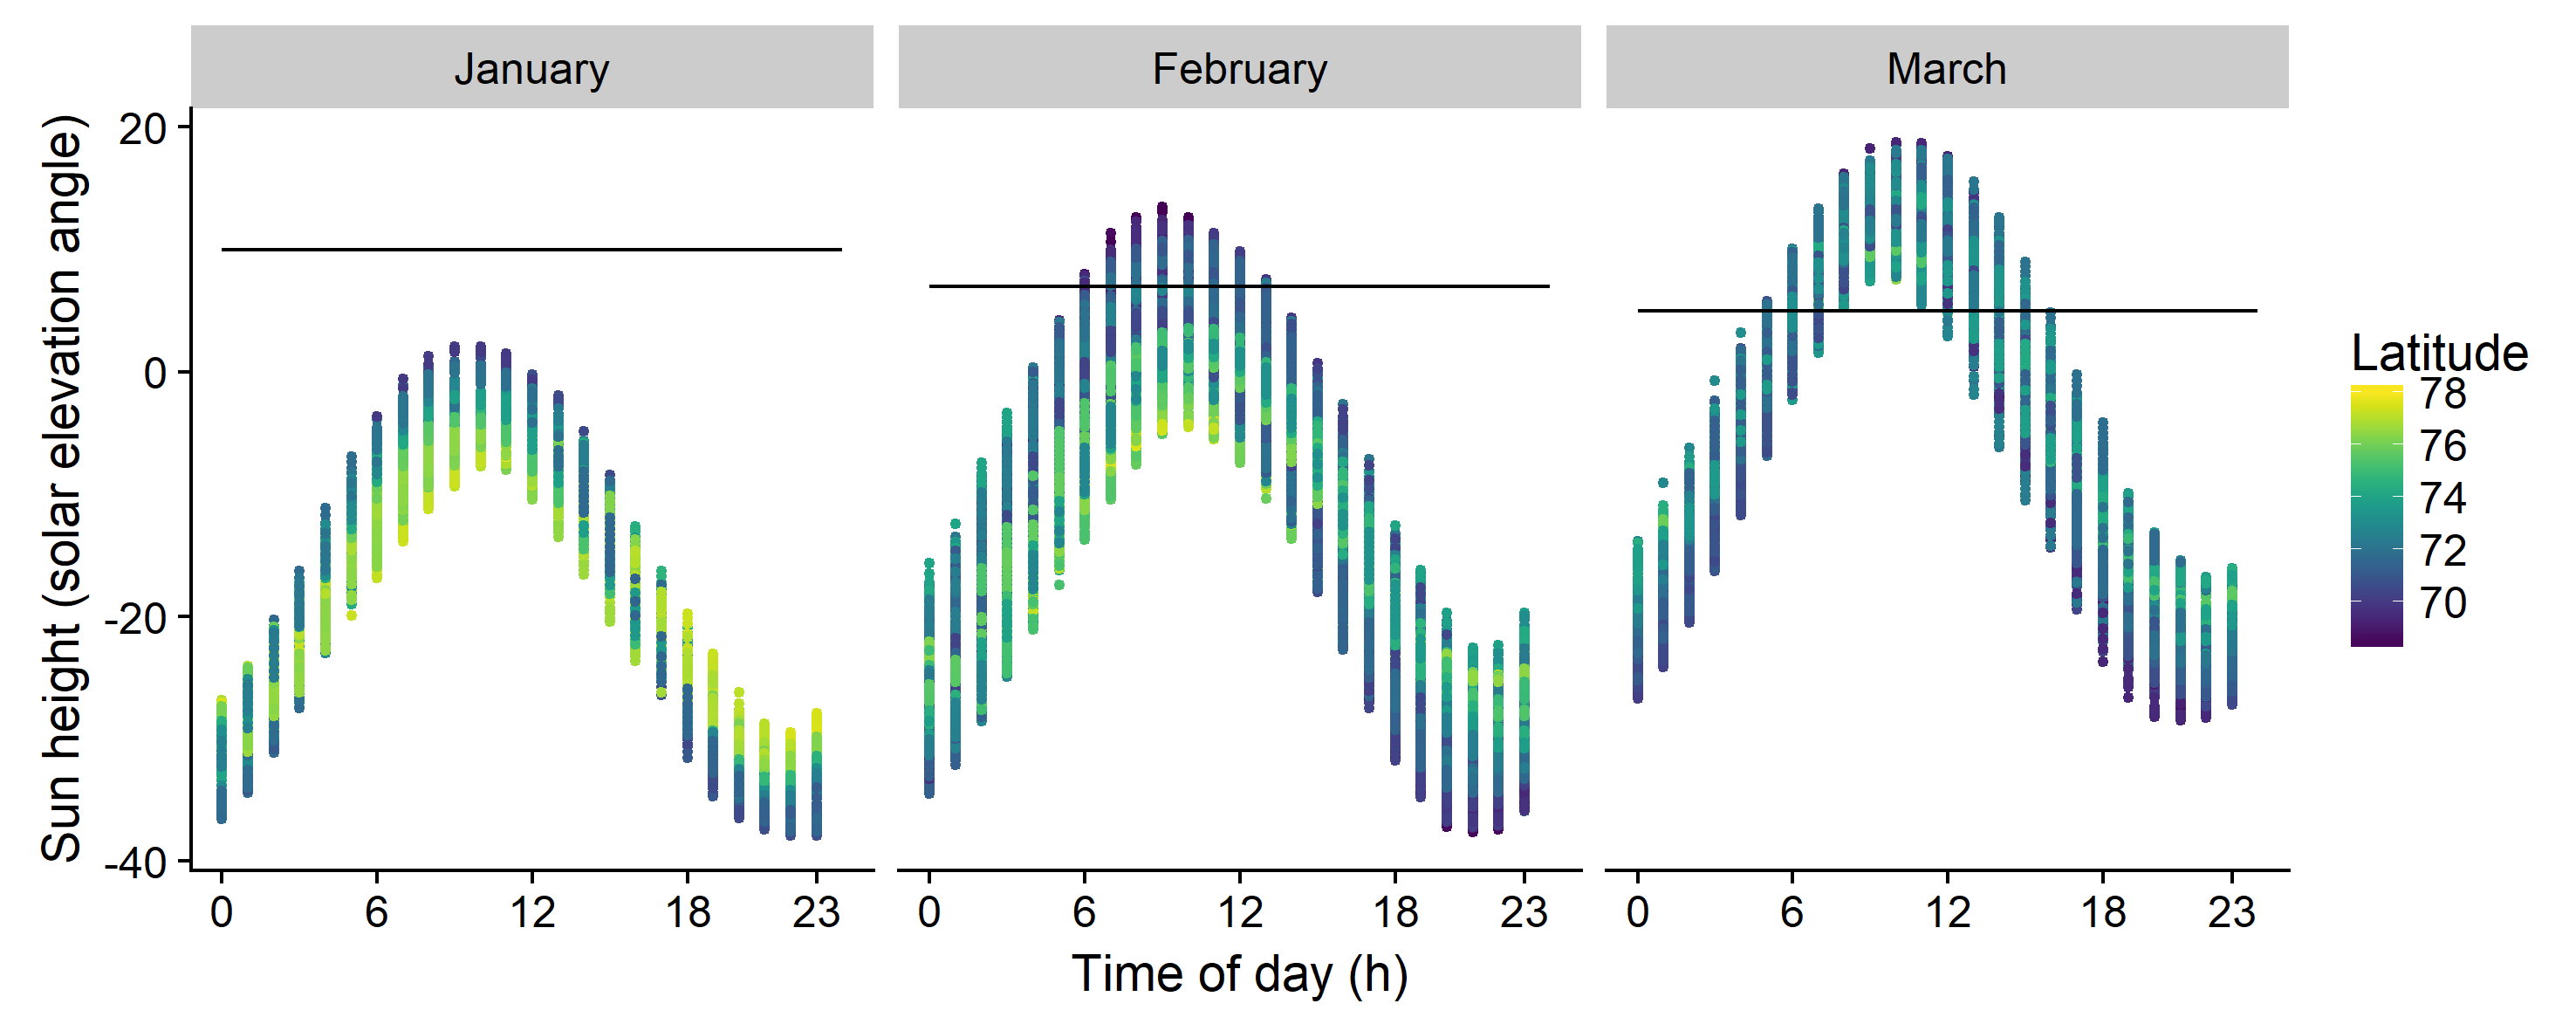
The geographical coordinates in decimal degrees were converted to polar stereographic projection with centre in 35 E and 75 N and expressed in deviation from this position in nautical miles. This projection limits high-latitude distortion when results are plotted on a map and are better suited for statistical modelling (Budic et al., 2016). To account for the large variation in light conditions during the winter survey (Figure 2.1), which may affect the behaviour of organisms and their availability to different sampling gear, the solar elevation angle was calculated from the geographical position, day of the year and sampling time and included as a covariate in the models. Acoustic capelin densities were summed for all depth channels, and capelin densities from the demersal trawl were expressed as number of individuals per distance trawled (ind/nmi). Cod stomach data were divided into one data set for immature cod and one for mature cod, as these components have partly different distributions in winter (Bergstad et al., 1987; Hylen et al., 2008; Fall et al., 2018). For this we used a breaking point at age ≥ 7 years old, approximating the age at 50 % maturity (ICES, 2017). In the immature cod data set, three fish with weights above 5000 grams were excluded as outliers. A presence/absence variable was created for each data source.
2.4 - Statistical modelling
Species distributions were modelled with variable-coefficient Generalized Additive Models (GAM) in R version 3.4.3 (R Core Team, 2018) using the package mgcv (Wood, 2006; Wood, 2011). The variable-coefficient formulation allows assessment of change in spatial distributions with respect to a variable, in this case with respect to time as expressed by the period variable (e.g., Bacheler et al., 2009). A two-step modelling approach (delta-GAM, e.g., Grüss et al., 2014) was used since the data contained many zeroes, i.e., first the presence/absence of capelin was modelled (Equation 1), and thereafter, the density of capelin (Equation 2) using presence-only data. Predictions of capelin density at a given location was then corrected for the probability of occurrence by multiplying predictions from the two models for each data source (see section 2.5).
For acoustics and demersal trawl, capelin distributions were modelled as:
![]()
![]()
Where P(x,y),t is the presence/absence of capelin in position x,y (easting, northing) in year t modelled with a binomial distribution, D(x,y),t is the log-transformed density of capelin in presence-only areas modelled with a gaussian distribution, αt is the intercept in year t that accounts for overall differences in capelin abundance between years, and s1-3 are smooth functions of geographical coordinates, geographical position by period (variable coefficient), and solar elevation angle, respectively. ε(x,y),t is the residual error term in a given location and year. The smooth function of solar elevation angle (s3) evaluates the contribution of light conditions to variation in capelin density across space, while the smooths involving geographical coordinates account for large-scale spatial autocorrelation in the data (s1) and describe changes in distribution over the survey periods (s2). We thus accounted for between-year variation in the analyses with αt, but the primary focus was to study trends in variation during the sampling period across years.
For the evaluation of capelin in cod stomachs, the response variable was the presence/absence (P(x,y),t, Equation 3) or log mass (mass > 0, M(x,y),t, Equation 4) of capelin in the stomach of cod i. The models included a random effect of station (specified with argument bs = “re” in the GAM call) to account for correlation between cod caught at the same station. Cod weight was also included as a predictor, since larger cod can eat a larger mass of capelin and because the diet of cod changes with size (Dolgov et al., 2011).
![]()
![]()
Acoustic and cod stomach data were modelled with function bam instead of gam since the former is more efficient for large data sets. The models were kept as fitted without removal of non-significant variables, as the goal was to describe distributions, rather than inferring habitat use or species interactions.
2.5 - Construction of a prediction grid
A regular grid with a spatial resolution of 15 nmi was constructed using the function expand.grid in base R and the following range of covariates, which matched the common range of covariates for the demersal trawl, acoustics, and stomach data. To avoid excessive extrapolation outside the data range, we excluded period-year and period-sun height combinations that did not exist in the data:
- Year: 2004-2017
- Easting (distance from 35 E, nmi): -359 – 263, 15 nmi resolution
- Northing (distance from 75 N, nmi): -379 – 196, 15 nmi resolution
- Period: 1-4 (2012, 2014-2017), 2-4 (2004-2011, 2013)
- Sun height: -36.3 – 0.7 (period 1), -36.2 – 6.9 (period 2), -32.8 – 1.8 (period 3), -26.8 – 7.9 (period 4), 3-degree resolution
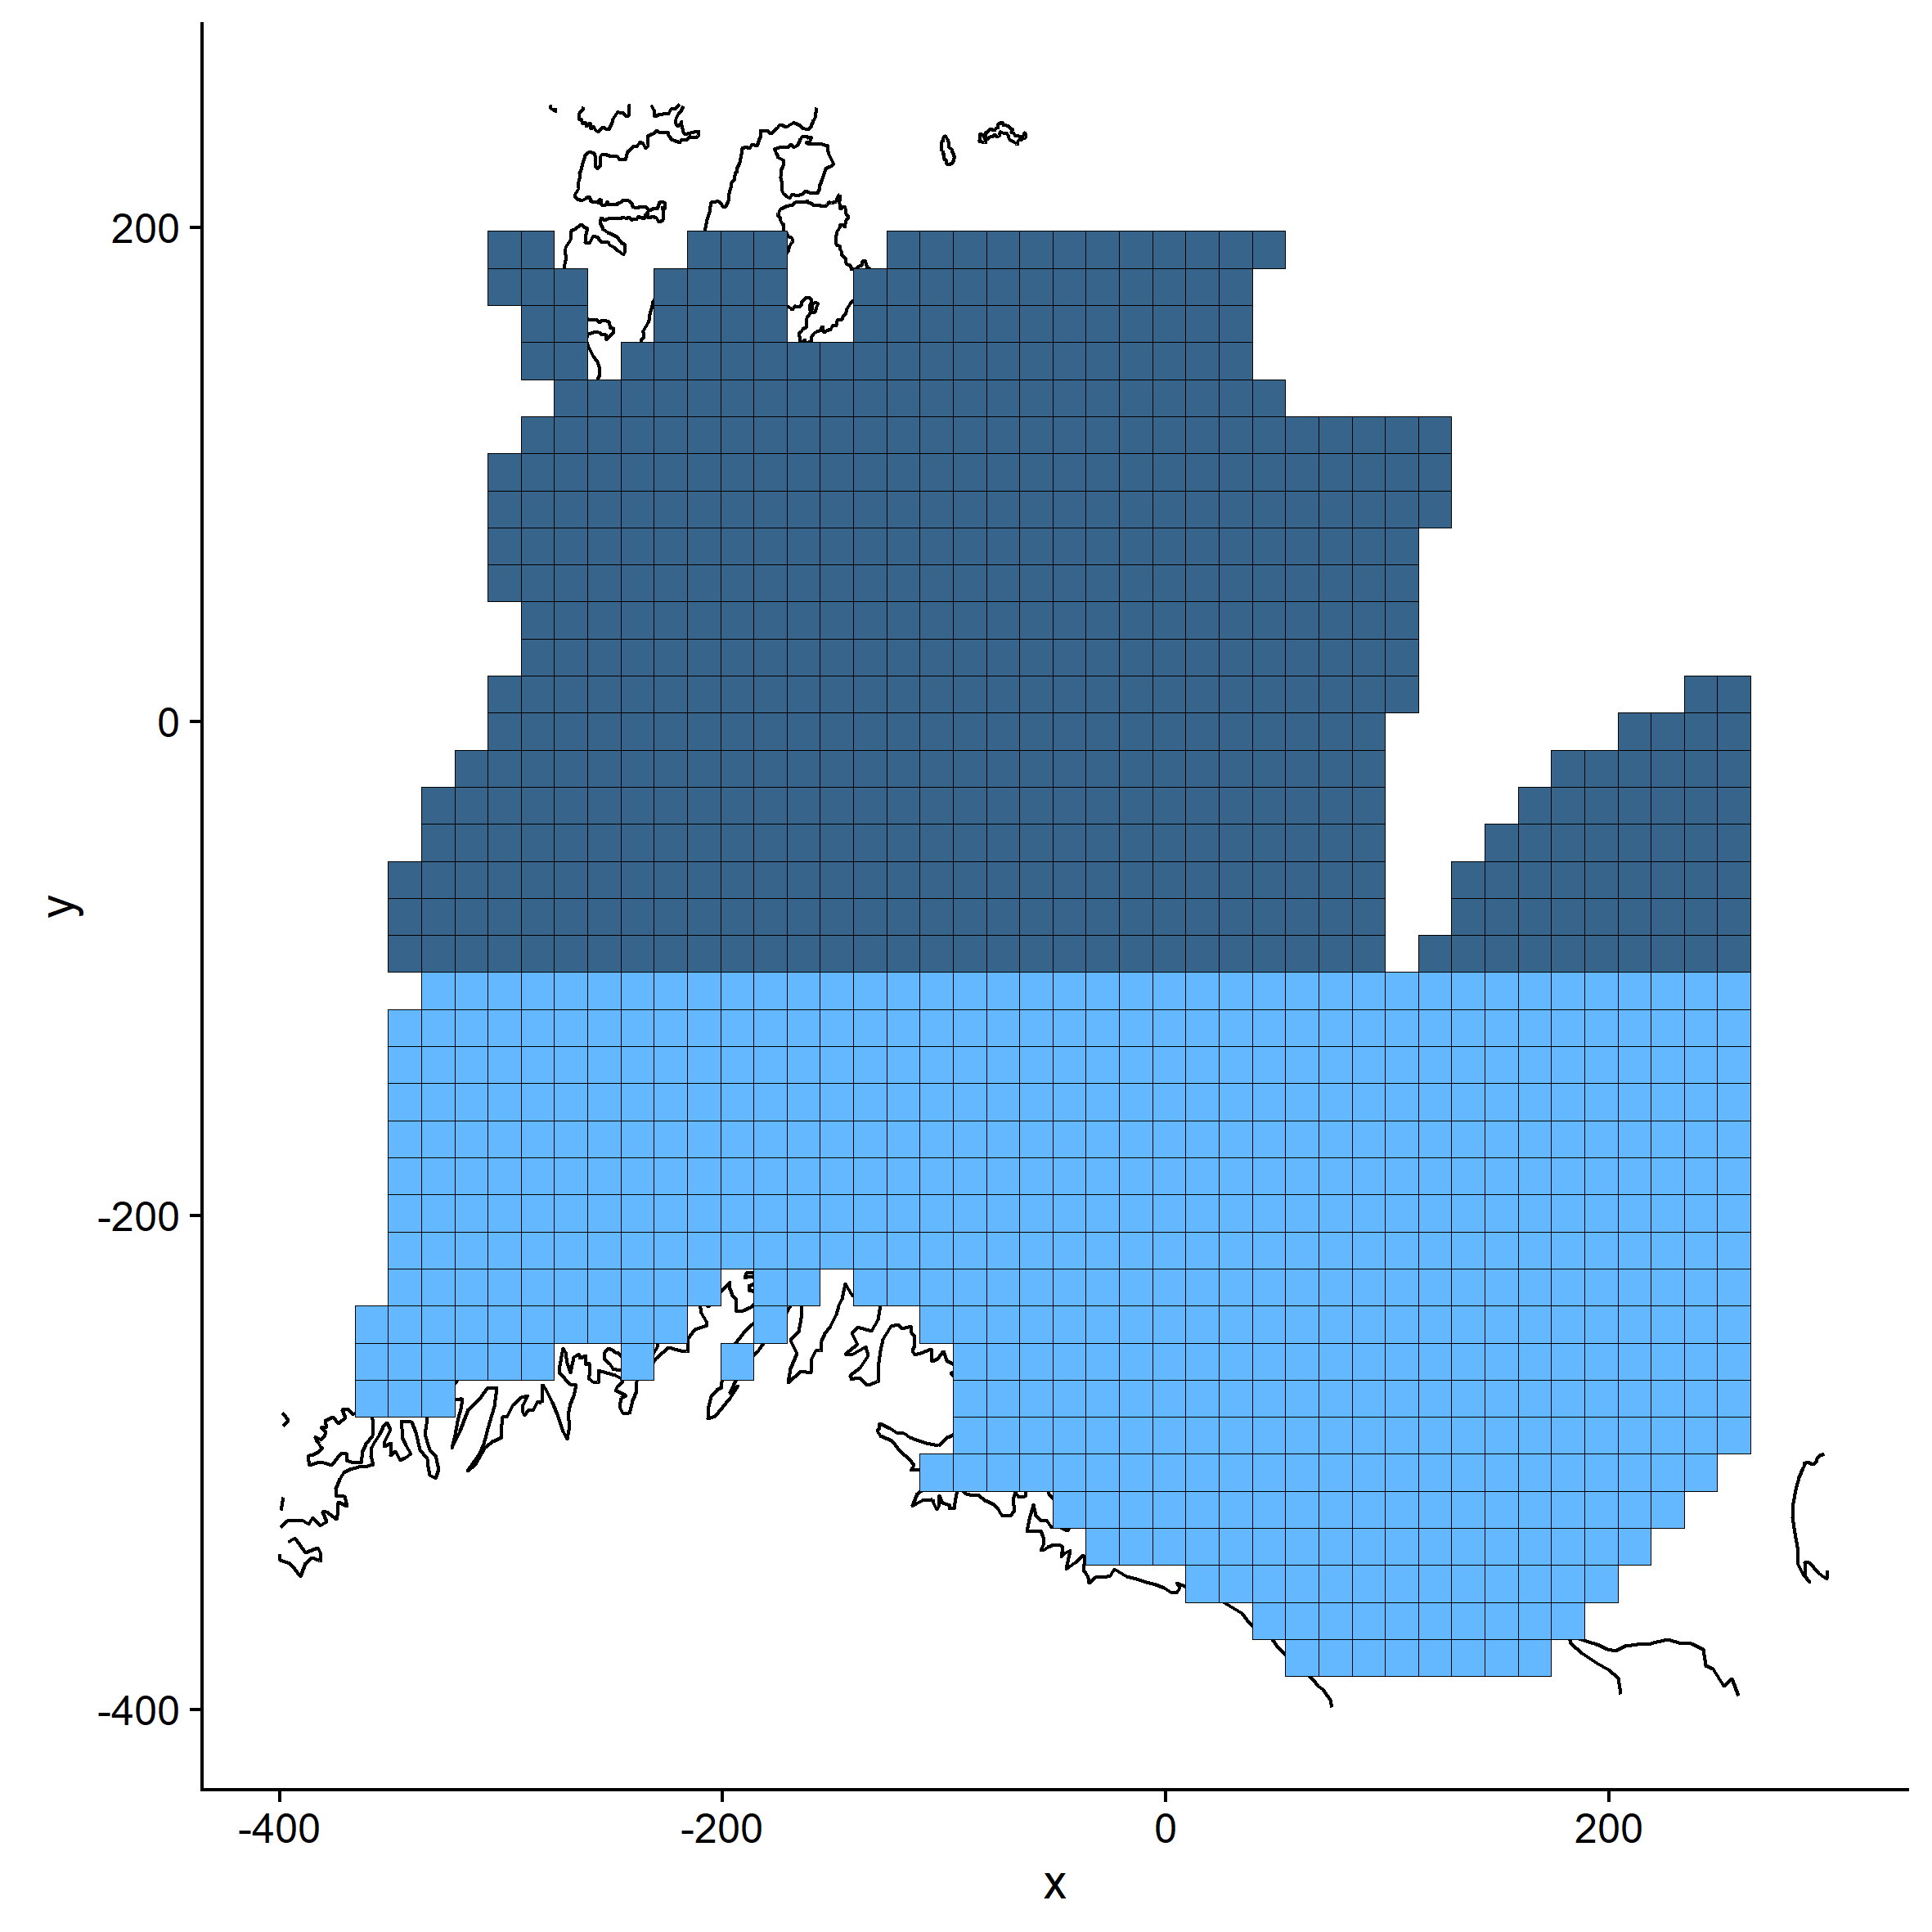
R-package sp (Bivand et al., 2008) was used to crop coastal contours from the grid, so that no grid points were placed on land. In addition, ocean areas that had not been sampled (mainly due to ice cover) were removed from the grid to avoid prediction in areas where the models had not been given any data. All grid points (illustrated as cells in Figure 2.2) were coded as south or north, indicating whether they were situated south of 73 N (< -100 northing) or north of this position. This was used to evaluate whether the correlation between data sources differed in these areas, as different components of the capelin stock is distributed in the south and north in winter (Appendix 1). The breaking point at 73 N was chosen as it gave a balanced division of grid cells.
For each data source, the respective GAMs were used to predict the probability of occurrence, P(x,y), and log density D(x,y) or log mass M(x,y) of capelin at each grid point using the function predict.gam or predict.bam. Cod weight was set to 1000 g for prediction of capelin in immature cod stomachs, and to 5000 g for capelin in mature cod stomachs. The random effect of station was zeroed out during prediction using the exclude-argument in predict.bam. Finally, the probability and log density (mass) predictions were multiplied to get the log density (mass) of capelin in each grid point, Y(x,y), corrected for the probability of occurrence:
![]()
2.6 - Correlations and indices
2.6.1 Indices describing capelin distribution
The main distribution area for each sampling method, year, and period was defined as the region containing the mid 75% quantile range of predicted capelin density/mass, delimited by the weighted 12.5% and 87.5% quantiles of eastings (xi) and northings (yi). Similarly, the centre of gravity (x*, y*) for each sampling method, year, and period was calculated as weighted means of eastings and northings from the grid predictions:

Where Y(x,y) is the predicted log capelin density/mass in grid point x,y from equation 5.
2.6.2 Correlations between sampling methods
For all combinations of sampling methods, correlations (Kendall’s tau) between the predicted capelin densities Y(x,y) were calculated by year, period and area (south/north) to describe trends during the January-March sampling period. Means of these yearly correlations were also calculated for each sampling method and area.
3 - Results
3.1 - Distribution of capelin by sampling method
3.1.1 - Model statistics
The probability of sampling capelin varied in space and spatially by period for all sampling methods, and with solar elevation angle for acoustics, demersal trawl, and capelin in immature cod stomachs (Table 3.1). The density of capelin measured with acoustics and demersal trawls also varied in space, spatially by period, and with solar elevation angle, while the mass of capelin in immature cod stomachs only varied significantly in space and with cod weight (Table 3.1). The mass of capelin in mature cod stomachs only varied significantly with cod weight.
Table 3.1: GAM statistics for the distribution of capelin from each sampling method. In the Delta-GAM step column, 1 represents the presence/absence (binomial distribution) models, and 2 the abundance in presence areas (log-normal) models. In the model formula, bold font indicates a non-significant covariate (p > 0.05). N is the sample size; for demersal trawl data this is equal to the number of trawl stations. For acoustic data, it is the total number of scrutinized 1-5 nmi segments, and for cod stomach data, N is the total number of sampled cod at the demersal trawl stations. Scale est. is the scale parameter; it is by definition 1 for binomial models, while it represents the squared residual standard error in the log-normal models. Dev % is the percentage of the total deviance explained by the model. Sun = solar elevation angle, Stn = station number, W = cod weight.
| Data source | Delta-GAM step | Model formula | N | Scale est. | Dev % |
| Acoustics | 1 | 109775 | 1 | 30.5 | |
| 2 | 41875 | 2.78 | 39.2 | ||
| Demersal trawl | 1 | 4655 | 1 | 18.1 | |
| 2 | 3291 | 3.16 | 32.4 | ||
| Immature cod stomachs | 1 |  | 29008 | 1 | 32.3 |
| 2 |  | 8305 | 1.62 | 56.5 | |
| Mature cod stomachs | 1 |  | 11837 | 1 | 37.3 |
| 2 |  | 4162 | 1.83 | 58.4 |
3.1.2 - Modelled distributions by period
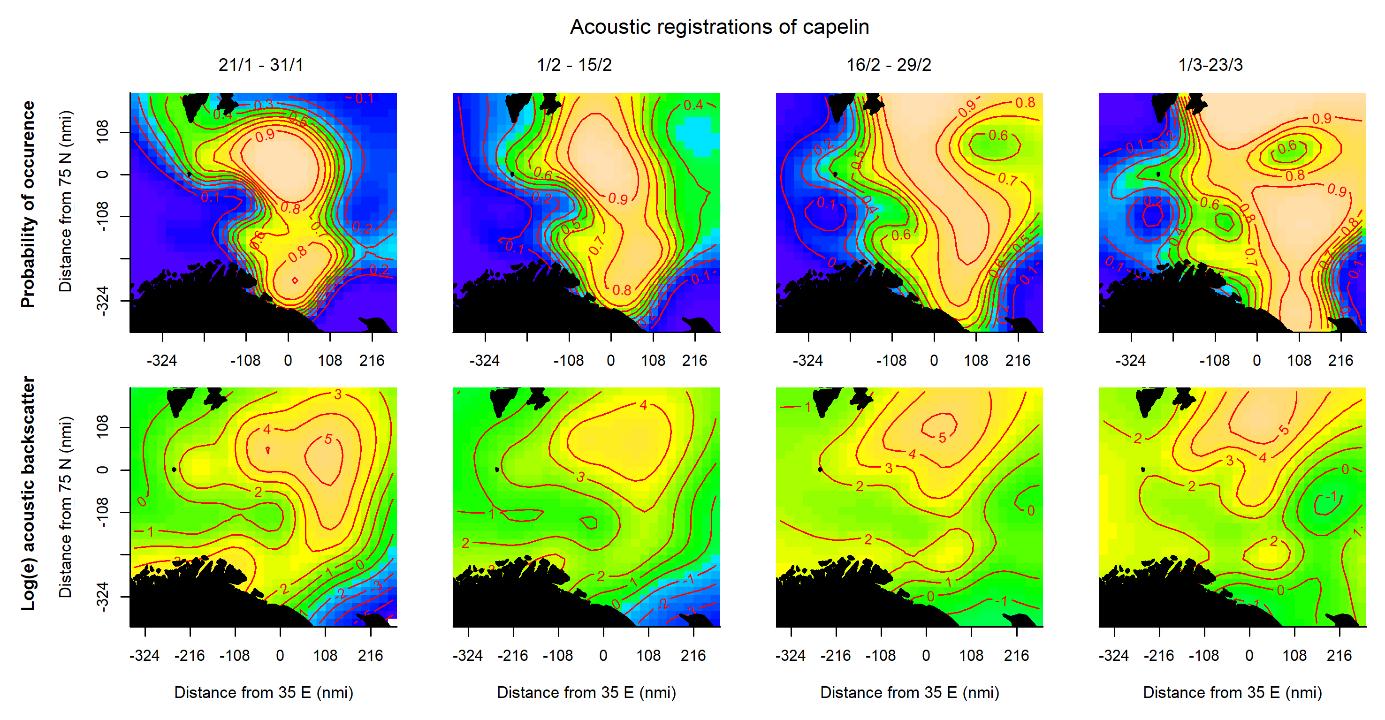
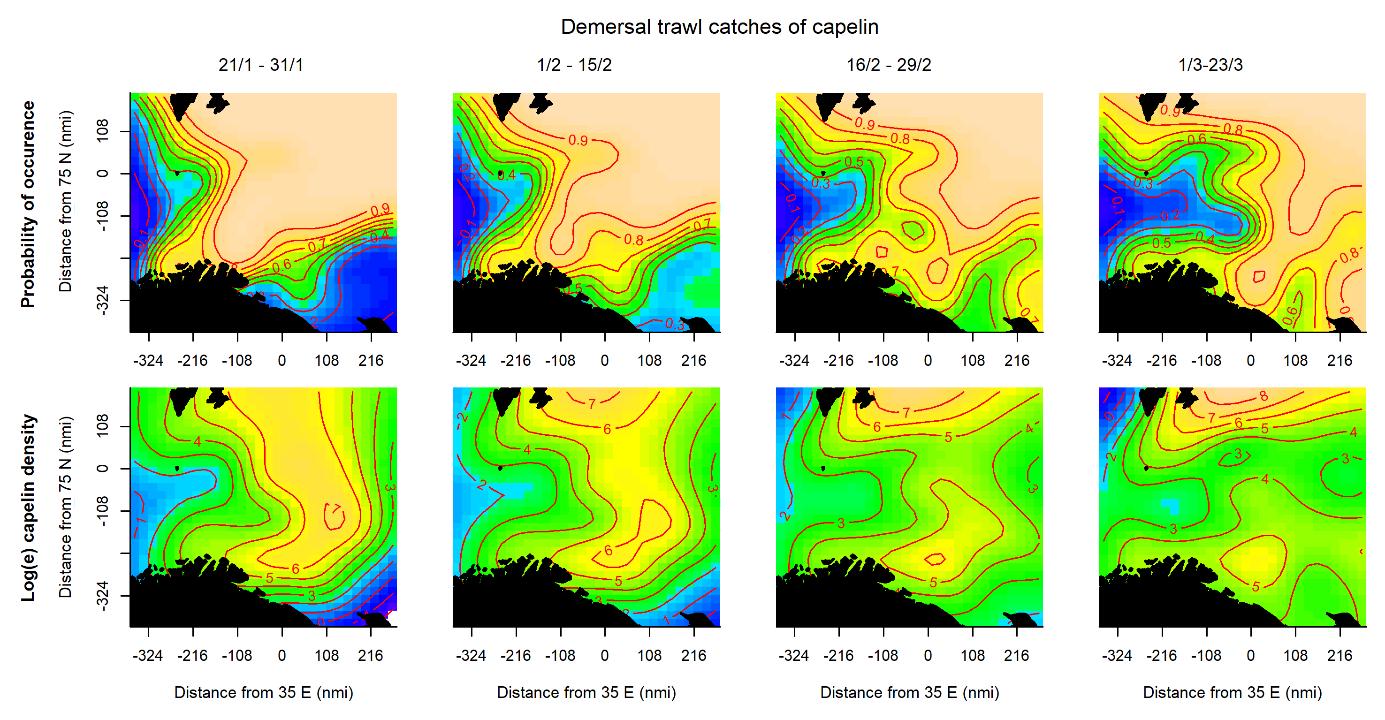
The probability of capelin occurrence measured by acoustics was highest in the northern and central parts of the area (Fig. 3.1, upper panel), while the highest acoustic densities occurred in the north with a smaller density peak along the Norwegian and Russian coasts (Fig. 3.1, lower panel). The high probability area expanded to the north and east during the survey period. The probability of catching capelin in the demersal trawl was initially high in most of the area, but the area contracted and shifted eastwards later in the survey, both in the north and along the Norwegian and Russian coasts (Fig. 3.2, upper panel). High densities were initially caught in an area stretching from south to north through the eastern Barents Sea, while later periods saw the highest densities in the north and a smaller density peak in the south (Fig. 3.2, lower panel).
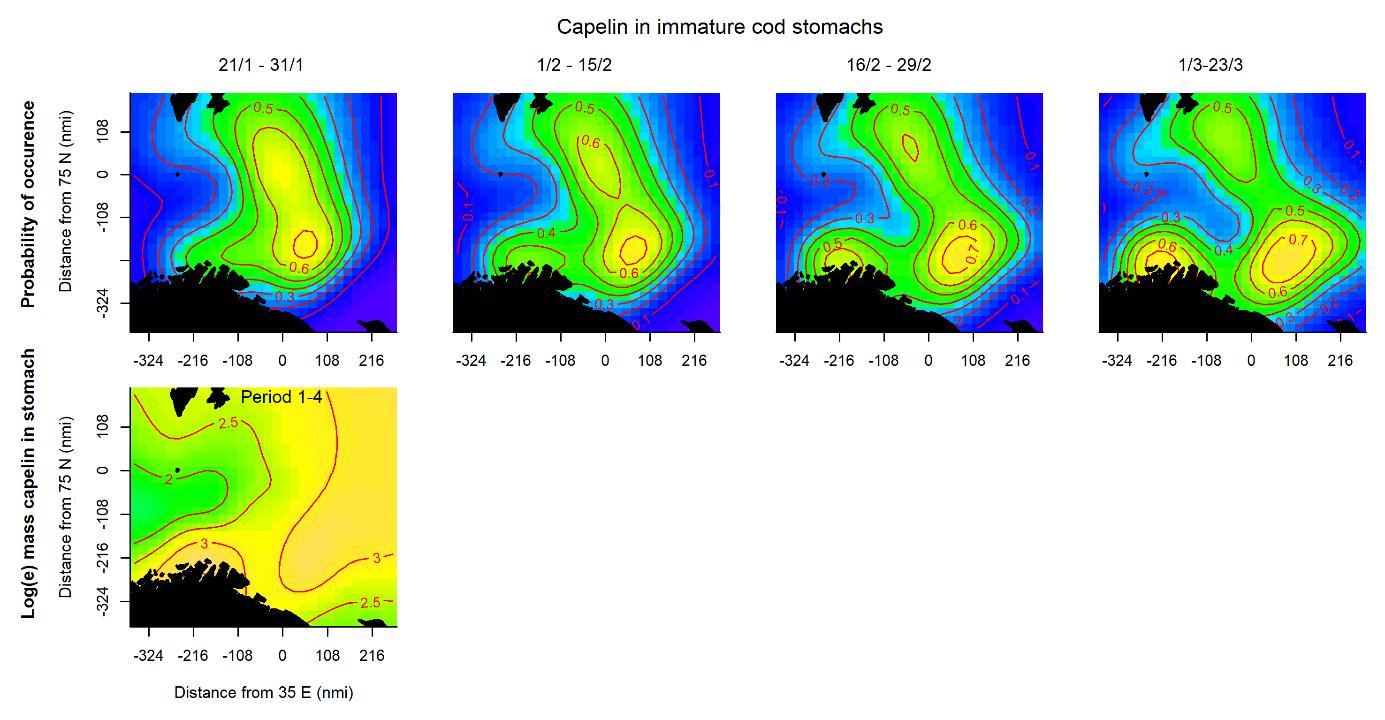
For capelin in immature cod stomachs, the probability of occurrence was initially highest in an area stretching through the central Barents Sea (Fig. 3.3, upper panel). Later in the survey, the probability increased along the southwestern coast, and farther offshore in the southeast. The spatial pattern of the amount of capelin eaten did not change during the survey period, and largely corresponded to the areas of high probability (Fig. 3.3, lower panel).
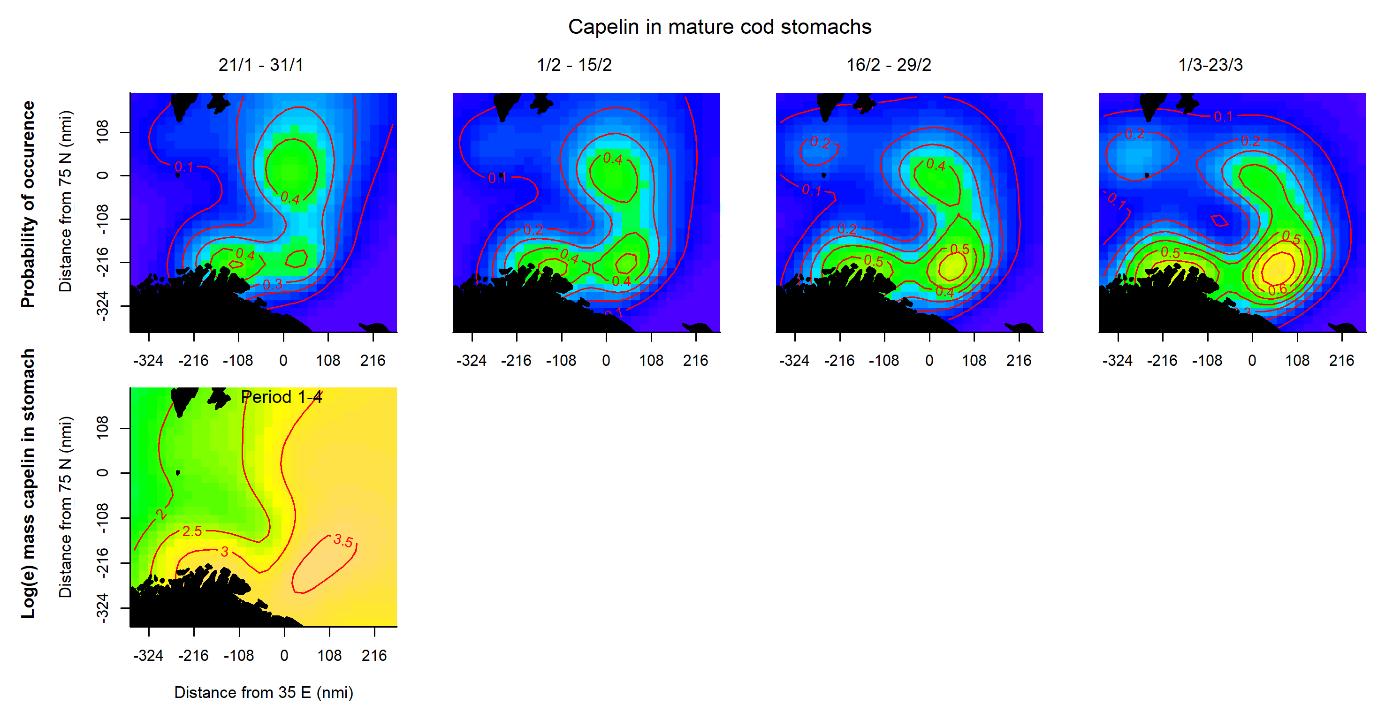
The probability of capelin occurring in mature cod stomachs was generally lower than the probability of occurrence in immature cod stomachs, especially in the northern part of the surveyed area (Fig. 3.4, upper panels). However, the main areas of occurrence in the south and the change throughout the periods were similar. For mature cod stomachs, too, the spatial pattern of the amount of capelin eaten did not change during the survey period (Fig. 3.4, lower panel).
3.1.3 - Diel variations in capelin sampling probability and density
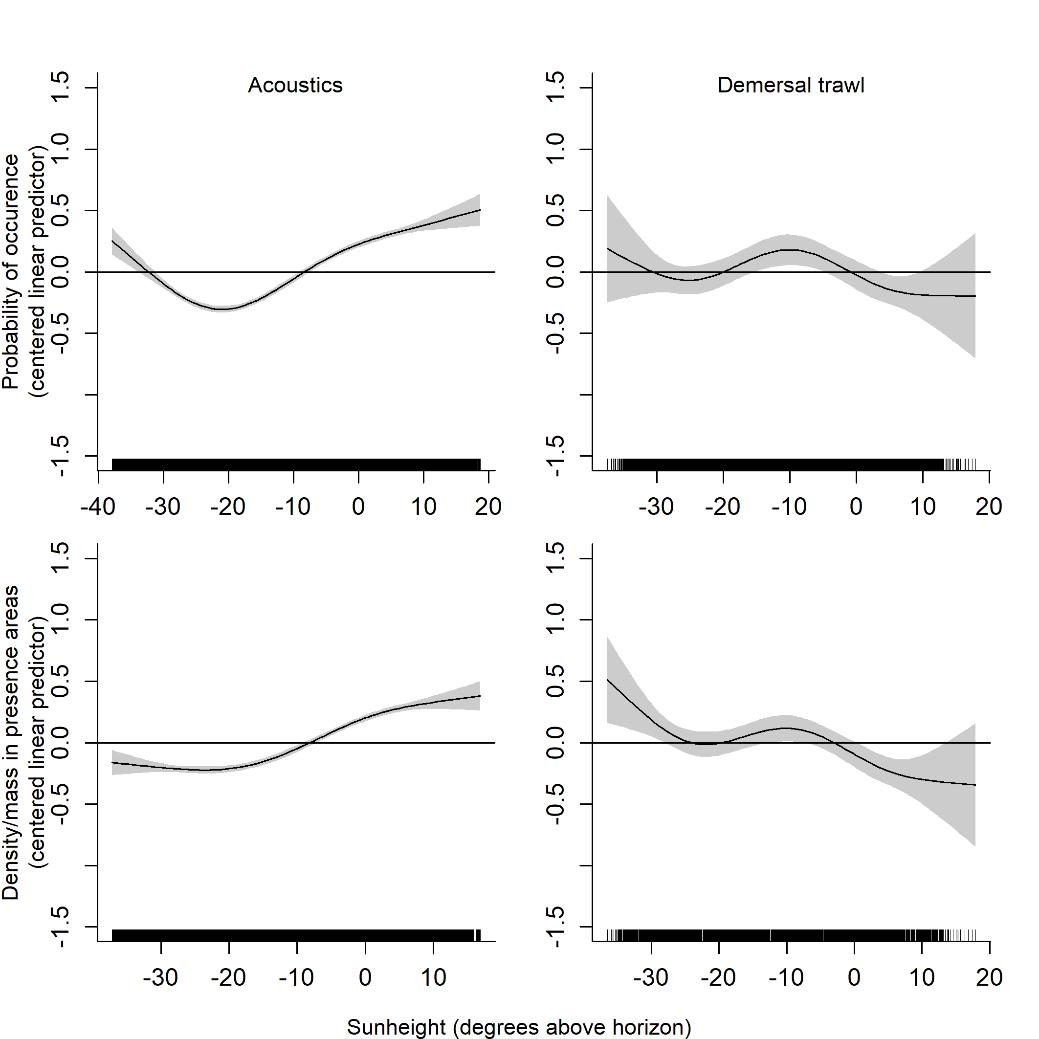
The probability of detecting capelin acoustically was higher during lighter hours (larger solar elevation angles, Figure 3.5), coinciding with higher densities. For demersal trawl catches, the effect was weaker, but there was a tendency towards higher probabilities around dawn/dusk and higher densities around dawn/dusk and at night. Sun height was not a significant predictor of the probability or amount of capelin in cod stomachs.
3.1.4 - Effect of cod weight on feeding probability and amount of capelin in stomachs
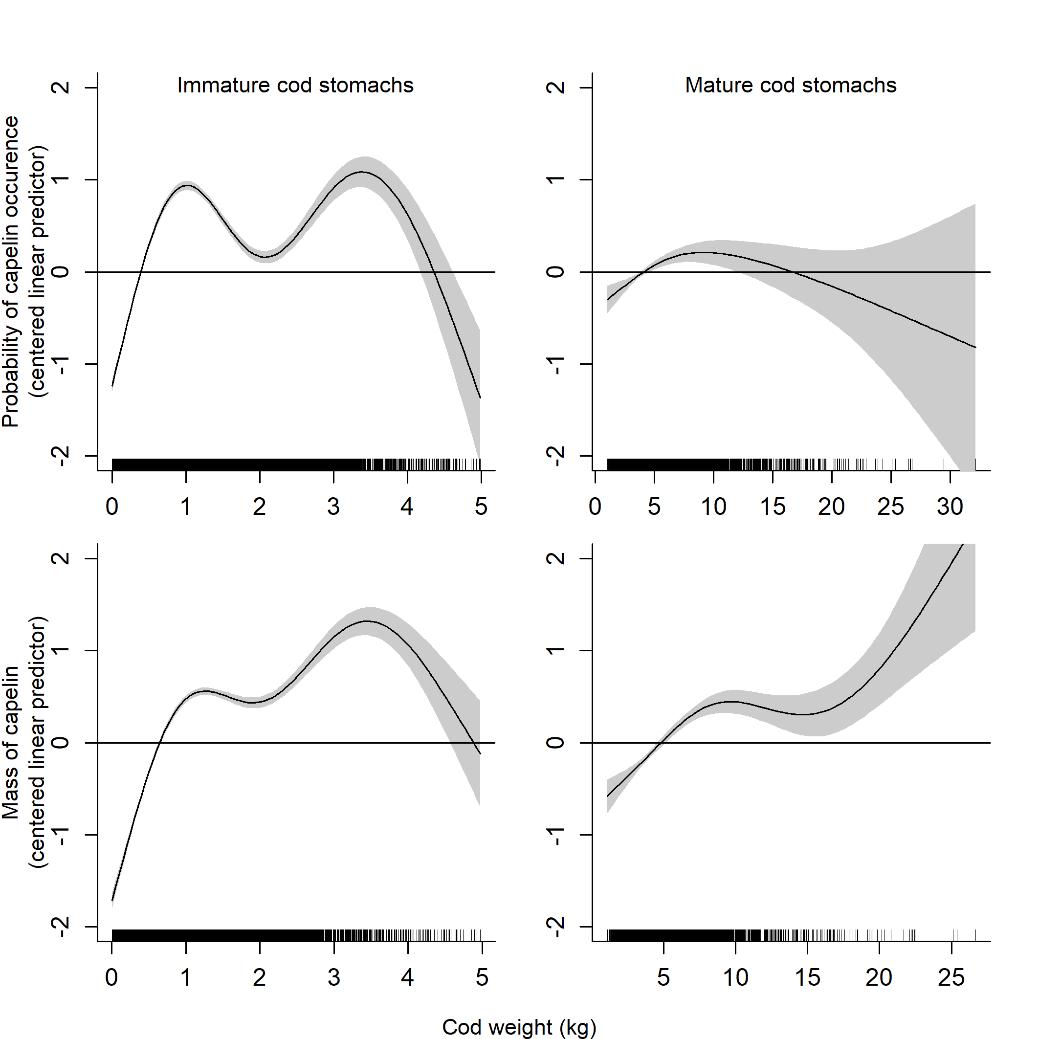
The probability of finding capelin in stomachs of immature cod was bimodal, with higher probabilities for cod around 1 kg and 4 kg and lower for those in between (Figure 3.6). In mature cod stomachs, the probability of finding capelin initially increased with cod weight, but above approximately 10 kg the variation was very large, suggesting that a large proportion of the individuals had fed on other prey than capelin. The mass of capelin in stomachs generally increased with cod weight, except for in immature cod above 4 kg where it decreased with increasing cod weight.
3.1.5 - Main distribution area and centre of gravity
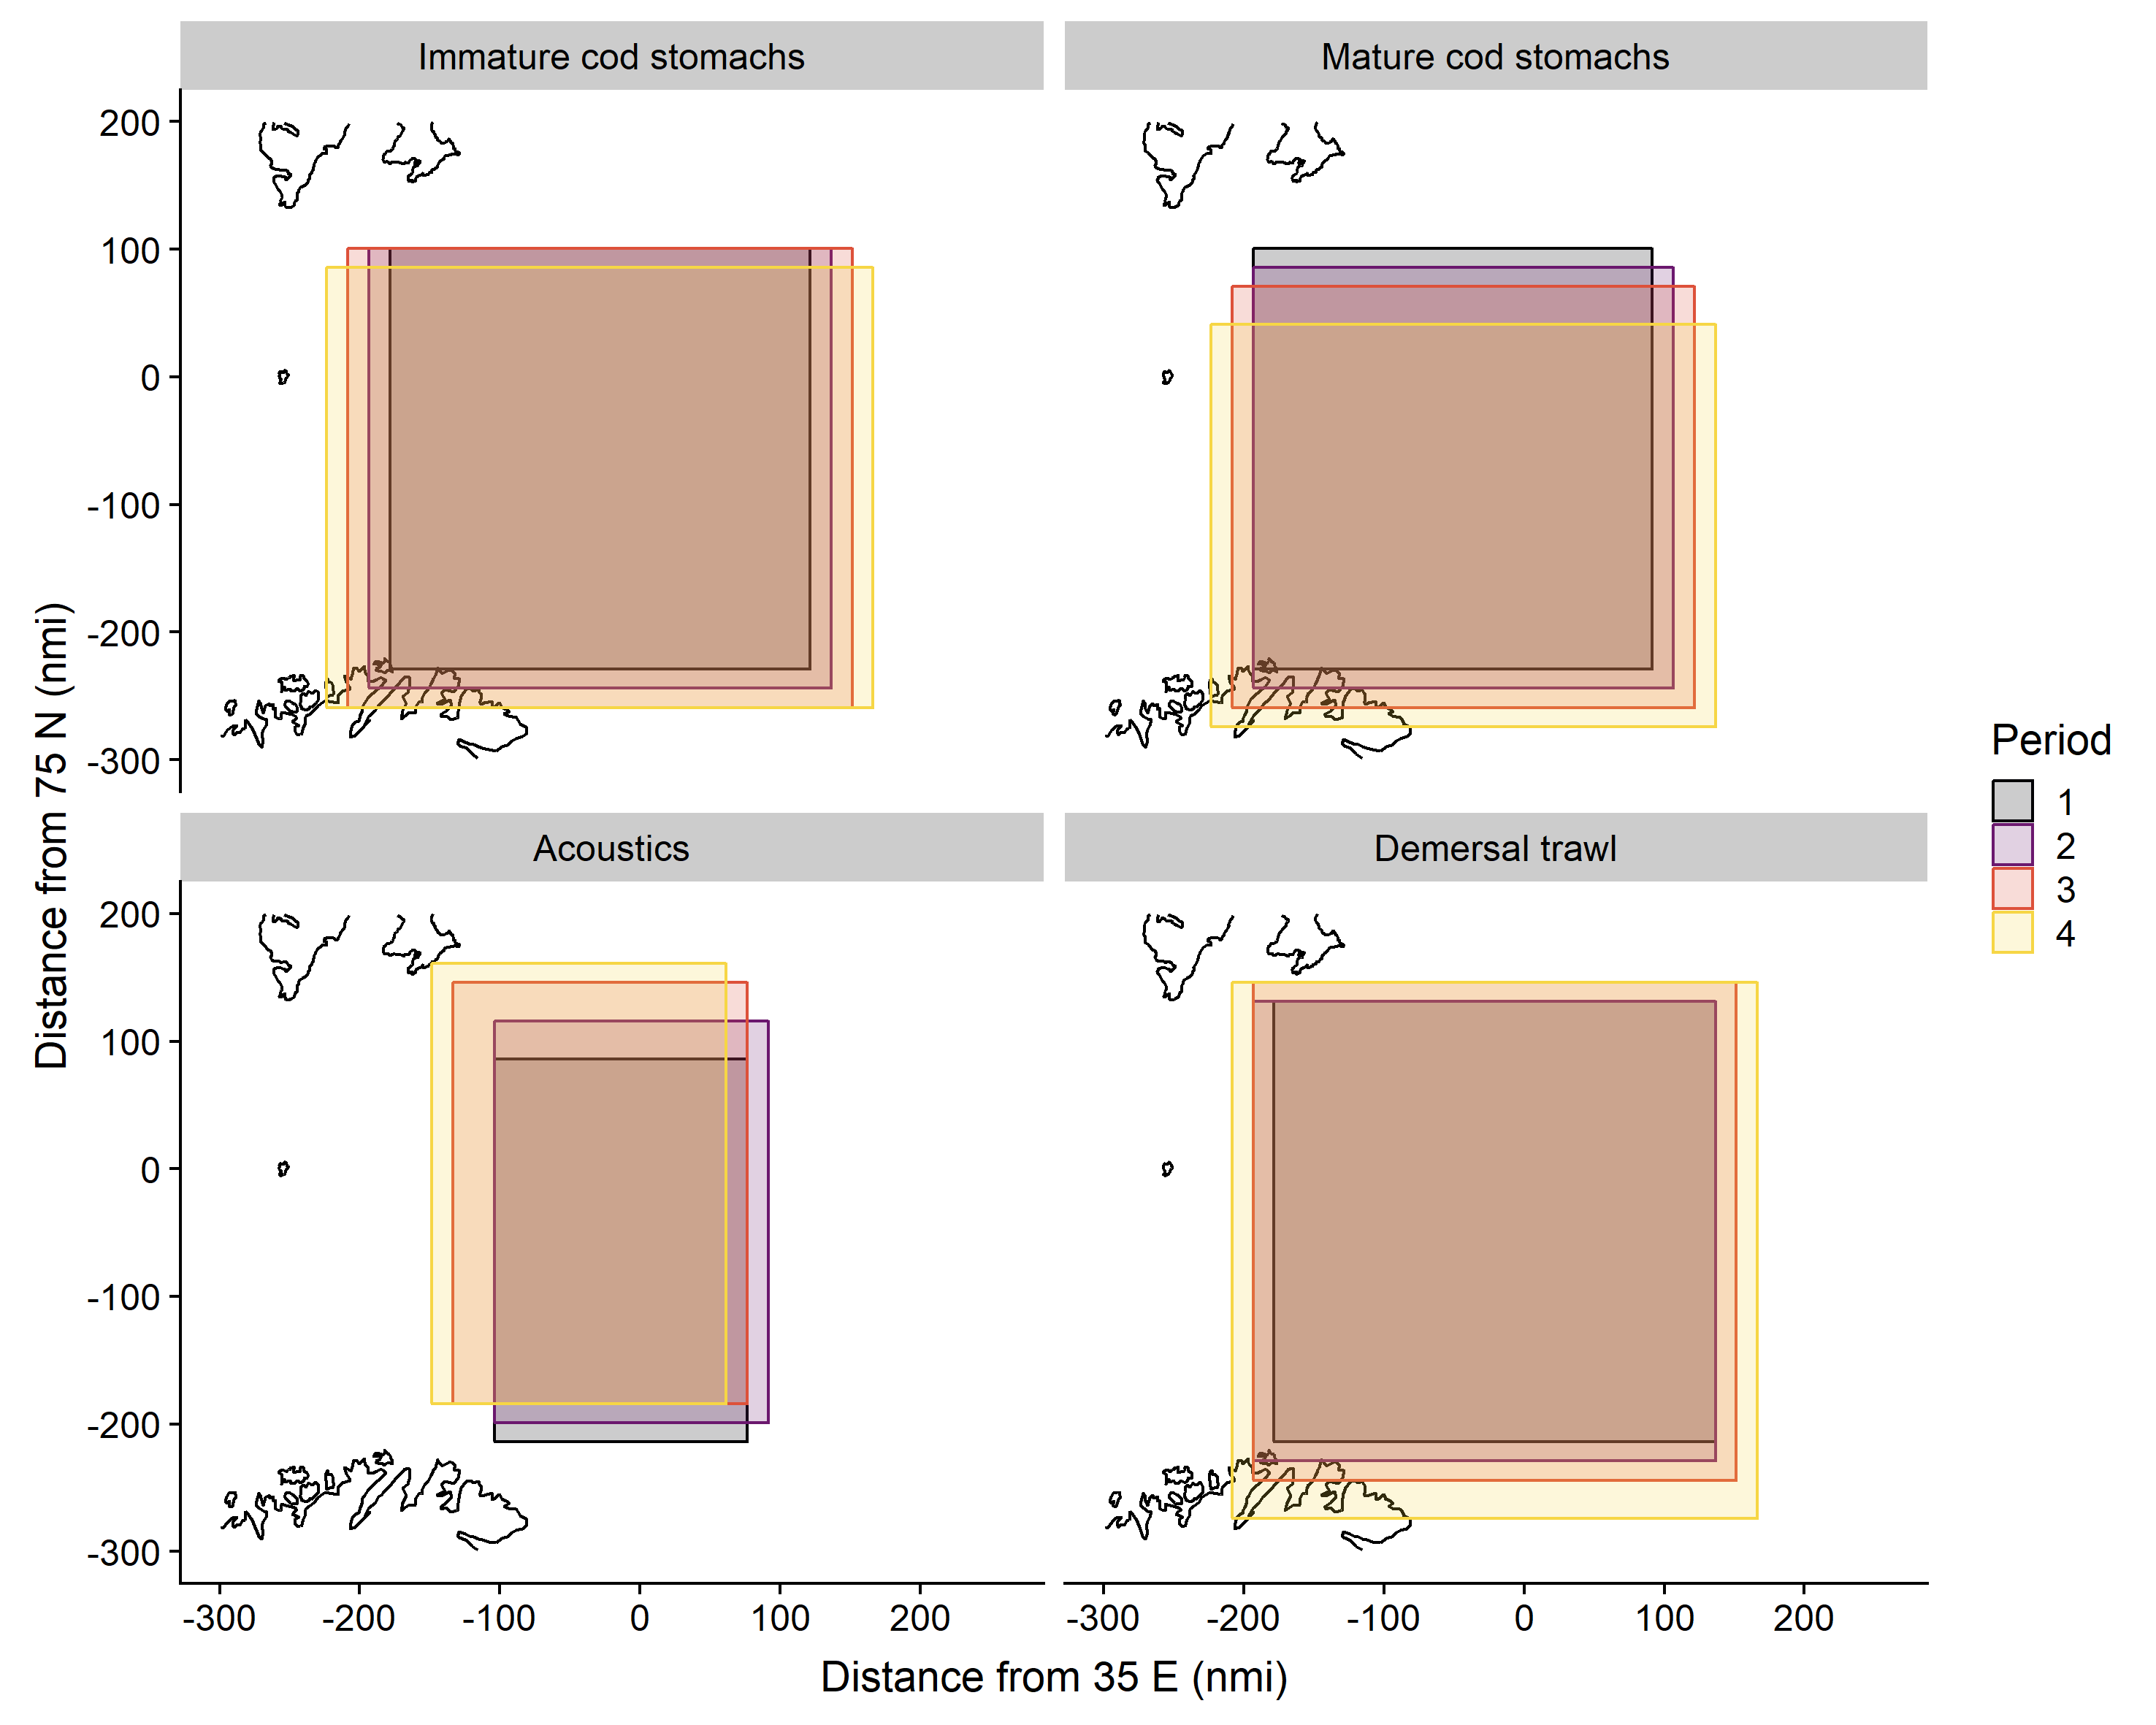
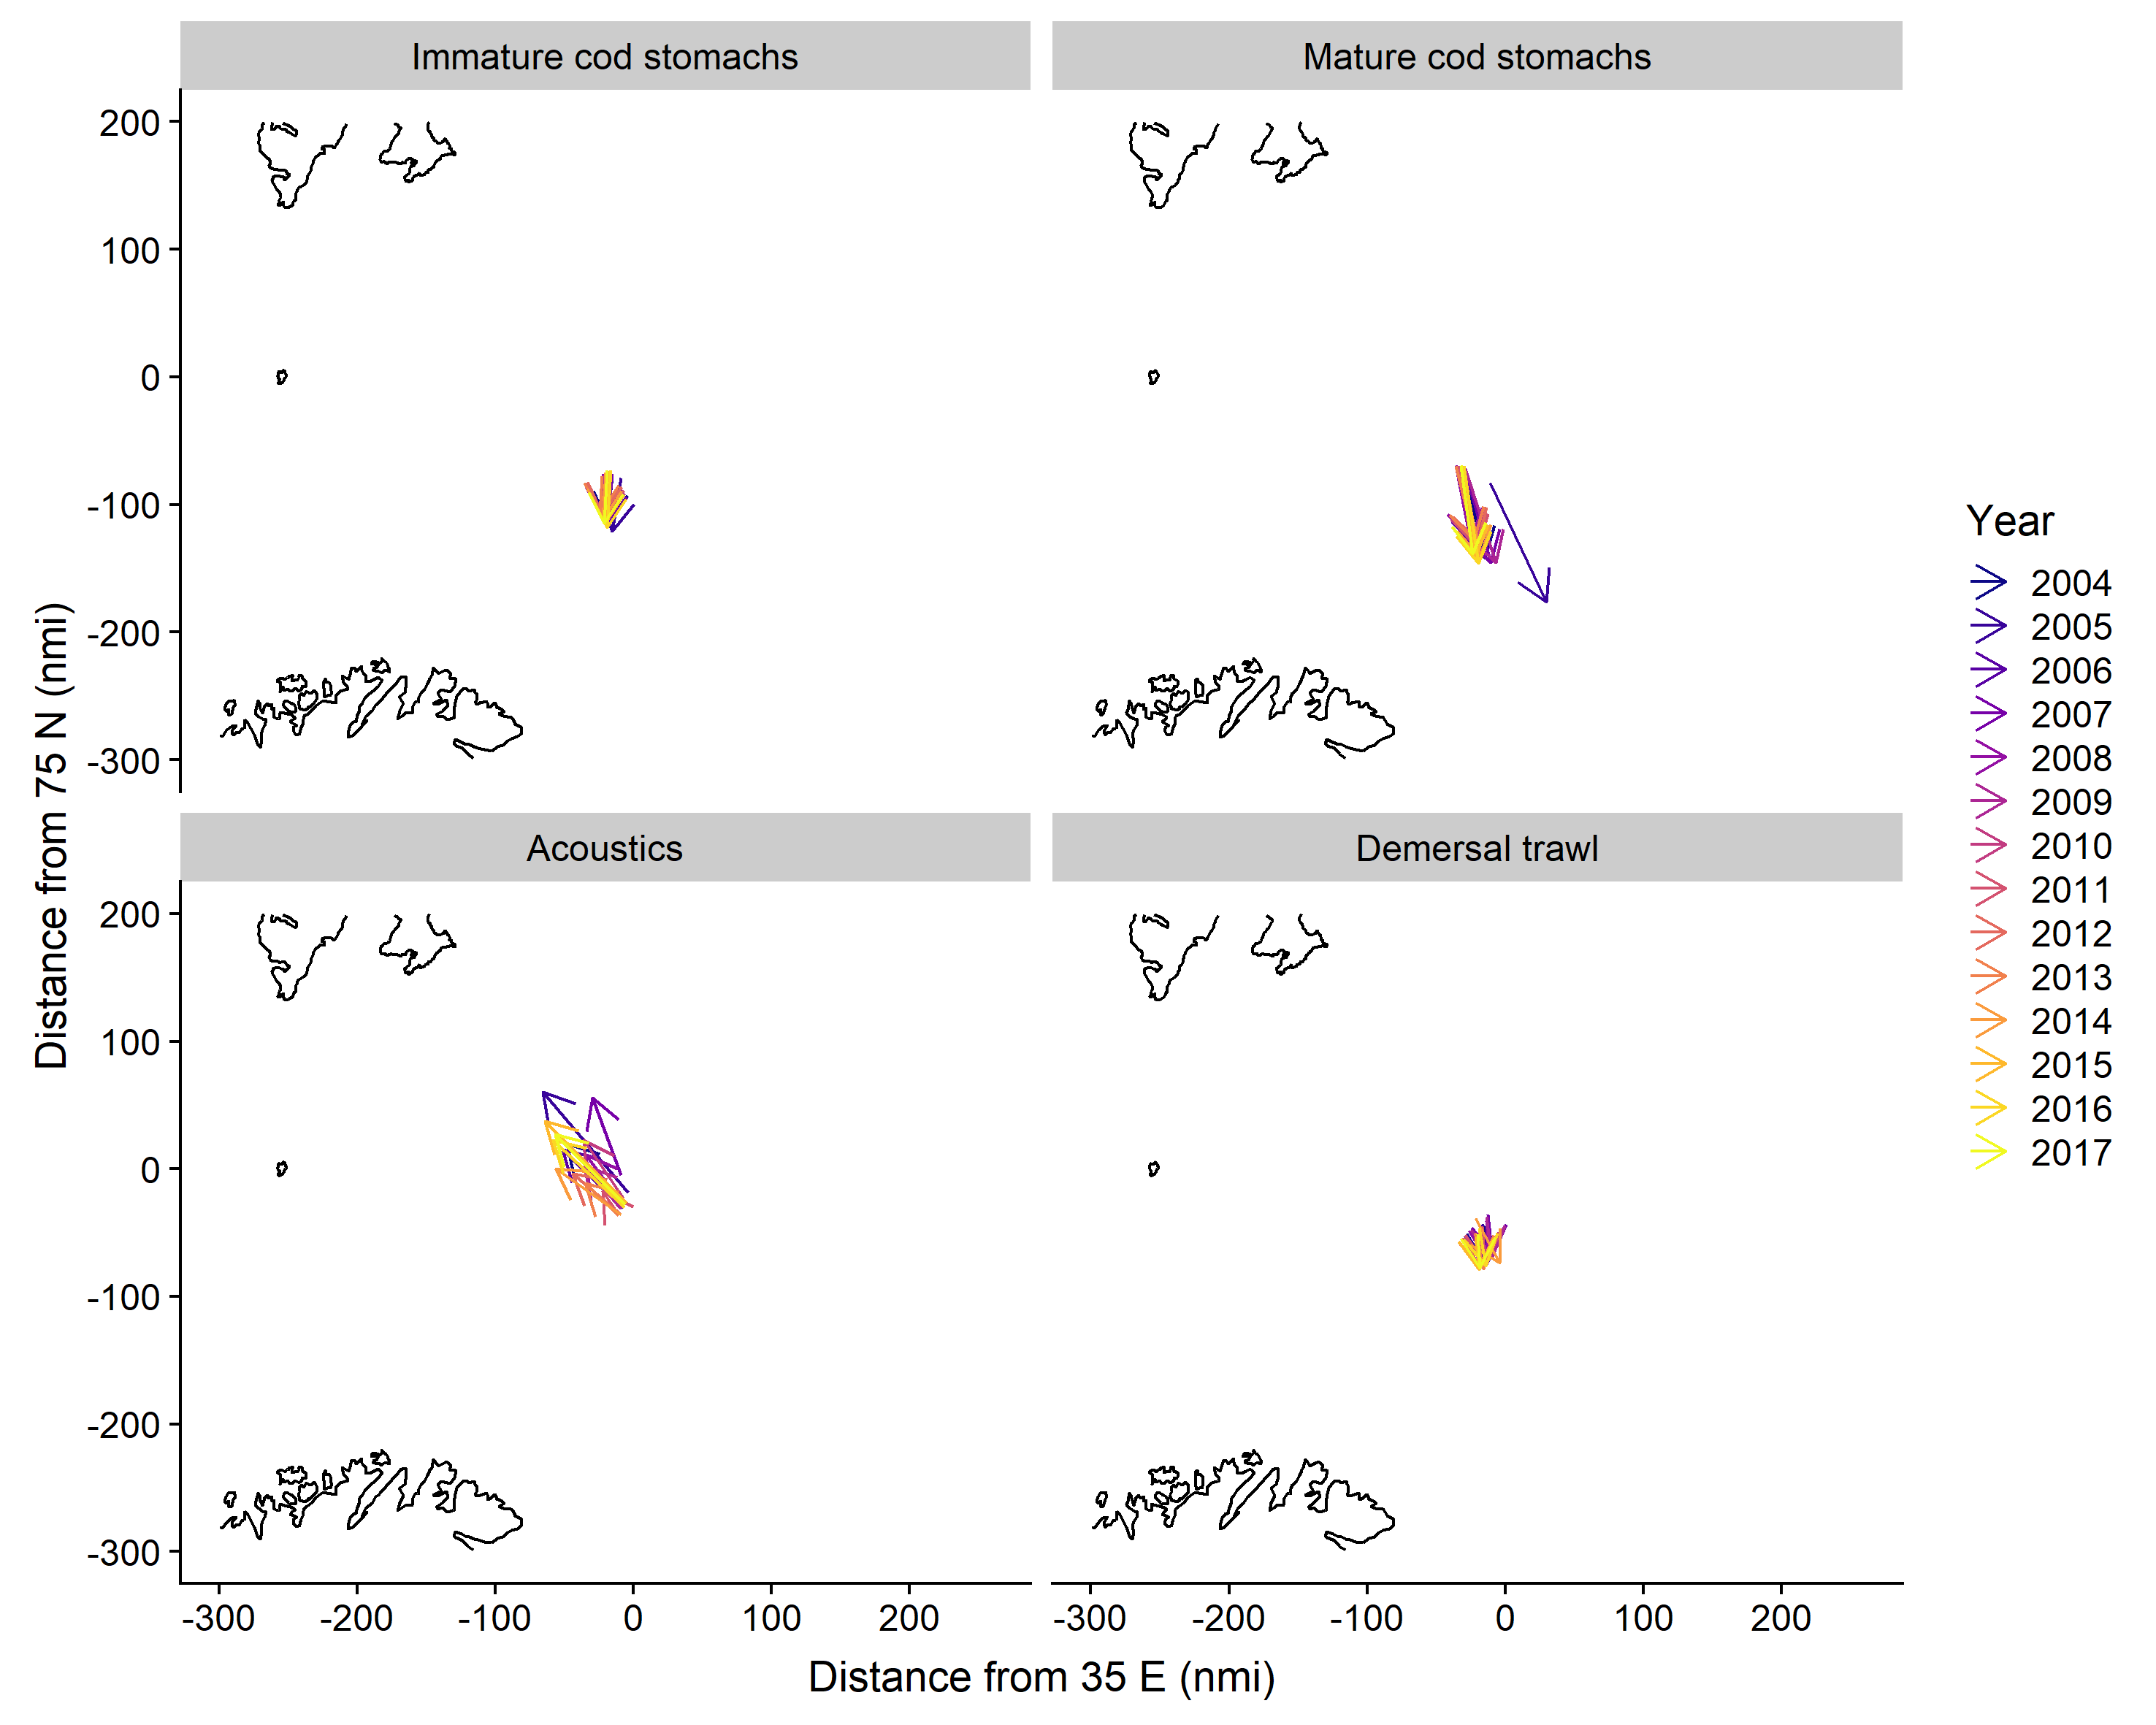
Based on grid predictions, from late January to late March, the main 75% quantile distribution area shifted to the south and expanded along the Norwegian and Russian coasts for capelin in cod stomachs and in demersal trawls, while the distribution area based on acoustics shifted to the northwest (Figure 3.7). The centre of gravity for capelin in immature cod stomachs and in demersal trawls shifted moderately to the south, while the change was larger and directed towards the southeast for capelin in mature cod stomachs (Figure 3.8). The centre of gravity for capelin measured acoustically shifted to the northwest, and this change varied more between years than the other sampling methods.
3.2 - Correlations between different sampling methods
3.2.1 - Spatiotemporal variation in correlations
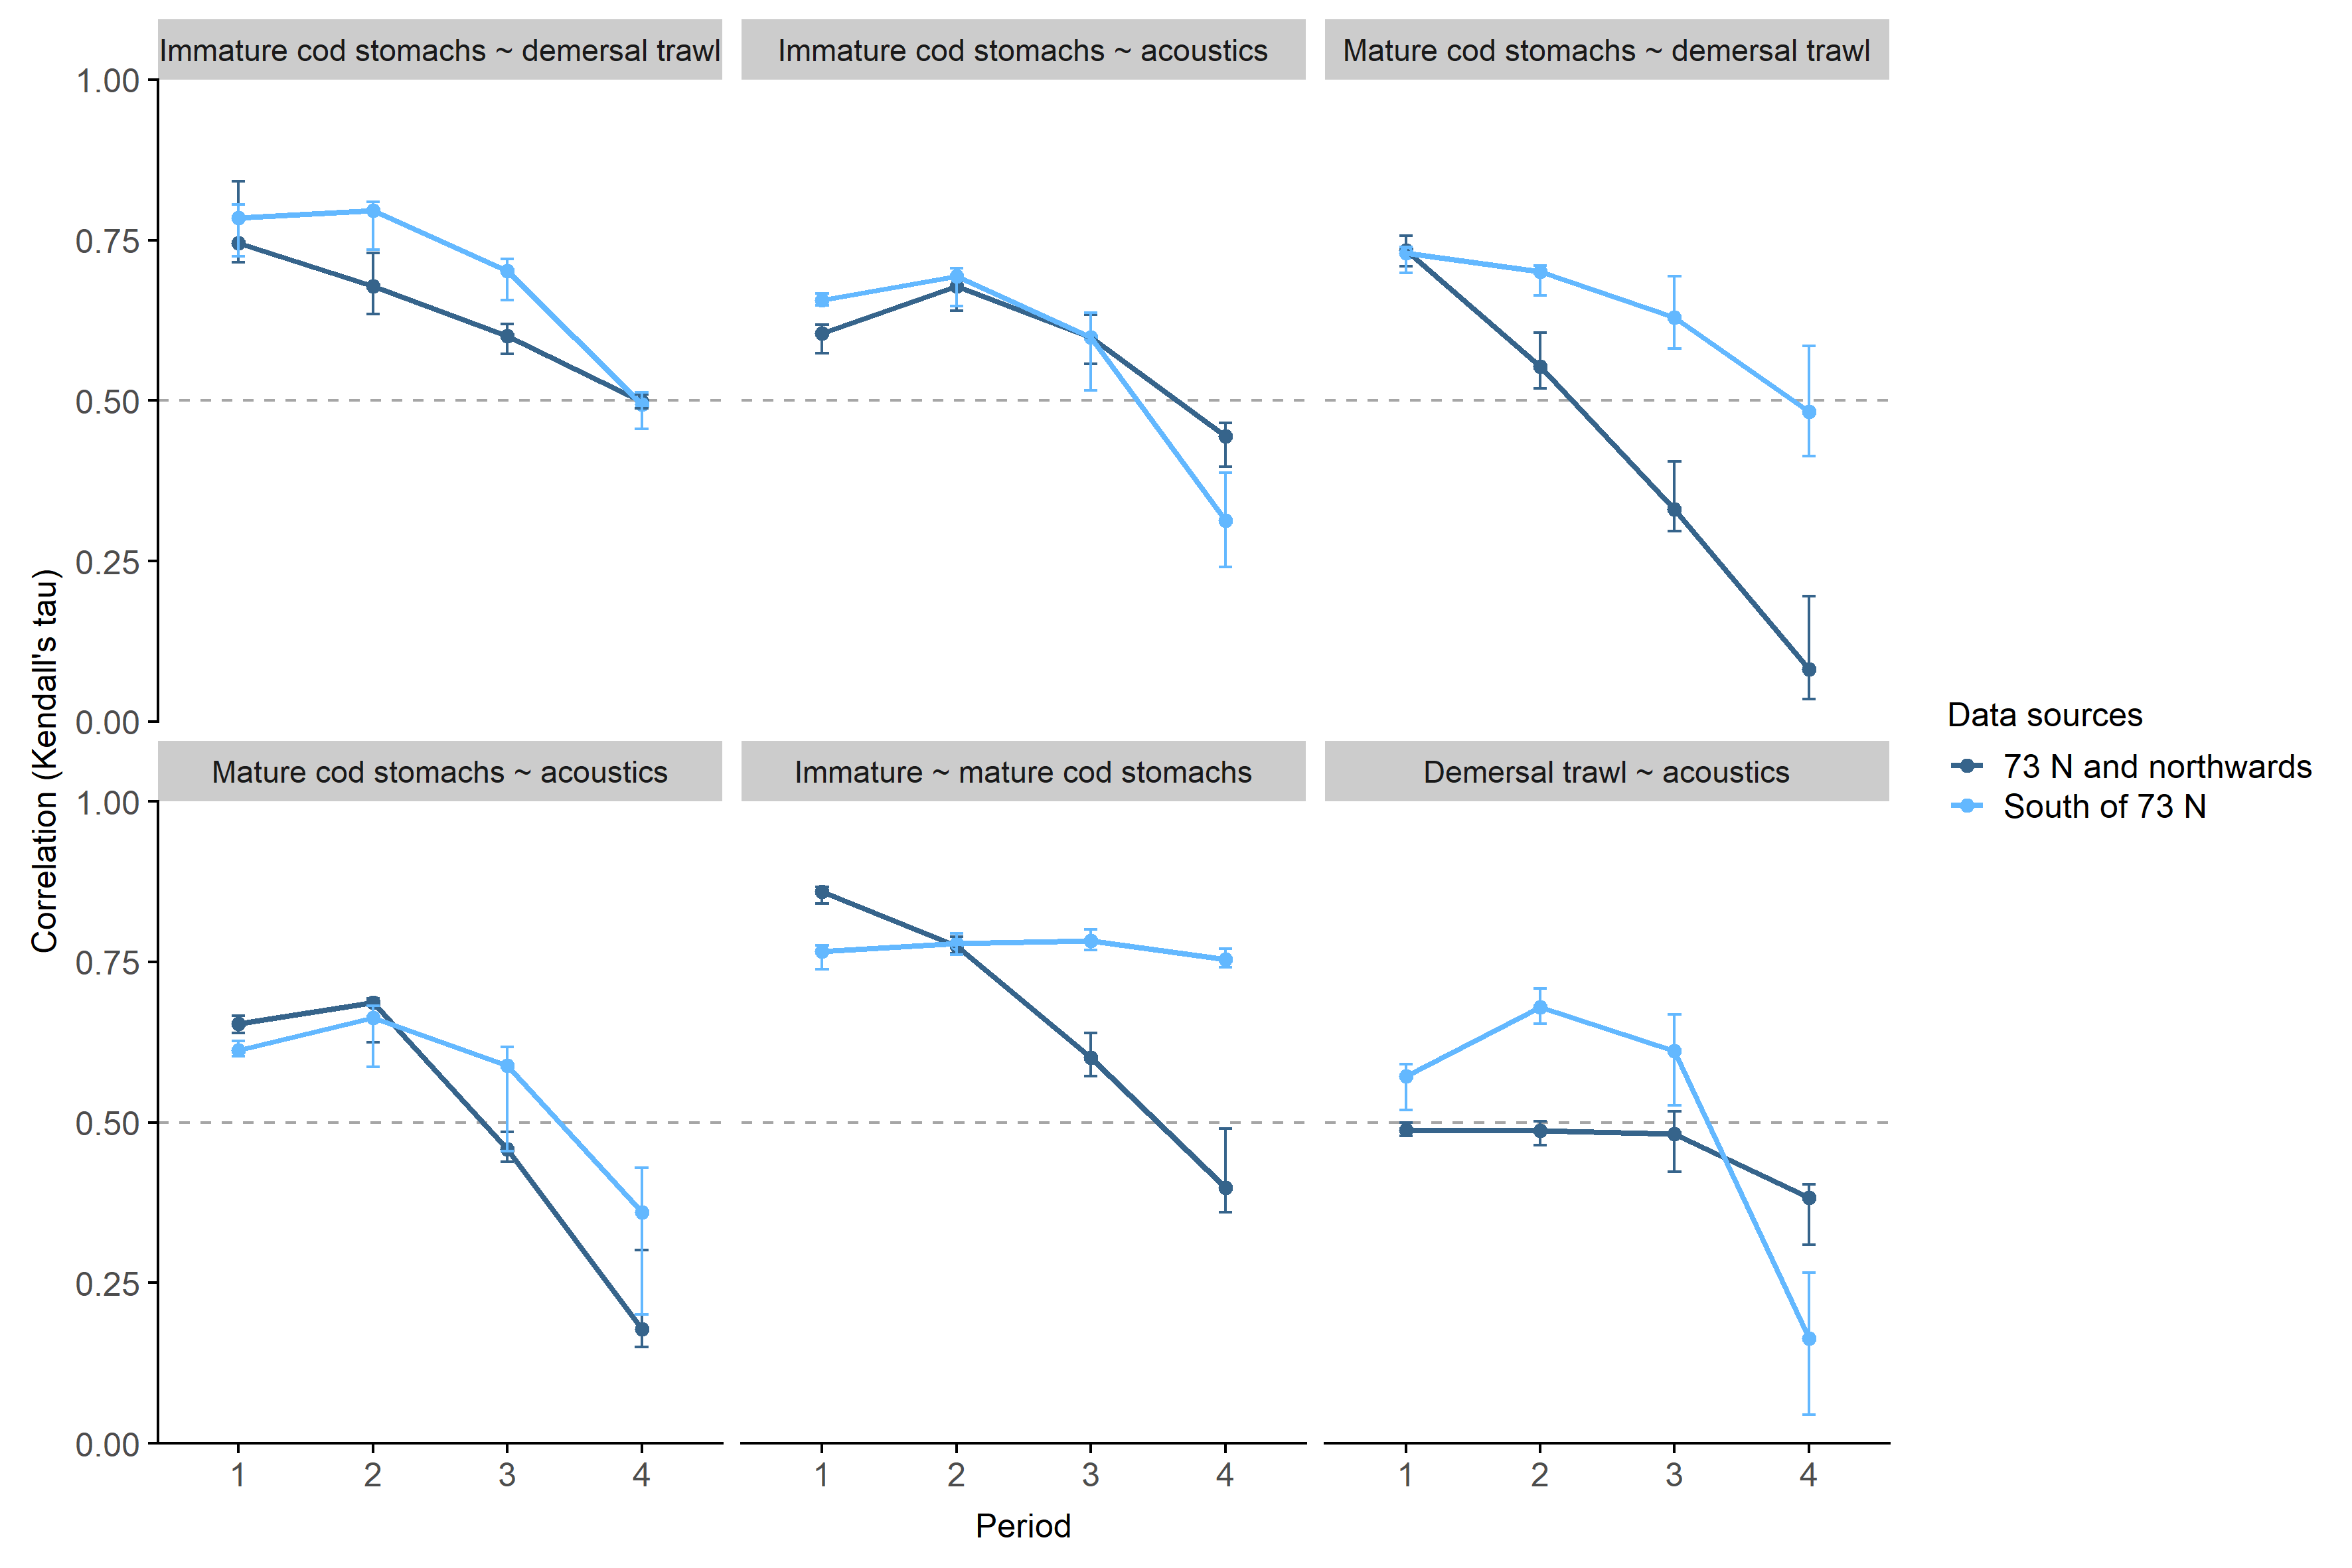
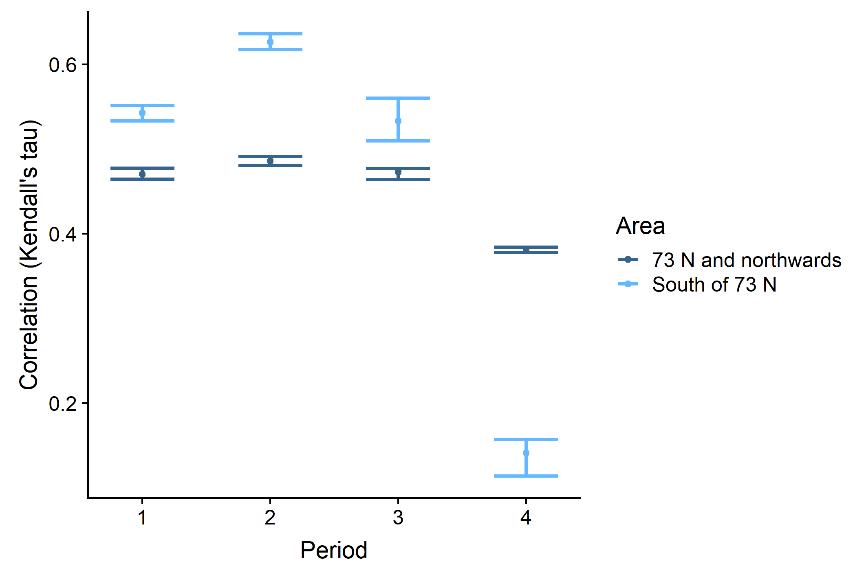
The correlations between capelin densities sampled with different methods generally decreased from January to March and differed between the southern and northern areas (Figure 3.9). The variation between years tended to increase in the later periods. The correlation between demersal trawl and acoustics in the south initially increased before decreasing sharply in the last period, while the correlation only decreased slightly in the north. Demersal trawl-acoustics in the north and immature-mature cod stomachs in the south were the only correlations that remained similar over time. The strongest correlations were found early in the survey period between capelin in cod stomachs and demersal trawls, and between capelin in the stomachs of immature and mature cod. The correlations were significant (p < 0.05) except for the correlations in the north in period 4 of the years 2008 and 2015-2017, and the correlations in the south in period 4 of 2014.
3.2.2 - Diel variation in demersal trawl-acoustics correlations
Using the models to predict capelin trawl and acoustic densities for solar elevation angles within the range of observed values, we find the main effect in the southern area in periods 3 and 4 (Figure 3.10). The correlation increased with increasing solar elevation angle, corresponding to a 10 and 38% change from smallest to largest correlation for periods 3 and 4, respectively. That is, the demersal trawl catches and acoustic registrations were more similar during the day (or in the lighter period) than at night (or the darker period). It is not surprising to find the strongest effect in the south since this is where solar elevation angle varied the most during the survey period. Comparing with figure 3.5, it is clear that this effect is attributable to the higher acoustic densities detected during lighter hours.
4 - Discussion and conclusion
4.1 - Summary of results
All sampling methods except acoustics detected more capelin farther south later in the sampling period, though the signal was weaker for capelin caught in the demersal trawl (Figures 3.7 and 3.8). This is in accordance with the southward capelin spawning migration that takes place during the survey period. The distribution area based on acoustics suggested the opposite; that capelin shifted northwards during the survey period. This is likely an effect of detecting less capelin farther south in later periods, as migrating capelin has been observed to occupy the acoustic dead zones close to the surface and/or the bottom when approaching the coast (Gjøsæter, 1998). Some part of the migrating capelin component does appear to be distributed close to the bottom in the south, particularly in the first and second periods of the survey when the demersal trawl detected high-density areas that were less clear from the acoustics (Figures 3.1 and 3.2, see also Fall et al., 2018 for a discussion on this).
The correlations between capelin densities from different sampling methods differed between sampling method pairs, and for each pair, correlations changed throughout the January-March sampling period (Figure 3.9). The overall direction of change was decreasing correlations over time. In addition, the changes in correlation differed between the southern and northern parts of the surveyed area. Correlations were generally stronger between capelin in cod stomachs and demersal trawls compared to acoustics, suggesting that demersal trawl catches better reflect the capelin that is available to cod. The correlations between capelin in mature cod stomachs and the other sampling methods decreased more over the survey period in the north than in the south. Since maturing cod also begin their spawning migration during the survey, this pattern may represent a shift in motivation from feeding to migration. The maturing cod still feeds during the migration, but feeding is reduced compared to the immatures that remain inside the Barents Sea (Michalsen et al., 2008). In a converse pattern, the correlation between demersal trawl and acoustic capelin densities decreased sharply in the south in period four, while the decrease in the north was more moderate. Combined with the northwards shift in center of gravity for acoustically detected capelin late in the survey and the tendency towards finding larger capelin individuals in the south (Appendix 1), this further supports the shift or divergence in capelin vertical distribution into deeper areas as the maturing component approaches the coast.
During the winter survey period, daylight returns to the area (Figure 2.2), and in the southern Barents Sea, the sun reaches above the horizon from late February. In the data analyzed here, we find a significant relationship between the solar elevation angle and the density of capelin detected with both trawl and acoustics. The effect is stronger for acoustics, with higher densities detected when the sun is higher in the sky. Like many other forage fish, capelin performs light-mediated vertical migrations (Dalpadado and Mowbray, 2013), likely resulting from a trade-off between finding prey and avoiding predators. The forming of more tightly packed aggregations or schools at depth during the day coincided with detection of higher acoustic densities. For herring, the same effect was attributed to differences in tilt angle between fish that are schooling and those that are more dispersed, and vessel avoidance by fish distributed close to the surface at night (Huse and Korneliussen, 2000).
4.2 - Statistical considerations and sources of bias
In the analyses, we account for large-scale spatial autocorrelation by including the geographical location as a predictor in our models. Smaller scale correlation, which is most prominent in the acoustic data, were ignored. Such correlation is mainly of concern when we want to interpret covariate effects on the response, and we can expect that the true confidence intervals of e.g., the effect of sun height on acoustic detection is somewhat wider than in figure 3.5. Nevertheless, most covariate effects had very low p-values and we do not expect that accounting for smaller-scale autocorrelation in the data would alter our conclusions. This source of bias is also not a concern for the calculation of correlation between data sources as it does not affect the predicted value of the response.
The spatial and temporal survey coverage varied between years, which means that the capelin distribution in different periods were predicted from varying amounts of data. We tried to minimise this error by predicting as little as possible outside the data range, e.g., by restricting the range of solar elevation angles in the prediction grid to those observed in different periods during the survey. In the central Barents Sea, there was an area with fewer sampling stations, largely corresponding to the border between the Norwegian and Russian economic zones. The prediction uncertainty is therefore higher in this region, but this is probably of little influence for the overall correlations as they are calculated on predictions from a much larger area.
It could be informative to model changes in spatial distributions over shorter time periods than the approximately two-week periods used here. We chose this temporal resolution as a trade-off between getting useful information on how distributions change and computational efficiency. Runtime for models using acoustic and trawl data was not a problem, but since the stomach data models needed to include a random effect of station to account for dependency between observations, runtime was increased. An option for achieving higher temporal resolution in the stomach data models is to average individual stomachs at each station, removing the need for the random effect. For trawl and acoustic data, running the models with finer spatial resolution (daily spatial fields) gave similar trends in correlations over time.
Initially, we examined the possibility of including the 2007-2009 dedicated surveys on capelin in winter in our statistical analyses. However, the design of those surveys reflected several different aims and differed substantially between years (Appendix 2). Generally, spatial clumping of data points and variable survey design make it difficult to study species distributions with robust statistical methods.
4.3 - Conclusions and suggestions for future analyses
While the winter survey does not specifically target capelin, the present analysis and previous work have revealed that data from this survey captures the historically observed distribution pattern of capelin well. Taken together, the acoustic, demersal trawl, and cod stomach data revealed a shift in capelin distribution towards the south during the winter survey period, likely attributable to the capelin (and cod, for cod stomach data) spawning migration. This overall pattern was consistent between years. We found that a higher proportion of large (maturing) capelin was caught in the demersal trawl in the south compared to the north, and that the trawl detected local capelin aggregations in the south that were less visible in the distribution based on acoustics. This corroborates earlier observations that migrating capelin may be distributed in acoustic dead zones. In order to design a new survey or adapt the winter survey to include estimation of the maturing capelin, a central task would therefore be to understand more about the vertical distribution of capelin. That knowledge is essential to determining which gear or combination of gears are most appropriate for sampling. As a start, we propose to analyse the vertical distribution using the existing, vertically resolved acoustic data from the winter survey. This data is stored with a horizontal resolution of 1 nautical mile and a vertical resolution of 10-metres. With this data, it would be possible to model changes in vertical capelin distribution across time and space, and potentially answer the questions of when and where the migrating capelin descend to greater depths. If this event can be predicted from environmental conditions or other factors, we would be another step closer to knowing where and when to survey the maturing capelin stock.
Since we have a good coverage of the cod stock in the winter survey and plenty of stomach data, it was tempting to explore the use of cod stomachs to track capelin distribution. Here, too, there was a south/south-westward shift in the presence/absence of capelin in stomachs, while we found no effect of period on the amount of capelin eaten by cod. Some care needs to be taken when using this data to study capelin distribution shifts, however, since maturing cod also are migrating at the time of the survey. Another complicating factor is cod’s slow digestion in the low temperatures of the Barents Sea (Temming and Herrmann, 2003), which implies that the capelin found in a cod stomach could have been eaten several days before. This may lead to discrepancies between the environmental presence of capelin and capelin in stomachs. Still, the correlation between capelin in stomachs and demersal trawls was relatively high (around 0.75) at the beginning of the survey period, suggesting that stomachs can be useful for studying the presence of capelin in the environment early in the year.
In addition to the capelin fishery (see example maps of catch locations in Appendix 2), there is a fishery on immature cod in the region. Appendices 3 and 4 detail results from 2016/2018 pilot projects where fishery landing facilities were asked to collect simple information on capelin in cod stomachs. While there was no information about where the cod was caught, the cod fishery is concentrated relatively close to the coast and the idea was that it may be noticeable in the cod diet when the migrating maturing capelin reach the area. It is exciting to note that despite the irregular answering frequency and simple categorical data, we see a clear trend towards more, larger, and fresher capelin in cod stomachs later in the season (Appendix 3). In 2018, the reporting started later and there is some indication of less capelin later in the period, though the answering frequency is low, partly due to a decline in cod landings (Appendix 4). This project will continue in 2019. Based on the results from the first two years, the guidelines have now been updated to focus on the quantity of cod that has been received, the proportion of cod with capelin in their stomachs, and the proportion with fresh capelin in their stomachs. With these improvements, we expect to receive a better picture of the overall temporal diet trends of fished cod, which may provide valuable complementary information for the design of future surveys targeting maturing capelin.
In conclusion, because of the large spatiotemporal variation in capelin distribution and correlations between sampling methods, abundance estimation of maturing capelin is strongly dependent on measuring at the right time and place, and with the right equipment. Our results suggest that the demersal trawl and acoustics partly sample different components of the capelin stock throughout the winter survey period, and that these two methods may need to be combined to estimate the maturing component. However, since the aggregations of capelin prior to spawning are extremely concentrated compared to the large-scale coverage of the winter survey, a precise measurement of spawning biomass at this time likely requires a completely different survey design than the winter survey. An adaptive design based on the “Equal space zigzag sampler” (Strindberg and Buckland, 2004) is being trialled during the 2019 spawning season. Due to the regular survey design, winter survey data are nevertheless useful for statistical analyses of capelin distribution in time and space, and we recommend that capelin vertical distribution is further explored in the context of designing a survey targeting the spawning biomass.
5 - References
Bacheler, N. M., Bailey, K. M., Ciannelli, L., Bartolino, V., and Chan, K. S. 2009. Density-dependent, landscape, and climate effects on spawning distribution of walleye pollock Theragra chalcogramma. Marine Ecology Progress Series, 391: 1-12.
Bergstad, O., Jørgensen, T., and Dragesund, O. 1987. Life history and ecology of the gadoid resources of the Barents Sea. Fisheries Research, 5: 119-161.
Bivand, R. S., Pebesma, E. J., Gomez-Rubio, V., and Pebesma, E. J. 2008. Applied spatial data analysis with R, Springer.
Bogstad, B., and Gjøsæter, H. 1994. A method for estimating the consumption of capelin by cod in the Barents Sea. ICES Journal of Marine Science, 51: 273-280.
Budic, L., Didenko, G., and Dormann, C. F. 2016. Squares of different sizes: effect of geographical projection on model parameter estimates in species distribution modeling. Ecology and Evolution, 6: 202-211.
Casey, J. M., and Myers, R. A. 1998. Diel variation in trawl catchability: is it as clear as day and night? Canadian Journal of Fisheries and Aquatic Sciences, 55: 2329-2340.
Dalpadado, P., and Mowbray, F. 2013. Comparative analysis of feeding ecology of capelin from two shelf ecosystems, off Newfoundland and in the Barents Sea. Progress in Oceanography, 114: 97-105.
Dolgov, A., Bogstad, B., Johannesen, E., and Skern-Mauritzen, M. 2011. Trophic relationships. In The Barents Sea - Ecosystem, Resources, Management, p. 825. Ed. by T. Jakobsen, and V. K. Ozhigin. Tapir Academic Press, Trondheim.
Eriksen, E., Gjøsæter, H., Johansen, G.-O., Røttingen, I., Svellingen, I., Tjelmeland, S., Ona, E., et al. 2009. Er det mogleg å justere loddekvoten ut frå eit vinterloddetokt? : oppsummering av tokt 2007-2009, Havforskningsinstituttet, Bergen.
Fall, J., Ciannelli, L., Skaret, G., and Johannesen, E. 2018. Seasonal dynamics of spatial distributions and overlap between Northeast Arctic cod (Gadus morhua) and capelin (Mallotus villosus) in the Barents Sea. PLoS One, 13: e0205921.
Fauchald, P., Erikstad, K. E., and Skarsfjord, H. 2000. Scale-Dependent Predator-Prey Interactions: The Hierarchical Spatial Distribution of Seabirds and Prey. Ecology, 81: 773-783.
Gjøsæter, H. 1998. The population biology and exploitation of capelin (Mallotus villosus) in the Barents Sea. Sarsia, 83: 453-496.
Gjøsæter, H., Bogstad, B., and Tjelmeland, S. 2002. Assessment methodology for Barents Sea capelin, Mallotus villosus (Müller). ICES Journal of Marine Science: Journal du Conseil, 59: 1086-1095.
Gjøsæter, H., Bogstad, B., Tjelmeland, S., and Subbey, S. 2015. A retrospective evaluation of the Barents Sea capelin management advice. Marine biology research, 11: 135-143.
Grüss, A., Drexler, M., and Ainsworth, C. H. 2014. Using delta generalized additive models to produce distribution maps for spatially explicit ecosystem models. Fisheries Research, 159: 11-24.
Holmin, A. J. 2018. Rstox: Running Stox functionality independently in R. R package version 1.9 edn.
Huse, I., and Korneliussen, R. 2000. Diel variation in acoustic density measurements of overwintering herring (Clupea harengus L.). ICES Journal of Marine Science, 57: 903-910.
Hylen, A., Nakken, O., and Nedreaas, K. H. 2008. Northeast Arctic cod: fisheries, life history, stock fluctuations and management. In Norwegian Spring-Spawning Herring & Northeast Arctic Cod - 100 Years of Research and Magement, p. 177. Ed. by O. Nakken. Tapir Academic Press, Trondheim.
ICES. 2017. Report of the Arctic Fisheries Working Group (AFWG). ICES CM 2017/ACOM:06. 486 pp.
Jangaard, P. M. 1974. The capelin (Mallotus villosus): biology, distribution, exploration, utilization, and composition, Department of the Environment, Fisheries and Marine Service, Ottawa, Canada.
Michalsen, K., Johannesen, E., and Bogstad, B. 2008. Feeding of mature cod (Gadus morhua) on the spawning grounds in Lofoten. ICES Journal of Marine Science, 65: 571-580.
Ono, K., Kotwicki, S., Dingsør, G. E., Johnsen, E., and Handling editor: Emory, A. 2018. Multispecies acoustic dead-zone correction and bias ratio estimates between acoustic and bottom-trawl data. ICES Journal of Marine Science, 75: 361-373.
R Core Team 2018. R: A language and environment for statistical computing. R Foundation for Statistical Computing, Vienna, Austria.
Strindberg, S., and Buckland, S. T. 2004. Zigzag survey designs in line transect sampling. Journal of Agricultural Biological and Environmental Statistics, 9: 443-461.
Temming, A., and Herrmann, J. P. 2003. Gastric evacuation in cod: Prey-specific evacuation rates for use in North Sea, Baltic Sea and Barents Sea multi-species models. Fisheries Research, 63: 21-41.
Thorson, J. T., Pinsky, M. L., and Ward, E. J. 2016. Model
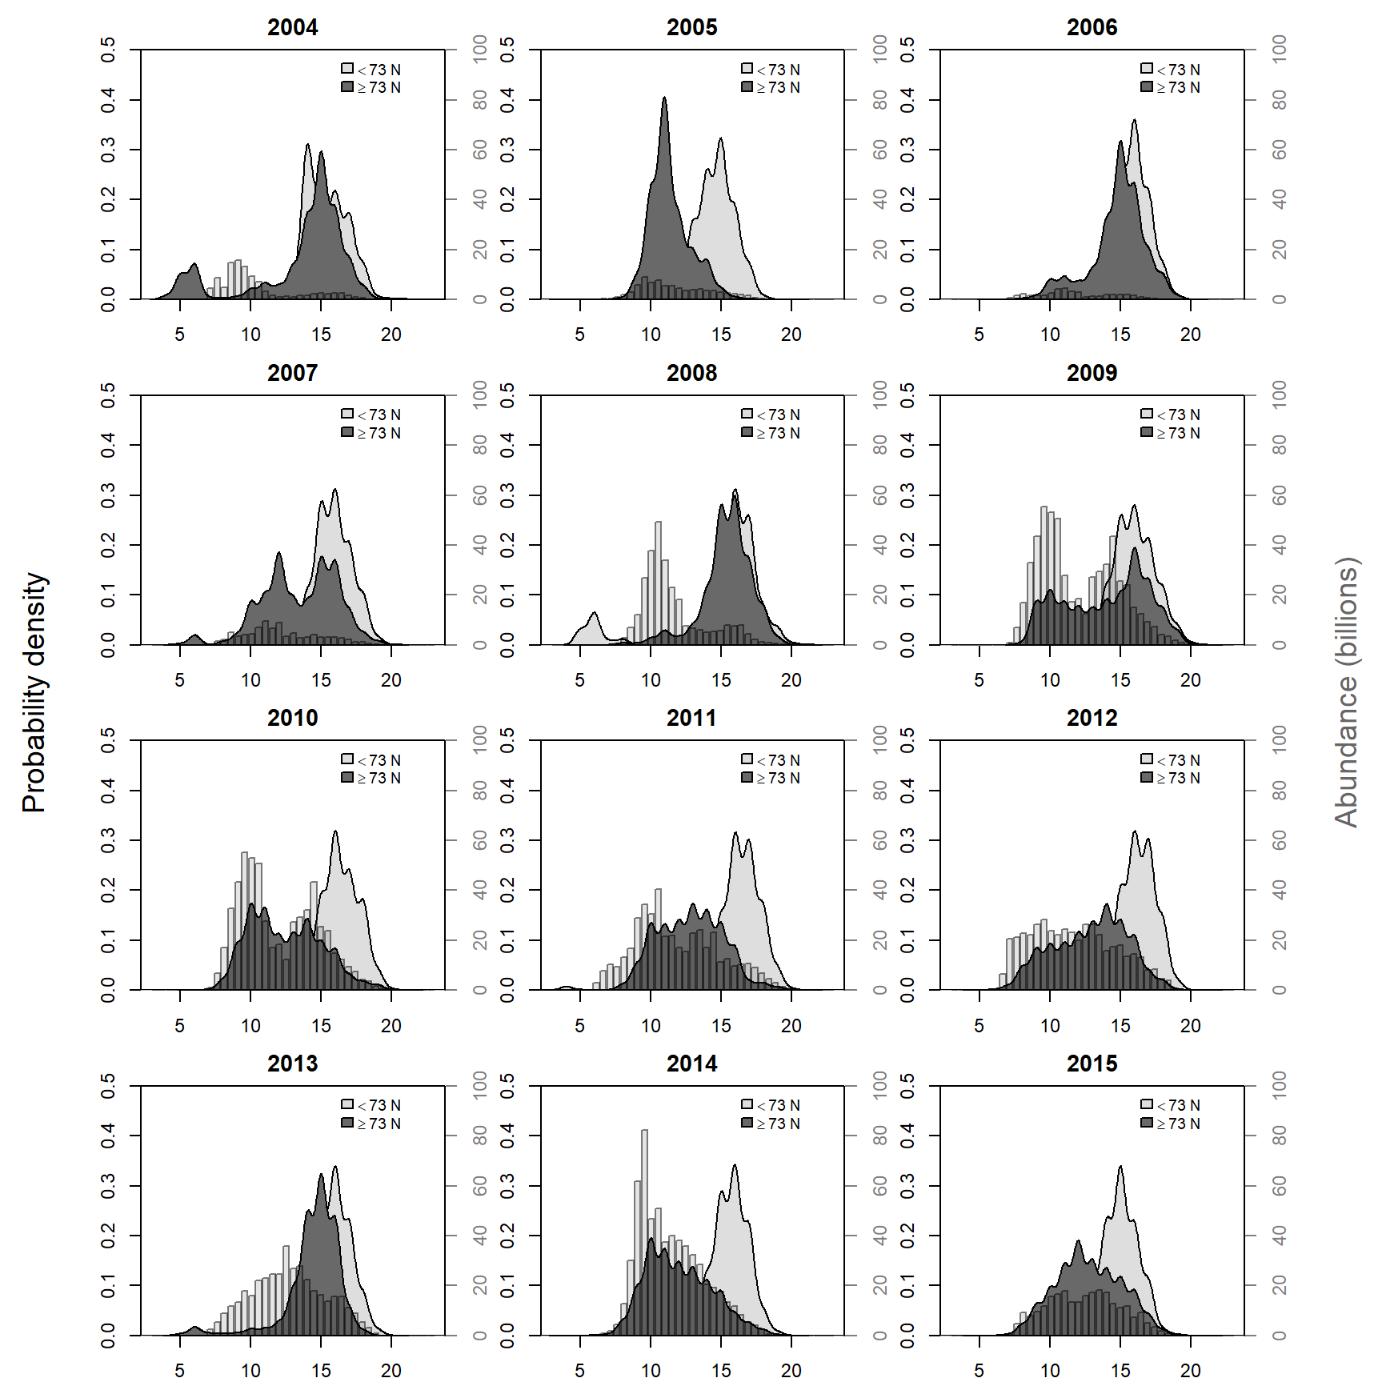
6 - Appendix 1: Length distribution of capelin in demersal trawls 2004-2015
Probability density functions for the length of capelin caught in the demersal trawl south and north of 73 degrees (left y-axis). Also shown is the stock length distribution assessed from the ecosystem survey the year before (light grey bars, right y-axis). The probability distributions were calculated from the catch numbers of capelin in each 1 cm-length group using R base function “density” with default settings.
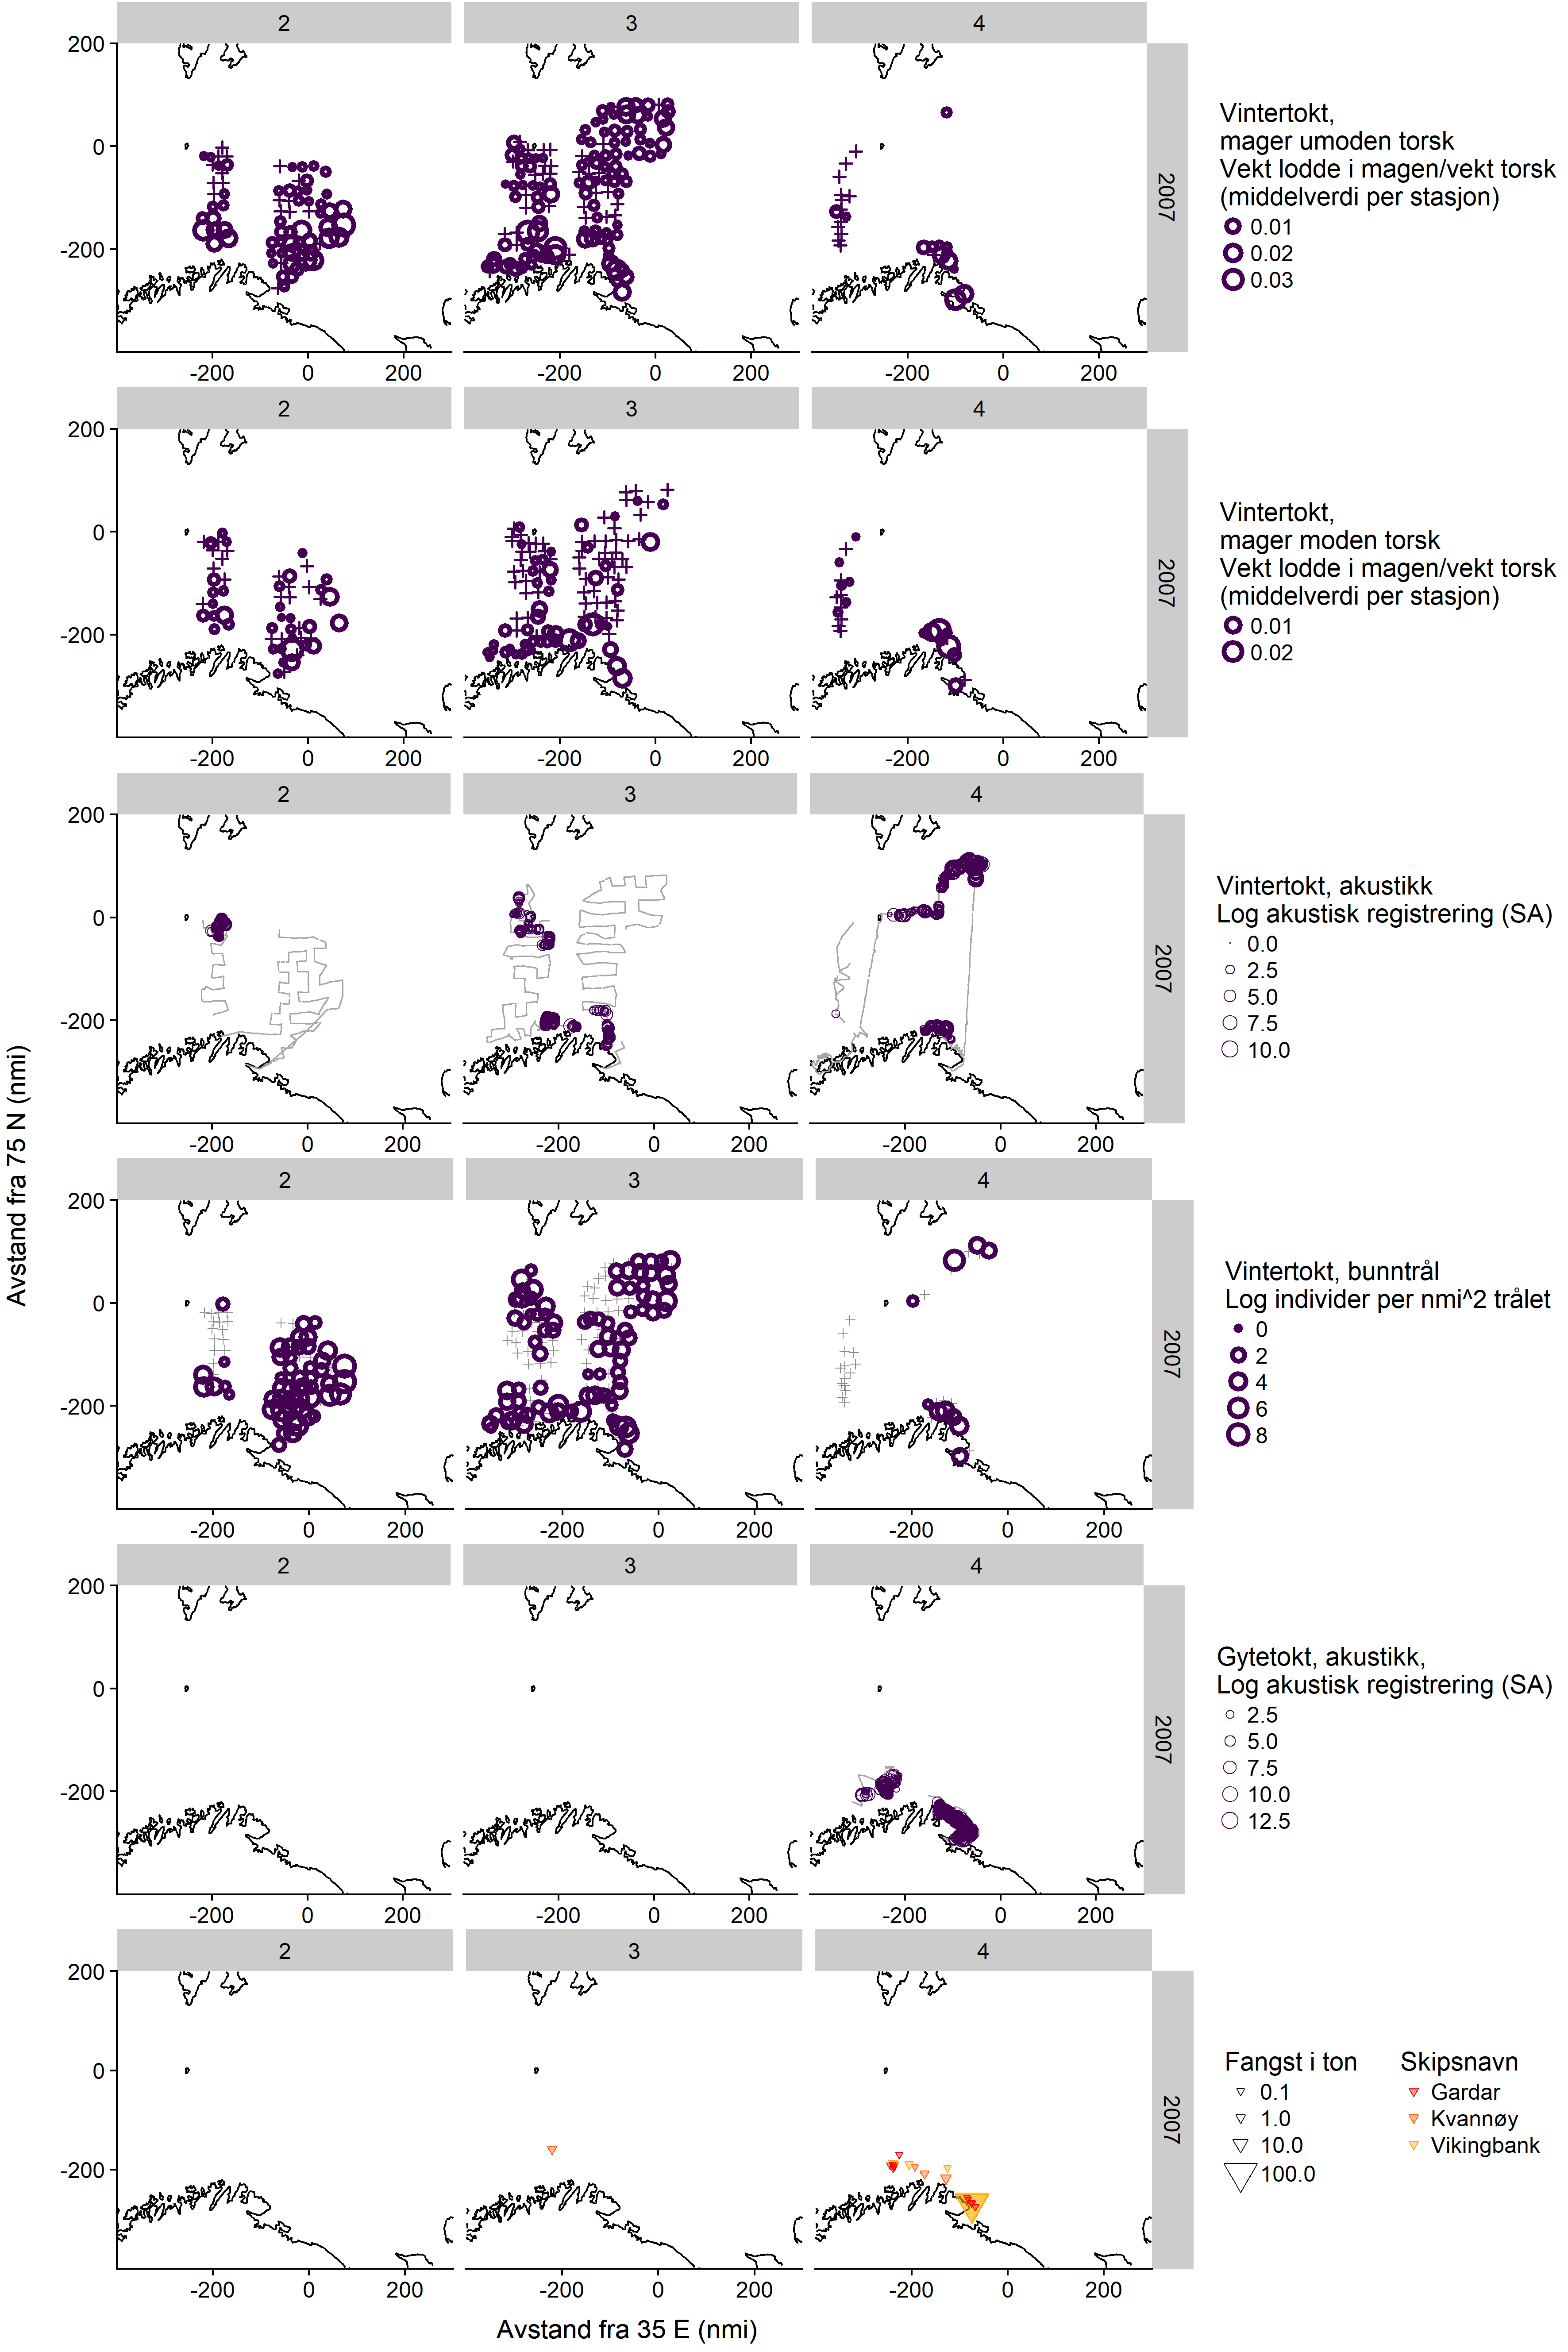
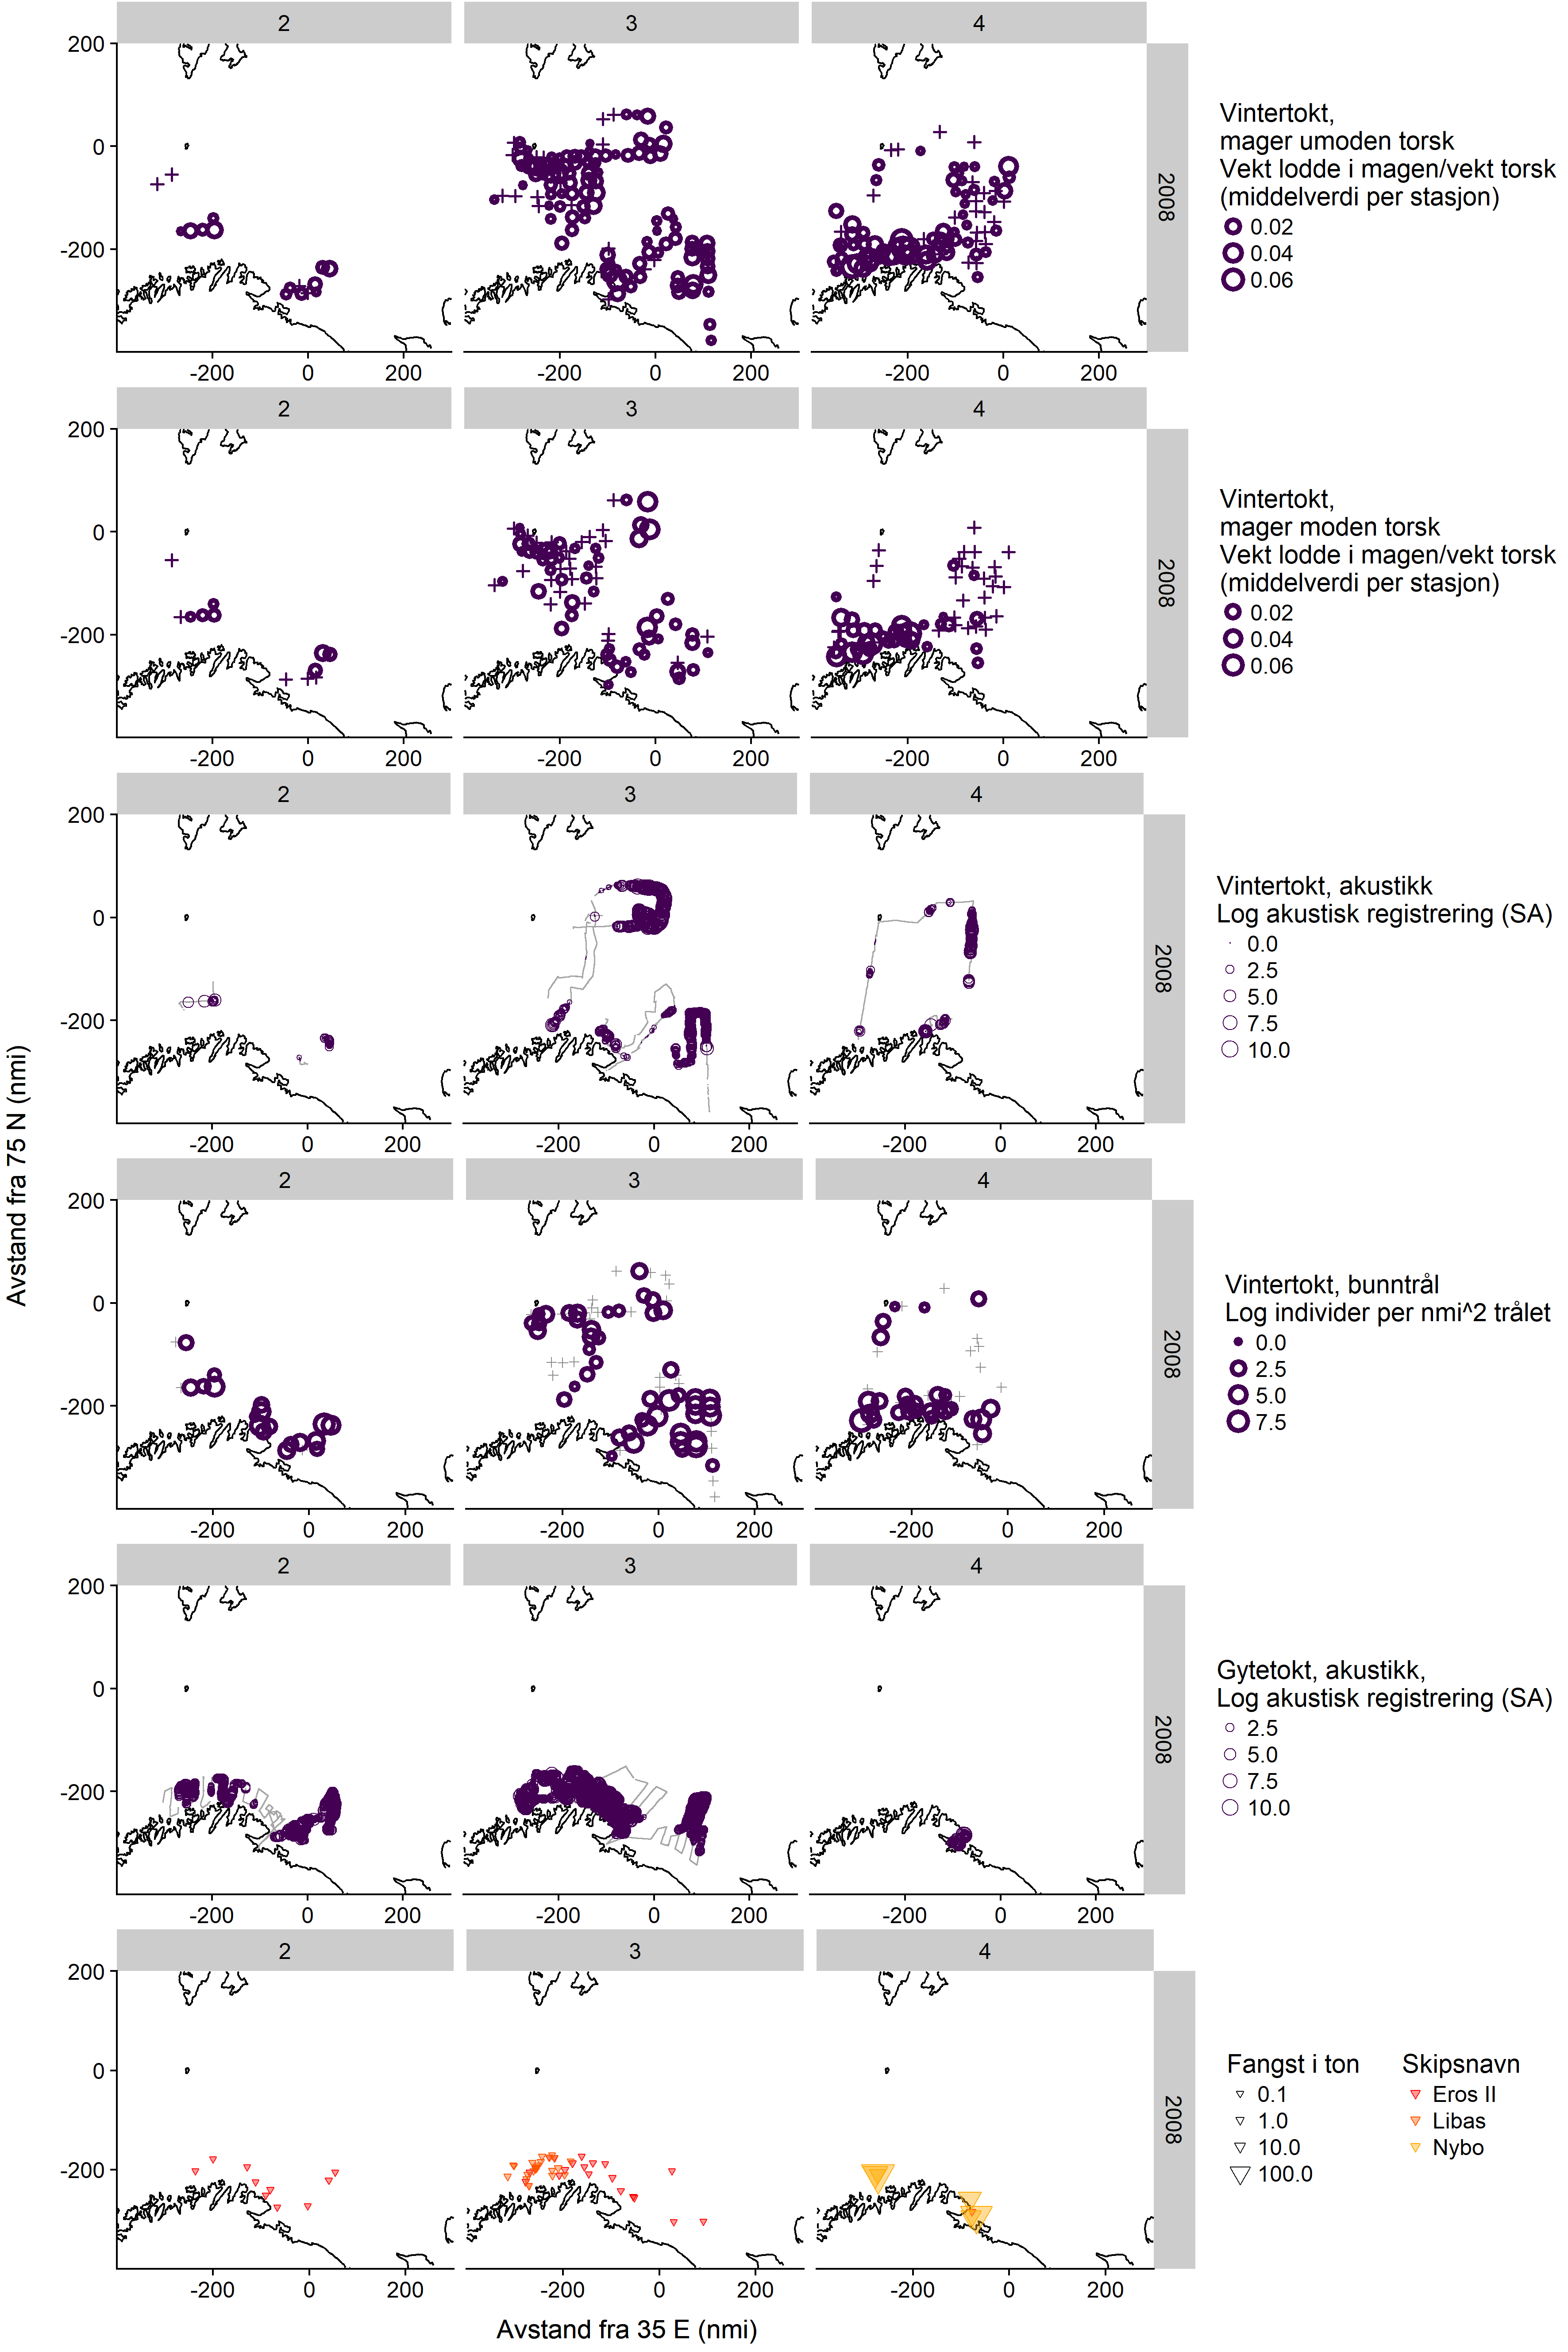
7 - Appendix 2: Maps of capelin distribution from the dedicated spawning surveys in 2007-2009, with winter survey data and fishing locations (in Norwegian)
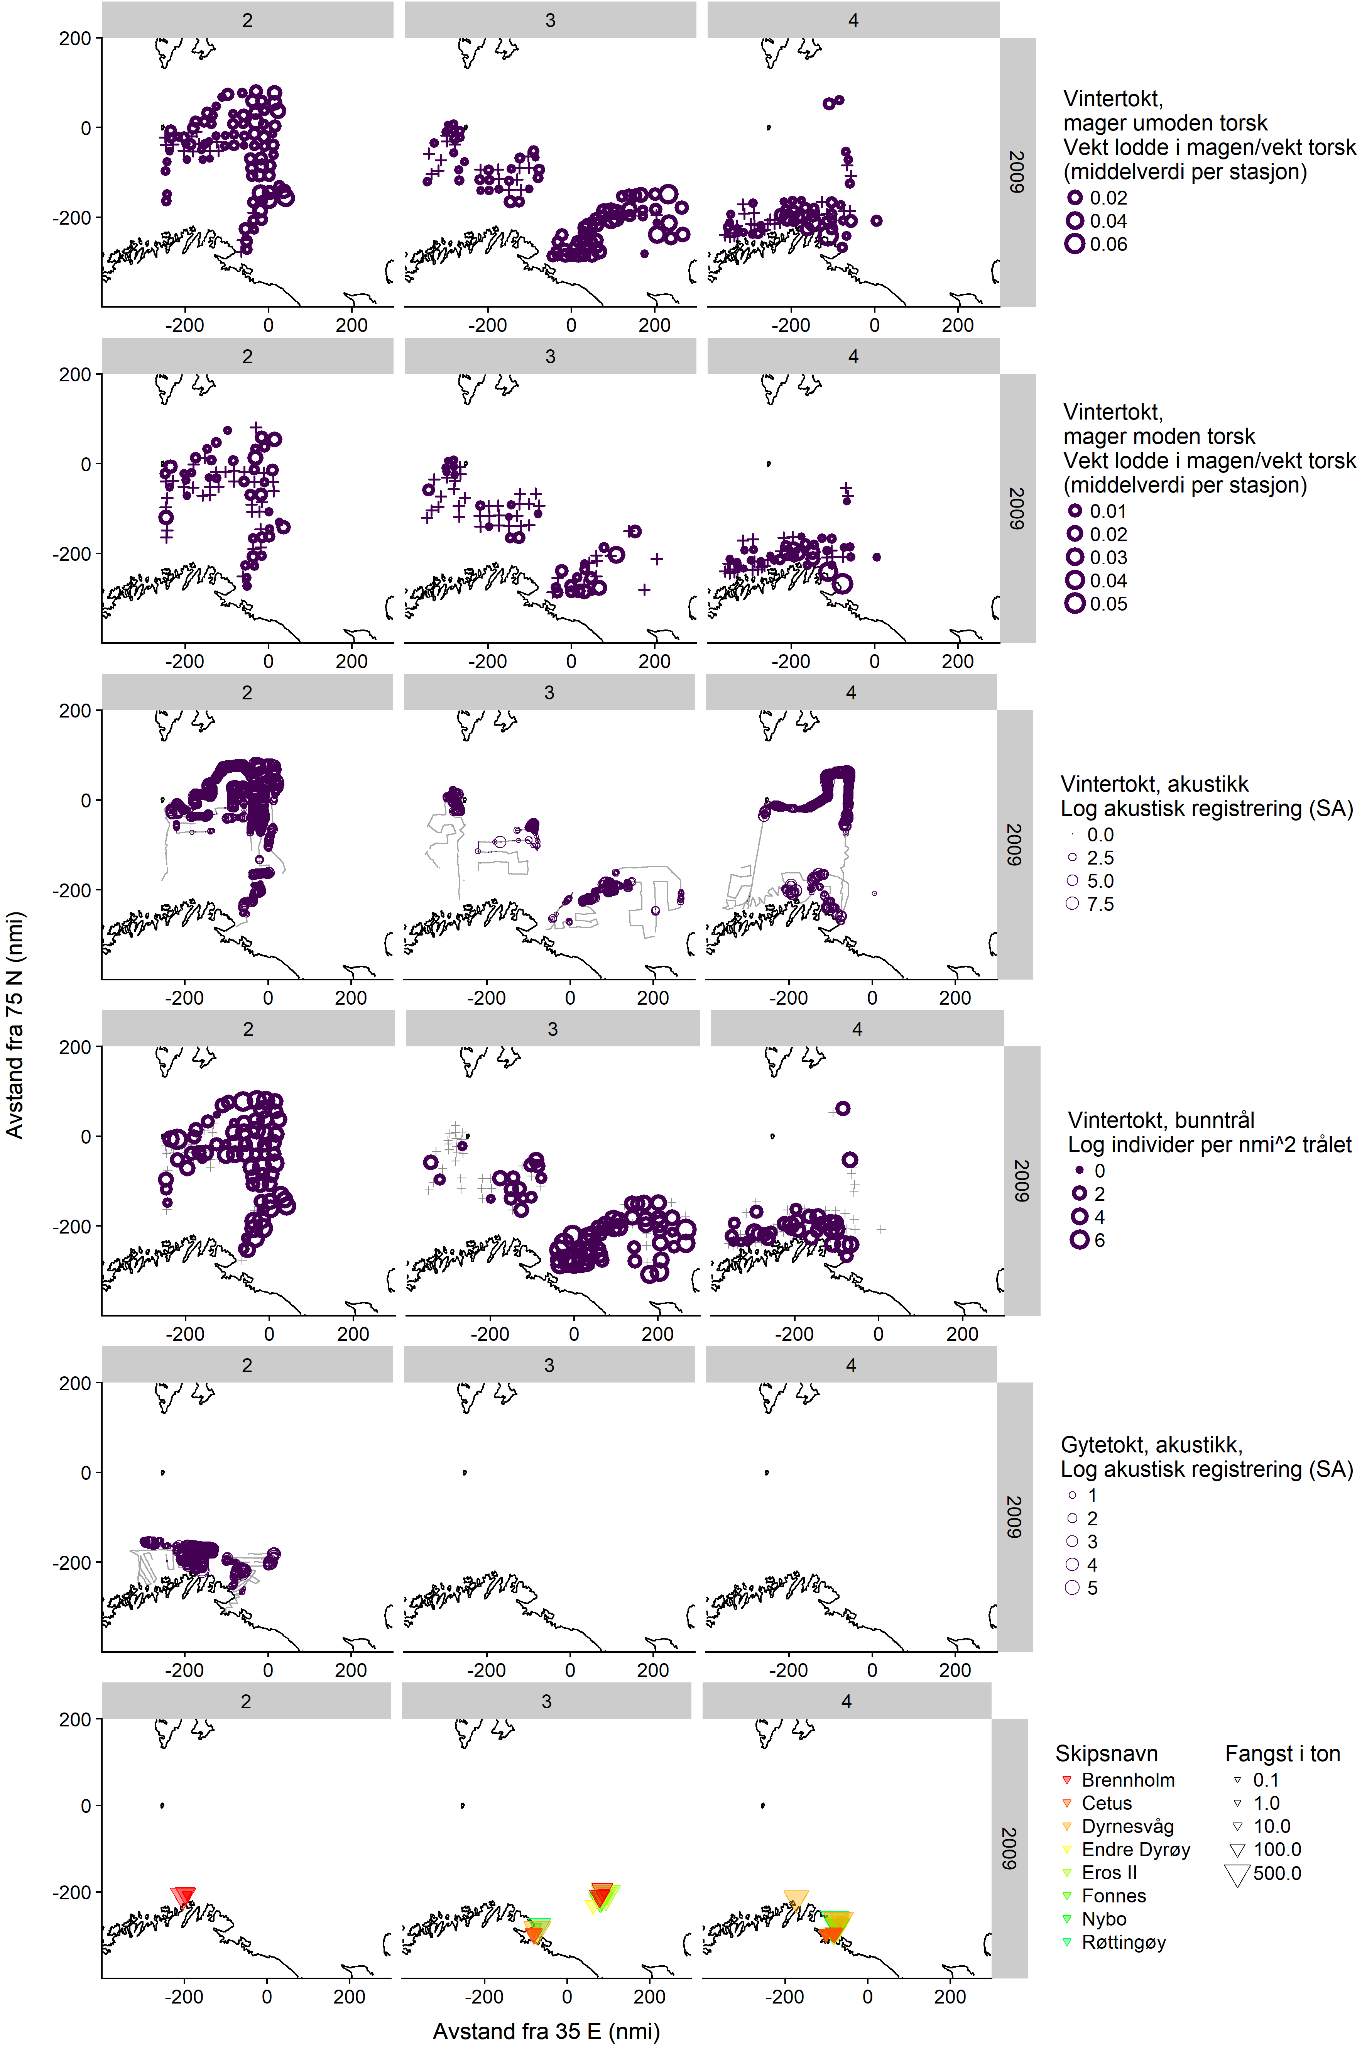
Here we show maps of all available data on winter capelin distribution in 2007-2009, including the dedicated surveys. Each figure shows the distribution in one year, divided by three sampling periods (horizontal panels, 2: 1-15/2, 3: 16-29/2, 4: 1-15/3) and sampling method (vertical panels showing, in order, winter survey immature cod stomachs, winter survey mature cod stomachs, winter survey demersal trawl, winter survey acoustics, dedicated survey acoustics, and commercial catches).
8 - Appendix 3: 2016 report of capelin in stomachs of cod landed on the coast of northern Norway (in Norwegian)
Havforskningsinstituttets oppsummering fra rapportering av lodde i torskemager 2016
Tekst: Georg Skaret
Bakgrunn
Loddebestanden er en nøkkelbestand i Barentshavet, både som høstbar ressurs og som føde for fisk og andre dyr høyere i næringskjeden, særlig torsk. Havforskningsinstituttet har årlige tokt i Barentshavet om høsten hvor et av hovedformålene er å måle loddebestanden og gi råd til myndighetene om forsvarlig høsting av bestanden. Om vinteren under gyteinnsiget av lodde har vi ikke samme målrettede overvåkning, og ønsker derfor informasjon fra fiskemottak om lodde i torskemager slik at vi har informasjon om hvor og når loddeinnsiget inntreffer.
Deltagelse
Det deltok i år 14 fiskemottak i lodderapportering, fordelt geografisk som vist i figur 1. Deltagelsen var stort sett god gjennom sesongen (se Tabell 1). Den beste deltagelsen var i februar/mars fra uke 6 til uke 9, mens den var noe avtagende mot slutten muligens grunnet lav aktivitet ved enkelte mottak. Karlsøybruket AS i Vannvåg hadde best oppfølging på rapporteringen etterfulgt av Tobø fisk i Havøysund og Henry Johansen Drift AS på Vengsøy.
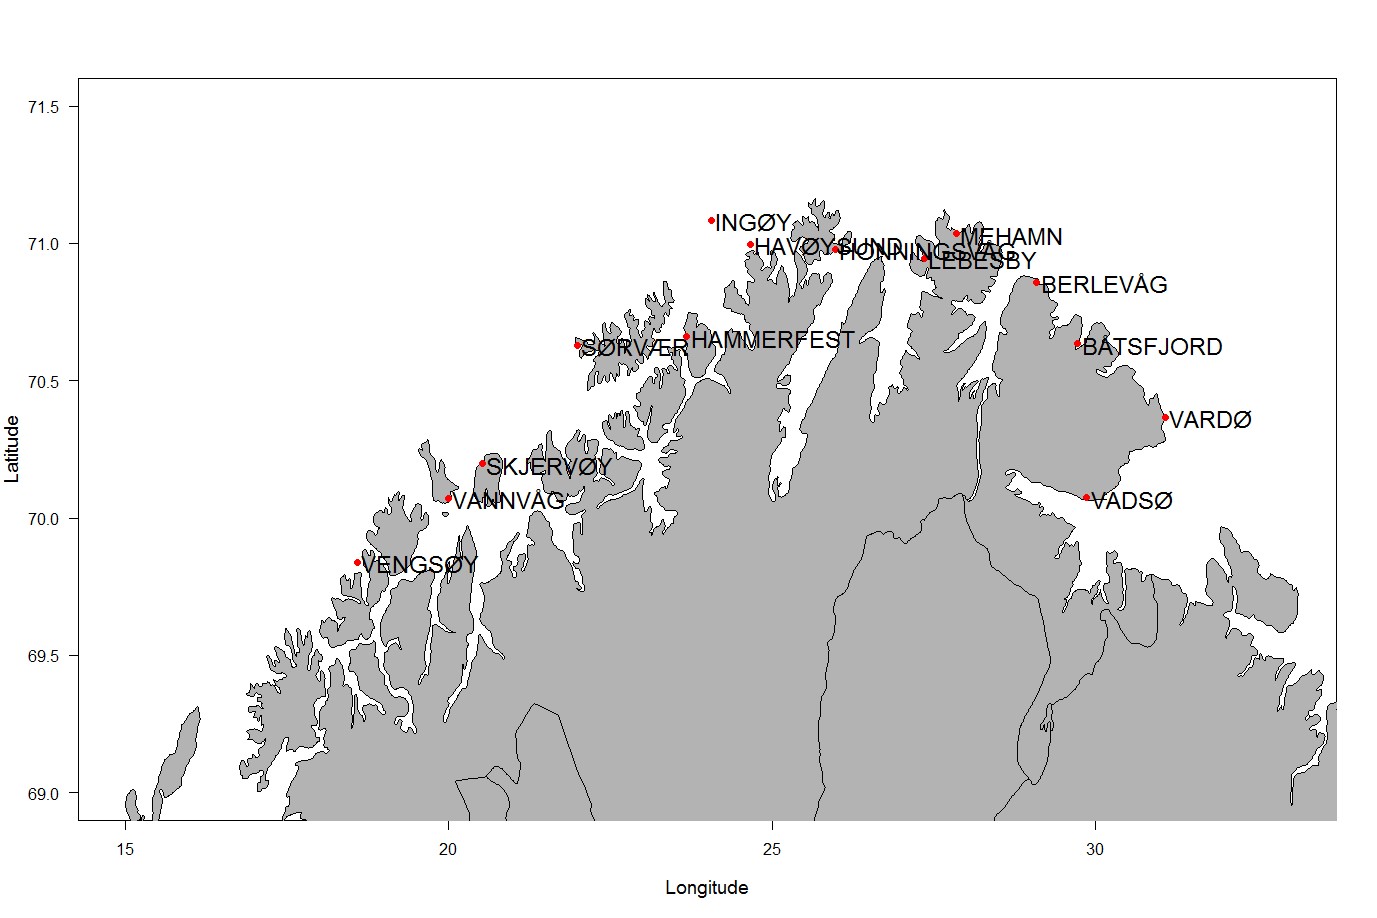
Tabell 1. Deltagelsen for 2016 er vist i tabellen under. Grønt angir at rapport er avgitt.
| UKE | ||||||||||||||||||
| Fiskemottak | Sted | 1 | 2 | 3 | 4 | 5 | 6 | 7 | 8 | 9 | 10 | 11 | 12 | 13 | 14 | 15 | 16 | 17 |
| Vadsøbruket | VADSØ | |||||||||||||||||
| Vardøbruket AS | VARDØ | |||||||||||||||||
| Lerøy Norway Seafoods avdeling Båtsfjord | BÅTSFJORD | |||||||||||||||||
| Lerøy Norway Seafoods avdeling Berlevåg | BERLEVÅG | |||||||||||||||||
| Isanlegget AS | MEHAMN | |||||||||||||||||
| Ingøyfisk | INGØY | |||||||||||||||||
| Nordvågen AS | HONNINGSVÅG | |||||||||||||||||
| Tobø Fisk AS | HAVØYSUND | |||||||||||||||||
| Lerøy Norway Seafoods avdeling Sørvær | SØRVÆR | |||||||||||||||||
| Karlsøybruket AS | VANNVÅG | |||||||||||||||||
| Henry Johansen Drift AS | VENGSØY | |||||||||||||||||
| Norway Seafood avdeling Forsøl | HAMMERFEST | |||||||||||||||||
| Årvikbruket AS | SKJERVØY | |||||||||||||||||
| Havfisk A/S | LEBESBY | |||||||||||||||||
Resultater
Loddemengde i magene
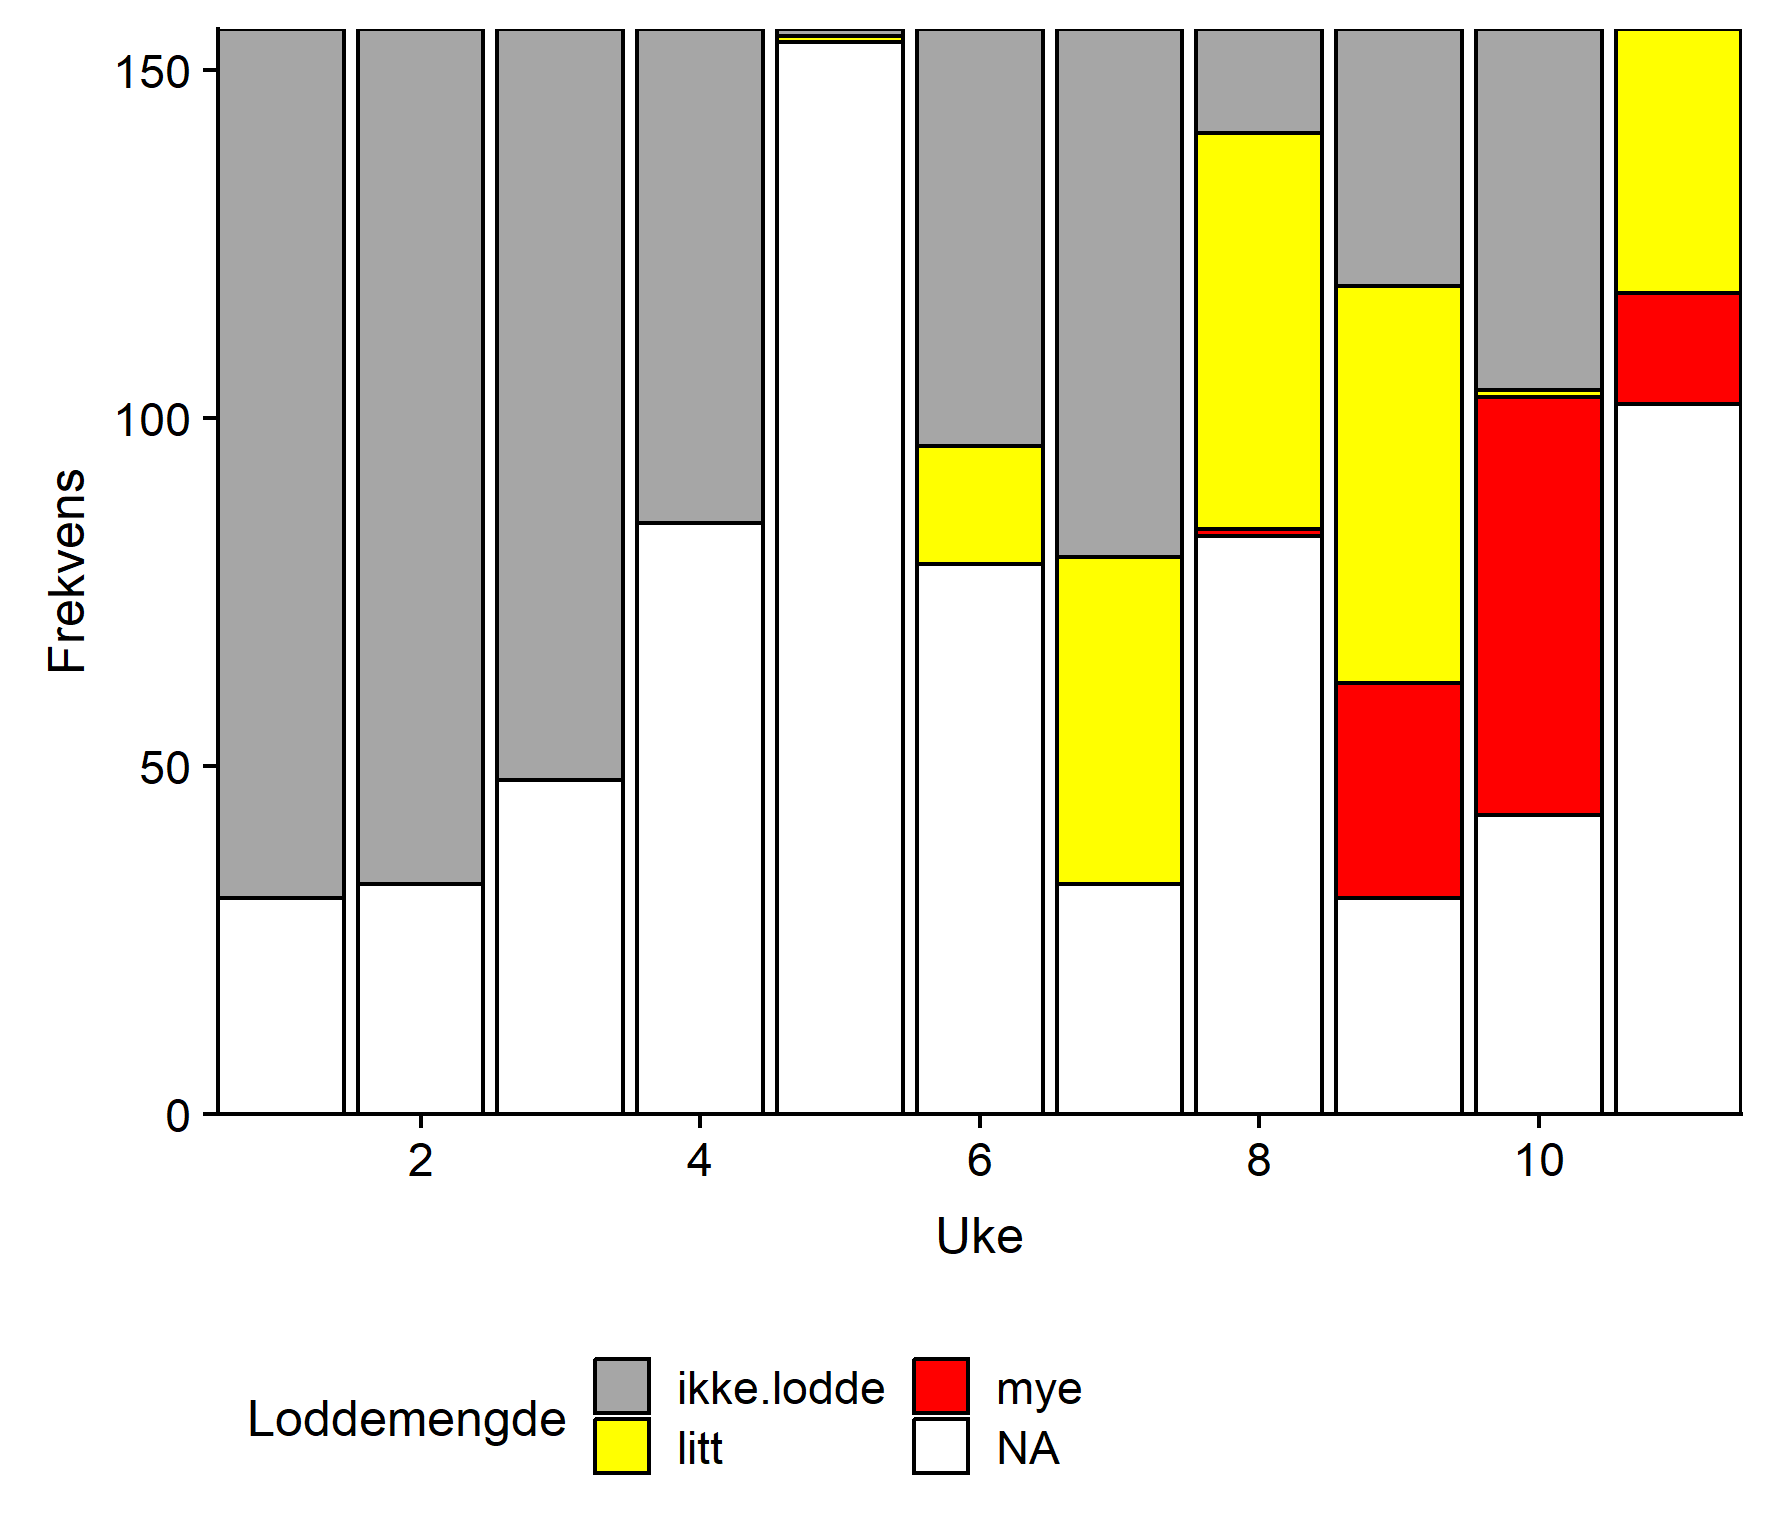
De fire første ukene ble det ikke rapportert om lodde i torskemager fra noen anlegg (Fig. 2). I uke 5 ble det rapportert lodde fra ett anlegg og dette økte gradvis fram mot uke 9 da det ble rapportert lodde fra 9 anlegg, og mye lodde ble rapportert fra 3 av disse. Uke 10 hadde relativt sett flest rapporter om mye lodde. Fram mot uke 15 varierte antall rapporter om lodde mellom 4 og 7. I uke 16 og 17 rapporterte 2 av 4 om lodde og i uke 17 var det bare ett rapporterende anlegg igjen, dette rapporterte ingen lodde. Hele perioden sett under ett var det anlegg sentralt som rapporterte mest lodde. Ingen anlegg rapporterte om torskemager fulle av lodde.
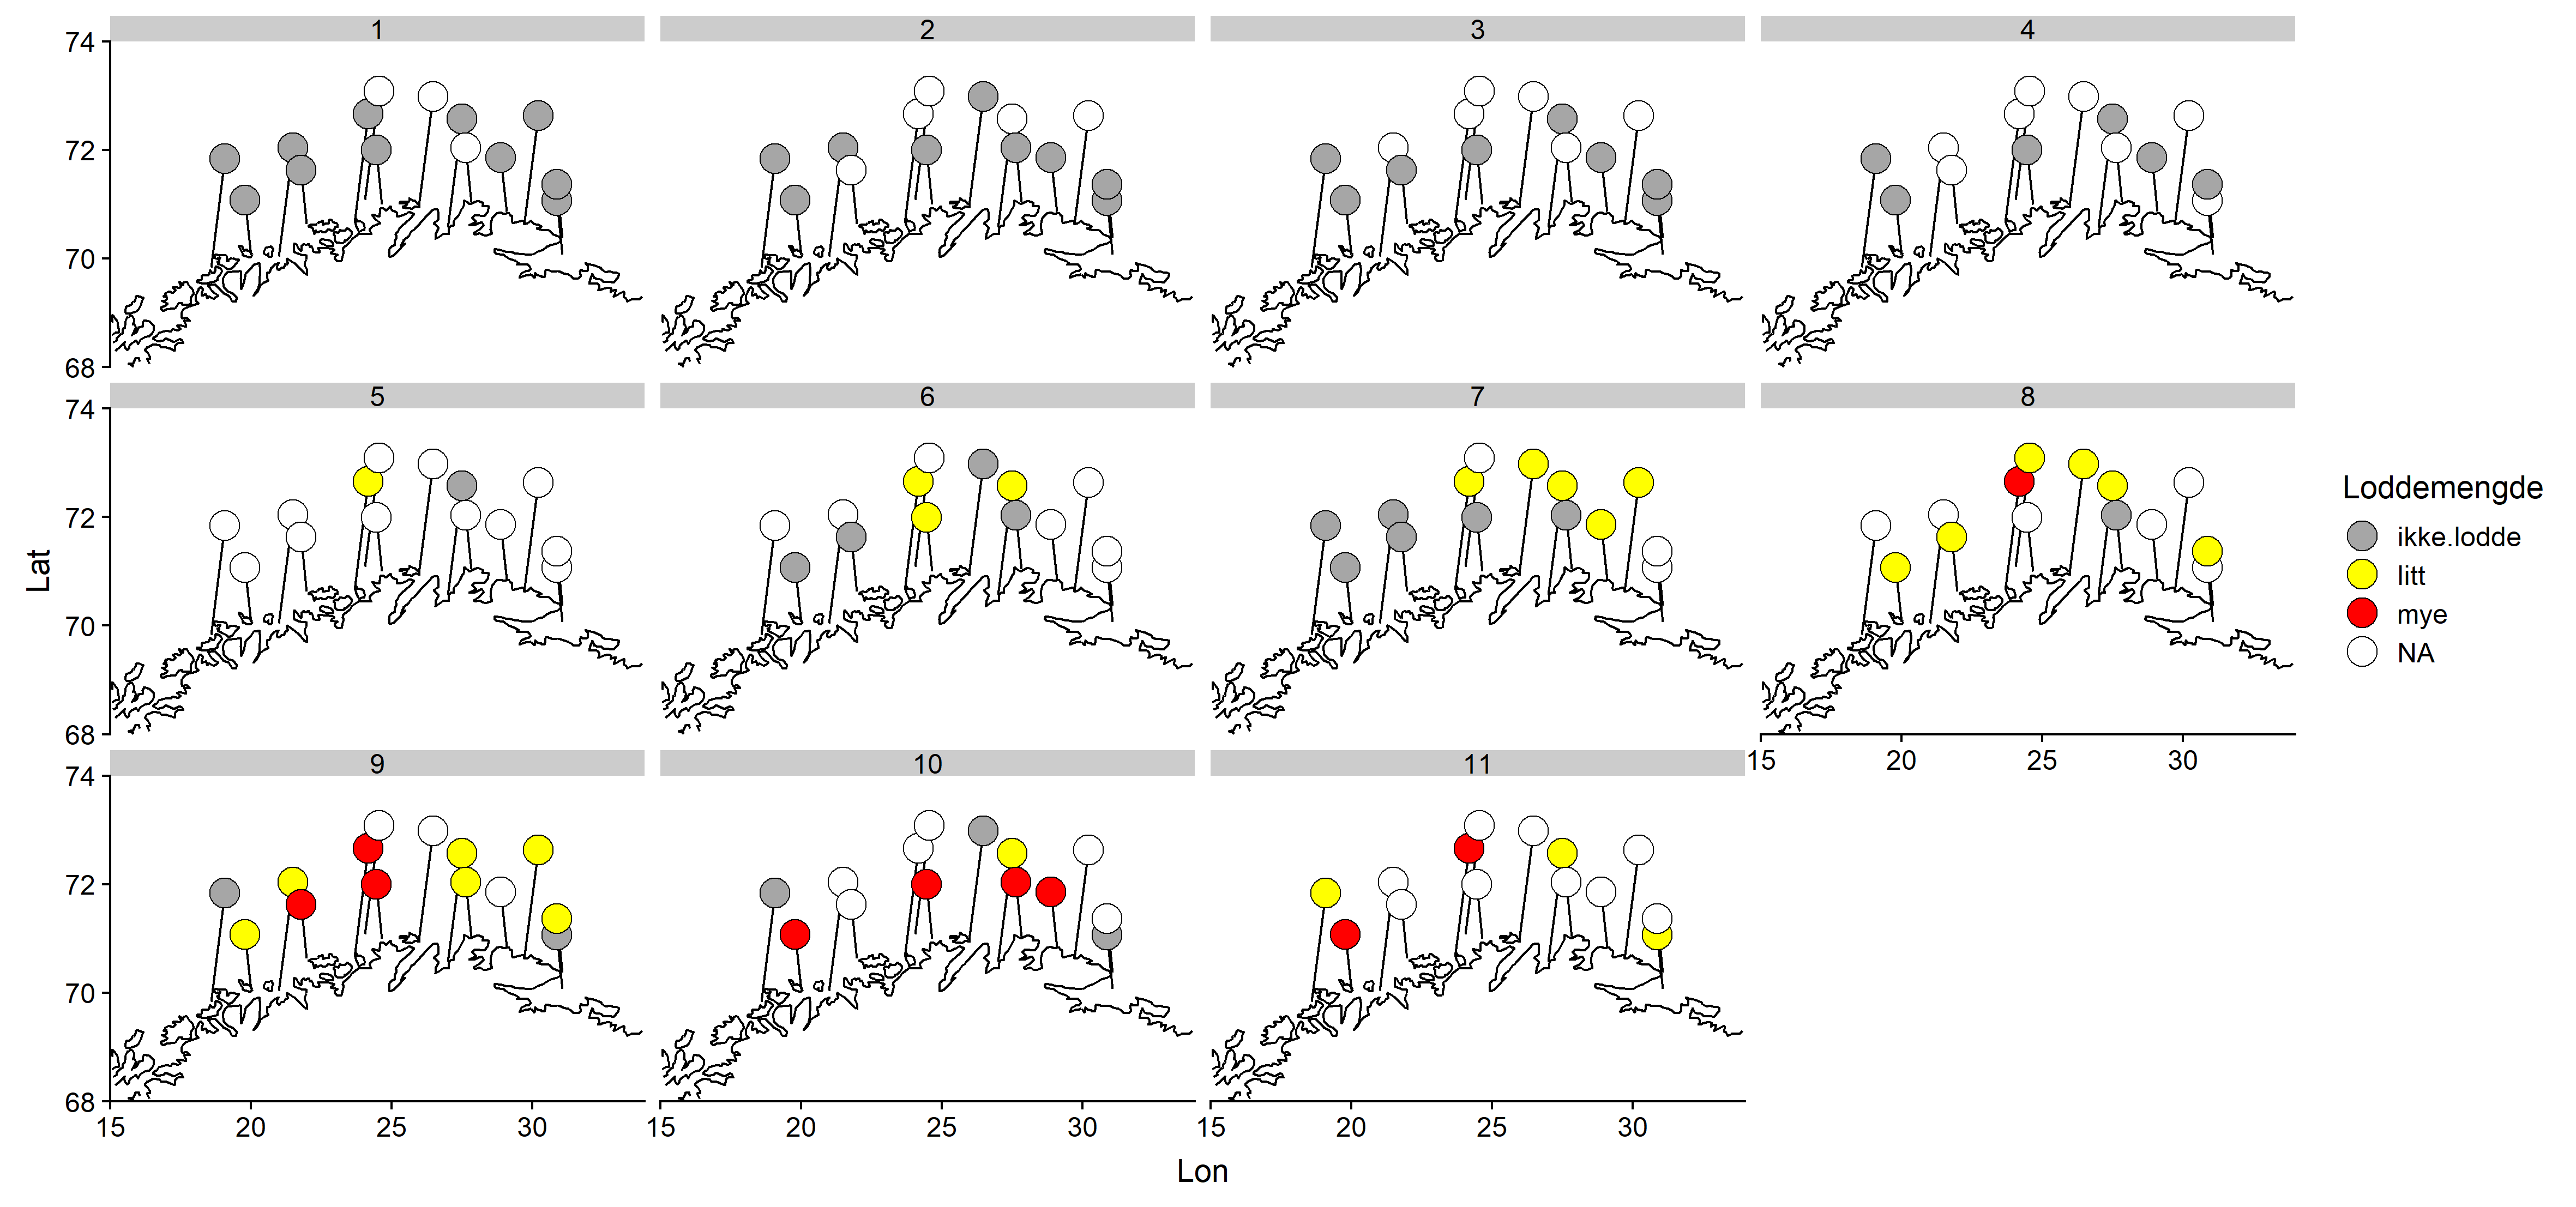
Det ble rapportert om fersk lodde i torskemagene for første gang i Uke 8 (Figur 3) fra fem ulike mottak. Siste rapport om fersk lodde var i uke 16. I perioden mellom varierte antallet rapporter om fersk lodde i magene mellom 2 og 4.
Loddefordøyelse
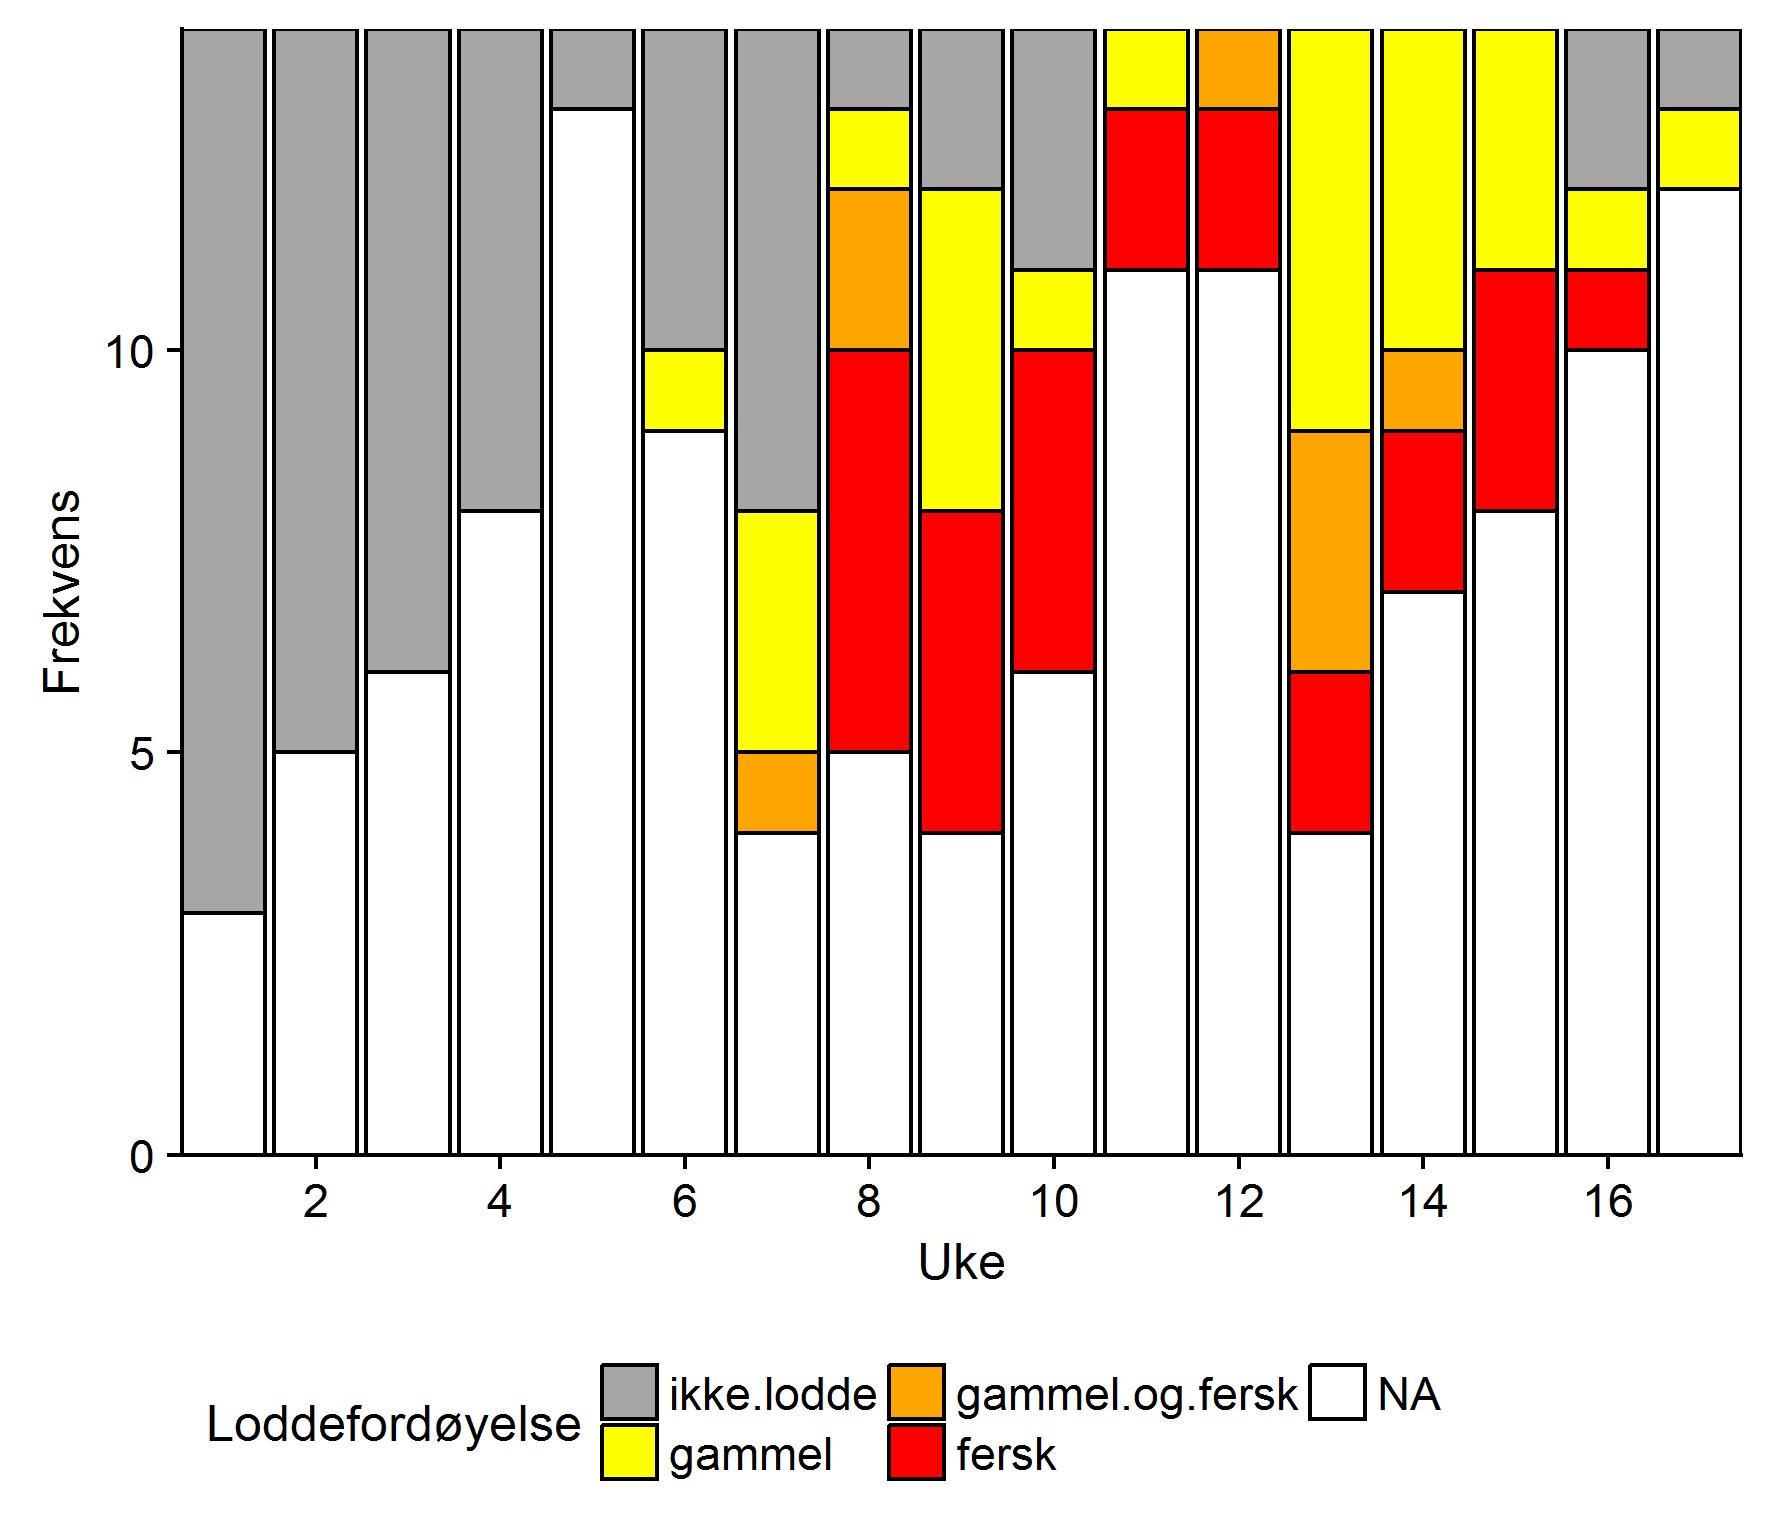
Loddestørrelse
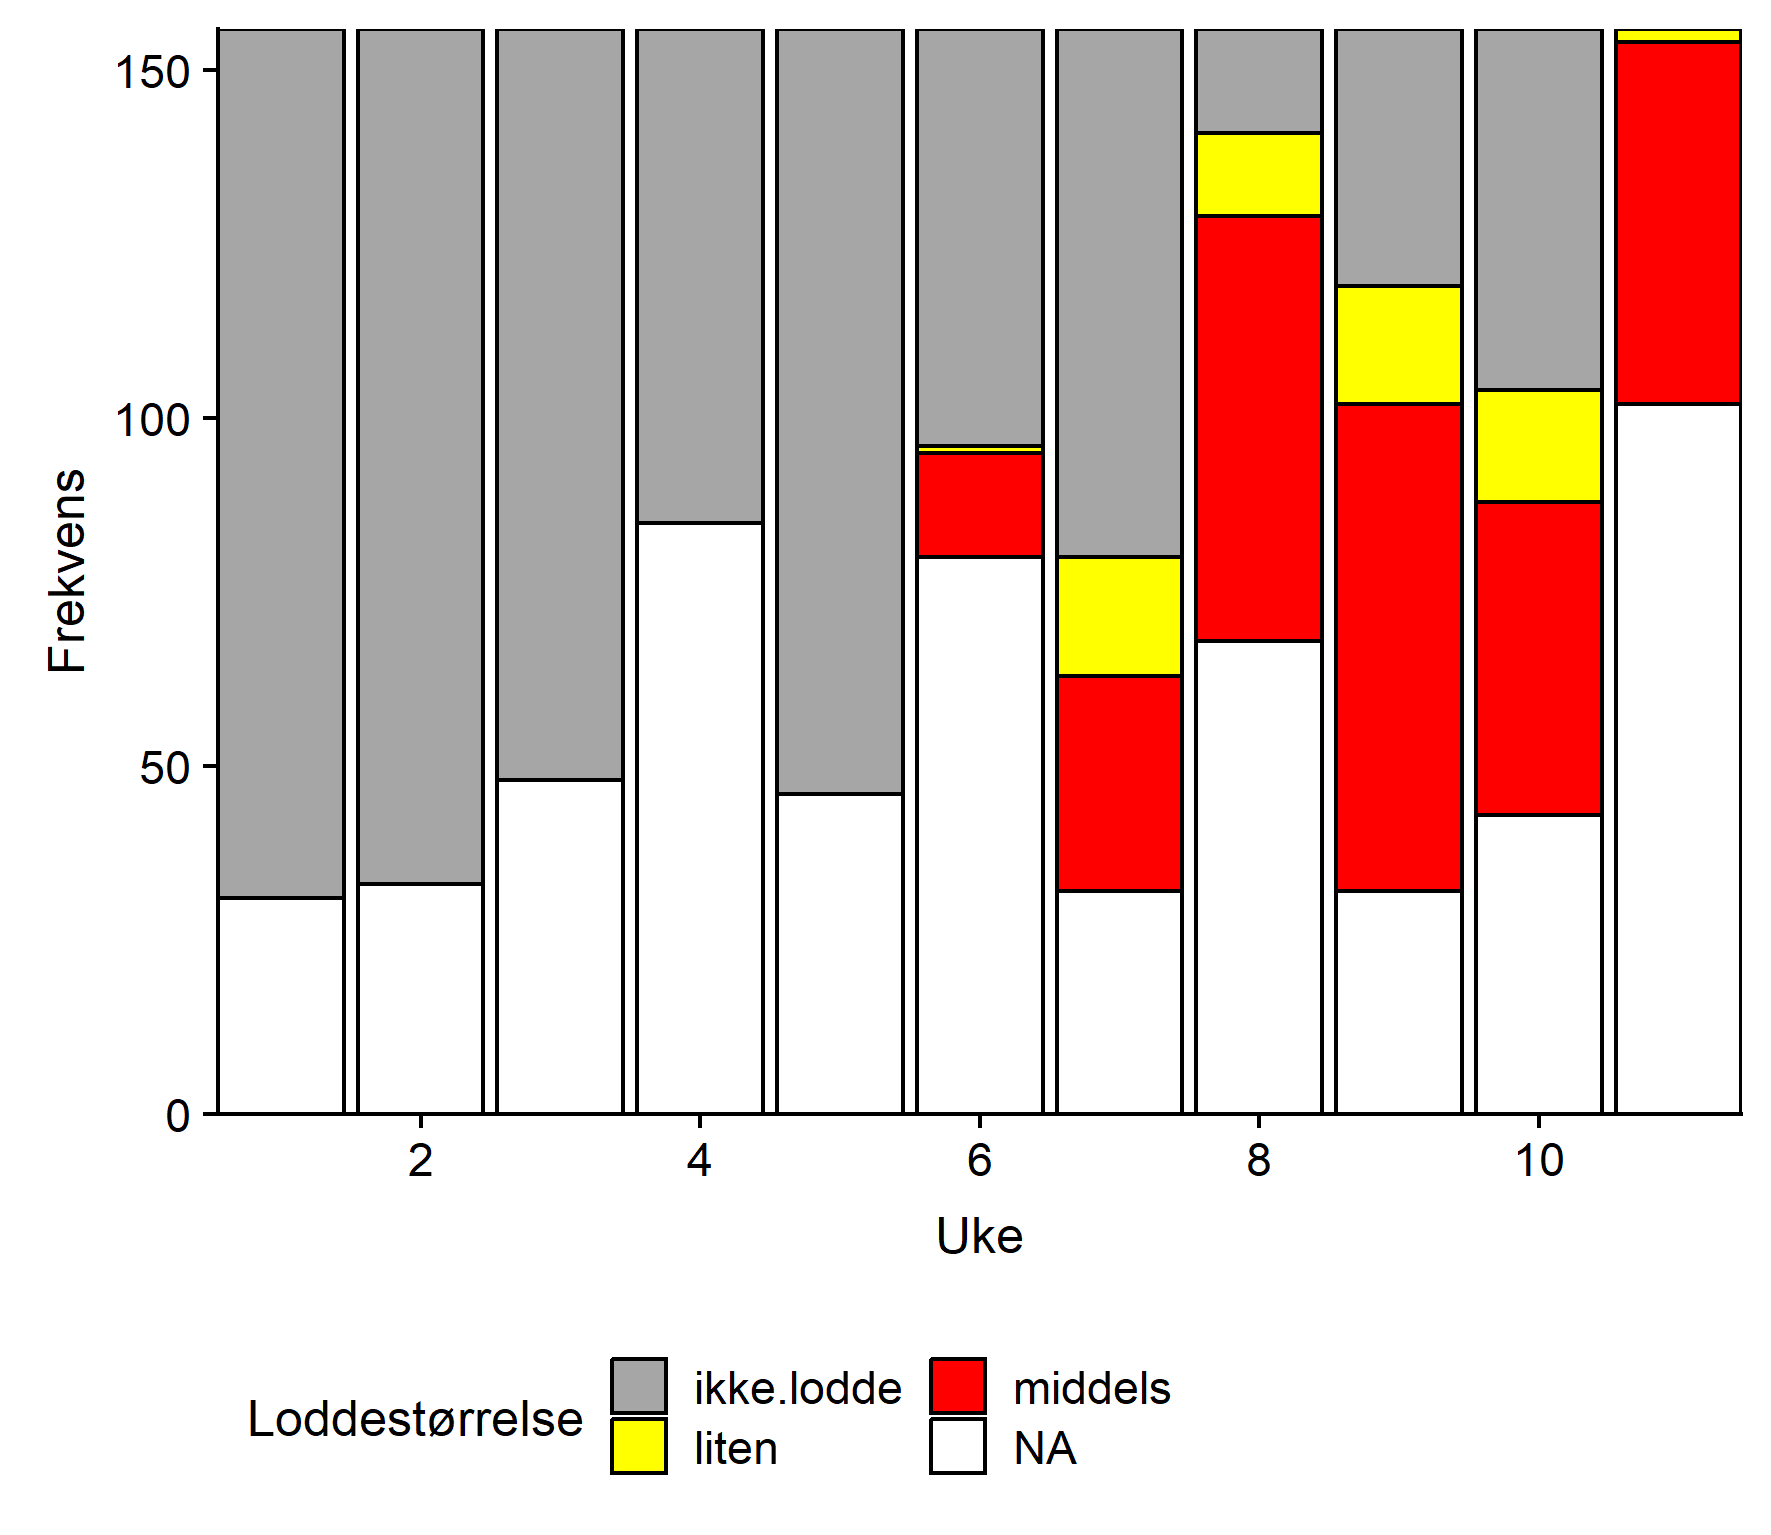
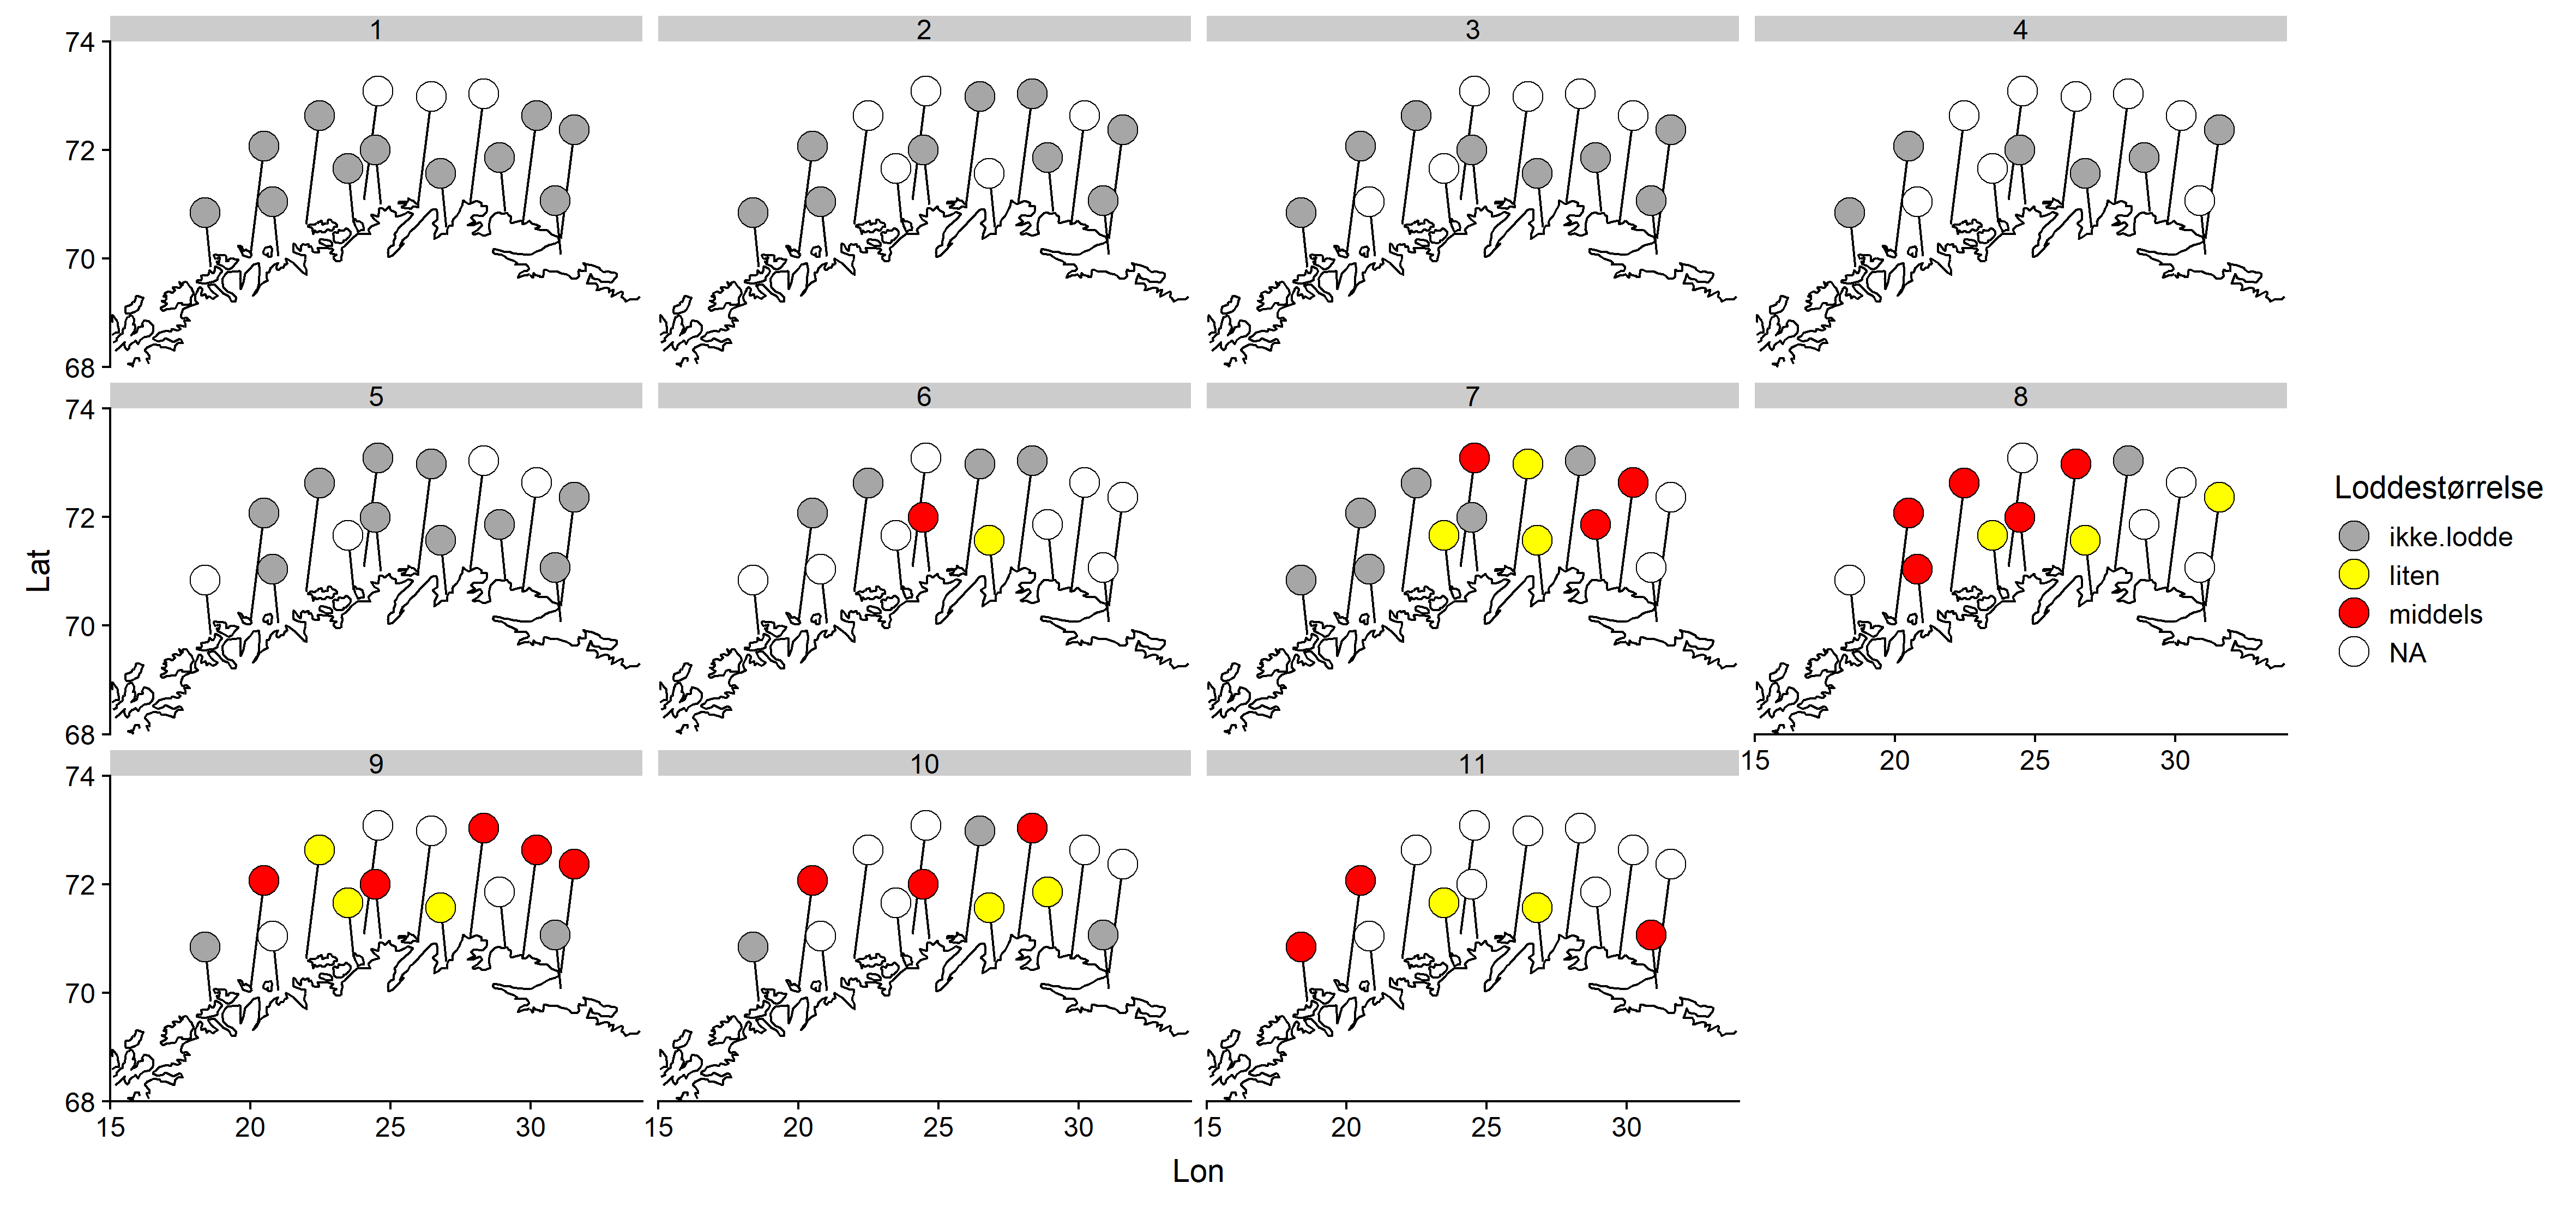
Jevnt over er det middels stor lodde som blir rapportert hyppigst (Figur 4). Ingen stor lodde ble rapportert. Det synes ikke å være noe geografisk mønster i størrelsesfordelingen.
Konklusjon
Lodderapportene indikerte at loddeinnsiget startet sentralt i Uke 5, var på sitt sterkeste i uke 9/10 og avtok etter uke 15. Fra uke 11 til uke 16 rapporterte samtlige som sendte inn om lodde i torskemager, men det var ingen rapporter om fulle mager. Det var ingen tydelig geografisk dreiing av innsiget, men sentrale områder rapporterte om mest lodde hele perioden sett under ett.
Havforskningsinstituttet takker alle mottak som har vært med på innsamlingen i 2016, dette er svært verdifull informasjon for vårt arbeid. Oppslutningen om rapporteringen var god.
Skjema brukt til rapportering i 2016:
INNSIG / LODDERAPPORTERING JANUAR – MAI 2016
Et supplement til forskernes data ved HAVFORSKNINGSINSTITUTTET (Georg Skaret), fra fiskemottakene langs Finnmarkskysten og Nord- Troms og i samarbeid med lokale fiskere. Registreringen er i hovedsak basert på mageinnholdet på torsken.
Fylles ut i gule felt og sendes ukentlig hver TORSDAG til:
Måsøy i Vekst KF: even@masoy.kommune.no
Uke Nr:…….
Sett kryss for Lodde-størrelse:
Liten Middels Stor
| Ingen lodde | |||||
| Litt lodde | |||||
| Mye lodde | |||||
| Full av lodde | |||||
| Gammel lodde | |||||
| Fersk lodde | |||||
Kommentar :
Kontaktperson /
Avsender: .
| Nr.: |
Sted : Dato :
Fiskemottak: .
Send skjema som vedlegg i epost til even@masoy.kommune.no
Eller, fyll ut skjema manuelt og send i posten.
9 - Appendix 4: 2018 report of capelin in stomachs of cod landed on the coast of northern Norway (in Norwegian)
Havforskningsinstituttets oppsummering fra rapportering av lodde i torskemager 2018
Tekst: Georg Skaret
Bakgrunn
Loddebestanden er en nøkkelbestand i Barentshavet, både som høstbar ressurs og som føde for fisk og andre dyr høyere i næringskjeden, særlig torsk. Havforskningsinstituttet har årlige tokt i Barentshavet om høsten hvor et av hovedformålene er å måle loddebestanden og gi råd til myndighetene om forsvarlig høsting av bestanden. Om vinteren under gyteinnsiget av lodde har vi ikke samme målrettede overvåkning, og ønsker derfor informasjon fra fiskemottak om lodde i torskemager slik at vi har informasjon om hvor og når loddeinnsiget inntreffer.
Deltagelse
Det deltok i år 17 fiskemottak i lodderapportering, fordelt geografisk som vist i figur 1. Deltagelsen var variabel fra mottak til mottak og gjennom sesongen (se Tabell 1). Den beste deltagelsen var ved starten av rapporteringsperioden fra uke 8 til uke 12, og noe av den avtagende deltagelsen mot slutten kan skyldes lav aktivitet ved enkelte mottak. Isanlegget AS Mehamn, Lerøy Norway Seafoods avdeling Sørvær, Henry Johansen Drift AS og Norway Shrimp AS Bugøynes hadde best oppfølging på rapporteringen.
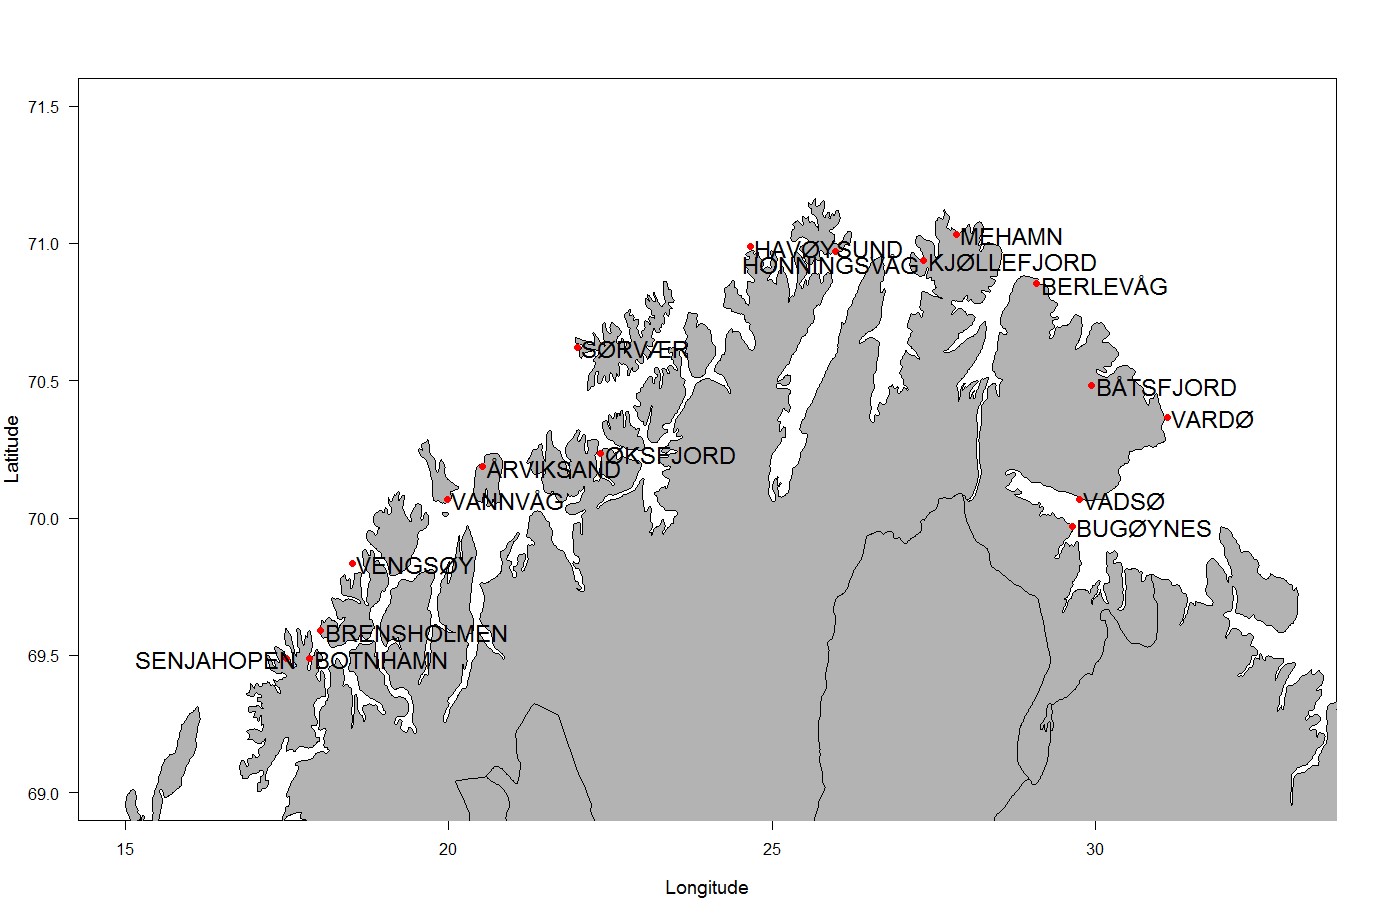
Tabell 1. Deltagelsen for 2018 er vist i tabellen under. Grønt angir at rapport er avgitt.
| UKE | ||||||||||||||||||||||||||||
| Fiskemottak | Sted | 8 | 9 | 10 | 11 | 12 | 13 | 14 | 15 | 16 | 17 | 18 | 19 | 20 | 21 | 22 | ||||||||||||
| Vadsøbruket | VADSØ | |||||||||||||||||||||||||||
| Vardøbruket AS | VARDØ | |||||||||||||||||||||||||||
| Lerøy Norway Seafoods avdeling Båtsfjord | BÅTSFJORD | |||||||||||||||||||||||||||
| Lerøy Norway Seafoods avdeling Berlevåg | BERLEVÅG | |||||||||||||||||||||||||||
| Isanlegget AS | MEHAMN | |||||||||||||||||||||||||||
| Aksel Hansen AS | SENJAHOPEN | |||||||||||||||||||||||||||
| Stofi AS | HONNINGSVÅG | |||||||||||||||||||||||||||
| Tobø Fisk AS | HAVØYSUND | |||||||||||||||||||||||||||
| Lorentzen Fisk AS | BRENSHOLMEN | |||||||||||||||||||||||||||
| Polarctic Seafood AS | ØKSFJORD | |||||||||||||||||||||||||||
| Lerøy Norway Seafoods avdeling Sørvær | SØRVÆR | |||||||||||||||||||||||||||
| Karlsøybruket AS | VANNVÅG | |||||||||||||||||||||||||||
| Henry Johansen Drift AS | VENGSØY | |||||||||||||||||||||||||||
| Nord Senja Fisk AS | BOTNHAMN | |||||||||||||||||||||||||||
| Årvikbruket AS | ÅRVIKSAND | |||||||||||||||||||||||||||
| Lerøy Norway Seafoods avdeling Kjøllefjord | KJØLLEFJORD | |||||||||||||||||||||||||||
| Norway Shrimp AS | BUGØYNES | |||||||||||||||||||||||||||
Resultater
Loddemengde i magene
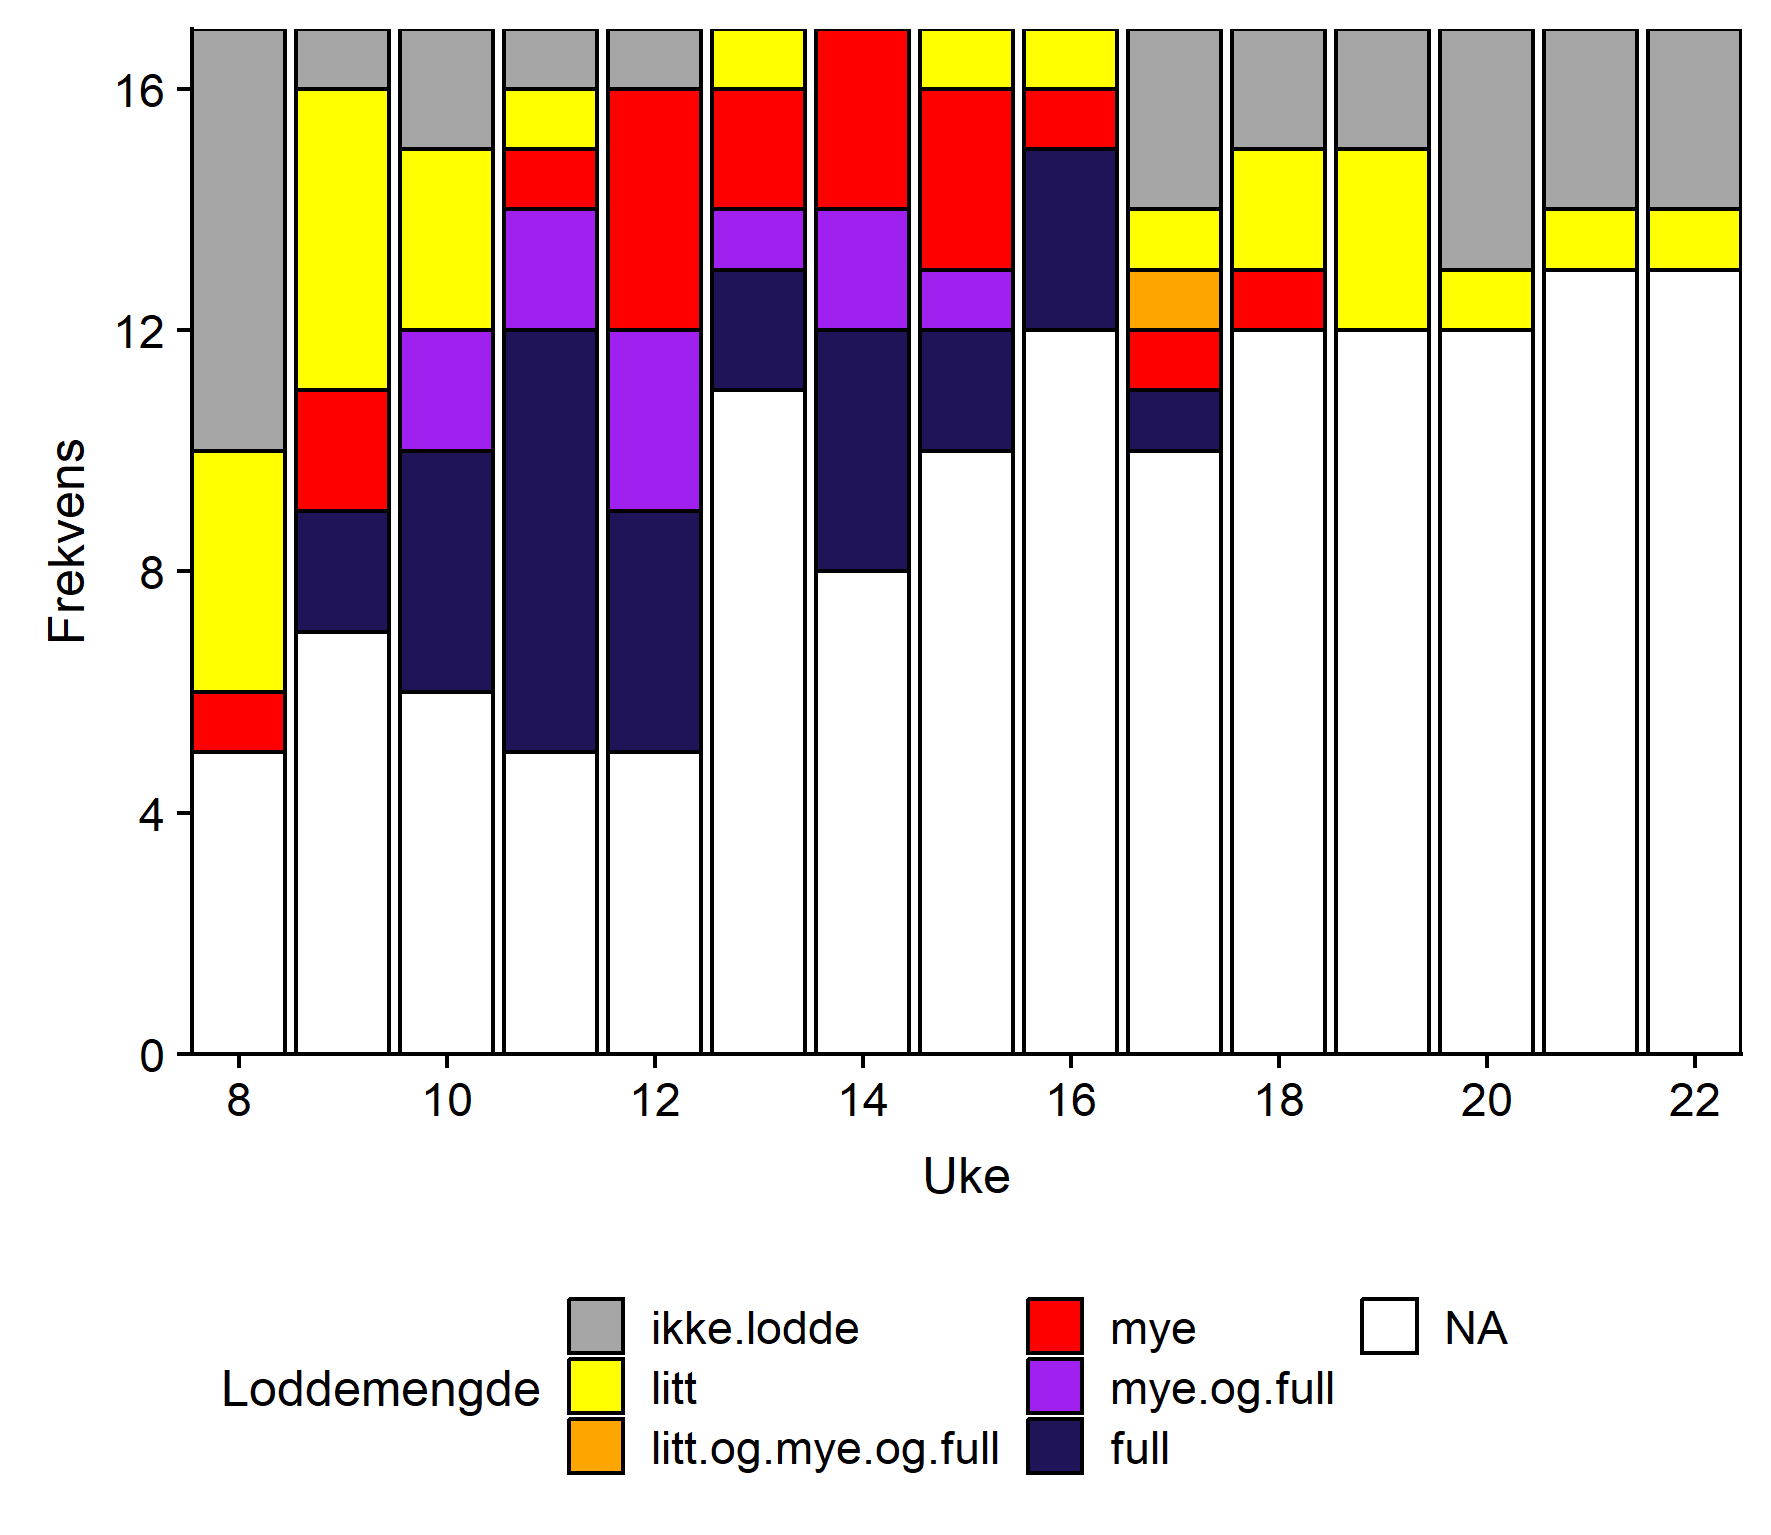
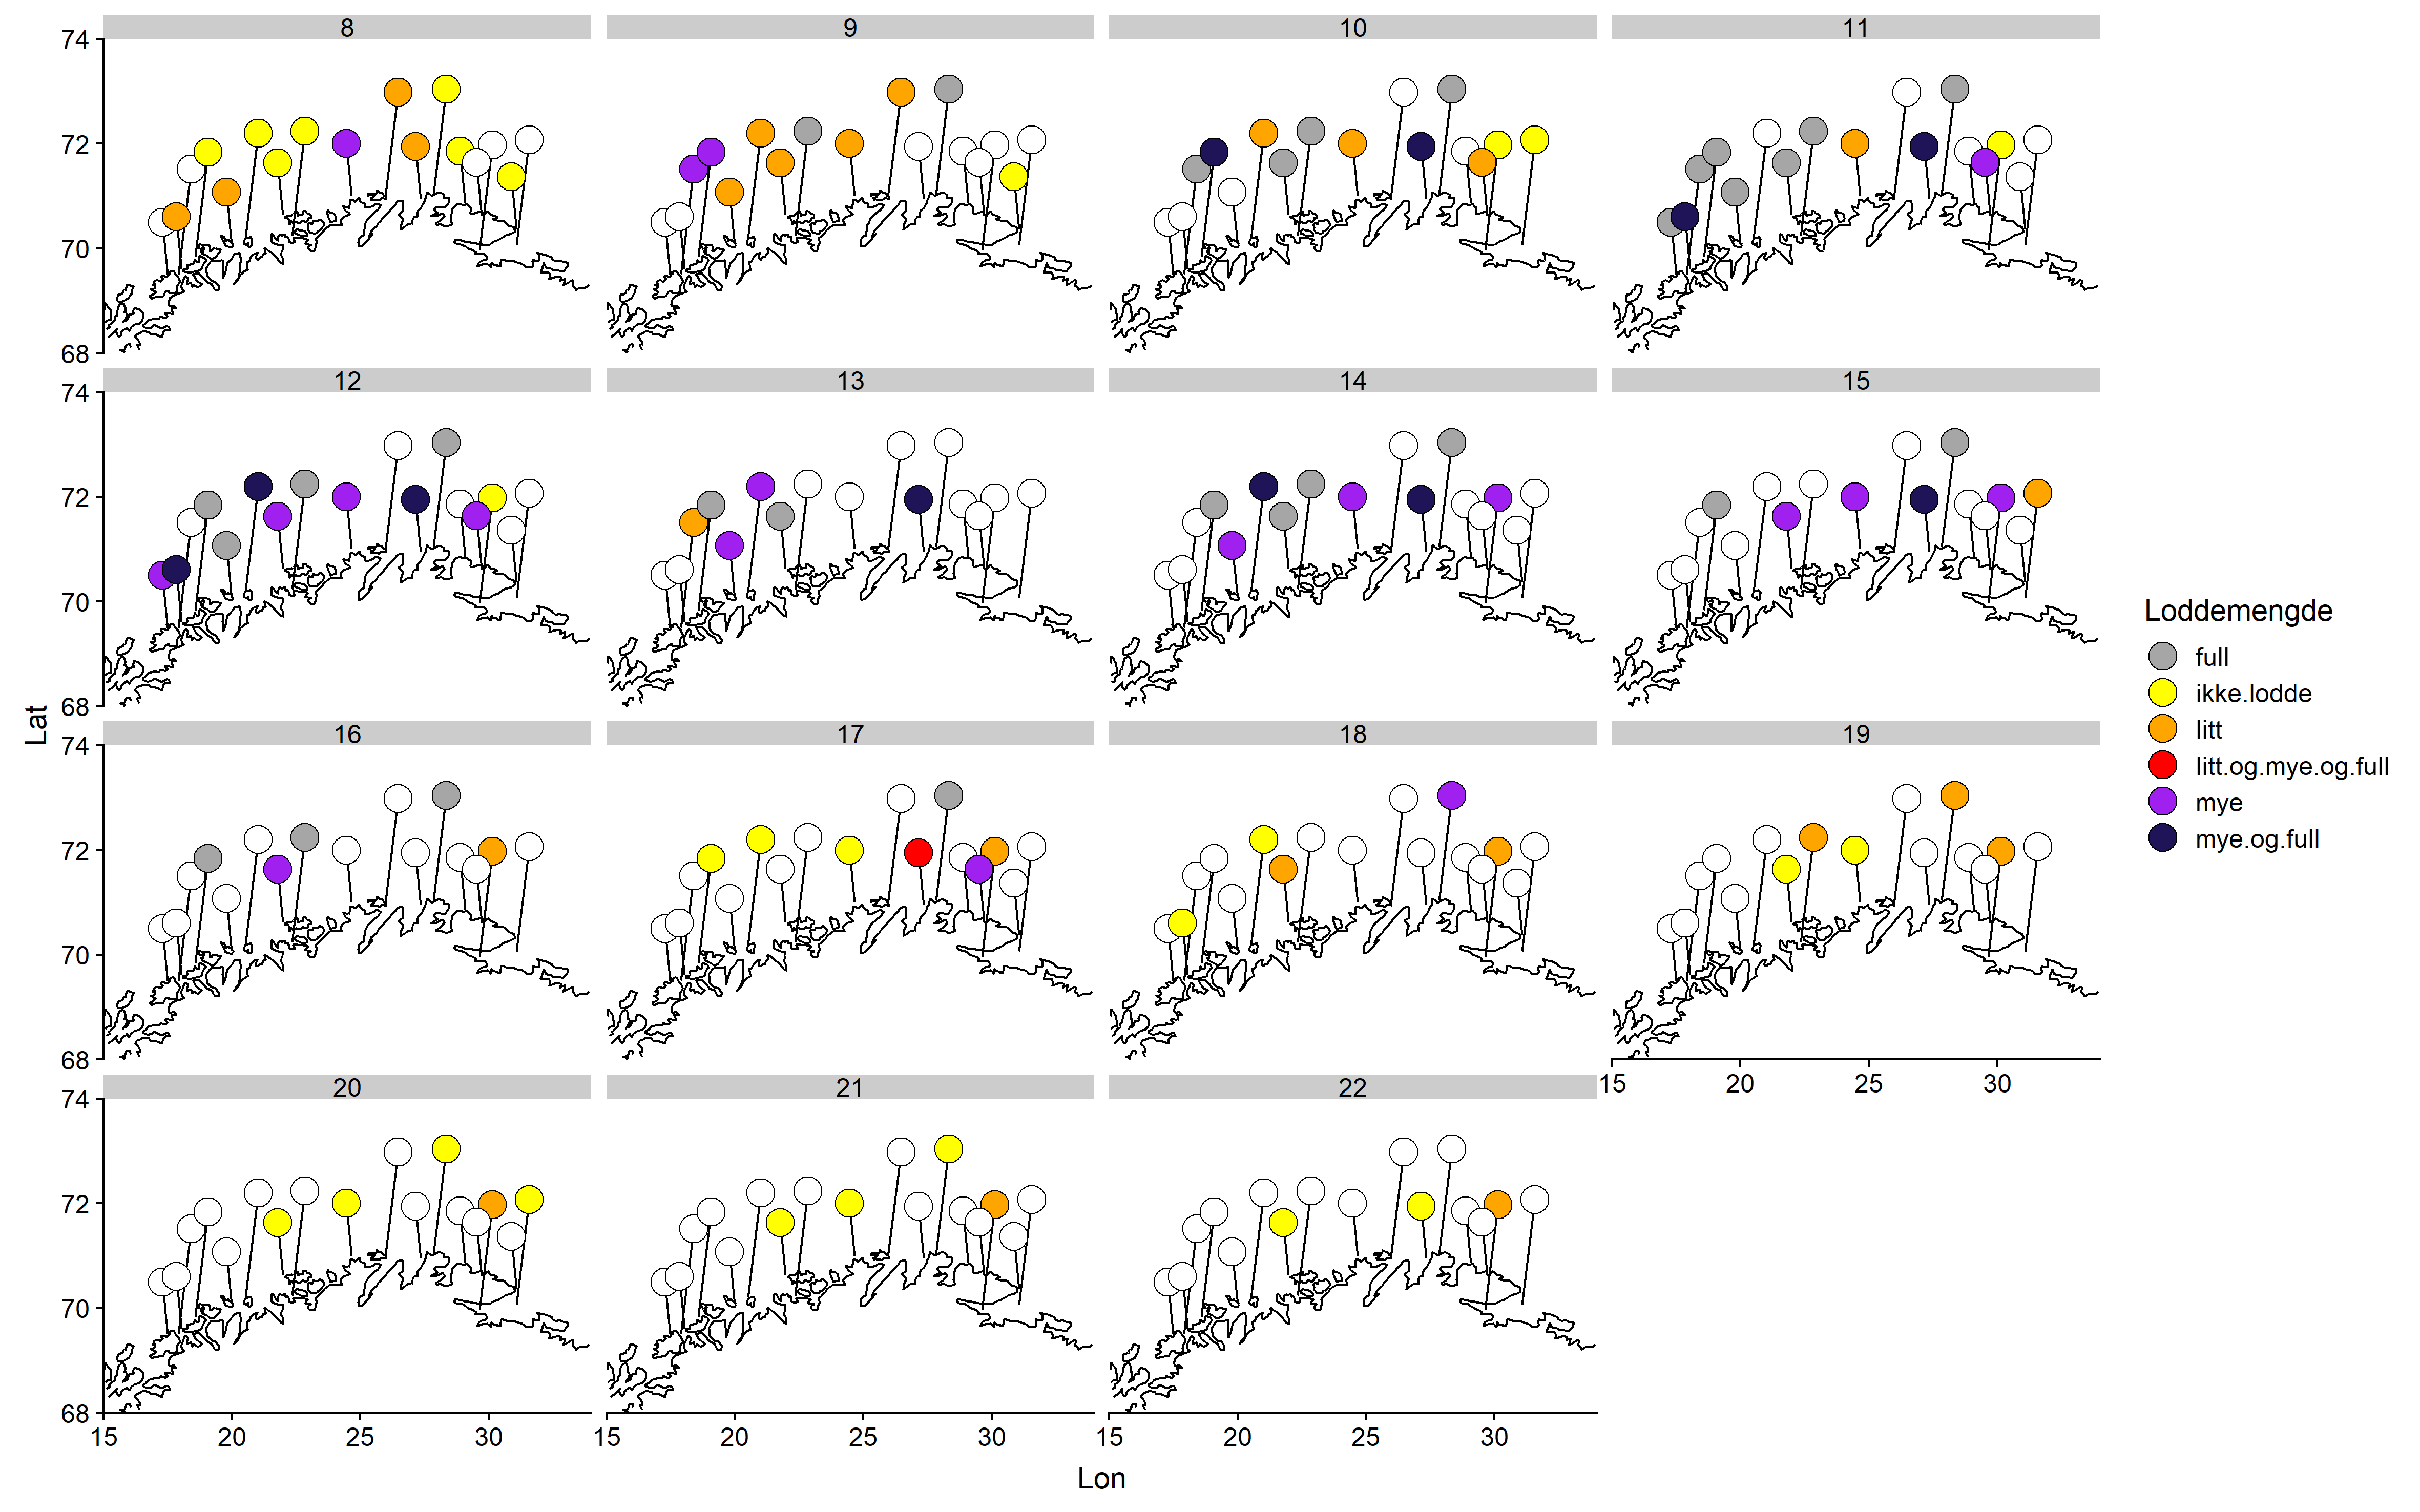
Det ble rapportert om litt lodde i torskemagene fra fire mottak og mye fra ett anlegg allerede første rapporteringsuka (Uke 8, Figur 2). Disse anleggene lå vest eller sentralt, men de fleste mottak rapporterte da ingen lodde i magene. Andre rapporteringsuke rapporterer de fleste som avleverte skjema om litt lodde i magene, mens to rapporterer om mye og to om fulle mager. I uke 11 rapporterer 7 mottak om fulle mager, og fra uke 13 til uke 16 angir samtlige rapporterende mottak lodde i magene, og nesten alle rapporterer om mye og/eller fulle mager. Fra og med uke 17 avtar rapportert lodde i torskemager, og fra uke 19 til 22 rapporteres det om enten litt eller ingen lodde fra samtlige som sendte inn skjema.
Loddefordøyelse
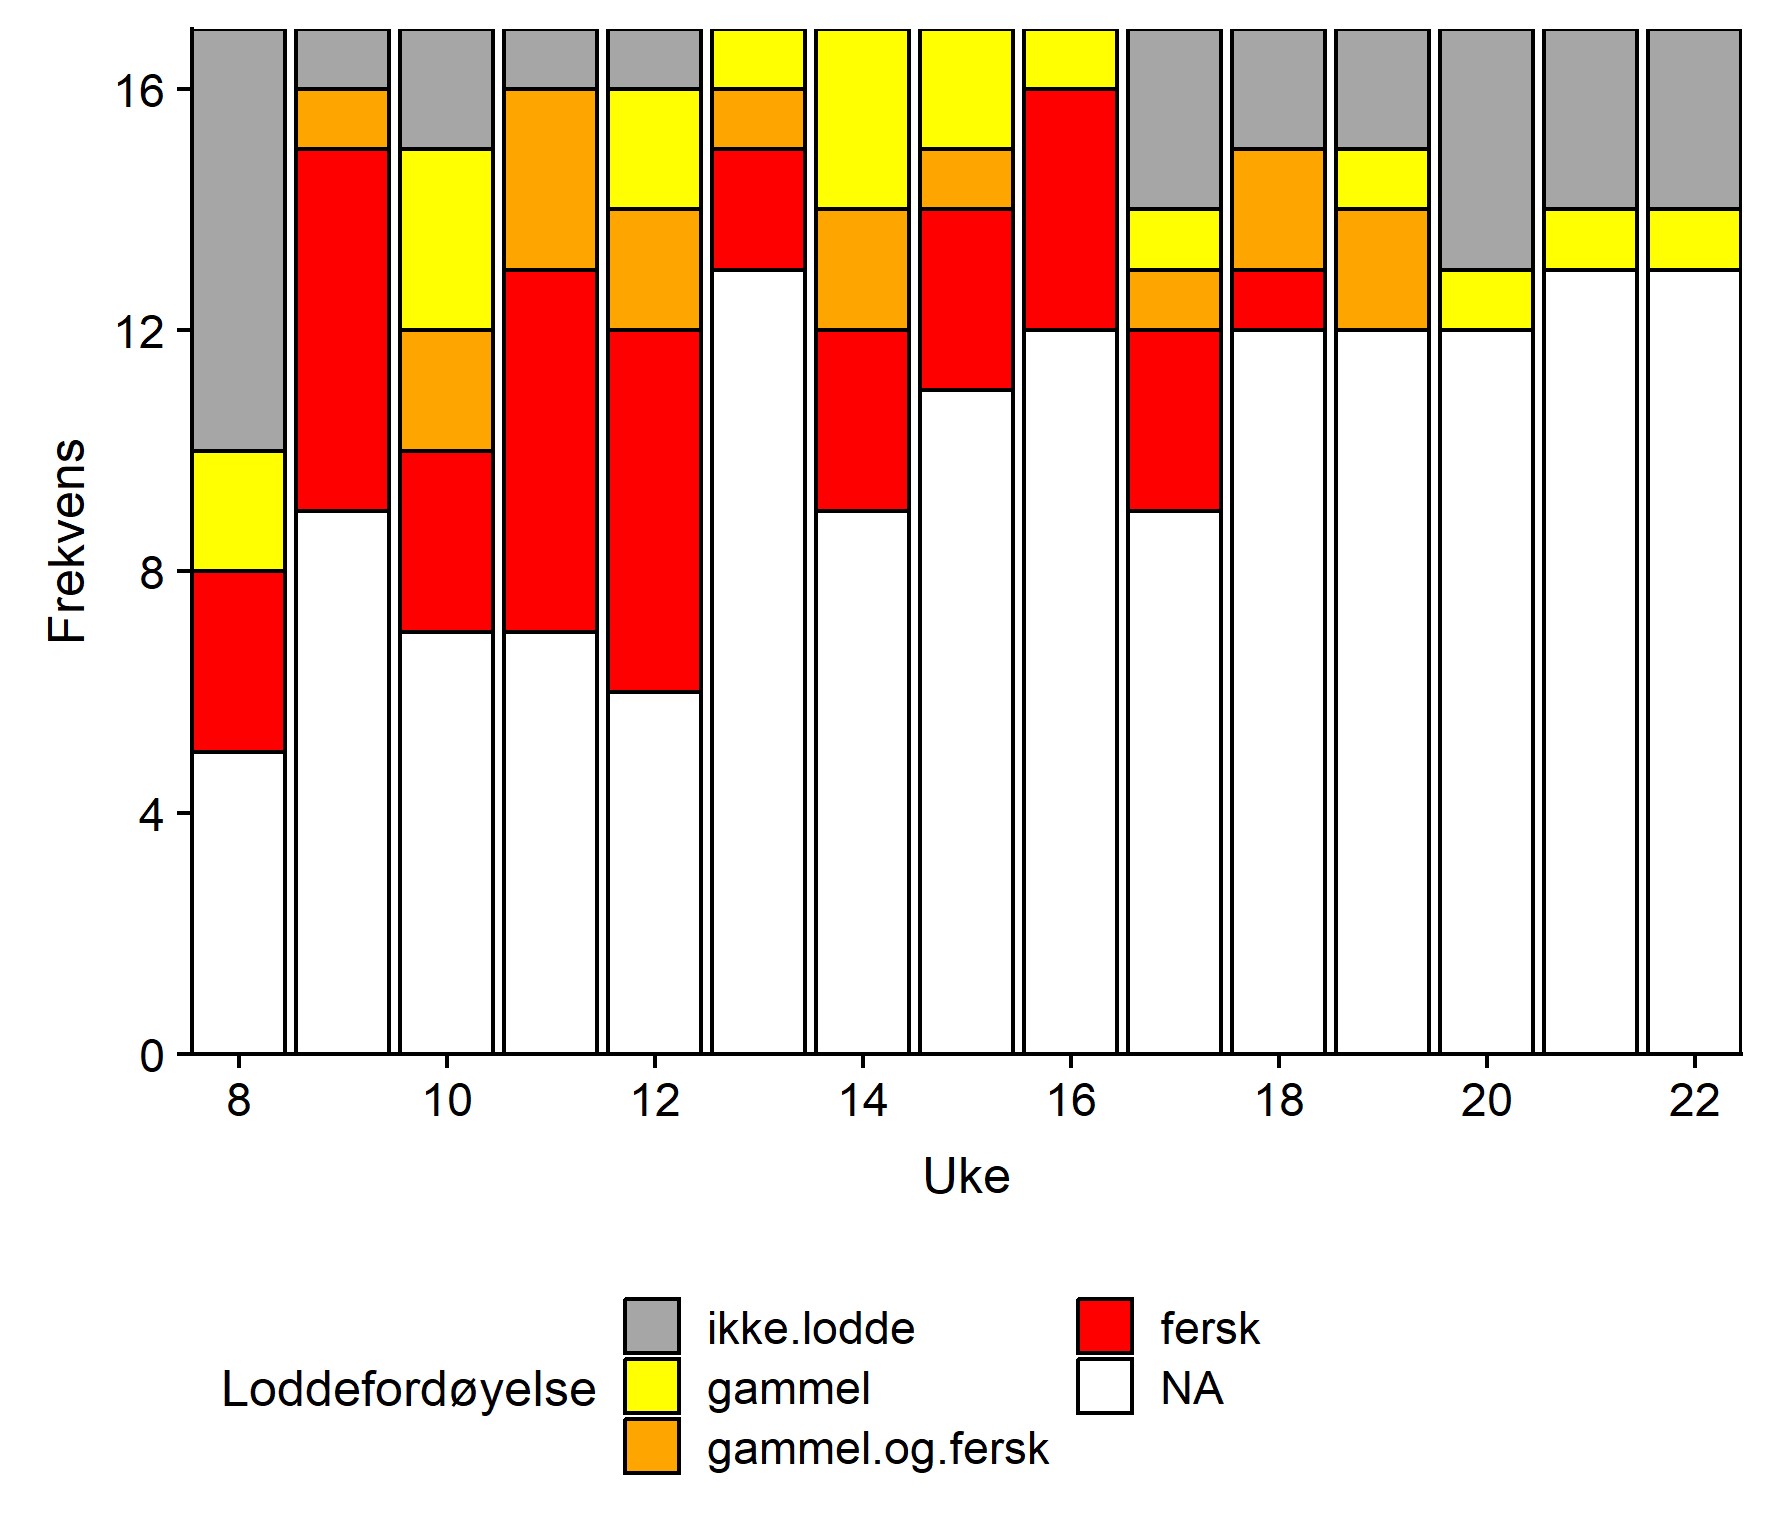
Det ble rapportert om fersk lodde i torskemagene fra tre mottak allerede første rapporteringsuka (Uke 8, Figur 3), men de fleste mottak rapporterte da ingen lodde i magene. Fersk lodde i torskemagene ble rapportert fra anleggene i Vannvåg og på Brensholmen i vest samt fra Havøysund. Andre rapporteringsuke rapporterer de fleste som avleverte skjema om fersk lodde i magene, også mottakene lenger øst, i uke 11 ble fersk lodde for første gang rapportert fra Båtsfjord og i uke 14 for første gang fra Bugøynes. Fra uke 13 til uke 16 angir samtlige rapporterende mottak lodde i magene. Fra og med uke 17 avtar rapportert lodde i torskemager, og fra uke 20 til 22 rapporteres det om ingen lodde fra samtlige, bortsett fra ett mottak som rapporterer om gammel lodde. Fra og med uke 17 er det kun på de østlige mottaka at fersk lodde blir rapportert og fra og med uke 20 kun gammel lodde i magene også her.
Loddestørrelse
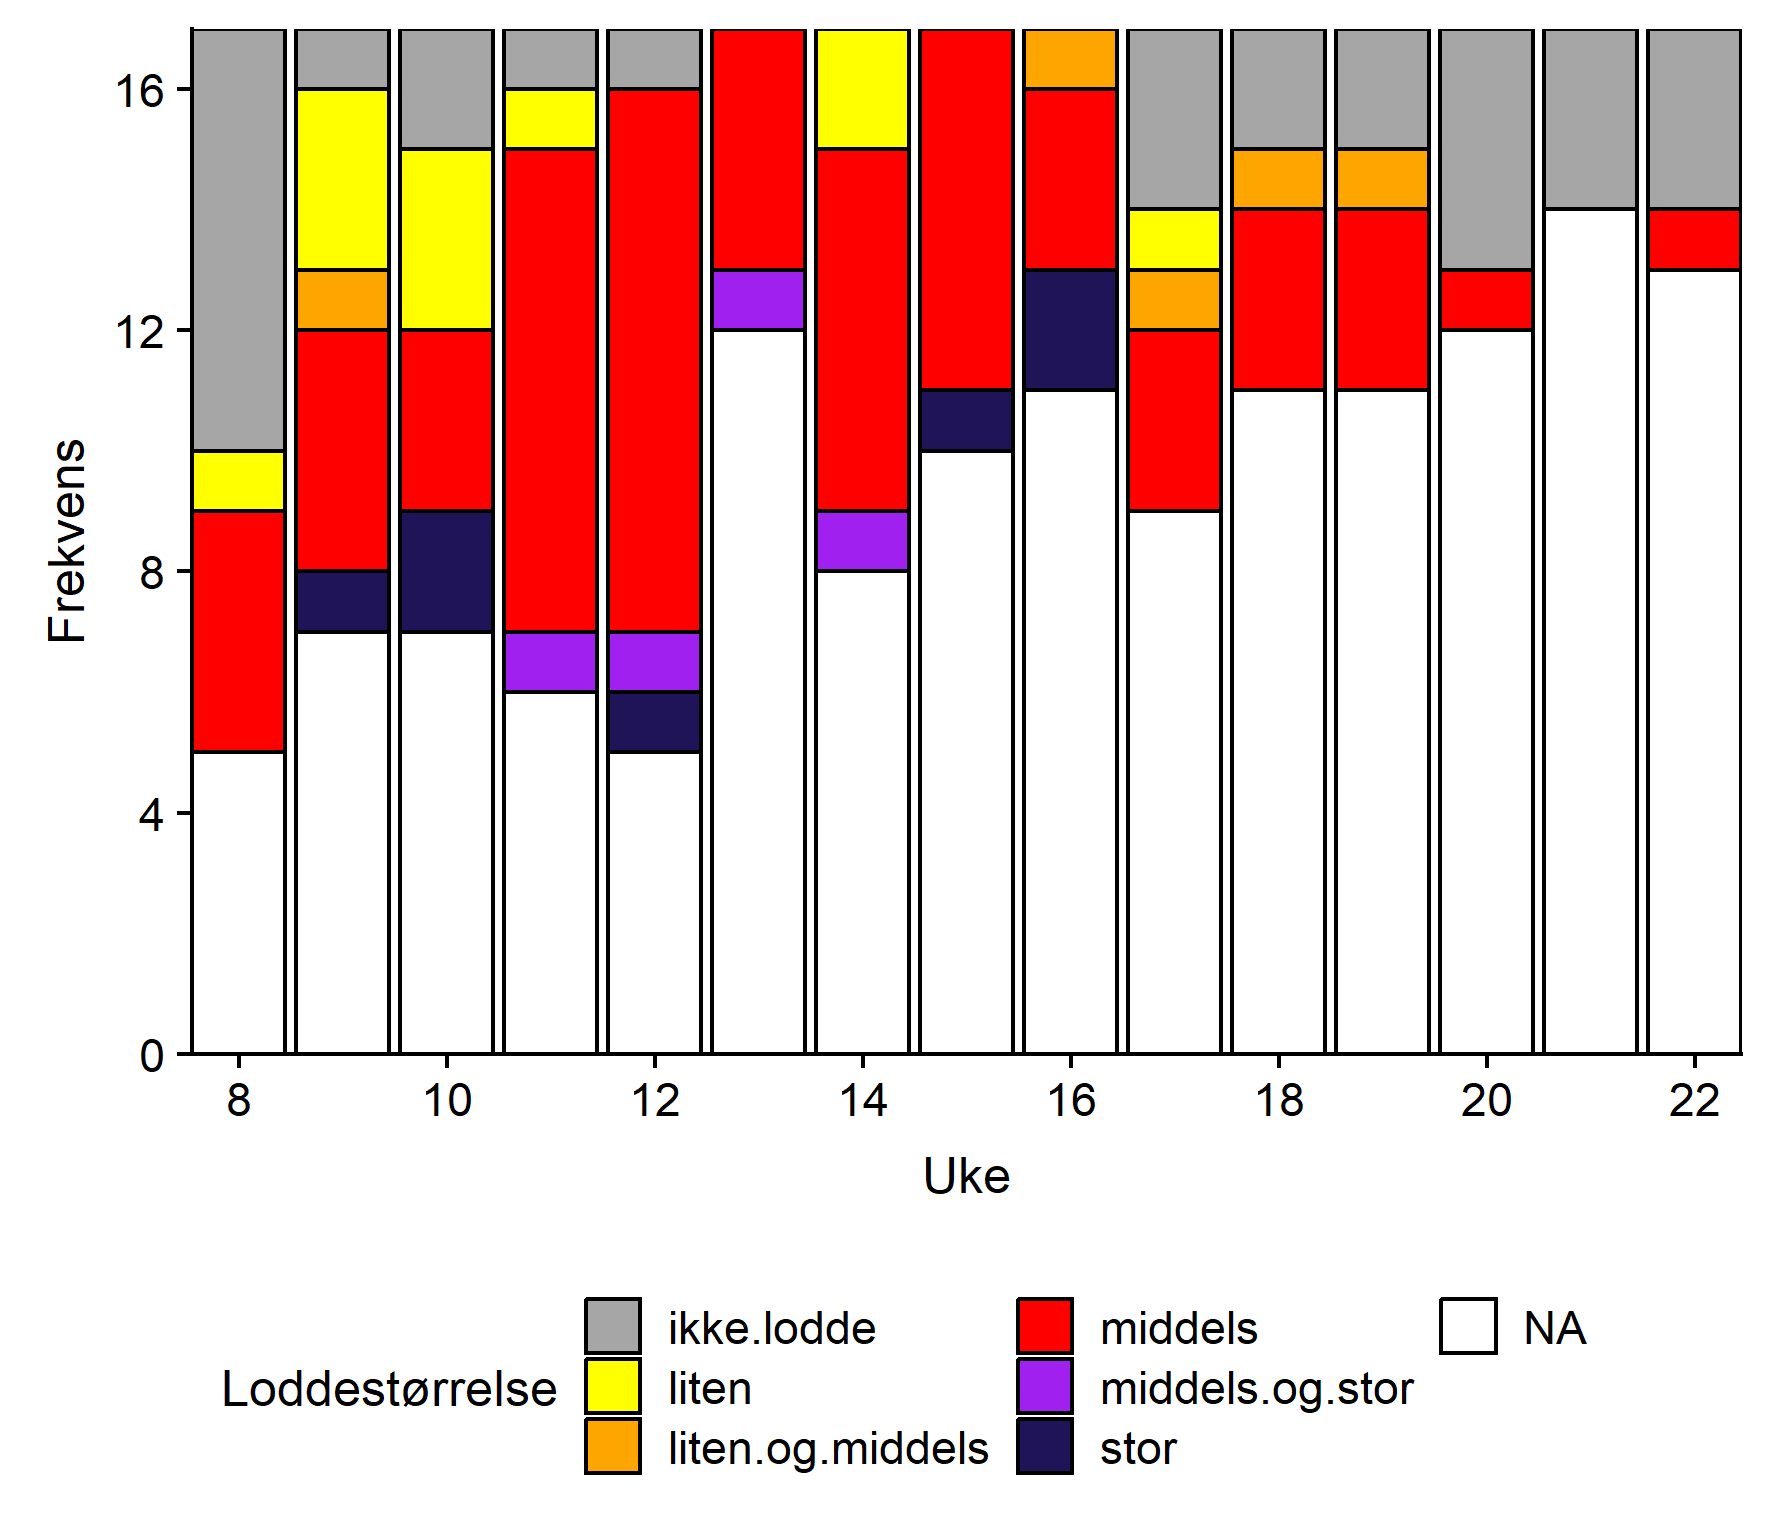
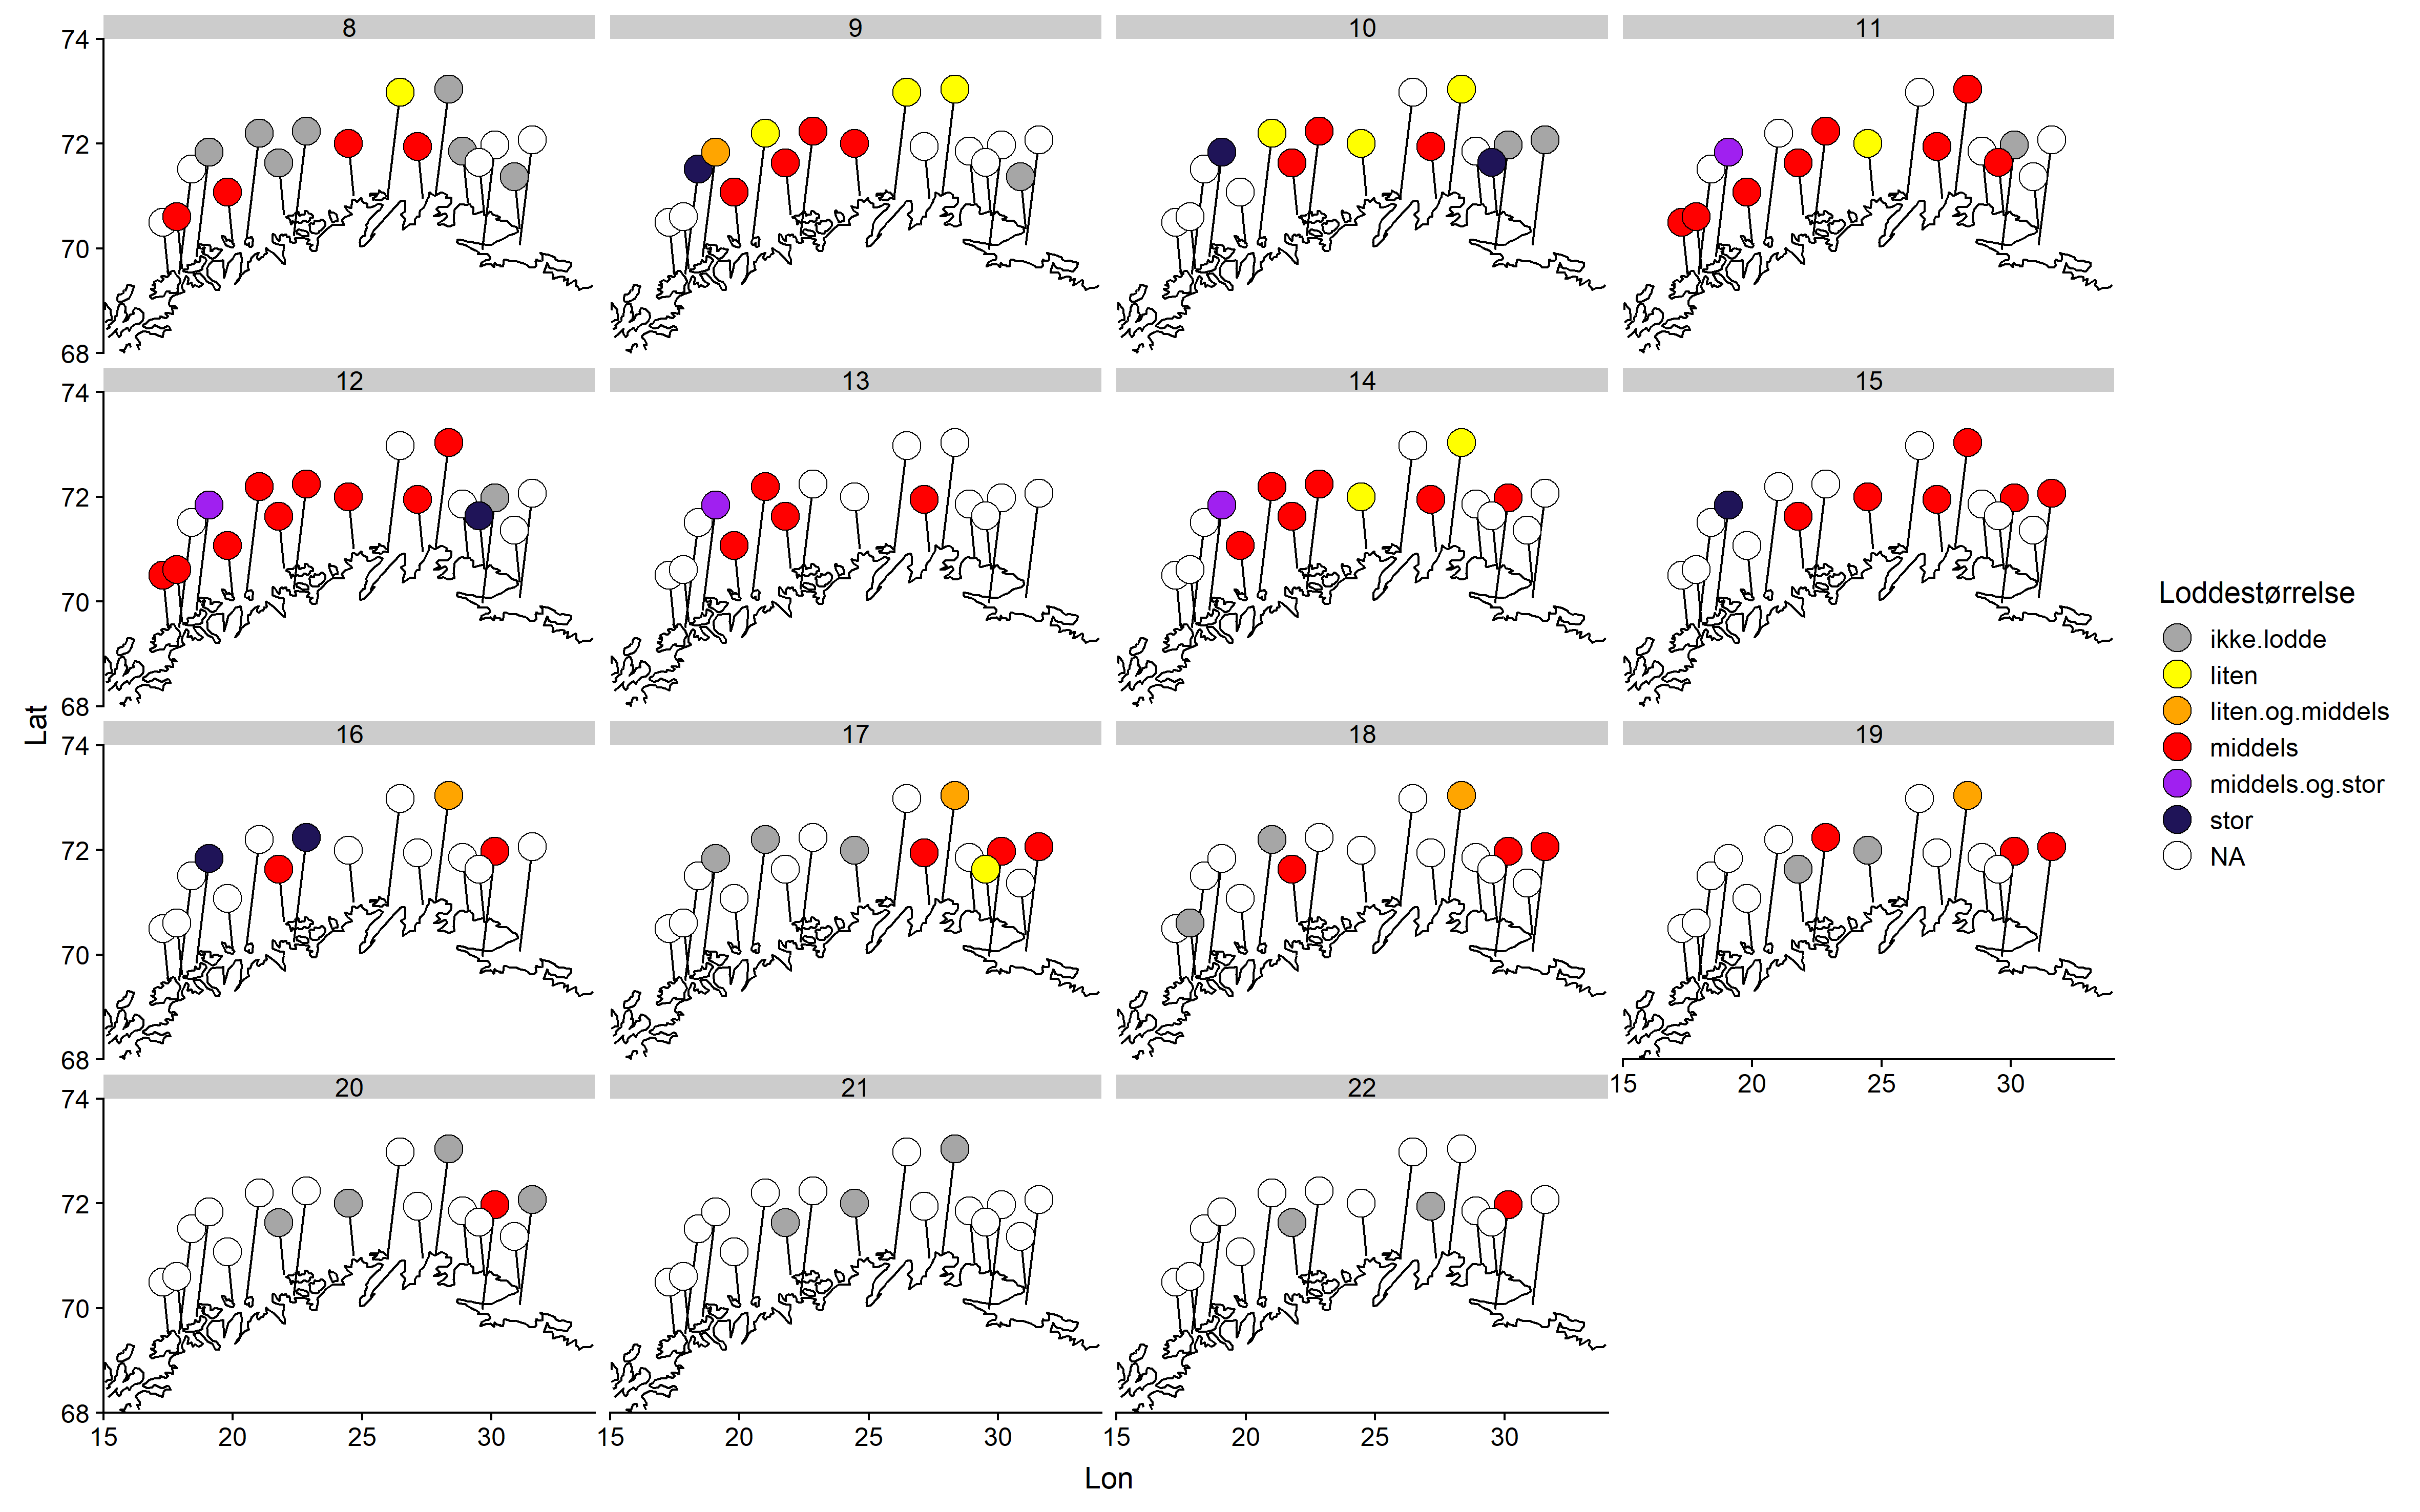
Jevnt over er det middels stor lodde som blir rapportert hyppigst, fulgt av liten (Figur 4). Det synes ikke å være noe geografisk mønster i størrelsesfordelingen.
Konklusjon
Lodderapportene indikerte at loddeinnsiget startet i vest og allerede var i gang da rapporteringen startet i uke 8. Innsiget syntes å forflytte seg østover for så å avta etter uke 17. Fra uke 13 til uke 16 rapporterte samtlige som sendte inn om lodde i torskemager, men deltagelsen var dessverre noe laber i denne perioden. Etter uke 16 avtok loddemengdene, først i vest, senere i øst.
Havforskningsinstituttet takker alle mottak som har vært med på innsamlingen i 2018, dette er svært verdifull informasjon for vårt arbeid. Oppslutningen om rapporteringen var god fram til uke 12, men svakere etter dette. Vi ønsker å bidra til at oppslutningen om rapportering blir enda bedre i 2019 ved å gjøre enkelte endringer på rapporteringsskjema, både for å luke bort kilder til misforståelser, og for at informasjonen skal bli mer entydig for oss fra Havforskningsinstituttet.
Skjema brukt til rapportering i 2018:
INNSIG / LODDERAPPORTERING JANUAR – MAI 2018
Et supplement til forskernes data ved HAVFORSKNINGSINSTITUTTET (Georg Skaret), fra fiskemottakene langs Finnmarkskysten og Nord- Troms og i samarbeid med lokale fiskere. Registreringen er i hovedsak basert på mageinnholdet på torsken.
Fylles ut i gule felt og sendes ukentlig hver TIRSDAG til: lodde@itnord.no/ 40086310
Uke Nr:…….
Sett kryss for Lodde-størrelse:
Liten Middels Stor
| Ingen lodde | |||
| Litt lodde | |||
| Mye lodde | |||
| Full av lodde | |||
| Gammel lodde | |||
| Fersk lodde |
Kommentar :
Kontaktperson /
Avsender: .
| Nr.: | Dato : |
Sted : Fiskemottak: .
Send skjema som vedlegg i epost til: lodde@itnord.no eller så tar dere et bilde med mobiltelefon og sender det til mob: 40086310
| Retur: Havforskningsinstituttet, Postboks 1870 Nordnes, NO-5817 Bergen |
| Institute of Marine Research |
| Nordnesgaten 50 – Postboks 1870 Nordnes NO-5817 Bergen Tlf.: +47 55 23 85 00 E-post: post@hi.no |
