Stock Name: Beaked redfish in ICES subareas 1 and 2 (Northeast Arctic)
Advice on fishing opportunities
The Joint Russian-Norwegian Working Group on Arctic Fisheries (JRN-AFWG) advises that when the MSY approach is applied, catches in 2025 should be no more than 67 191 tonnes, and catches in 2026 should be no more than 69 177 tonnes.
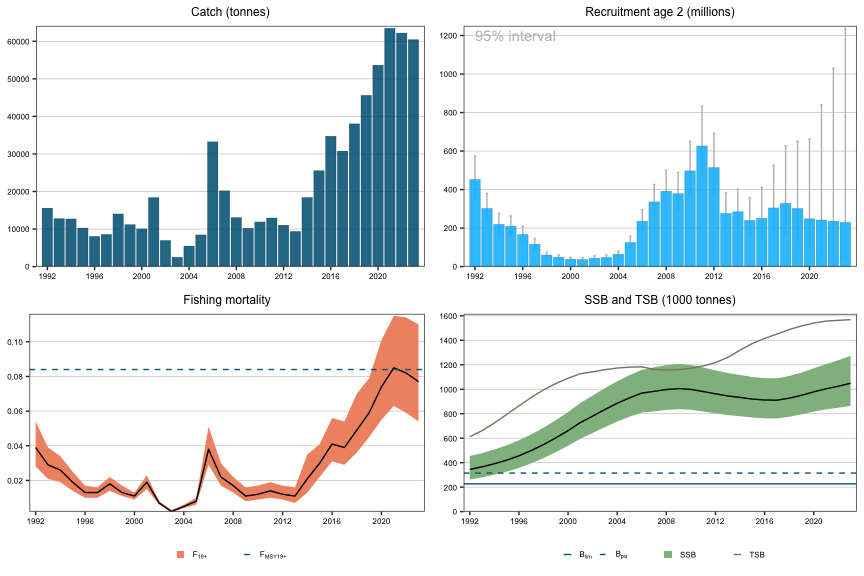
Stock development over time
Fishing pressure on the stock is below FMSY19+ and spawning-stock biomass is above Bpa and Blim.
Catch scenarios
| Variable | Value | Notes |
|---|---|---|
| Fages19+ (2024) | 0.077 | Fsq =F2023. From assessment . |
| SSB (2025) | 1 094 860 | Short-term forecast. |
| R age 2 (2024-2026) | N/A | Recruits in the intermediate year do not enter the fishery or the SSB in the forecast. |
| Total catch (2024) | 64 029 | Short-term forecast. |
| Basis | Total catch (2025) | Fages19+ (2025) | SSB (2026) | % SSB change* | % TAC change** | % Advice change*** |
|---|---|---|---|---|---|---|
| Advice basis | ||||||
| F2025 = F2024 | 67 191 | 0.077 | 1 105 628 | 5.4 | -4.2 | -4.2 |
| Other scenarios | ||||||
| F = 0 | 0 | 0 | 1 168 451 | 11 | -100 | -100 |
*SSB 2026 relative to SSB 2023 (1 048 817 tonnes)
**Catch in 2025 relative to TAC set by Norway and Russia for 2024 (70 164 tonnes)
***Advice value for 2025 relative to the advice value for 2024
| Basis | Total catch (2026) | Fages19+ (2026) | SSB (2027) | % SSB change* | % Advice change** |
|---|---|---|---|---|---|
| Advice basis | |||||
| F2026 = F2025 | 69 177 | 0.077 | 1 117 585 | 6.6 | 3.0 |
| Other scenarios | |||||
| F = 0*** | 0 | 0 | 1 246 693 | 19 | -100 |
*SSB 2027 relative to SSB 2023 (1 048 817 tonnes)
**Advice value for 2026 relative to the advice value for 2025
***F=0 in 2025 and 2026
The advice for 2025 is 0.6% higher than the advice for 2023 due to increasing stock size and status quo advice, but 4.4% lower than the advice for 2024.
Basis of the advice
| Advice basis | Status quo F. |
|---|---|
| Management plan | There is no agreed management plan for this stock. Long-term management plan options have been evaluated by ICES (ICES, 2018a). |
Quality of the assessment
The stock was benchmarked in 2018. The choice of a scaling coefficient for the Norwegian–Russian ecosystem survey is a source of potential bias, but the advice is robust to this uncertainty.
Data from the pelagic survey in the Norwegian Sea (WGIDEEPS) was reviewed in the recent benchmark assessment and the survey is now included in the assessment model as age compositions. However, the survey series still does not appropriately cover the geographical distribution of the adult population.
Age determination is lacking for some surveys and catches in recent years. To account for the lack of catch-at-age data in some years a procedure using length distribution and a time-averaged age-length key was applied.
To smooth out spurious variations in SSB, caused by limited sample size in the weight-at-age of the 19+ group, a fixed weight-at-age function (i.e. common across years) was adopted for the assessment model during the Arctic Fisheries Working Group (AFWG) meeting in 2018 (ICES 2018b). In the 2024 assessment the maturity ogive was changed to fixed across time in a similar manner.
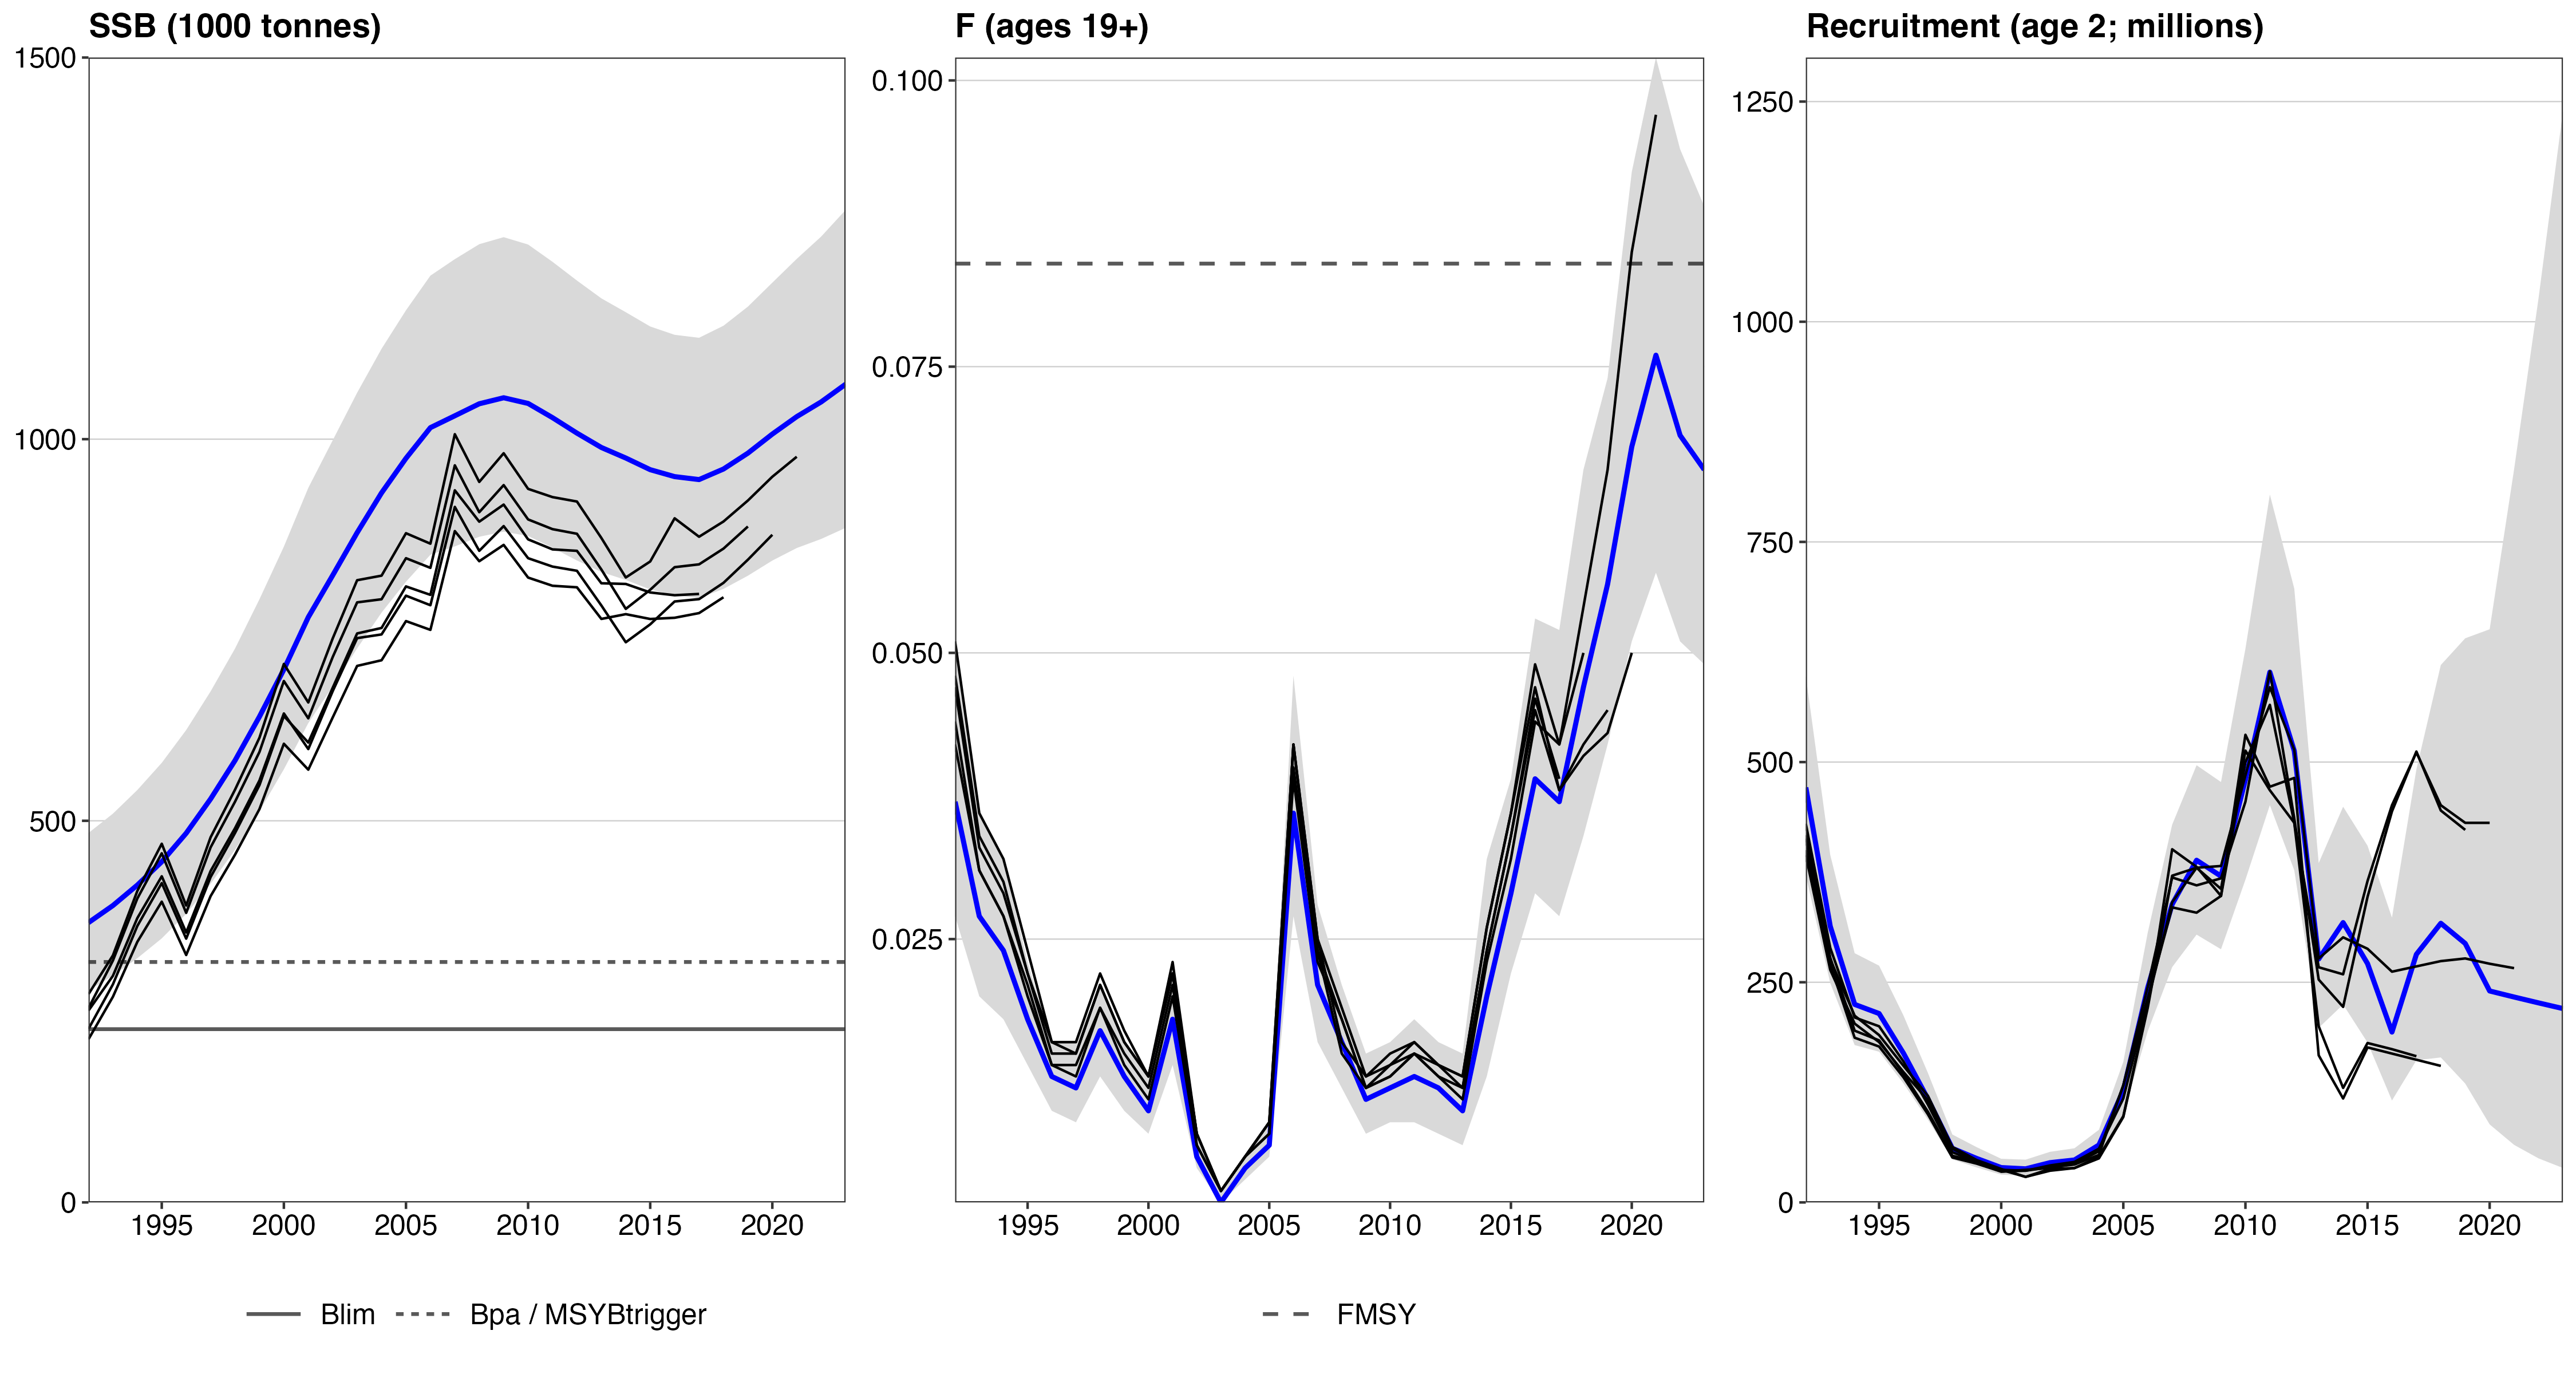
The SSB development over time is smoother than in previous assessments due to the change to a time-invariant maturity ogive. The upward revision of SSB in the 2024 assessment was driven by the addition of data from the 2022 WGIDEEPS survey, which is carried out every three years.
Issues relevant for the advice
Due to the suspension of Russian scientists from ICES, the assessment was conducted by a Joint Russian-Norwegian working group on Arctic Fisheries (JRN-AFWG) consisting of scientists from VNIRO (Russia) and IMR (Norway) (Howell et al., 202 4 ).
This advice has been conducted outside ICES and should not be considered as ICES advice. However, the assessment has been conducted following the previous procedures and based on the methodology agreed at the ICES benchmark in 2018 (ICES, 2018c).
There has been a significant change in the selectivity in the fisheries, with the fraction of the catch in the 19+ age class increasing in recent years (since 2017). Any evaluation of a FMSY or Fpa value is conditional on the Fbar and selectivities used in the evaluation. As a result of the changing selectivity, applying the same target Fbar will result in a reduction of the catch as a fraction of the fishable stock. Given that the catch is close to advice, and the SSB is relatively stable, we therefore propose F19+ status quo as an approximation to maintain the same overall fraction of the stock being caught. We note that this stock is due for a method revision in 2026 prior to the next release of advice, and the advice basis should be revised at that time.
Long-term management plan options have been proposed by Norway and Russia and evaluated by ICES (ICES, 2018a). In the absence of an agreed management plan, the MSY approach is used. The advice has been based on F19+ = 0.077. The highest fishing mortality of those tested during the MSE evaluations (ICES, 2018a) that was found to be precautionary is 0.06. The present advice is above F19+ = 0.06.
Bycatch of the endangered golden redfish ( Sebastes norvegicus ) should be kept at a minimum to allow for rebuilding of that stock.
Reference points
| Framework | Reference point | Value | Technical basis | Source |
|---|---|---|---|---|
| MSY approach | MSY Btrigger | 315 000 t | Bpa | ICES (2018a) |
| FMSY | 0.084 | F0,1 | ICES (2018a) | |
| Precautionary approach | Blim | 227 000 t | B oss (SSB in 1992) | ICES (2018a) |
| Bpa | 315 000 t | Blim * e (1.645 x 0.2) | ICES (2018a) | |
| Flim | - | - | - | |
| Fpa | - | - | - | |
| Management plan | SSBmgt | - | - | - |
| Fmgt | - | - | - |
Basis of the assessment
| ICES stock data category | 1 |
|---|---|
| Assessment type | Statistical catch-at-age model . |
| Input data | Commercial catches: international landings (tonnes), age frequencies and weight-at-age from catch sampling of the pelagic and demersal fisheries and from the survey; survey indices: numbers-at-age from BS-NoRu-Q1-Btr, Eco-NoRu-Q3-Btr, Ru-Q4-Btr; proportion-at-age from deep pelagic ecosystem survey ; maturity data from BS-NoRu-Q1-Btr, Eco-NoRu-Q3-Btr, and commercial catch sampling; natural mortalities were fixed at 0.05. |
| Discards and bycatch | Discarding and bycatch are assumed negligible. |
| Other information | Last benchmark was in January 2018 (WKREDFISH; ICES, 2018c). Proposed management plans were evaluated in 2018 (WKREBMSE; ICES, 2018a). The JRN-AFWG 2024 changed maturity ogive from time-varying to time-invariant. A method revision is planned for 2026. |
| Working group | Joint Russian-Norwegian Arctic Fisheries Working Group (JRN-AFWG) . |
History of the advice, catch, and management
| Year | ICES advice | Predicted catch corresponding to advice | Agreed TAC | ICES catches |
|---|---|---|---|---|
| 1987 | Precautionary TAC | 70 000* | 85 000 | 35 000 |
| 1988 | F = F0.1; TAC | 11 000 | - | 41 000 |
| 1989 | Status quo F; TAC | 12 000 | - | 47 000 |
| 1990 | Status quo F; TAC | 18 000 | - | 63 000 |
| 1991 | F at Fmed; TAC | 12 000 | - | 68 000 |
| 1992 | If required, precautionary TAC | 22 000 | - | 15 590 |
| 1993 | If required, precautionary TAC | 18 000 | 18 000 | 12 814 |
| 1994 | If required, precautionary TAC | - | - | 12 721 |
| 1995 | Lowest possible F | - | - | 10 284 |
| 1996 | Catch at lowest possible level | - | - | 8 075 |
| 1997 | Catch at lowest possible level | - | - | 8 598 |
| 1998 | No directed fishery, reduce bycatch | - | - | 14 04 4 |
| 1999 | No directed fishery, reduce bycatch | - | - | 11 209 |
| 2000 | No directed fishery, bycatch at lowest possible level | - | - | 10 075 |
| 2001 | No directed fishery, bycatch at lowest possible level | - | - | 18 418 |
| 2002 | No directed fishery, bycatch at lowest possible level | - | - | 6 99 4 |
| 2003 | No directed fishery, bycatch at lowest possible level | - | - | 2 520 |
| 2004 | No directed trawl fishery and low bycatch limits | - | - | 5 493** |
| 2005 | No directed trawl fishery and low bycatch limits | - | - | 8 46 6 ** |
| 2006 | No directed trawl fishery and low bycatch limits | - | - | 33 261** |
| 2007 | No directed trawl fishery and low bycatch limits | - | 15 500^ | 20 21 8 ** |
| 2008 | Protection of juveniles, no directed trawl fishery and low bycatch limits | - | 14 500^ | 13 09 6 ** |
| 2009 | Protection of juveniles, no directed trawl fishery and low bycatch limits | - | 10 500^ | 10 246** |
| 2010 | Protection of juveniles, no directed trawl fishery and low bycatch limits | - | 8 600^ | 11 924** |
| 2011 | Protection of juveniles, no directed trawl fishery and low bycatch limits | - | 7 900^ | 12 962** |
| 2012 | Protection of juveniles, no directed fishery and low bycatch limits | - | 7 500^ | 11 059** |
| 2013 | F0.1 | < 47 000 | 19 500^ | 9 389 ** |
| 2014 | Status quo catch | < 24 000 | 36 800^^ | 18 427 ** |
| 2015 | Precautionary approach | < 30 000 | 30 000# | 25 570 |
| 2016 | Precautionary approach | < 30 000 | 30 000# | 34 754 |
| 2017 | Precautionary approach | < 30 000 | 30 000# | 30 782 |
| 2018 | Precautionary approach | < 32 658 | 32 658# | 38 046 |
| 2019 | Precautionary approach | < 53 757 | 53 757# | 45 640 |
| 2020 | Precautionary approach | < 55 860 | 55 860# | 53 657 |
| 2021 | Precautionary approach | < 66 158 | 66 158# | 63 479^^^ |
| 2022 | Precautionary approach | < 67 210 | 67 210# | 62 194^^^ |
| 2023 | Status quo F | < 66 779^^^ | 66 779 # | 60 466^^^ |
| 2024 | Status quo F | < 70 164^^^ | 70 164 # | |
| 2025 | S tatus quo F | < 67 191^^^ | ||
| 2026 | Status quo F | < 69 177^^^ |
* Includes both Sebastes mentella and S. norvegicus .
** Includes the pelagic catches in the Norwegian Sea outside the EEZ.
^ TAC set by the North-East Atlantic Fisheries Commission (NEAFC) for an Olympic fishery in international waters.
^^ Sum of TAC set by NEAFC in international waters and by Norway in the Norwegian Economic Zone.
^^^ In 2022 and 2024 the assessments and advice were carried out by the Joint Russian-Norwegian working group on Arctic Fisheries (JRN-AFWG) which compiled catches for 2021-2023, and gave advice for 2023-2026.
# TAC set jointly by Norway and Russia .
History of catch and landings
| Year | Inside the NEAFC RA (tonnes) | Outside the NEAFC RA (tonnes) | Total catches (tonnes) | Proportion inside the NEAFC RA (%) |
|---|---|---|---|---|
| 2019 | 6 060 | 39 580 | 45 640 | 13.3% |
| 2020 | 5 469 | 48 188 | 53 657 | 10.2% |
| 2021 | 2 872 | 60 607 | 63 479 | 4.5% |
| 2022 | 2 680 | 59 514 | 62 194 | 4.3% |
| 2023 | 5 | 60 461 | 60 466 | 0.01% |
| Year | Faroe Islands | France | Germany | Greenland | Latvia | Lithuania | Norway | Portugal | Russia | Spain | UK** | Others | Total |
|---|---|---|---|---|---|---|---|---|---|---|---|---|---|
| 1992 | 23 | 12 | 0 | 0 | 0 | 0 | 10 751 | 972 | 3 577 | 14 | 241 | 0 | 15 590 |
| 1993 | 13 | 50 | 35 | 1 | 0 | 0 | 5 182 | 963 | 6 260 | 5 | 293 | 12 | 12 814 |
| 1994 | 4 | 74 | 18 | 1 | 0 | 0 | 6 511 | 895 | 5 021 | 30 | 136 | 31 | 12 721 |
| 1995 | 3 | 16 | 176 | 2 | 0 | 0 | 2 646 | 927 | 6 346 | 67 | 97 | 4 | 10 284 |
| 1996 | 4 | 75 | 119 | 3 | 0 | 0 | 6 053 | 467 | 925 | 328 | 99 | 2 | 8 075 |
| 1997 | 4 | 37 | 81 | 16 | 0 | 0 | 4 657 | 474 | 2 972 | 272 | 78 | 7 | 8 598 |
| 1998 | 20 | 73 | 100 | 14 | 0 | 0 | 9 733 | 125 | 3 646 | 177 | 134 | 22 | 14 044 |
| 1999 | 73 | 26 | 202 | 50 | 0 | 0 | 7 884 | 65 | 2 731 | 29 | 140 | 9 | 11 209 |
| 2000 | 50 | 12 | 62 | 29 | 0 | 0 | 6 020 | 115 | 3 519 | 87 | 130 | 51 | 10 075 |
| 2001 | 74 | 16 | 198 | 17 | 0 | 0 | 13 937 | 179 | 3 775 | 90 | 120 | 12 | 18 418 |
| 2002 | 75 | 58 | 99 | 18 | 0 | 0 | 2 152 | 242 | 3 904 | 190 | 188 | 68 | 6 994 |
| 2003 | 64 | 22 | 32 | 8 | 0 | 0 | 1 210 | 44 | 952 | 47 | 124 | 17 | 2 520 |
| 2004 | 588 | 13 | 10 | 4 | 0 | 0 | 1 375 | 235 | 2 879 | 257 | 76 | 56 | 5 493 |
| 2005 | 1 147 | 46 | 33 | 39 | 0 | 0 | 1 760 | 140 | 5 023 | 163 | 95 | 20 | 8 466 |
| 2006 | 3 808 | 215 | 2 483 | 63 | 341 | 845 | 4 710 | 1 804 | 11 413 | 710 | 1 027 | 5 842 | 33 261 |
| 2007 | 2 197 | 234 | 520 | 29 | 349 | 785 | 3 209 | 1 483 | 5 660 | 2 181 | 202 | 3 369 | 20 218 |
| 2008 | 1 849 | 187 | 16 | 25 | 267 | 117 | 2 220 | 713 | 7 117 | 463 | 83 | 39 | 13 096 |
| 2009 | 1 343 | 15 | 42 | 0 | 0 | 0 | 2 677 | 806 | 3 843 | 177 | 80 | 1 263 | 10 246 |
| 2010 | 979 | 175 | 21 | 12 | 243 | 457 | 2 065 | 293 | 6 414 | 1 184 | 79 | 2 | 11 924 |
| 2011 | 984 | 175 | 835 | 0 | 536 | 565 | 2 471 | 613 | 5 037 | 1 678 | 55 | 13 | 12 962 |
| 2012 | 259 | 0 | 517 | 0 | 447 | 449 | 2 114 | 1 038 | 4 101 | 1 780 | 0 | 354 | 11 059 |
| 2013 | 697 | 0 | 80 | 21 | 280 | 262 | 1 750 | 1 078 | 3 677 | 1 459 | 0 | 85 | 9 389 |
| 2014 | 743 | 215 | 446 | 15 | 215 | 167 | 13 149 | 505 | 1 704 | 1 162 | 0 | 106 | 18 427 |
| 2015 | 657 | 49 | 242 | 48 | 537 | 192 | 19 433 | 678 | 1 142 | 2 529 | 52 | 11 | 25 570 |
| 2016 | 502 | 134 | 493 | 74 | 1 243 | 1 065 | 18 191 | 1 066 | 8 419 | 3 213 | 122 | 232 | 34 754 |
| 2017 | 443 | 45 | 763 | 66 | 562 | 790 | 17 077 | 1 060 | 6 593 | 2 838 | 436 | 109 | 30 782 |
| 2018 | 425 | 67 | 2 473 | 82 | 1 020 | 1 010 | 18 594 | 699 | 10 497 | 2 457 | 63 | 659 | 38 046 |
| 2019 | 156 | 370 | 1 599 | 615 | 0 | 653 | 23 844 | 1 422 | 13 444 | 2 222 | 590 | 725 | 45 640 |
| 2020 | 149 | 163 | 1 807 | 67 | 0 | 1 081 | 32 950 | 889 | 13 874 | 744 | 437 | 1 496 | 53 657 |
| 2021 | 290 | 218 | 1 166 | 85 | 0 | 1 379 | 43 794 | 381 | 14 887 | 615 | 655 | 9 | 63 479 |
| 2022* | 235 | 221 | 1 758 | 39 | 0 | 990 | 40 715 | 464 | 16 717 | 278 | 114 | 663 | 62 194 |
| 2023* | 185 | 133 | 626 | 109 | 0 | 1 | 44 496 | 369 | 13 976 | 295 | 231 | 45 | 60 466 |
* Provisional figures.
** Includes UK (E&W) since 2000
Summary of the assessment
| Year | Recruitment | Spawning stock biomass | Total | Fishable | Catches | Fishing mortality | ||||||
|---|---|---|---|---|---|---|---|---|---|---|---|---|
| Recruitment age 2 | High 95% | L ow 95% | SSB | High 95% | Low 95% | Biomass ages 2+ | Biomass ages 6+ | F ages 19+ | High 95% | Low 95% | ||
| thousands | tonnes | |||||||||||
| 1992 | 452952 | 573974 | 357448 | 345186 | 454535 | 262143 | 611717 | 569423 | 15590 | 0.039 | 0.054 | 0.028 |
| 1993 | 302438 | 380255 | 240546 | 366134 | 478330 | 280254 | 661913 | 608242 | 12814 | 0.029 | 0.039 | 0.021 |
| 1994 | 219712 | 276166 | 174798 | 391405 | 507665 | 301770 | 724329 | 671143 | 12721 | 0.026 | 0.034 | 0.019 |
| 1995 | 210082 | 263083 | 167760 | 420420 | 541526 | 326398 | 793907 | 745630 | 10284 | 0.019 | 0.025 | 0.014 |
| 1996 | 167147 | 209252 | 133514 | 456061 | 582601 | 357005 | 863999 | 830471 | 8075 | 0.013 | 0.017 | 0.010 |
| 1997 | 116283 | 145397 | 92999 | 499137 | 631316 | 394632 | 932291 | 906693 | 8598 | 0.013 | 0.016 | 0.010 |
| 1998 | 60351 | 75804 | 48049 | 547527 | 685386 | 437397 | 995129 | 972177 | 14045 | 0.018 | 0.022 | 0.014 |
| 1999 | 48801 | 61307 | 38846 | 602508 | 747417 | 485694 | 1046555 | 1029056 | 11209 | 0.013 | 0.017 | 0.011 |
| 2000 | 38510 | 48228 | 30751 | 661882 | 813902 | 538256 | 1090085 | 1078258 | 10075 | 0.011 | 0.013 | 0.009 |
| 2001 | 36793 | 46776 | 28940 | 727746 | 888212 | 596270 | 1126266 | 1119514 | 18418 | 0.019 | 0.023 | 0.015 |
| 2002 | 44125 | 56048 | 34738 | 780517 | 948395 | 642355 | 1142259 | 1136681 | 6993 | 0.007 | 0.008 | 0.006 |
| 2003 | 47619 | 60647 | 37389 | 834606 | 1008909 | 690416 | 1159605 | 1154819 | 2520 | 0.002 | 0.003 | 0.002 |
| 2004 | 64325 | 81305 | 50891 | 885348 | 1065126 | 735913 | 1173472 | 1168542 | 5493 | 0.005 | 0.006 | 0.004 |
| 2005 | 125351 | 157508 | 99760 | 929475 | 1114407 | 775232 | 1180159 | 1174025 | 8465 | 0.008 | 0.010 | 0.006 |
| 2006 | 236264 | 296565 | 188225 | 968449 | 1158617 | 809494 | 1182895 | 1174795 | 33261 | 0.038 | 0.051 | 0.029 |
| 2007 | 336307 | 426212 | 265366 | 982667 | 1178842 | 819139 | 1162513 | 1150498 | 20219 | 0.022 | 0.030 | 0.017 |
| 2008 | 391976 | 501109 | 306611 | 997597 | 1197665 | 830950 | 1156442 | 1135734 | 13096 | 0.017 | 0.022 | 0.013 |
| 2009 | 379212 | 489200 | 293953 | 1005386 | 1206884 | 837530 | 1159965 | 1127354 | 10246 | 0.011 | 0.016 | 0.008 |
| 2010 | 497618 | 651235 | 380238 | 998700 | 1198215 | 832406 | 1171314 | 1128711 | 11924 | 0.012 | 0.017 | 0.009 |
| 2011 | 626739 | 833536 | 471248 | 981447 | 1177212 | 818237 | 1190010 | 1140923 | 12962 | 0.014 | 0.019 | 0.010 |
| 2012 | 514641 | 693022 | 382174 | 962631 | 1154401 | 802718 | 1217414 | 1165806 | 11059 | 0.012 | 0.017 | 0.009 |
| 2013 | 276468 | 382870 | 199636 | 945419 | 1132922 | 788948 | 1260022 | 1198241 | 9389 | 0.011 | 0.016 | 0.007 |
| 2014 | 285439 | 402696 | 202325 | 933193 | 1116637 | 779886 | 1319256 | 1251947 | 18426 | 0.021 | 0.035 | 0.013 |
| 2015 | 240181 | 358801 | 160776 | 919537 | 1099781 | 768833 | 1373404 | 1320734 | 25570 | 0.030 | 0.041 | 0.022 |
| 2016 | 251114 | 412847 | 152740 | 912156 | 1090798 | 762771 | 1415521 | 1383052 | 34754 | 0.041 | 0.056 | 0.031 |
| 2017 | 305167 | 527032 | 176701 | 910447 | 1089312 | 760952 | 1450210 | 1417486 | 30783 | 0.039 | 0.054 | 0.029 |
| 2018 | 329305 | 626301 | 173147 | 926703 | 1107845 | 775179 | 1487605 | 1457585 | 38046 | 0.049 | 0.070 | 0.036 |
| 2019 | 302303 | 650475 | 140493 | 950401 | 1136225 | 794968 | 1517065 | 1484750 | 45640 | 0.059 | 0.079 | 0.045 |
| 2020 | 248567 | 662240 | 93298 | 978366 | 1171157 | 817312 | 1540450 | 1503687 | 53656 | 0.074 | 0.101 | 0.055 |
| 2021 | 242187 | 840141 | 69815 | 1003603 | 1205298 | 835660 | 1556718 | 1519207 | 63479 | 0.085 | 0.115 | 0.063 |
| 2022 | 235979 | 1030110 | 54058 | 1024549 | 1236651 | 848825 | 1562770 | 1529199 | 62196 | 0.082 | 0.114 | 0.059 |
| 2023 | 229938* | 1237841 | 42713 | 1048817 | 1272835 | 864224 | 1568484 | 1524679 | 60466 | 0.077 | 0.110 | 0.054 |
*Predicted value based on regression between survey indices and recruitment time series .
References
Howell et al. 2024. Report of the Joint Russian-Norwegian Working Group on Arctic Fisheries (JRN-AFWG). IMR PINRO 2024-7. https://www.hi.no/hi/nettrapporter/imr-pinro-en-2024-7
ICES. 2016. Advice basis. In Report of the ICES Advisory Committee, 2016. ICES Advice 2016, Book 1, Section 1.2.
ICES. 2018a. Workshop on the evaluation of harvest control rules for Sebastes mentella in ICES areas 1 and 2 (WKREBMSE). June –August 2018, by correspondence. ICES CM 2018/ACOM:52.
ICES. 2018b. Report of the Arctic Fisheries Working Group (AFWG), 18–24 April 2018, JRC, Ispra, Italy. ICES CM 2018/ACOM:06, 857 pp.
ICES. 2018c. Report of the Benchmark Workshop on Redfish Stocks (WKREDFISH). 29 January –2 February 2018, Copenhagen, Denmark. ICES CM 2018/ACOM:34, 174 pp.