During the period 13-26th of February 2023 the spawning grounds of Norwegian spring-spawning herring from Møre (62º15ˊN) to Troms (70º37'N) were covered acoustically by the commercial vessels MS Eros and MS Vendla. The estimated biomass was about 18 % higher, and the estimated total number was about 7 % higher this year compared to the last year’s survey. The uncertainty of the estimates in 2023 was much higher than what was observed the last six years, although the survey was conducted according to the plan. The spawning stock was dominated by the 2016 year class; 46 % in numbers and 42 % in biomass. Most of the spawning stock was found west of Lofoten this year, more concentrated than earlier years. Compared with last year’s survey the herring was earlier in the spawning process this year which indicates later spawning. The estimates of relative abundance from the survey in 2023 are recommended to be used in this year’s ICES stock assessment of Norwegian spring-spawning herring.
Distribution and abundance of Norwegian spring-spawning herring during the spawning season in 2023
Rapportserie:
Rapport fra havforskningen 2023-21
ISSN: 1893-4536
Publisert: 29.03.2023
Prosjektnr: 15706
Forskningsgruppe(r):
Pelagisk fisk
Tema:
Norsk vårgytende sild
Program:
Norskehavet
Research group leader(s):
Espen Johnsen (Pelagisk fisk)
Approved by:
Research Director(s):
Geir Huse
Program leader(s):
Bjørn Erik Axelsen
English summary
Sammendrag
I perioden 13. - 26. Februar 2023 ble gytefeltene til norsk vårgytende sild fra Møre (62º15ˊN) til Troms (70º37'N) dekket akustisk med de kommersielle fartøyene MS Eros og MS Vendla. Den estimerte biomassen var omtrent 18 % høyere, og det estimerte antallet omtrent 7 % høyere sammenlignet med fjorårets tokt. Usikkerheten i årets estimater er imidlertid vesentlig høyere enn i de seks foregående årene, til tross for at gjennomføringen av toktet gikk i henhold til planen. Gytebestanden var dominert av 2016-årsklassen med 46 % i antall og 42 % i vekt. Mesteparten av gytebestanden befant seg vest av Lofoten i år, mer konsentrert enn tidligere år. Sammenlignet med toktet i fjor var silda kommet kortere i modningsprosessen i år noe som indikerer senere gyting. Det anbefales å bruke estimatene av relativ mengde fra toktet i 2023 i ICES sin bestandsvurdering av norsk vårgytende sild.
1 - Introduction
Acoustic surveys on Norwegian spring-spawning herring during the spawning season has been carried out regularly since 1988, with some breaks (in 1992-1993, 1997, 2001-2004 and 2009-2014). In 2015 the survey was initiated again partly based on the feedback from fishermen and fishermen’s organizations that IMR should conduct more surveys on this commercially important stock. Since then this survey, hereafter termed the NSSH spawning survey, has continued using hired commercial fishing vessels. In the ICES benchmark assessment of NSS herring in 2016 it was decided to use the data from this time series as input to the stock assessment, together with the ecosystem survey in the Norwegian Sea in May and catch data. Thus, the results from the NSSH spawning survey, have significant influence on the ICES catch advice.
The objective of the NSSH spawning survey 2023 was to continue the time series of abundance estimates, both point estimates and uncertainty, for use in the ICES WGWIDE stock assessment. Moreover, other biological information about the surveyed spawning stock of Norwegian spring-spawning herring is presented: spatial distribution of biomass and acoustic densities, spatial patterns in maturity and variations in temperature.
2 - Material and methods
2.1 - Survey design
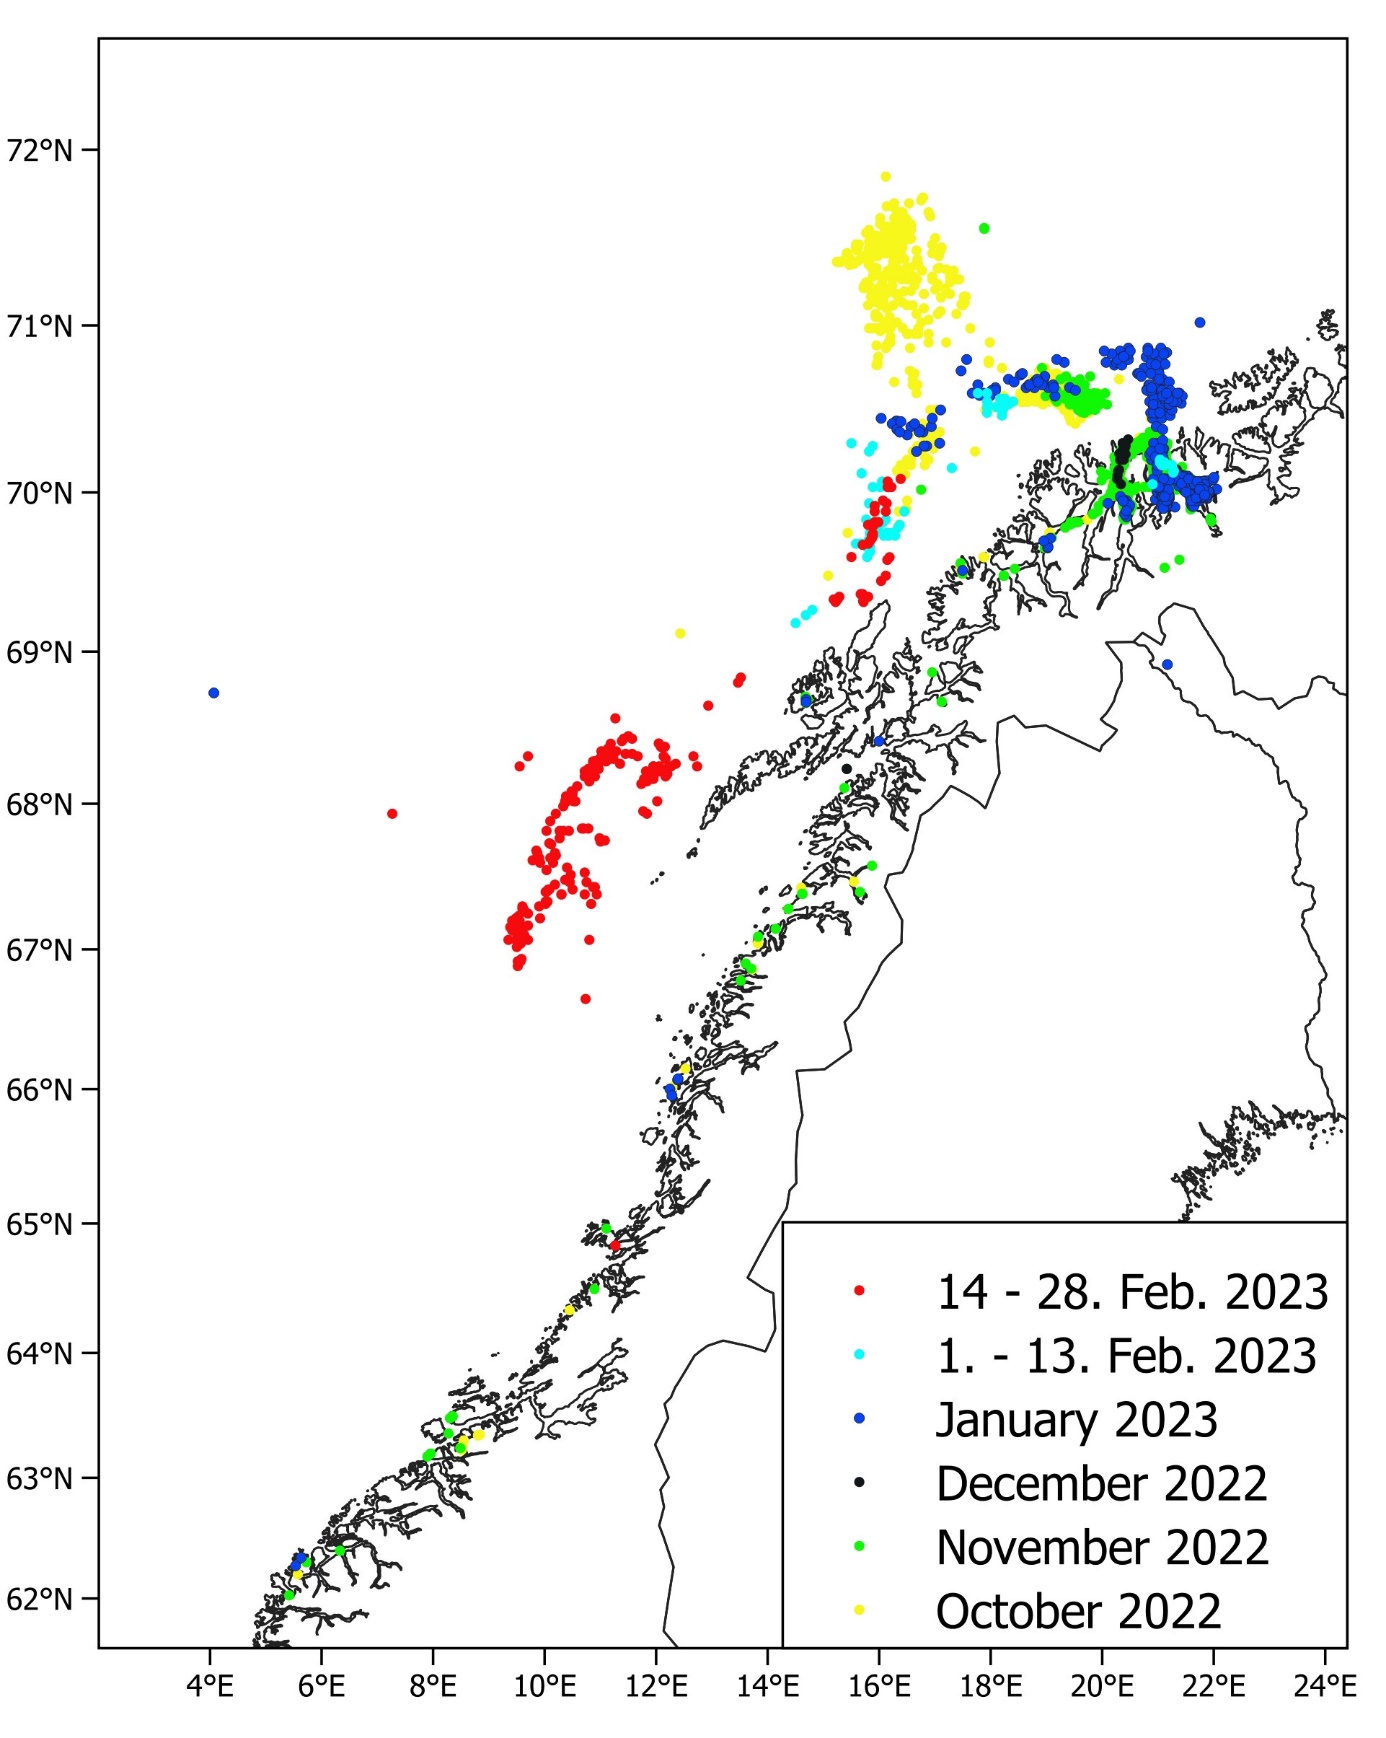
During the period 13-26th of February 2023 (same period as in 2017-2022) the spawning grounds from Møre (62º15ˊN) to Troms (70º37ˊN) were covered acoustically by the commercial fishing vessels MS Eros and MS Vendla. The survey was planned based on information from the previous spawning surveys and the distribution of the herring fishery during the 2022/2023 season and earlier years. Figure 1 shows the distribution of commercial herring catches during the 2022/2023 winter season. The fishery seems to follow the herring migration from the continental slope area north of Andenes in the October into the overwintering areas around Kvænangen in November-January, and out again in January-February to start the spawning migration heading south. During the last nine years in November-January there has also been a fishery that seemed to follow a herring migration from the Norwegian Sea towards Røst and the Træna deep, however, this was not observed in 2023. In the two weeks prior to the start of the survey in 2023 the fishery had not moved south of Andenes, which is unusually far north for this period. Thus, the information from the fishery prior to the survey was sparse this year. Based on the observations from previous years it was decided to plan the survey coverage to take account of herring both migrating from the North along Lofoten and Vesterålen, and herring entering the Røst/Træna deep area from the west (i.e. from Norwegian Sea). As seen in Figure 1, the fishery during the survey in 2023 took place west and southwest of Røst and Lofoten, and north of Andenes, which is further north than usual at this time. The survey design followed a standard stratified design (Jolly and Hampton 1990), where the survey area was stratified before the survey start according to the assumed density structures of herring during the spawning migration (based on previous surveys and fisheries). All strata were covered with a zigzag design since this is the most efficient use of survey effort (Harbitz 2019). The survey planner function in the Rstox_1.11 package in r was used to generate the transects, and this function generates survey tracks with uniform coverage of strata and a random starting position in the start of each stratum. Each straight line in the zigzag track within a stratum was considered as a transect and a primary sampling unit (Simmonds and MacLennan 2005). Transit tracks between strata, i.e. from the end of the zigzag in one stratum to the start of the zigzag in the next stratum, were not used as primary sampling units. Prior to the start of the survey in 2023 all reported NSSH catches had been taken north of Lofoten, hence, the survey coverage (see Aglen 1989) was planned to be low to moderate south of 66°N since it was assumed that the fishing fleet followed the front of the herring migrating south and that the abundance of herring south of the fleet therefore was insignificant.
Trawl sampling was planned to be carried out on a regular basis during the survey to confirm the acoustic observations along transects and to be able to give estimates of abundance for different size and age groups. Both vessels used a Multpelt 832 scientific sampling trawl with small meshed (20 mm) inner net in the codend and a slit (so called “splitt”) close to the codend to avoid too large catches. The following variables of individual herring were analysed from each station with herring catch: total weight in grams and total length in cm (rounded down to the nearest 0.5 cm) of up to 100 individuals per sample. In addition, age from scales, sex, maturity stage, stomach fullness and gonad weight in grams were recorded in up to 50 individuals per sample. Some genetic samples and otoliths were also collected to be used in later research projects.
CTD casts (using Seabird 911 systems) were taken by both vessels, spread out haphazardly in the survey area.
Echosounder data from the 38 kHz transducers was, as usual, the basis for measurement of fish density. The software LSSS version 2.14.0 was used for post-processing. Echogram scrutinization was carried out by the cruise leader and the chief instrument officer. Data was partitioned into the following categories: “herring”, “other”, ”capelin” and “air bubbles” (upper 20 meters from the transducer near field).
2.2 - Abundance estimation
The acoustic density values were stored by species category in nautical area scattering coefficient (NASC) [m2 n.mi.-2] units (MacLennan et al. 2002) in a database with a horizontal resolution of 0.1 nmi and a vertical resolution of 10 m, referenced to the sea surface. The software Stox version 3.6 (Johnsen et al. 2019) was used to estimate abundance. More details and equations can be found in Salthaug et al. (2021). All trawl stations with herring were used to derive a common length distribution for all transects within the respective strata and all stations had equal weight. Abundance of fish in numbers and biomass were estimated based on 1000 bootstrapping iterations of biotic stations and acoustic transects. All results presented in this report are based on the output of this. The following target strength (TS)-to-fish length (L) relationship was used for herring: TS = 20logL – 71.9 (Foote 1987).
3 - Results and discussion
3.1 - Survey coverage
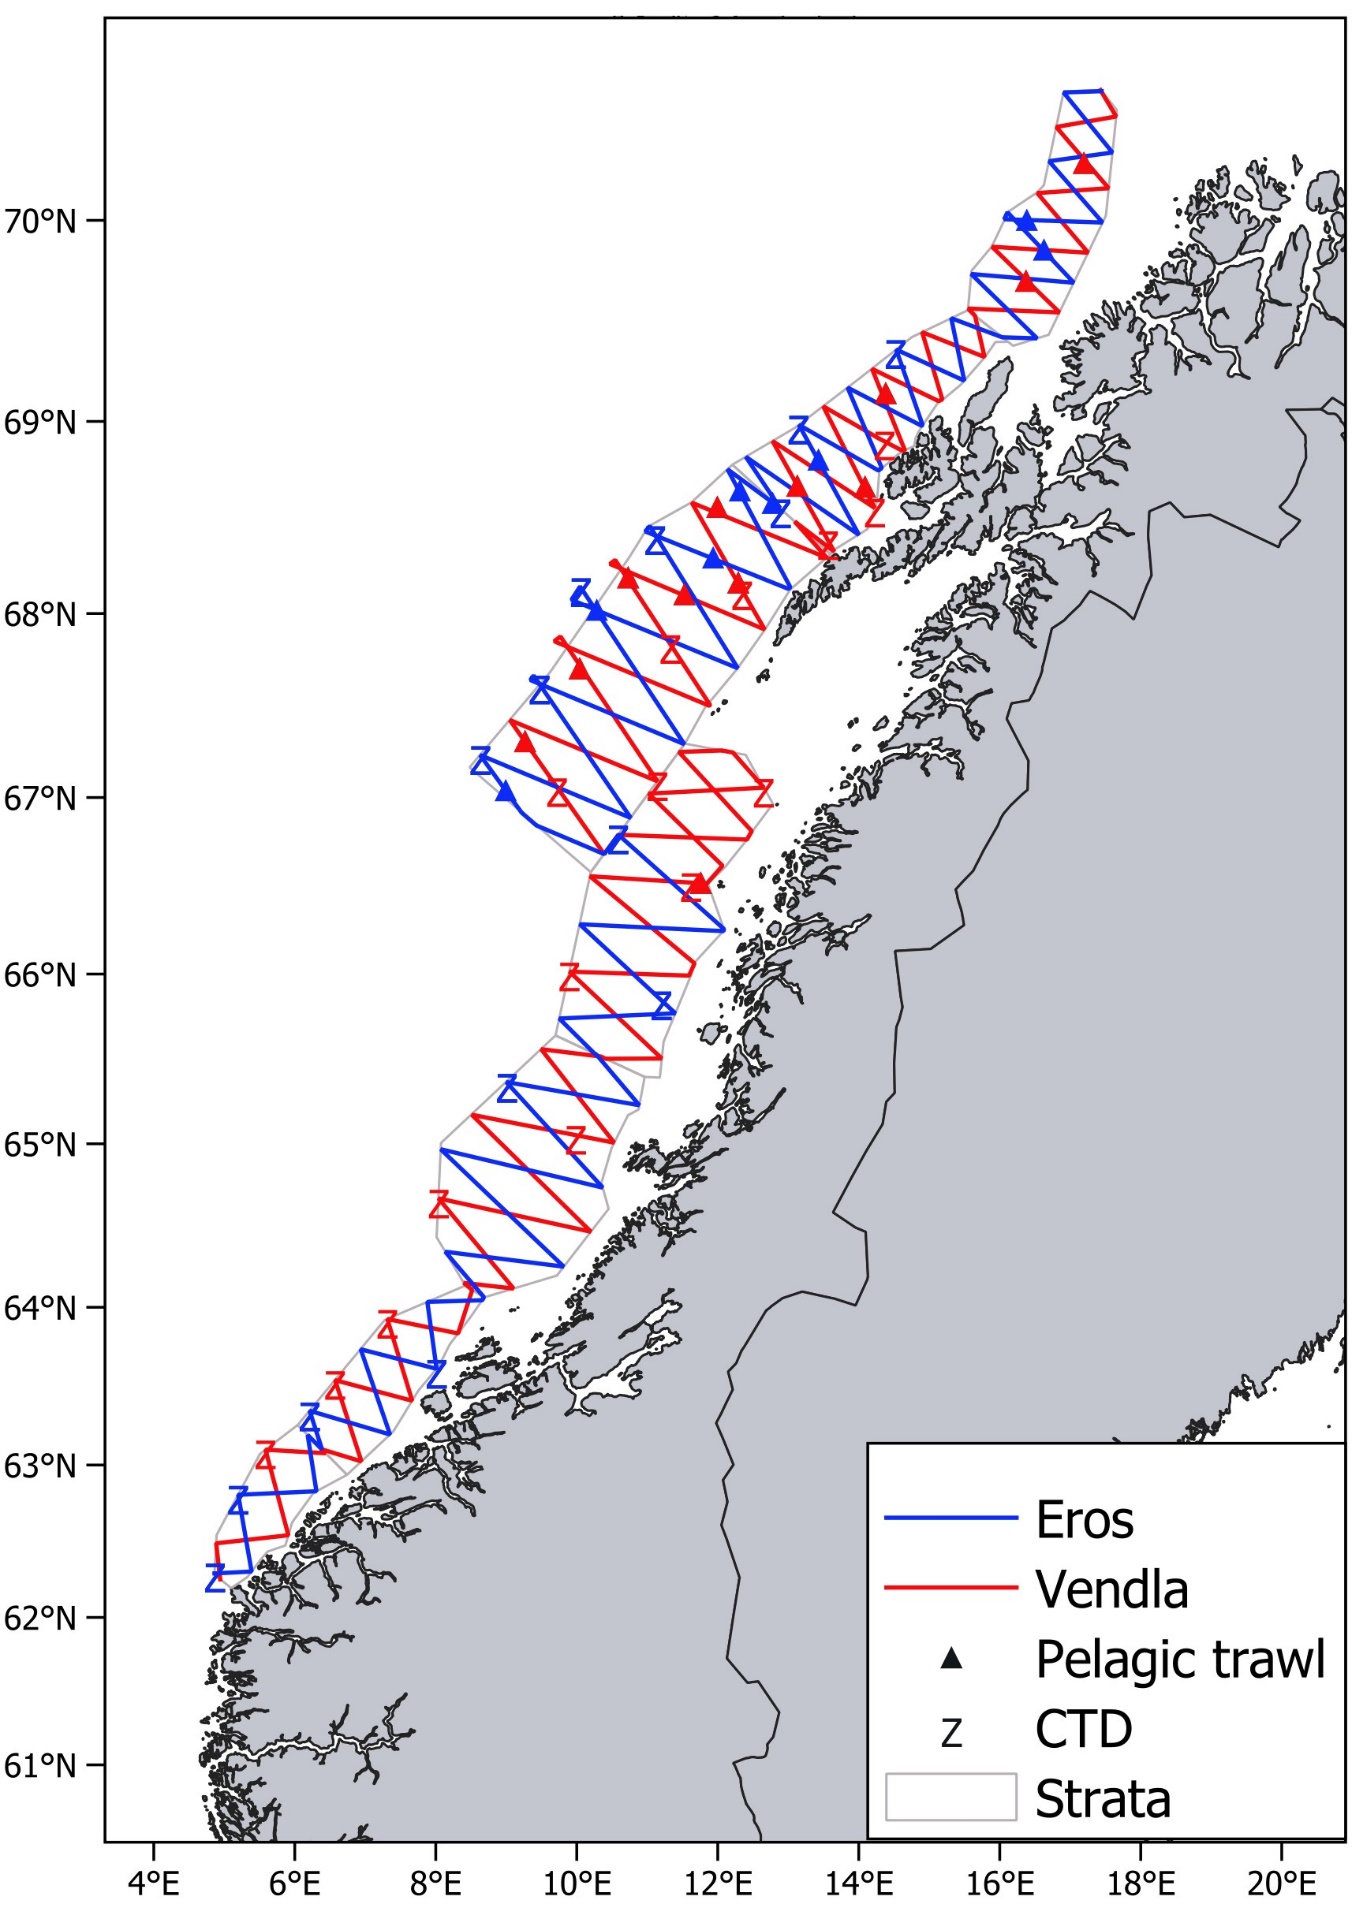
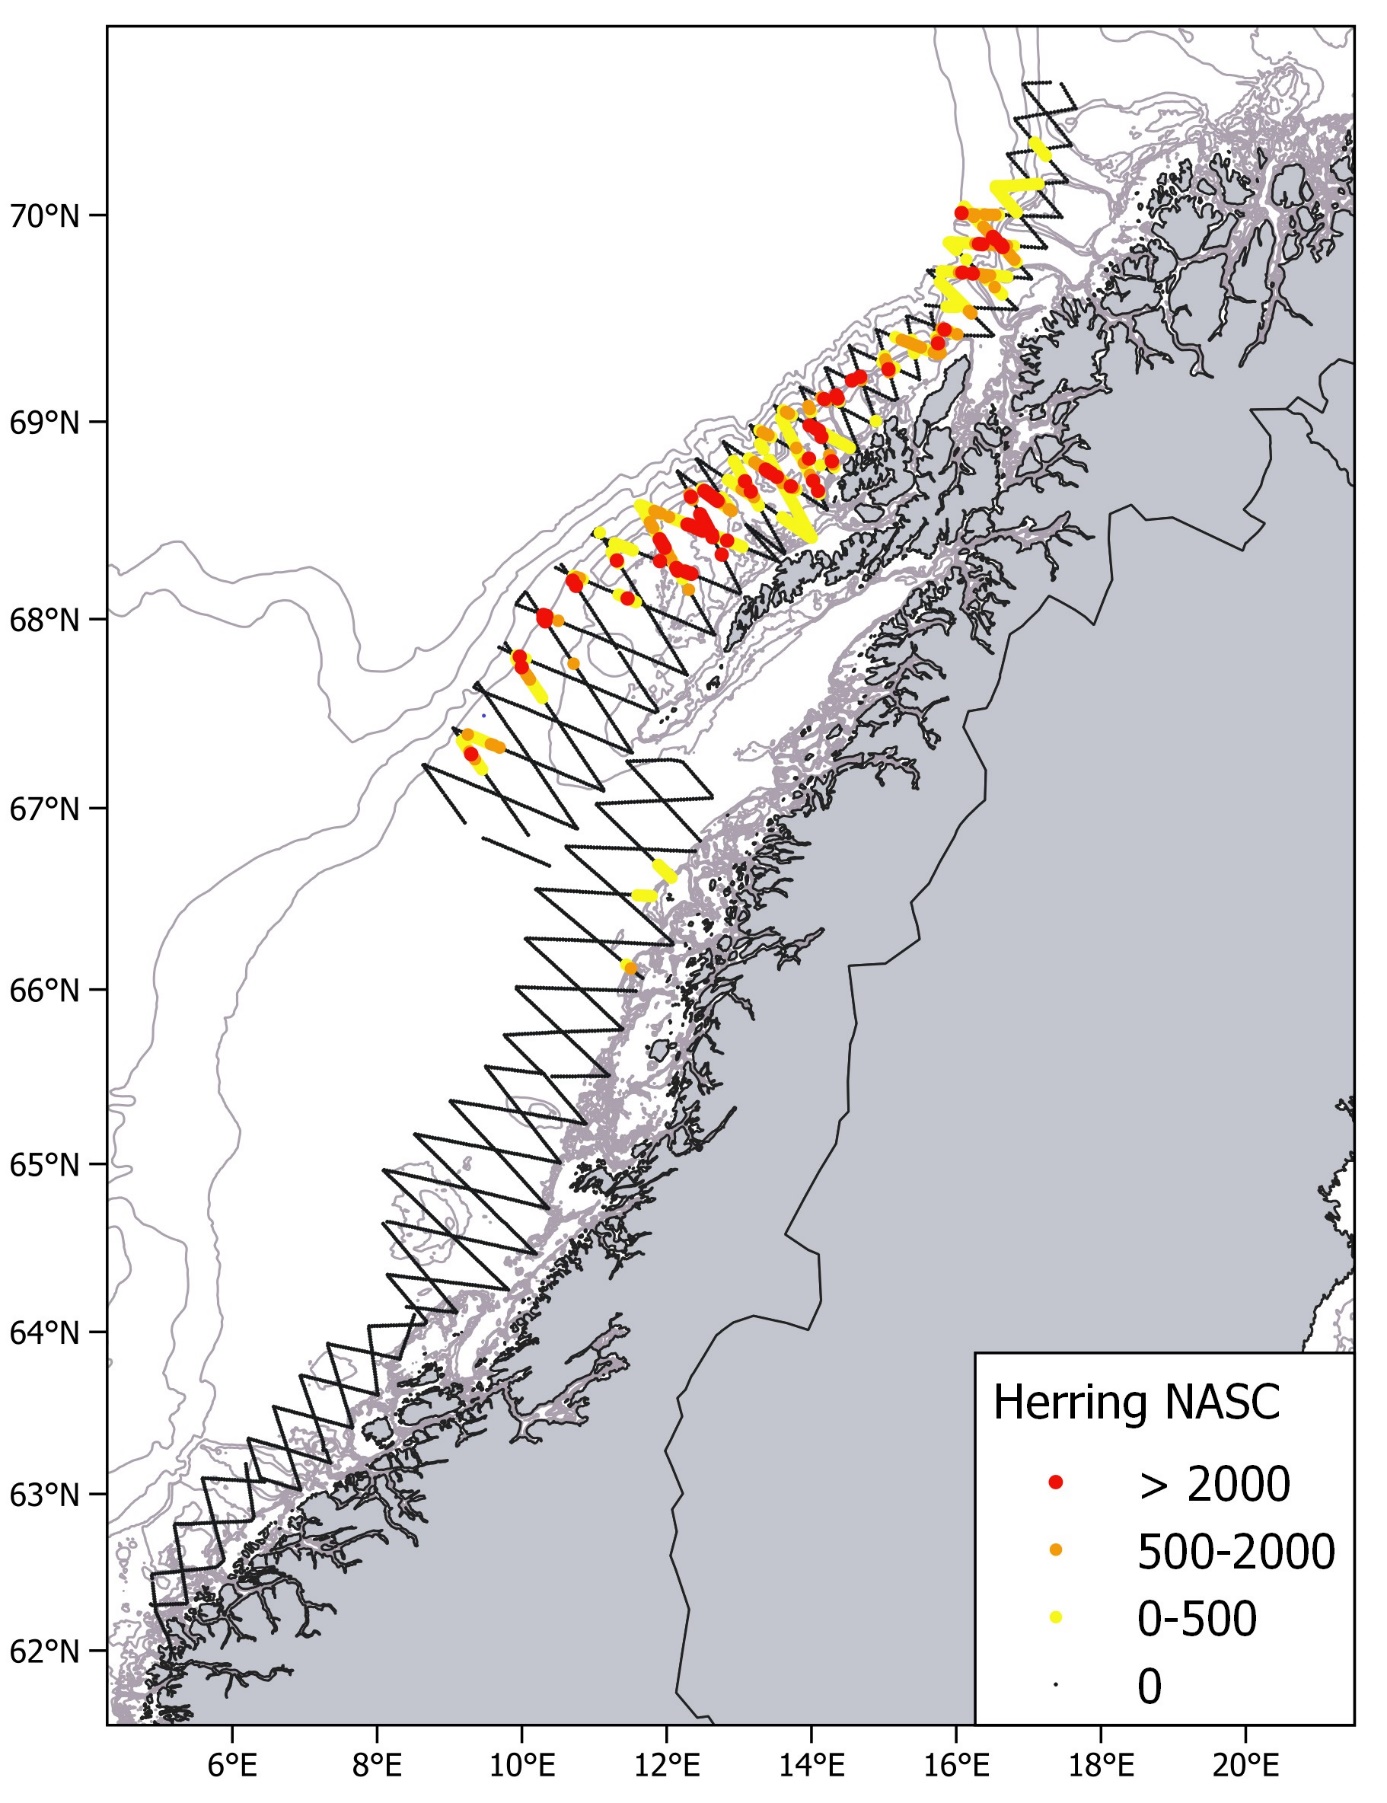
The cruise tracks of the NSSH spawning survey in 2023, together with pelagic trawl stations and CTD stations are shown in Figure 2. As mentioned above, the coverage south of 66°N was low to moderate since we expected low abundance in this area, which turned out to be the case (see below). Thus, most of the available survey effort was used to carry out dense coverage of the strata north of 66°N. The survey coverage (see Aglen 1989) of the first three strata was 5, 7 and 9 respectively (starting from south) and 11 in the two strata west of Lofoten and Vesterålen. The northernmost stratum had a survey coverage of 9. Pelagic trawl hauls were carried out regularly (Fig. 2) in the areas where herring like marks were observed on the echo sounder, to confirm the acoustic observations based on species composition in the catch and to obtain biological samples like size, maturity stage and age of herring. A total of 29 CTD casts were carried out in the surveyed area (Fig. 2). Bad weather prevented some of the planned CTD casts. Nautical area scattering coefficients (NASC) allocated to herring from acoustic transects by each nautical mile are shown in Figure 3. Marks on the echosounders that seemed like herring started to occur near Træna around 66°N, but these were weak registrations. A trawl haul also confirmed presence of herring in the area. Strong herring registrations were not observed before north of 67°N, approximately 60 nautical miles southwest of Røst. Herring was observed on the echosounder and in trawl hauls in all strata north of this. The highest concentrations were observed west of Lofoten, both around the shelf edge and on the banks nearer land. The zero-line was established in the north at around 70.3°N, which is further south than last year. A few capelin marks were observed on the northernmost transects and these were also confirmed by trawl samples.
3.2 - Estimates of abundance
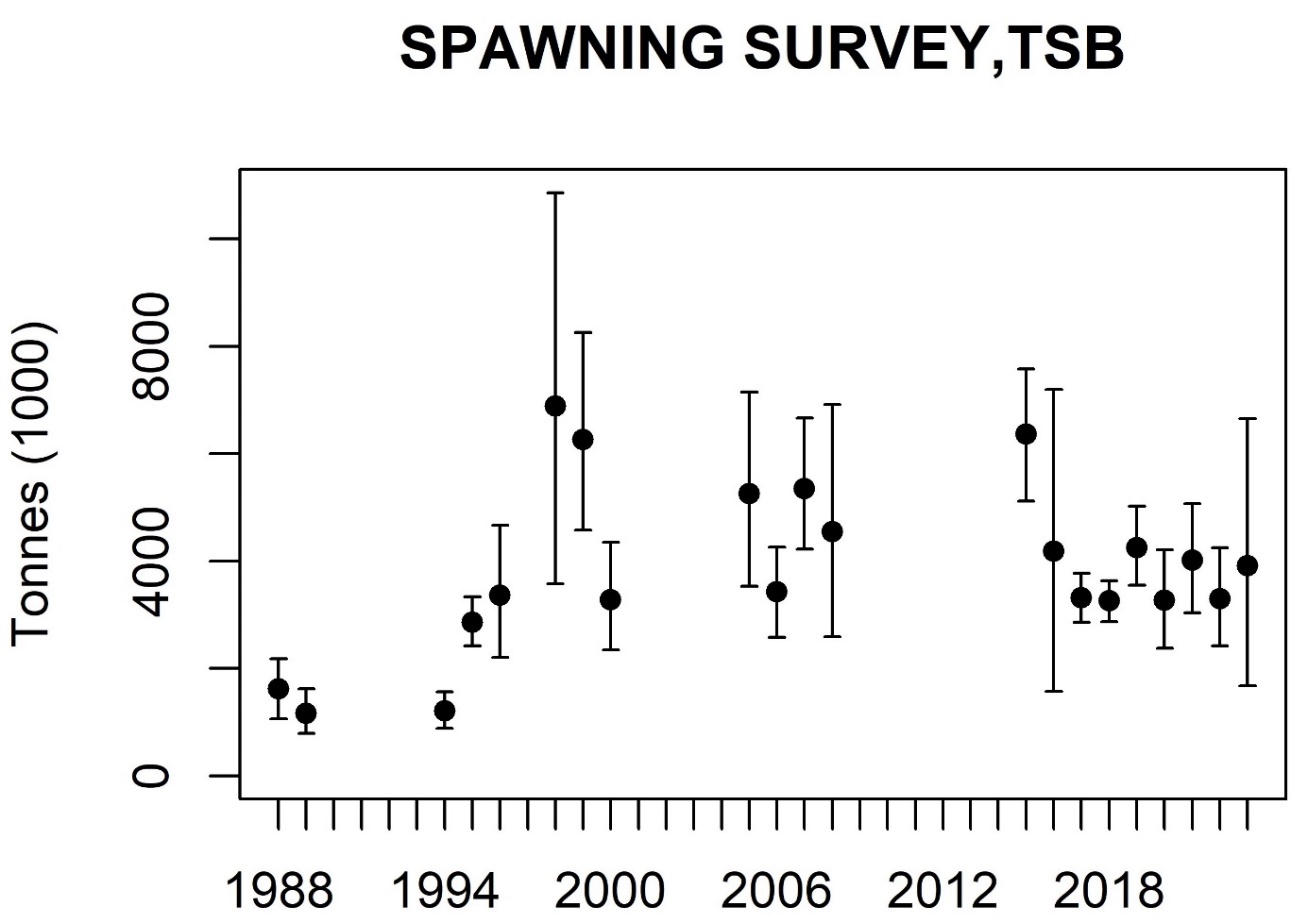
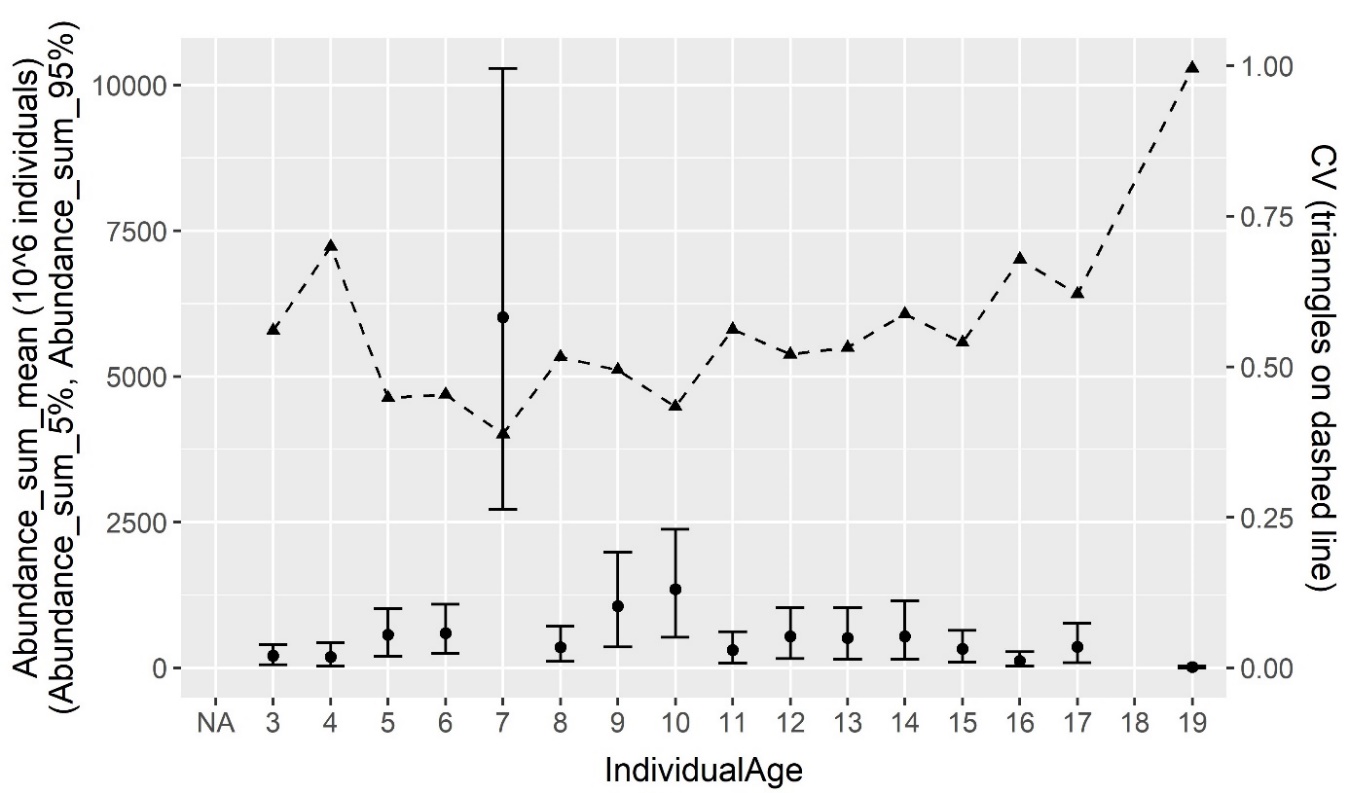
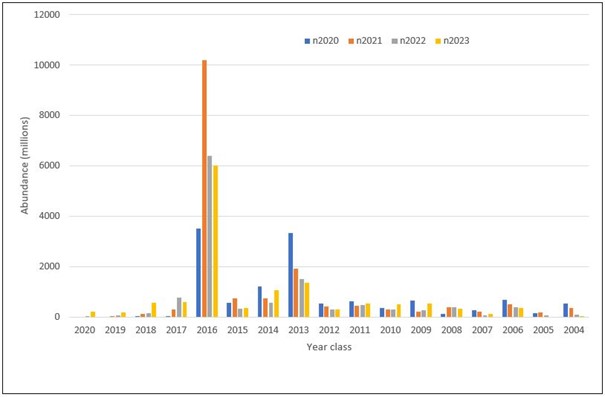
The abundance estimates from this survey are viewed as relative, i.e. as indices of abundance, since there are highly uncertain scaling parameters like acoustic target strength and compensation for herring migrating in the opposite direction of the survey. The abundance estimates are shown in Table 1 and 2. In terms of the point estimates, the 2016 year class (age 7) dominated both in numbers (46 %) and biomass (42 %). Compared with the point estimates from last year (see Salthaug et al. 2022) the 2016 year class was reduced by 6-9 % in numbers (largest reduction for the median). The point estimate (mean) of total stock biomass (TSB) in the survey area was 3.91 million tons which is 18 % higher than last year’s estimate. The time series of mean of total stock biomass from the survey is shown in Figure 4. The point estimate of total stock number (TSN) in the survey area was 13.04 billion which is 7 % higher than last year’s estimate. This year’s estimate of TSB corresponds to the mean of the time series while TSN is below the mean. The relative standard error (CV) of TSB is 40 % and that of TSN is 39 % (Tab. 1 and 2). These estimates of sample uncertainty are much higher compared to those from the last six surveys (7-17 %). The CV per age (Tab.1, Tab. 2 and Fig. 5) shows the normal pattern with high uncertainty for the very young and old ages and lower but still very high uncertainty (around 50 %) for the most abundant ages in the survey. The uncertainty estimates are mainly driven by the highly patchy observations in the stratum west/southwest of Lofoten which contained most of the estimated abundance (see below). Some very strong/dense schools in this area caused high variation in the values of acoustic density samples (EDSUs), i.e. some values were much higher than the rest. One way to reduce the uncertainty when the fish have such patchy distributions is to increase the sampling effort. However, the degree of coverage in this stratum was already high (11) since we expected high densities of fish here. It was therefore unexpected that the uncertainty estimates become much higher than in the most recent years, and we conclude that this is due to randomness. Some years the survey will “hit” large schools which increases the uncertainty and point estimates compared to years when fewer such large schools are observed. This phenomenon is a well-known problem in abundance surveys, see e.g. Pennington (1996). It is doubtful whether changing the survey design or timing of the survey would have prevented the high uncertainty. Figure 6 shows estimates of number per year class in the four most recent surveys. These numbers are expected to decline between consecutive years due to mortality, for ages that are fully recruited to the survey (seems to be age 5 or 6). Such declines are observed for the 2013 and 2016 year classes which are the two strongest in the survey, however, many of the other weaker year classes show an increase from 2022 to 2023. The latter “unexpected” observation is probably a reflection of the very high uncertainty in the 2023 estimates. As observed in the most recent surveys, the 2016 and 2013 year classes are estimated to be the most abundant also in 2023 which shows that this survey is fairly internally consistent. Mean weight and length from the 2023 spawning survey are shown in Table 3. The point estimates are higher than last year for ages 3-6 which indicates more favorable growth conditions.
3.3 - Spatial distribution of the stock and maturity
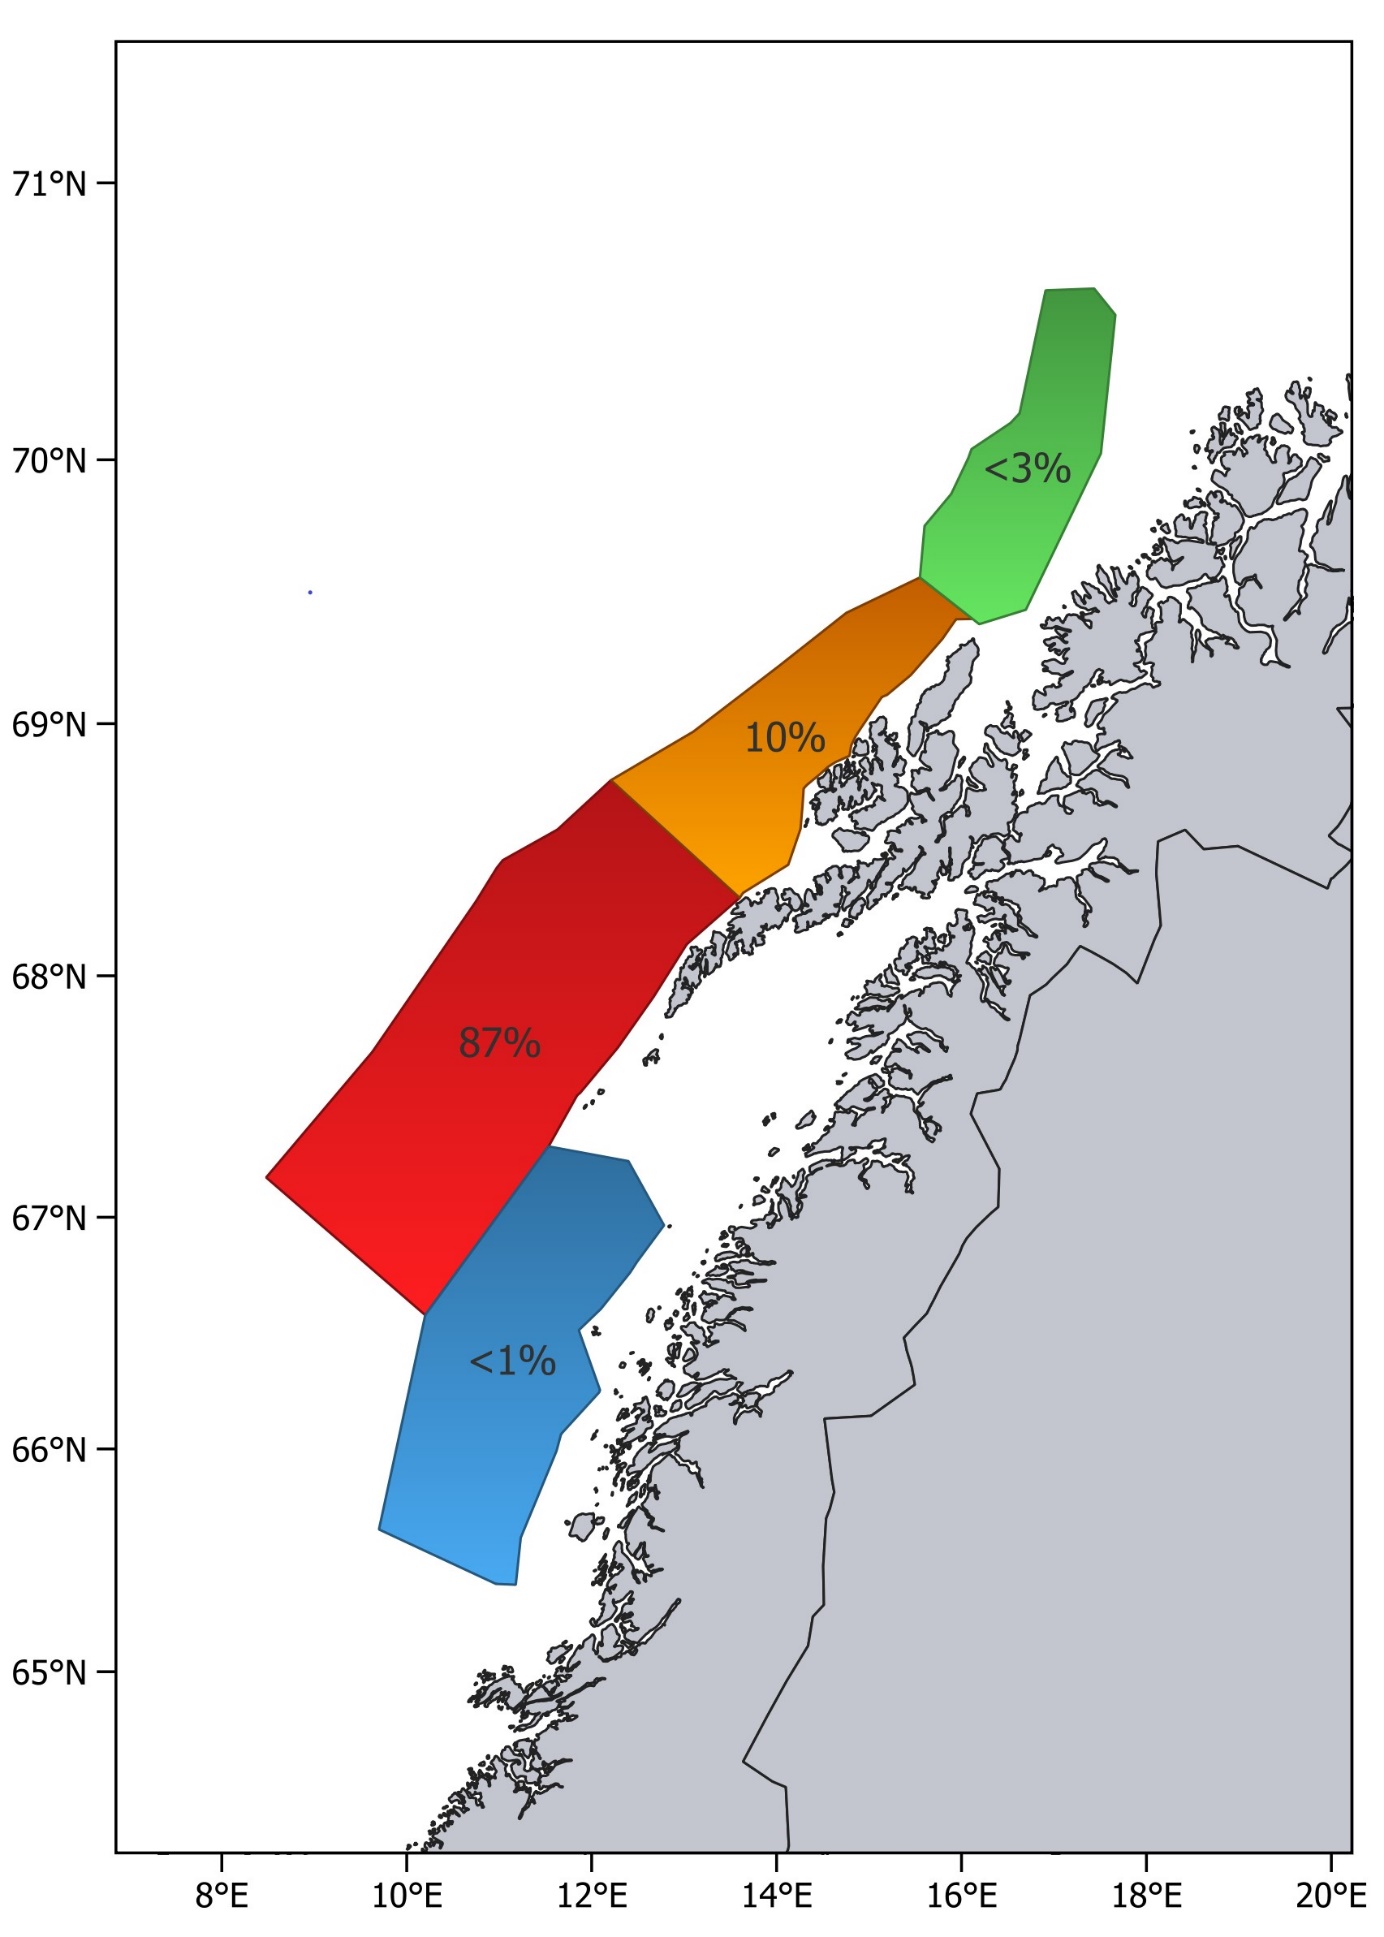
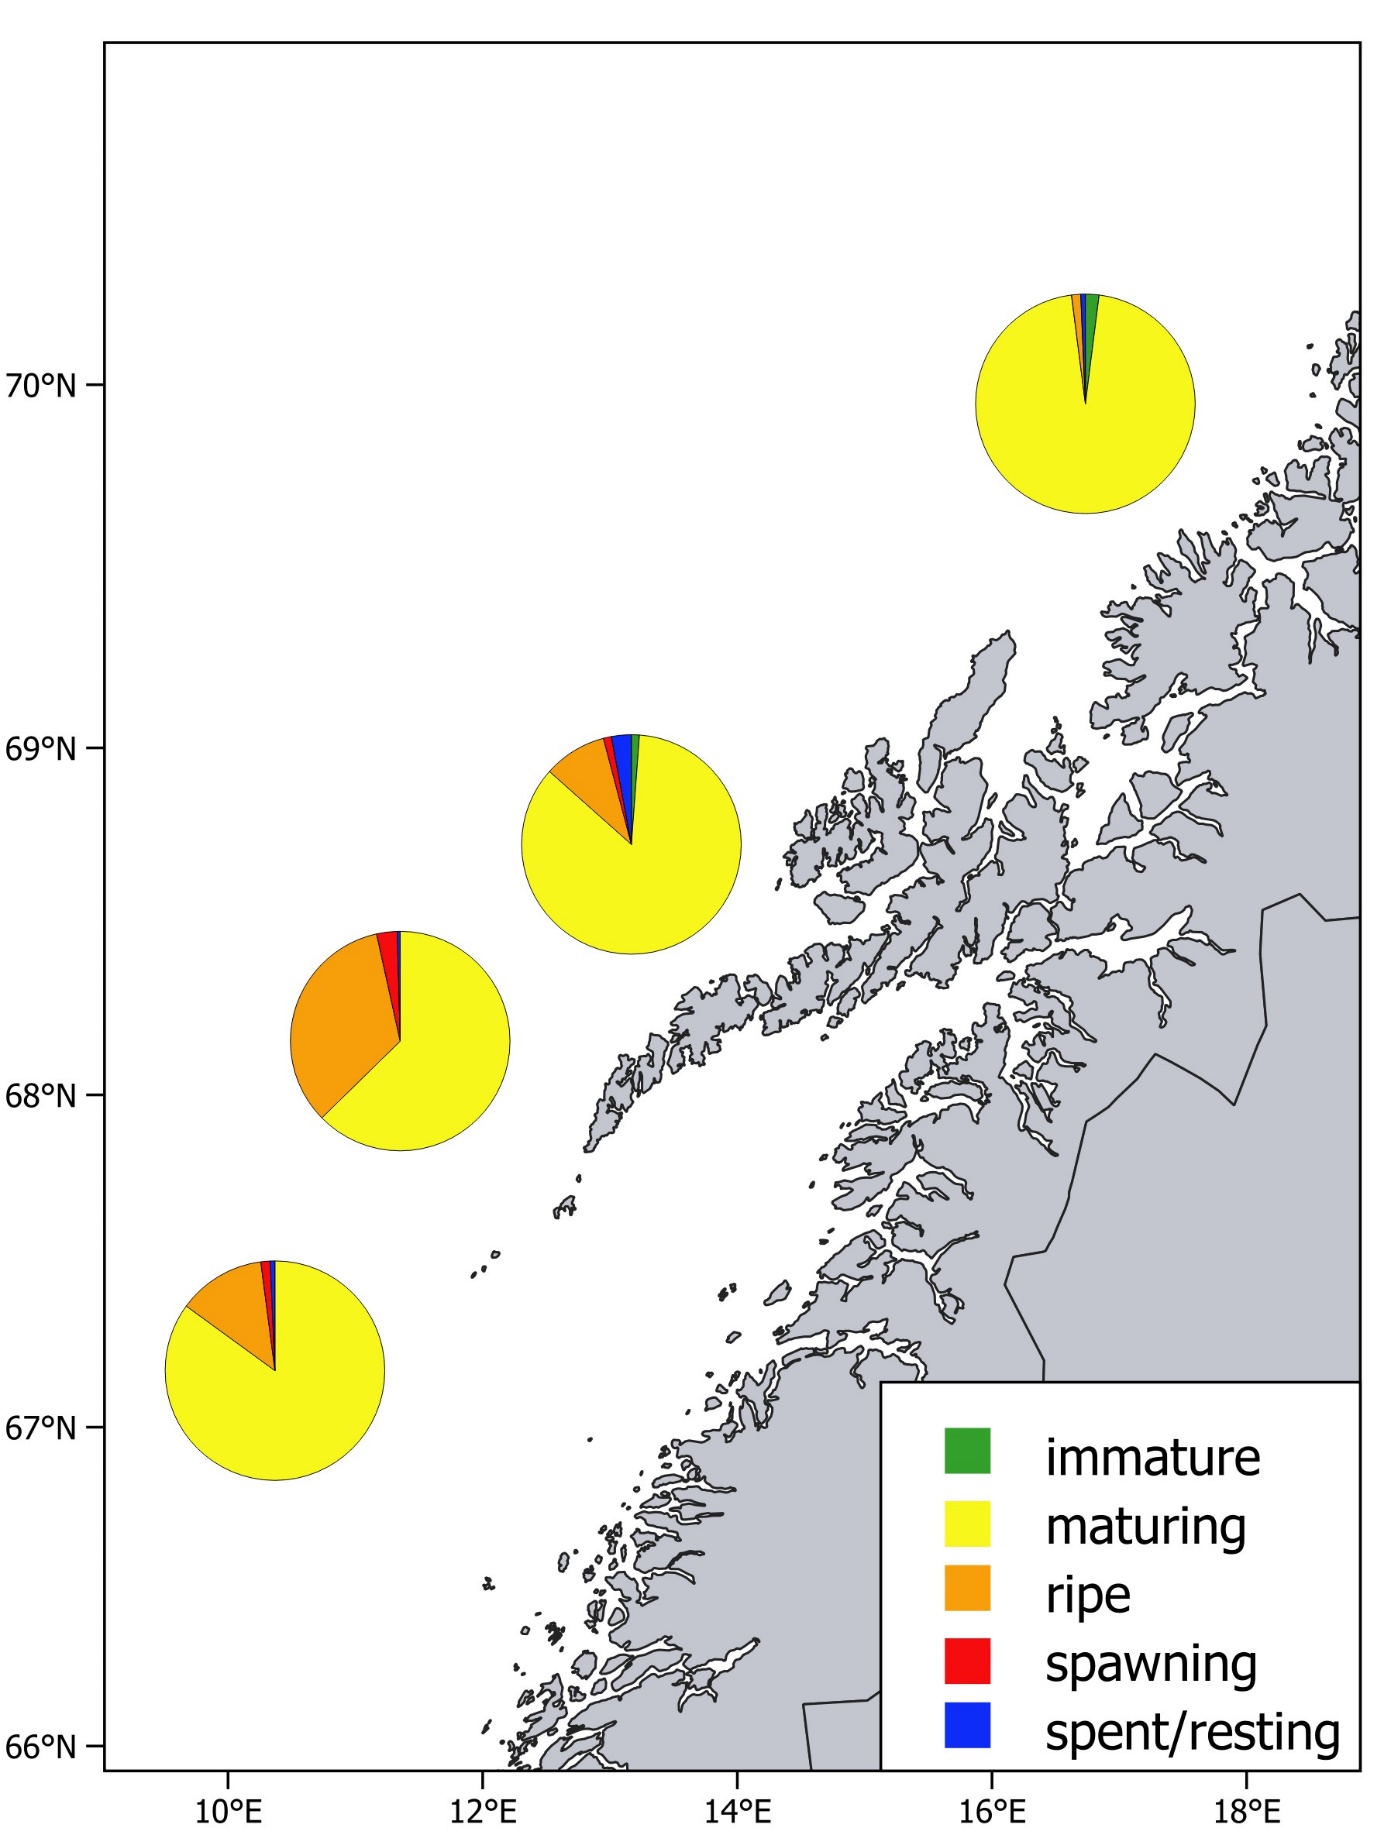
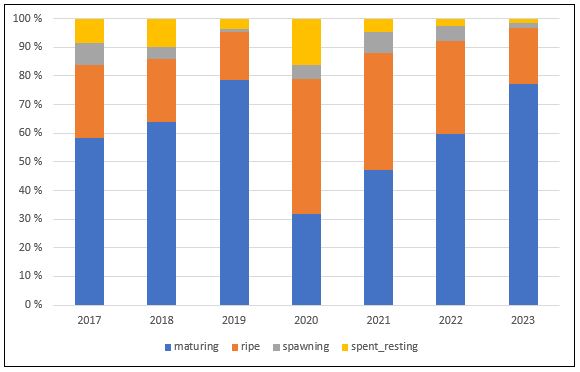
The relative distribution of the estimated biomass per stratum is shown in Figure 7. Most of the biomass (87%) was found in the stratum west and southwest of Lofoten and a significant proportion (10 %) was found in the stratum west of Vesterålen. This shows that the spawning stock was very concentrated and far north this year. Figure 8 shows the proportion of different maturation stages at different latitudes. Most of the herring was classified as maturing or ripe. The proportion of maturing herring was highest (i.e. lowest proportion of spawning and ripe) in the northernmost area as usual. Regarding spawning area, the fishery, like last year, indicates that most of the spawning occurred west of Lofoten around the Røst bank this year (Fig. 1). The fishery in 2023 south of 67°N has been insignificant and based on this it is likely that the spatial distribution of the herring observed during the spawning survey reflects the spawning area. The proportion of the different spawning stages among mature herring is shown for the period 2017-2023 in Figure 9 (the surveys have been carried out in the second part of February during all these years). The large proportion of maturing herring and low proportion of spawning/ripe herring in 2023 compared to earlier years indicates that the spawning is late this year, however, the distribution in 2019 was very similar so not exceptional late.
3.4 - Geographical variation in temperatures experienced by the herring
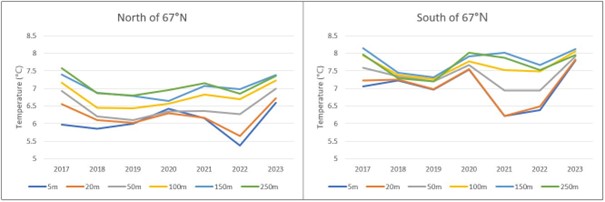
Temperatures experienced by herring from close to the surface and down to 250 m are shown in Figure 10 for the areas south and north of 67°N, for the years after 2016 when the survey has been carried out in the same period (latter half of February). The temperatures in 2023 varied from 8.1°C at 150 m depth south of 67°N to 6.6°C at 5 m depth north of 67N. This range is lower than last year when the variation was large, and the temperature in 2023 was higher at all depths compared to last year. At typical spawning depths of herring at 100-200 m depth, the temperature conditions were quite similar to those observed during the most recent NSSH spawning surveys.
3.5 - Quality of the survey
Both vessels were equipped with multifrequency equipment on a drop keel. The weather conditions were more challenging this year than last, and the vessels had to lie still and wait for better conditions a couple of times, but acoustic data with good quality was recorded and trawling on registrations could be carried out adequately most of the time. Luckily, the weather was very nice in the area where most of the stock was found. Like last year the zero line was clearly established in the north, and we are not aware of any observations that indicates presence of mature NSS herring outside the survey area during the survey this year. To conclude, the acoustic and biological data recorded in 2023 on the NSSH spawning survey were of satisfactory quality and the estimates from the survey are recommended to be used in the stock assessment of Norwegian spring-spawning herring in 2023.
4 - References
Aglen, A. 1989. Empirical results on precision effort relationships for acoustic surveys. Int. Coun. Explor. Sea CM 1989 B:30, 28pp.
Foote, K. 1987. Fish target strengths for use in echo integrator surveys. J. Acoust. Soc. Am. 82: 981-987.
Harbitz, A. 2019.A zigzag survey design for continuous transect sampling with guaranteed equal coverage probability. Fisheries Research 213, 151-159.
Johnsen, E., Totland, A., Skålevik, Å., Holmin, A.J., Dingsør, G.E., Fuglebakk, E., Handegard, N.O. 2019. StoX: An open source software for marine survey analyses. Methods in Ecology and Evolution 10:1523–1528.
Jolly, G.M., and Hampton, I. 1990. A stratified random transect design for acoustic surveys of fish stocks. Canadian Journal of Fisheries and Aquatic Sciences 47: 1282-1291.
MacLennan, D.N., Fernandes, P., and Dalen, J. 2002. A consistent approach to definitions and symbols in fisheries acoustics. ICES J. Mar. Sci., 59: 365-369.
Pennington, M. 1996. Estimating the mean and variance from highly skewed marine data. Fishery Bulletin, US, 47: 1623– 1624.
Simmonds, J, and David N. MacLennan. 2005. Fisheries acoustics: theory and practice. John Wiley & Sons, 2008.
Salthaug, A., Stenevik, E.K., Vatnehol, S., Anthonypillai, V., and Slotte, A. 2021. Distribution and abundance of Norwegian spring spawning herring during the spawning season in 2021. Survey report / Institute of Marine Research/ISSN 15036294/Nr. 1– 2021.
Salthaug, A., Stenevik, E.K., Vatnehol, S., and Slotte, A. 2022. Distribution and abundance of Norwegian spring spawning herring during the spawning season in 2022. Survey report / Institute of Marine Research/ISSN 1503-6294/No. 2– 2021.
5 - Tables
| Age | 5th percentile | Median | 95th percentile | Mean | SD | CV |
|---|---|---|---|---|---|---|
| 3 | 55 | 184 | 402 | 205 | 115 | 0.56 |
| 4 | 25 | 170 | 425 | 189 | 132 | 0.70 |
| 5 | 200 | 538 | 1015 | 568 | 255 | 0.45 |
| 6 | 247 | 550 | 1094 | 594 | 269 | 0.45 |
| 7 | 2725 | 5751 | 10287 | 6014 | 2333 | 0.39 |
| 8 | 111 | 327 | 712 | 351 | 181 | 0.52 |
| 9 | 359 | 981 | 1981 | 1057 | 523 | 0.49 |
| 10 | 521 | 1280 | 2379 | 1349 | 585 | 0.43 |
| 11 | 79 | 277 | 622 | 304 | 171 | 0.56 |
| 12 | 160 | 496 | 1039 | 537 | 279 | 0.52 |
| 13 | 152 | 460 | 1025 | 508 | 270 | 0.53 |
| 14 | 142 | 483 | 1151 | 538 | 316 | 0.59 |
| 15 | 97 | 293 | 643 | 324 | 175 | 0.54 |
| 16 | 23 | 97 | 276 | 116 | 79 | 0.68 |
| 17 | 88 | 314 | 766 | 356 | 221 | 0.62 |
| 19 | 0 | 9 | 30 | 10 | 10 | 1.00 |
| TSN | 5725 | 12572 | 21883 | 13037 | 5040 | 0.39 |
| Age | 5th percentile | Median | 95th percentile | Mean | SD | CV |
|---|---|---|---|---|---|---|
| 3 | 6 | 23 | 53 | 26 | 15 | 0.58 |
| 4 | 4 | 31 | 83 | 35 | 27 | 0.76 |
| 5 | 42 | 107 | 199 | 113 | 51 | 0.45 |
| 6 | 59 | 133 | 263 | 143 | 64 | 0.45 |
| 7 | 745 | 1591 | 2852 | 1657 | 648 | 0.39 |
| 8 | 34 | 106 | 237 | 114 | 61 | 0.53 |
| 9 | 118 | 323 | 663 | 350 | 175 | 0.50 |
| 10 | 174 | 430 | 802 | 453 | 197 | 0.44 |
| 11 | 28 | 98 | 223 | 109 | 62 | 0.57 |
| 12 | 61 | 187 | 395 | 204 | 107 | 0.52 |
| 13 | 56 | 169 | 376 | 187 | 100 | 0.53 |
| 14 | 53 | 183 | 438 | 204 | 121 | 0.59 |
| 15 | 38 | 112 | 249 | 125 | 68 | 0.54 |
| 16 | 9 | 38 | 109 | 46 | 31 | 0.68 |
| 17 | 34 | 119 | 292 | 134 | 83 | 0.61 |
| 19 | 0 | 4 | 11 | 4 | 4 | 0.99 |
| TSB | 1674 | 3768 | 6660 | 3910 | 1560 | 0.40 |
| Age | mean weight (g) | CV(weight) | mean length (cm) | CV(length) |
|---|---|---|---|---|
| 3 | 121.1 | 0.050 | 26.2 | 0.012 |
| 4 | 166.7 | 0.081 | 28.7 | 0.025 |
| 5 | 193.7 | 0.043 | 29.7 | 0.009 |
| 6 | 236.9 | 0.023 | 31.4 | 0.006 |
| 7 | 269.5 | 0.008 | 32.7 | 0.002 |
| 8 | 318.4 | 0.034 | 34.4 | 0.011 |
| 9 | 328.7 | 0.014 | 35.0 | 0.003 |
| 10 | 332.5 | 0.009 | 35.0 | 0.003 |
| 11 | 352.8 | 0.022 | 35.9 | 0.006 |
| 12 | 379.8 | 0.017 | 36.9 | 0.006 |
| 13 | 365.8 | 0.014 | 36.4 | 0.004 |
| 14 | 381.4 | 0.019 | 37.0 | 0.006 |
| 15 | 385.5 | 0.019 | 37.4 | 0.006 |
| 16 | 390.1 | 0.028 | 37.3 | 0.010 |
| 17 | 385.0 | 0.021 | 37.0 | 0.009 |
| 19 | 390.2 | 0.016 | 37.9 | 0.006 |
6 - Figures