The Barents Sea has become cooler, pushing the marginal ice zone south
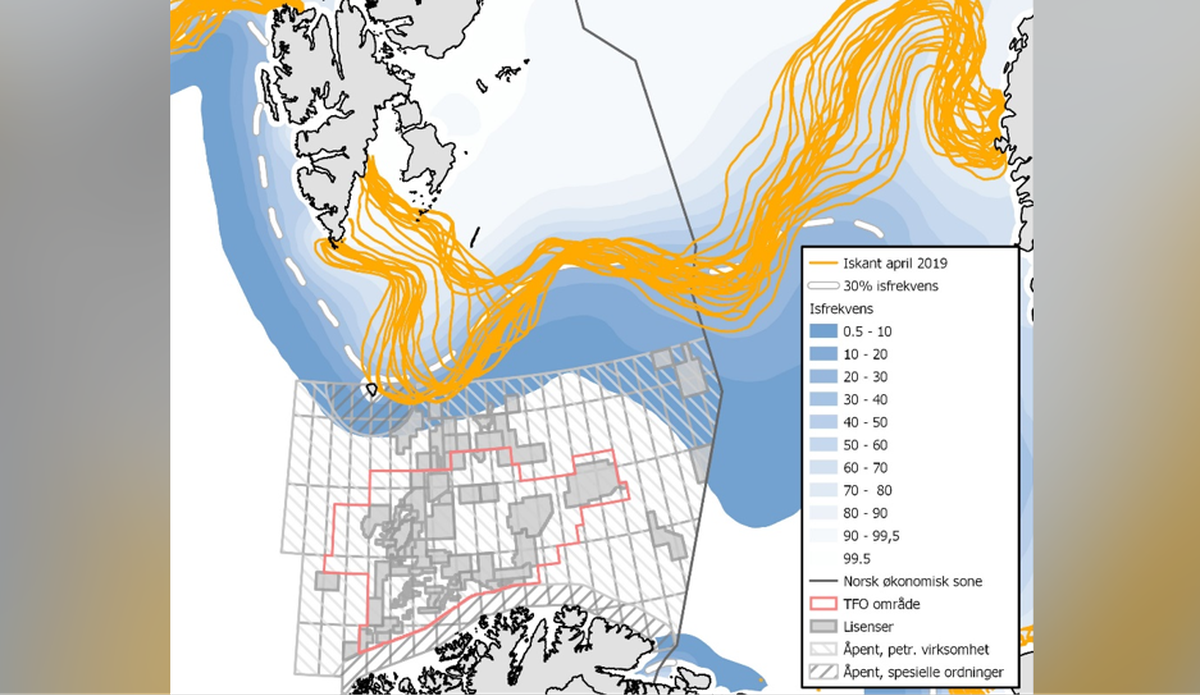
The orange lines show the position of the ice edge (sea ice concentration of 15%) on all of the days in April 2019 (source: NSIDC). The blue and white lines show the sea ice frequency (1988-2017) for April (source: Norwegian Polar Institute), while the grey and red lines and areas show oil and gas fields and licences (source: NorwegianPetroleum.no).
Published: 29.01.2020
The Institute of Marine Research (IMR) has been monitoring temperatures in the Barents Sea for more than 70 years.
“Our data show that temperatures in the Barents Sea have fallen over the past five years”, says Randi Ingvaldsen, a researcher at the IMR.
“Temperatures in the southwestern part of the sea are now back at roughly the same level as they were in the early 2000s.”
Colder currents responsible
The water temperature of the Barents Sea is highly dependent on the warm Atlantic waters that enter from the southwest.
“The Barents Sea has become cooler because the water being brought by the Norwegian Current, which is the continuation of the Gulf Stream, has been cooler”, explains Ingvaldsen.

The ice edge has moved further south
The amount of heat flowing into the Barents Sea affects what proportion of it is covered by ice. The ice edge has moved southwards since 2016.
“With less heat entering the area, the amount of sea ice has increased”, says Ingvaldsen.
“But the Atlantic waters are not the only driving force behind these changes. Fluctuations in the ice edge also depend on how much ice enters from the north and east, wind directions and the amount of ice that melts or freezes over.
In other words, the location of the ice edge varies from decade to decade, from year to year, but also significantly from day to day.
“That is clear from the map of how the ice edge fluctuated during April 2019. Each line represents the ice edge on a given day, and it can be seen clearly that the ice edge varies significantly on a daily basis and a great deal on a monthly basis – 50 to 250 km, in fact.
“Cooling waters are part of natural variability”
The water temperature in the Barents Sea varies naturally. In other words, temperatures fluctuate over time.
“It is well known that the Barents Sea has become much warmer over the past 40 years. But in recent years we have actually seen cooling, due to the underlying natural fluctuations that will always exist”, says Randi Ingvaldsen.
“That doesn’t change the fact that global warming is shifting the temperature curve upwards, with both the temperature peaks and troughs becoming higher than in the past.”