Kartlegging, overvåkning og vurdering av vektorer for introduksjoner
Norge har den nest lengste kystlinjen i verden og det er utfordrende å overvåke fremmede marine arter langs hele kysten og i norske områder i Barentshavet og rundt Svalbard. Det finnes i dag ikke noe nasjonalt program for overvåkning og kartlegging av fremmede marine arter, men det foregår en del aktivitet knyttet til spesifikke arter og organismegrupper som blir presentert her.
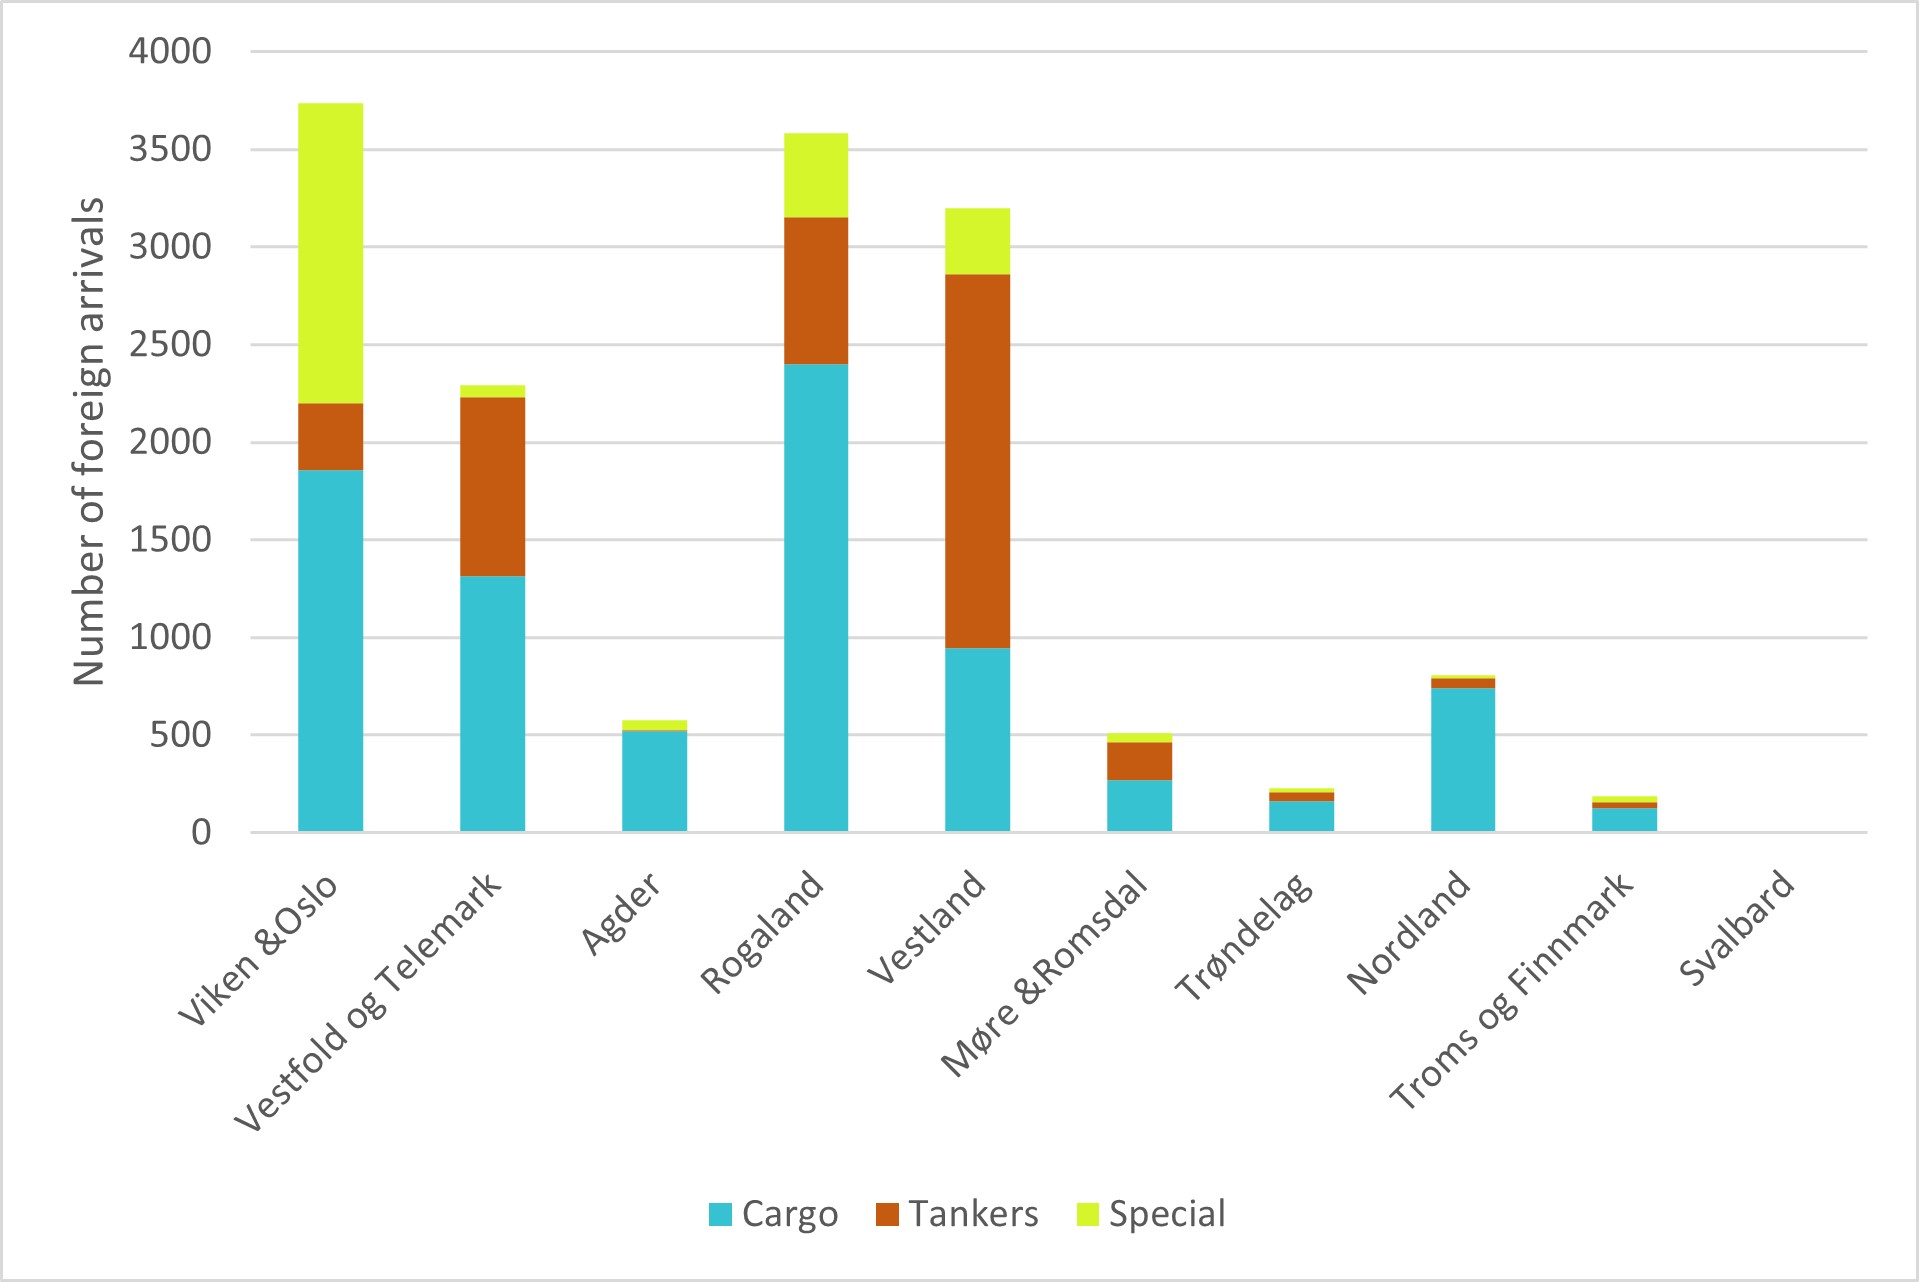
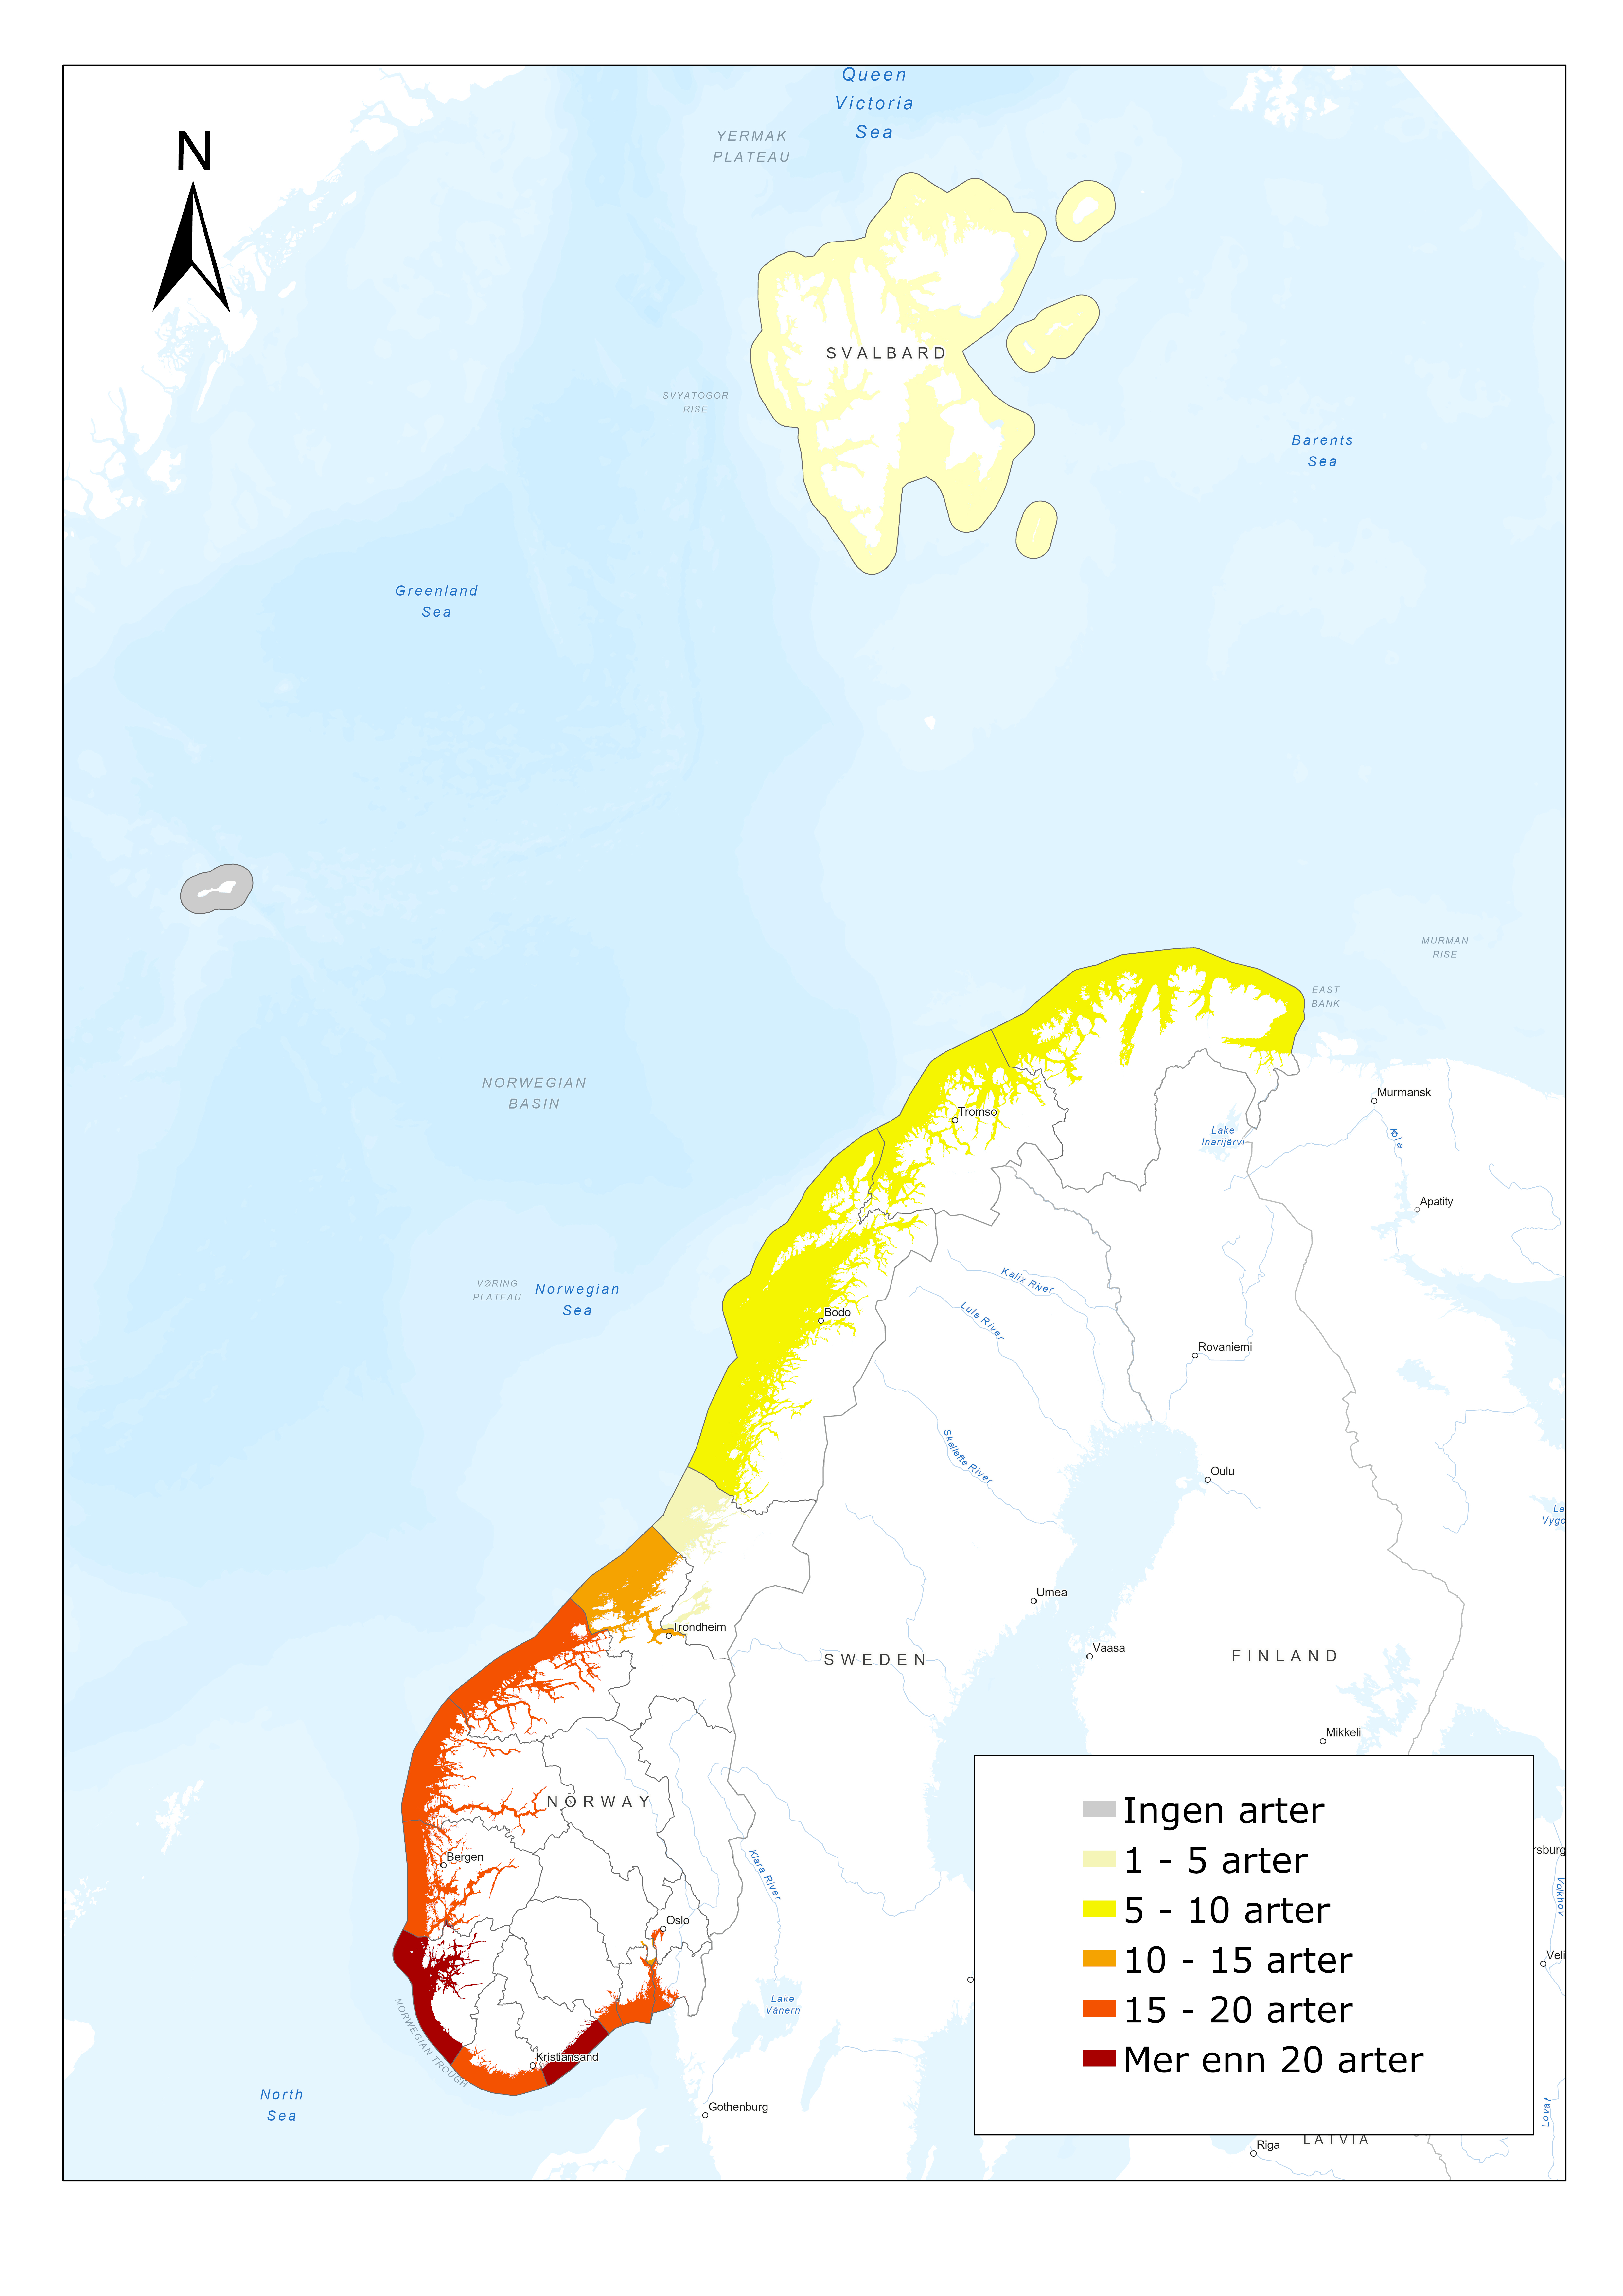
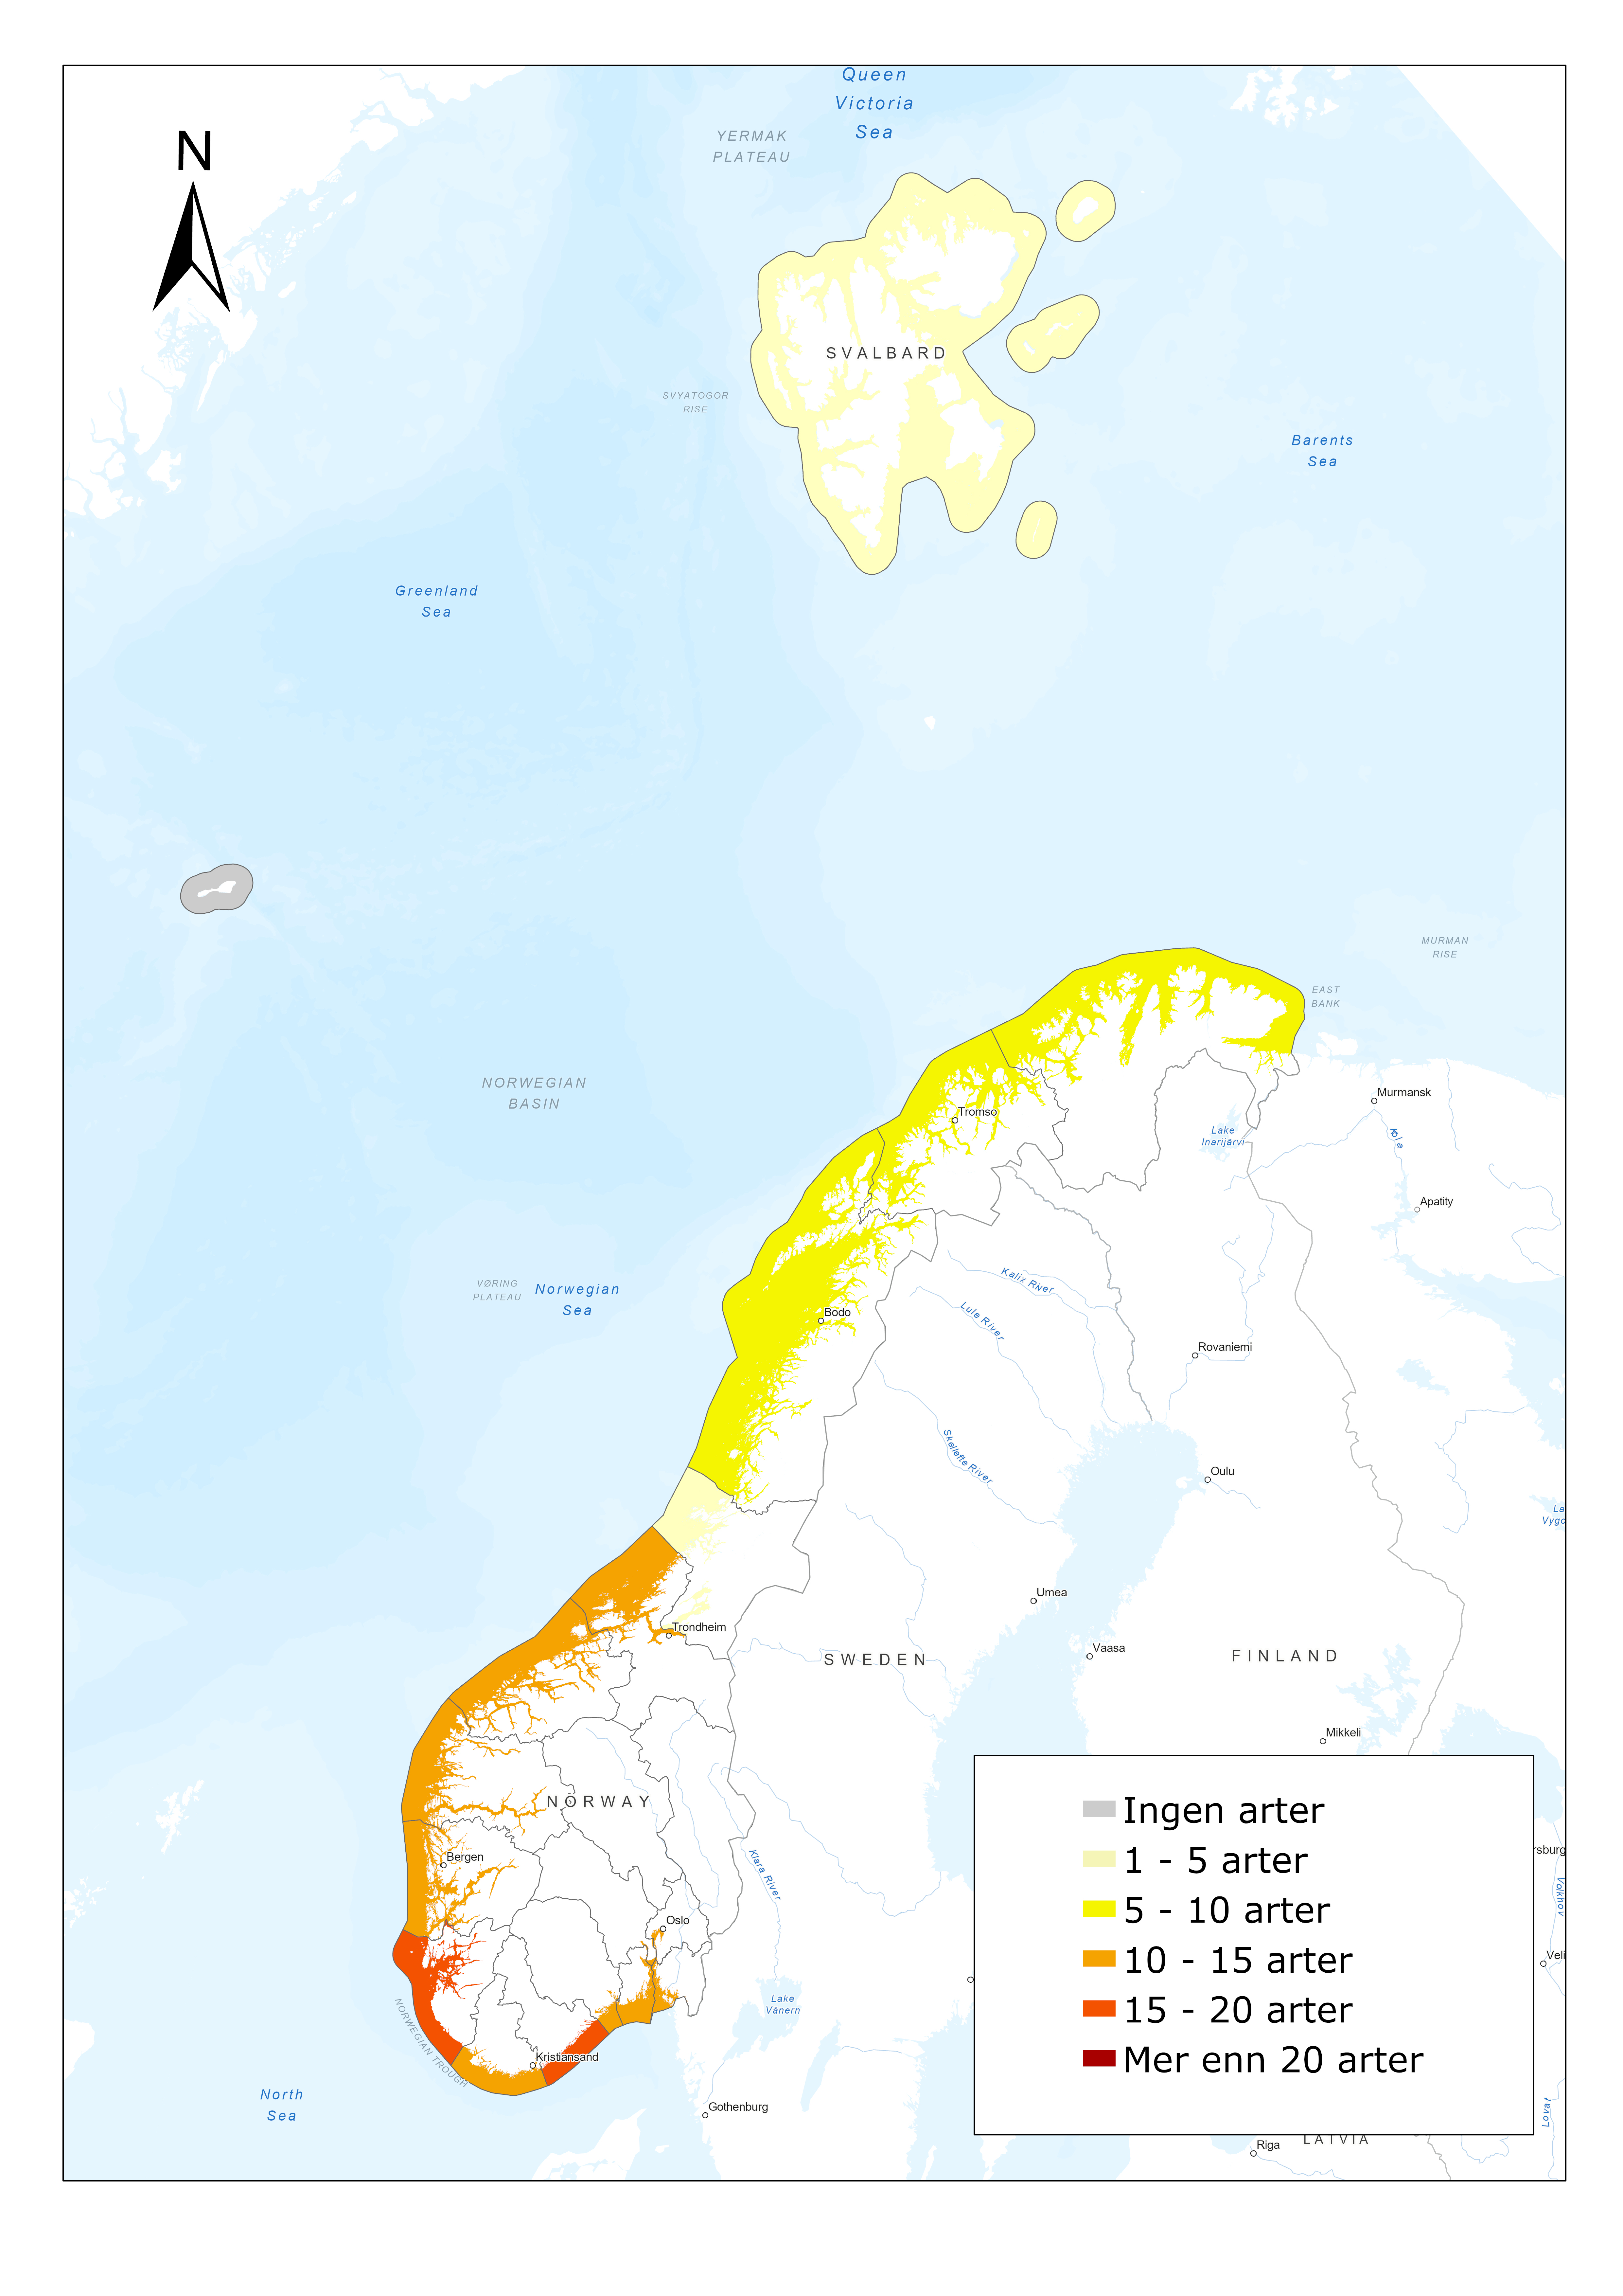
Historisk har transport av organismer i ballastvann utgjort den største risikoen for introduksjon av nye marine arter, men med implementeringen av ballastvannsforskriften er denne risikoen blitt betydelig lavere. Påvekst av fremmede organismer på skroget av fartøy som kommer inn til norskekysten fra utenlandske havner trer derfor frem som en av dagens viktigste vektorer for nye introduksjoner. En analyse av frekvensen og opprinnelsen (siste havneanløp) for 158 000 fartøyanløp i norske havner i 2020-2021 presenteres her. Resultatene viser at Oslofjorden og Vestlandet er de områdene med høyest risiko for introduksjoner av arter med fartøy. Andre vektorer for introduksjon av fremmede marine arter blir også evaluert, slik som den økende mengden med marint søppel som kan føre med seg begroingsorganismer, egg og larver til nye områder. En analyse av historiske data for etablerte fremmede marine arter viser at kysten av Sør-Norge er særlig mottagelig for fremmede arter. Dette mønsteret reflekter ikke bare vektorpresset, men også temperaturgradienten når man går nordover i landet.
Mulig tiltak for å begrense tilførselen av nye fremmede arter til norskekysten og tiltak mot problematiske arter blir også diskutert.
Summary
Norway has the second longest coastline in the world, and it is challenging to monitor non-indigenous marine species (NIMS) along the entire shore including the Norwegian areas in the Barents Sea and along Svalbard. There is currently no national program for such monitoring, however some activity is taking place on specific species and organism groups which is presented here.
Historically transport of NIMS is ballast water have been the main pathway into the Norwegian coast, but with the implementation of the Ballast Water Convention this risk is minimized. Biofouling on vessels coming into the Norwegian coast is thus considered to be the most important vector for marine introduction of new species. An analysis of the frequency and origin (last port call) for 158 000 vessel arrivals into Norwegian ports in the period 2020-2021 is presented. The results show that the Oslofjord area and the west coast is the areas with highest risk for marine introductions by vessels. Other vectors for such introductions into Norway are evaluated like the increasing amount of floating debris which can carry fouling organisms, larvae and eggs to new areas. An analysis of historical data for the established NIMS in Norway show that the southern area of Norway is most susceptible to new species. This pattern is not only dependent on the vector pressure but also reflects the temperature gradient northwards along the coast.
Measures for prevention of new species to arrive and management of problematic species is also discussed.
1 - Introduction
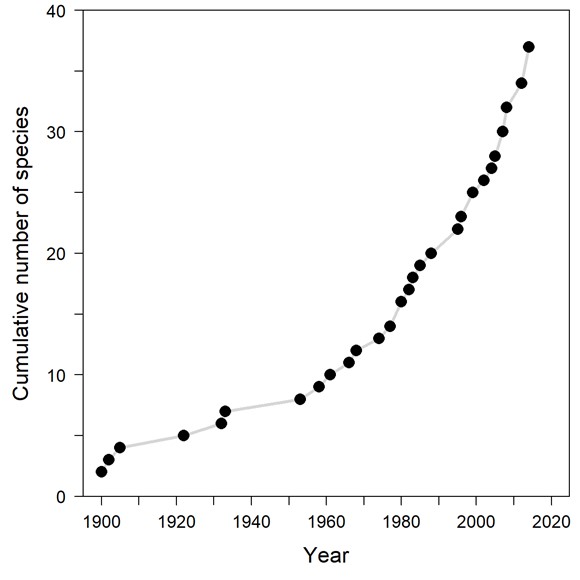
Introduced non-indigenous marine species (NIMS) can cause large ecological and economic consequences in their new environments, and monitoring their presence and distribution is essential for mitigating potential negative consequences. Currently there are only 42 recorded NIMS in Norwegian waters. This is in sharp contrast to the situation further south in Europe and particularly in the Mediterranean, where 900 NIMS are established. Sea temperature is in general the most important factor regulating the distribution of marine species. In Norway, winter temperature is often too low for species present further south in Europe to survive, or the summer temperature is too low for the species to reproduce. This is also the case for introduced species and is most likely reflected in the low number of NIMS in Norwegian waters.
The establishment and dispersal potential of NIMS in Norway and the potential ecological impact on native species and ecosystems is assessed by expert groups arranged by the Norwegian Biodiversity Information Centre and revised with regular intervals. A risk assessment was also performed for several door knocker species (defined as alien species which has not yet established in Norway but is likely to do so within 50 years) in the last revision in 2018. For the new revision in 2023, a more extensive assessment of potential door knocker species is performed through horizon scanning of species listed for the European region.
Monitoring of established populations of NIMS can have different purposes, such as stock assessment of economical valuable NIMS, surveillance of population and dispersal development of troublesome species, screening of pathogens in organisms and repeated investigations of sites with high risk for new introductions. A general mapping of established species gives good information on their dispersal, abundance and is useful for assessing their risk to native ecosystems. General mapping, which also has the purpose of detecting newly arrived species, is useful for early warning of species with a high risk of ecological impact but also for providing an inventory of NIMS present in the country and their distribution area.
Our neighbouring countries have several introduced species which have not yet established in Norway, such as round goby (Neogobius melanostomus), Japanese shore crab (Hemigrapsus sanguineus) and Harris mud crab (Rhithropanopeus harrisii). Alien species occurring in Denmark and Sweden can arrive in Norway unaided trough movement of adults or propagule dispersal by sea currents. Introduction of a new species can be a stochastic event where one foreign vessel that arrives to a port this year brings a clonal species which establishes instantly. In most cases, a high vector pressure into an area is more likely to bring new marine species and there is probably a need for multiple introductions for a species to successfully establish, in particular in species with sexual reproduction. Assessing vector pressure on a temporal and spatial scale is thus a meaningful and relevant exercise.
Worldwide there is an increasing focus on the problem with species on the move and measures to prevent introductions of new marine species. With the implementation of ballast water treatment, an important vector for marine introductions is minimized, but still the vessels that invested in expensive treatment systems may anchor up beside a heavily fouled vessel with alien biota. In Norway, several measures to prevent introduction of new marine species are in place, and vectors such as import of alien species for aquaculture and living seafood are regulated, while vectors such as transport of living cleaner fish and floating debris still represent a risk of introducing new marine species.
In 2021 the Institute of Marine Research (IMR) in corporation with the Norwegian Institute for Nature Research (NINA) received an assignment from the Norwegian Environment Agency. Bergen Port Authorities has contributed with analysis of the cruise traffic. The assignment should focus on elucidating the current mapping and monitoring activity on alien marine species, assess vectors for dispersal, present monitoring methods and develop a proposal for a national monitoring plan for the marine environment. This report is the first of two reports to complete the assignment. This report gives and overview of existing monitoring and mapping activities on marine alien species in Norwegian waters. Moreover, an analysis of the vectors for such introductions are given. The second report (in Norwegian) will focus on methods for mapping and monitoring and gives a proposal for a national monitoring plan.
2 - Mapping and monitoring
2.1 - Red king crab (Paralithodes camtschaticus)
The red king crab is an introduced species to the Barents Sea (Figure 1). It is native to the North Pacific Ocean as Bering Sea, Gulf of Alaska, Sea of Okhotsk and Japan. Russian scientists released red king crabs near Murmansk with the goal to create a sustainable fishery to increase the living standards for the local human population (Orlov & Ivanov 1978, Jørstad et al. 2002). The first transfers were made already in the 1930’s but presumable none survived the journey to actually be released. In 1961, 1.5 million larvae were released in the Bay of Murmansk and over the coming years until 1969 10 000 juveniles and 2 609 adults were released in the same area. The released animals originated mainly from Peter the Great Bay in the Sea of Japan, as well as off southwestern coast of Kamchatka in the Sea of Okhotsk. In 1977 to 1978, further 1 200 adults of red king crab originating from the Far East (no further details given) were released in the Murmansk area (Kuzmin & Olsen 1994). It was estimated to take from 10 to 15 years before a population would be fully acclimatized to the new area in the Barents Sea (Orlov & Karpevich 1965).
The first few crabs were captured in the Murmansk area in 1974, and in 1976 on the Norwegian side (Kuzmin et al. 1996). A ban on fishing red king crab in the entire Barents Sea was agreed upon during the 1976-1977 negotiations between Norway and the Soviet Union (Sundet & Hoel 2016). In 1992, the red king crab was numerous in Varangerfjorden and had become a pest to the local fishermen. By November the same year, the Joint Russian-Norwegian Fisheries Commission requested both countries to intensify and co-ordinate further investigations (Kuzmin et al. 1996). In 1994, a management decision was agreed upon with a male-only fishery, as well a minimum legal size (Sundet 2014). The red king crab has since increased in population size and expanded westward to Norwegian coastal areas, from the Russian border to Hammerfest in west (Hjelset 2012, Sundet & Hoel 2016).
The red king crab is among one of the largest arthropods of the world and the population in the Barents Sea is thus also a valuable commercial species for Russia and Norway. Norway started a small experimental fishery in 1994 with 37 tonnes, but as the crab expanded its population size and distribution range the quotas increased (Sundet 2014). A commercial fishery commenced in 2003 and the quotas was set to 840 tonnes. Currently, in the Russian Economic zone the fishery is quota regulated with about 9 000 to 10 000 tonnes annually. Norway has implemented a dual management system. East of 26°E the annual goal is 1 000-2 000 tonnes, and west of 26°E the fishery is free on all sizes aiming to reduce further spread of the red king crab.
Red king crab has a larval phase consisting of four zoeal and one post larval stage before metamorphosis to juvenile crab (Stevens 2014). The transitional stage is usually referred to as glaucothoe, like megalops in brachyuran crabs. With the increasing presence of an introduced species the questions of biological characteristics, as well as ecological impact have always been given attention. Sundet (2014) made an overview of the new population of red king crab in the Barents Sea with regards to several biological questions as e.g., growth, reproduction, diet and seasonal movement. Hjelset (2012) investigated life-history parameters of the females with special focus on temporal and spatial spreading in three Norwegian fjords. As well, Oug et al. (2011) documented effects on the benthic fauna due to presence of red king crab in the Varangerfjord, an area with very high densities.
The red king crab is monitored by the Institute of Marine Research (IMR) through two surveys conducted annually: one in early summer with pots in the free fishing area, west of 26°E, and one in autumn in the commercial fishery area. (Figure 1, Figure 3).
Figure 1. (left) Red king crab (Paralithodes camtschaticus). Photo: Erling Svensen. (right) Monitoring of red king crab in Norway, red area shows where monitoring is taking place.
2.2 - Snow crab (Chionoecetes opilio)
The snow crab (Figure 2) is a subarctic species native to North Pacific, Chukchi and Beaufort Seas in the arctic and in the Northwest Atlantic from Gulf of Maine to Labrador and in the St. Lawrence Gulf as well as on the east coast of Greenland (Slizkin 1982, Williams 1984). Thus, snow crab has not previously been described as naturally occurring in the Barents Sea. However, in 1996 five individuals (four adult males and one adult female) were captured as bycatch on various vessels from May to November (Kuzmin et al. 1999). Since the first findings in 1996, snow crab is now established as a self-sustaining population and further expanded its distribution range and population size in the Barents Sea (Kuzmin 2000, Alvsvåg et al. 2009, Agnalt et al. 2011). A small-scale fishery commenced in 2012 with 2.5 tonnes, but annual harvest has increased along with increasing population size and was 20 000 tonnes in 2021 (Norges Råfisklag https://www.rafisklaget.no/). Since 2017, only vessels from Norway and Russia are participating.
Snow crab is a stenothermic species found at bottom temperatures below 5°C, at depts from 50 to 400 m, often linked with muddy substrate (e.g. Dionne et al. 2003). Snow crab in the Barents Sea are found at depths and temperatures like e.g. in Northwest Atlantic and North Pacific (Alvsvåg et al. 2009). Juvenile snow crabs are more stenothermic, i.e. less tolerant to slightly colder and slightly warmer temperatures than adult crabs (Alsvåg et al. 2009, Dionne et al. 2003). The larval phase consists of three stages, zoea I, zoea II and megalope, lasting from three to four months depending on temperature (Ouellet & Sainte-Marie 2018). It is unclear how the snow crab entered the Barents Sea ecosystem. Kuzmin et al. (1999) introduced the theory of ballast water as a pathway, through tankers coming from the northwest Atlantic. Crab species like e.g. snow crab that have a long pelagic larval phase can survive intercontinental voyages in ballast water. One such example of accidental introduction is the green crab Carcinus maenas (e.g. Darling et al. 2008). The ballast water hypothesis implies an introduction of relatively few individuals possibly creating a genetic founder effect or bottleneck. There is no genetic evidence of such concerning the snow crab in the Barents Sea (Dahle et al. submitted). Trans-arctic interchange has also been suggested as a possible pathway (Agnalt et al. 2011). A third theory is natural expansion by individuals moving from established populations along the north coastline of North Russia/Siberian coast (Dahle et al. submitted).
The population of snow crab in the Barents Sea is monitored by IMR through a joint Norwegian Russian Ecosystem survey, taking place during both winters i.e., January/February and summers i.e., August/September (Figure 3). In addition, a dedicated snow crab survey has taken place since 2018, run during June (Hjelset, pers. comm.). IMR has currently one internal funded project monitoring the snow crab in the Barents Sea that covers the cost of the pot survey (Figure 2). In addition, the project Snowman (project no. 14862; 2018-2021) was initiated to answer several questions relating to the biology of a new species which may differ in the non-native area compared to regions where the species has been established for longer periods (e.g., Brockerhoff & McLay 2011). In SnowMan, focus was set on genetics to elucidate the donor population of the snow crab in the Barents Sea (Dahle et al. submitted), biological characteristics as fecundity (Danielsen et al. 2019), size at maturity, various disease/ectoparasites aspects as e.g. the bitter crab disease being common in other snow crab populations (Nunkoo et al. submitted), detection of larvae in western part of the Barents Sea (Hjelset et al. 2021) and if this can contribute to explain further spreading in the western direction (Huserbråten et al. in prep). Further, what does snow crab consume in the Norwegian zone (Sundet et al. in prep) and what is the impact of a large snow crab population on the benthic production (Holte et al. in prep), as well as impact on the ecosystem level (Hansen et al. in prep). The Northeast Atlantic cod do prey on snow crab (Holt et al. 2021) and can prey-predator be used as a stock assessment index.
As snow crab is a high-prized product, the established population in the Barents Sea has been expected to accommodate a significant fishery. Snow crab was in 2015 defined as a sedentary species i.e. Russian and Norwegian property on their respective portions of the continental shelf. These rights extend beyond the 200 nautical miles of both the Russian and the Norwegian EEZ. This has been disputed and consequently the fishing right has been a political issue for several years (e.g., Hansen 2016, Østhagen & Raspotnik 2018, Kaiser et al. 2018).
Figure 2. (left) Snow crab (Chionoecetes opilio). Photo: Ann Merete Hjelset. (right) Monitoring of snow crab in Norway, red area shows where monitoring is taking place.
Figure 3. (left) Pot-fishing of snow crab. Photo: Ann-Merete Hjelseth. (right) Monitoring area of snow crab trough the Ecosystem Survey Monitoring Program 2004-2021. Red area indicates area which is investigated.
2.3 - American lobster (Homarus americanus)
American lobster (Figure 4) is native to the North-Eastern Atlantic, from Cape Hatteras (USA) in south to Newfoundland (Canada) in north. It is a coastal species, captured mainly by pots. The fishery has increased from 36 851 tonnes in 1980 to 161 011 tonnes in 2019 (FAO Statistics). Consequently, export has also increased accordingly. In 2015, approximately 75 500 tonnes of H. americanus was exported from Canada and USA (FAO Statistics). Barrett et al. (2020) reports that in 2015 UK imported 1 700 tonnes live specimens. Europe has traditionally been the important market, but the last decade China and other Asian countries have increased in importance. Import of live animals poses a risk when accidentally or intentionally released into the environment in the area/location/country of import. The American lobster is geographically separate from the European lobster by the deep Atlantic Ocean.
Import of live specimens has led to escaped individuals and intentional release into the European marine environment. Findings of live American lobster have been confirmed in various European countries like Denmark, Sweden, UK, Ireland, Croatia i.e., the Adriatic Sea and Norway (Jørstad et al. 2011, Stebbing et al. 2012, Øresland et al. 2017, Barrett et al. 2020, Pavičić et al. 2020). In UK, a total of 162 individuals have been identified based on morphological characteristics such as spine below the rostrum and colouration, over the period from 2012 to 2018 (Barrett et al. 2020). In UK, the majority can be traced back to an event of which 361 American lobsters were released in the English Channel 15th June 2015, as part of a Buddhist ritual (Barrett et al. 2020). Also, 35 non-native Dungeness crab (Metacarcinus magister) were released in the same event. In Norway, a total of 35 specimens have been identified genetically as American lobster over the period from 2000 to 2017 (Agnalt pers. comm.). Crossbreeding with local native European lobster have been found in five American females in Norway, two in Sweden and one in UK (Agnalt pers. comm., Barrett et al. 2020).
Figure 4. American lobster (Homarus americanus) with hybrid eggs. Photo: Beate Hoddevik.
In 2016, it became illegal to import live American lobster to Norway. The same year the Government of Sweden proposed an EU-wide ban on importing live American lobster. Hybridization with the native European lobsters were raised as concerns and possible negative impacts on other native species such as edible crabs (Cancer pagurus). In addition, possible hitchhikers or biofouling on the American lobsters included several other non-native species (nematodes, copepods, barnacles and polychaetes). However, EU did not approve the suggestion of the Swedish government.
In Norway, there are no current monitoring program for American lobster. Detection is solely based on observant fishermen (recreational and commercial).
2.4 - Pacific oyster (Crassostrea gigas)
The Pacific oyster, Crassostrea gigas (Figure 5), was introduced to Scandinavia and farmed at several sites in the 1980’s and early 1990’s. Despite the farming activities, feral populations did not establish. A bio-invasion of Pacific oyster however commenced in Scandinavia in 2007 (Wrange et al. 2010), and the oyster is now established along most of the Scandinavian coastline, approximately north to Bergen, Norway. Genetic studies (Faust et al. 2017), combined with the pattern of spreading (Wrange et al. 2010), suggest that most of the oysters spreading in Scandinavia have the same origin, and spread northwards in a “stepping stone pattern”. The Scandinavian populations may already have adapted to local conditions (Sussarellu et al. 2015), and reproduction in new areas may be facilitated by warm summers. Larvae are spread with the water currents and settle on suitable substrates.
The bio-invasion has been followed since 2007 and the colonized habitats have been assessed (Mortensen et al. 2017). Reise et al. (2006) described the invasion in four phases. The invasive species arrive to the new habitat (Phase 1) and start to establish a population at low density without changing the habitat (Phase 2). As the population starts to expand it increases in density and may change the habitat (Phase 3). Once established in the habitat other species as predators, competitors and diseases/parasites will reduce the density in an adjustment phase (Phase 4), potentially reducing, or at least altering, the effects of the non-native species on the ecosystem.
In most of its range in Scandinavia, populations have gone through several bottlenecks, like mortalities during cold winters (Strand et al. 2012) and summer mortalities after hot summers (Mortensen et al. 2016). This may correspond to Phase 4. In the outer edges of its range; along the Norwegian west coast, it may still be in Phase 1.
In accordance with the proceeding of the invasion process into phases 3 and 4, we have moved from mapping and studies of the mechanisms of the invasion, to the establishment of a monitoring based on a common Scandinavian model. Along the western coast of Norway, the Pacific oyster has not yet established in all available habitats and is considered in Phase 1 and 2. A mapping is now performed to clarify the process of spreading from Rogaland and northwards. Data from the mapping will be prepared for publication and presented in 2022 (Figure 5).
The Scandinavian studies on the establishment, spreading and mitigation of Pacific oysters has, since the bio-invasion commenced in 2007, been organized as a collaborative network project, including scientists and managers from Norway, Sweden and Denmark (see Mortensen et al. 2019).
To help with the distribution mapping, the Institute of Marine Research (IMR) has invited the public to submit information, photos, coordinates etc, on occurrences of Pacific oysters. A video showing the differences between flat oysters and Pacific oysters and typical characteristics has also been published to aid the identification. Information from the public has been evaluated by experts and all credible data included in distribution maps (publication in prep). The Scandinavian network has been funded by The Nordic Council of Ministers in three periods since 2011, ending in 2021. Participants from each country have been funded through national projects linked up in the network.
Figure 5. Pacific oyster (Crassostrea gigas). Photo: Vivian Husa. (right) Monitoring of pacific oysters in Norway, red area shows where monitoring is taking place.
2.5 - Pink salmon (Oncorhynchus gorbuscha)
The anadromous pink salmon (Figure 6) is native to the Northern Pacific. It has been released repeatedly in Russia, and in recent years it has occurred in high densities in Norway. Surveillance of the distribution and abundance of invasive pink salmon in Norway started in 2017 (Berntsen et al. 2020). Surveillance of pink salmon is mainly conducted through registration of catches in sportfishing or targeted removal fishing in rivers and catches in bag- or bend-nets in the sea (along the coast) by fishermen. In addition, occurrence and abundance of pink salmon is registered by drift counting surveys, camera surveillance and by environmental DNA (eDNA) surveys in selected rivers (Figure 6). Pink salmon occur in high densities particularly in Northern Norway (Figure 7). The surveillance activity is organized by local organisations and commercial companies in association with the County governor. Catches of pink salmon at sea are also registered through surveys by the Institute of Marine Research.
Figure 6. (left) Pink salmon. Photo: Christine Fagerbakke. (right) Monitoring of pink salmon in Norway, red area shows where monitoring is taking place.
Figure 7. Map showing the total number of registered pink salmon, Oncorhynchus gorbuscha, in Norwegian rivers in 2017 and 2019. Fish registered are either caught or observed, by several methods. Rivers included are from the NVE database, while some small rivers are not included (from Berntsen et al. 2020).
The Norwegian Institute for Nature Research (NINA) works as an advisor for the Norwegian environment agency regarding monitoring (registration of catches) and biological sampling of pink salmon. NINA also gathers all available data on pink salmon in a common database and report analyses of these data in NINA-reports, which are available at https://www.nina.no/pukkellaks. NINA was also the national coordinator for a cross-Atlantic citizen science project using eDNA for detection of pink salmon in rivers in 2019 (www.1000rivers.net).
2.6 - Round goby (Neogobius melanostomus)
The round goby (Figure 8) is an invasive fish from the Ponto-Caspian region, which is spread widely in both Eurasia and North America (Kornis et al. 2012, Forsgren & Florin 2018). It is a door knocker species for Norway associated with severe impact (Norwegian Biodiversity Information Centre 2018). There is currently no existing monitoring program for early detection of the round goby. There are, however, a couple of ongoing projects focusing on the species. NINA is currently analysing eDNA samples collected from Trondheim harbour and the Oslofjord area in 2021, with samples from Halden, Hvaler, Fredrikstad, Oslo harbour, Drammen and Sandefjord. The Institute for Marine Researchin cooperation with NORCE is supervising a MSc-project in 2021 that is investigating possible occurrence of the species with eDNA, fishing by hook and minnow traps from Gothenburg in Sweden into the Oslofjord. So far, the species has not been detected in Norway (Figure 8).
Figure 8. (left) Round goby caught by hook in Gøteborg. Photo: Vivian Husa. (right) Target areas (red) of ongoing projects investigating possible introduction of round goby in Norway.
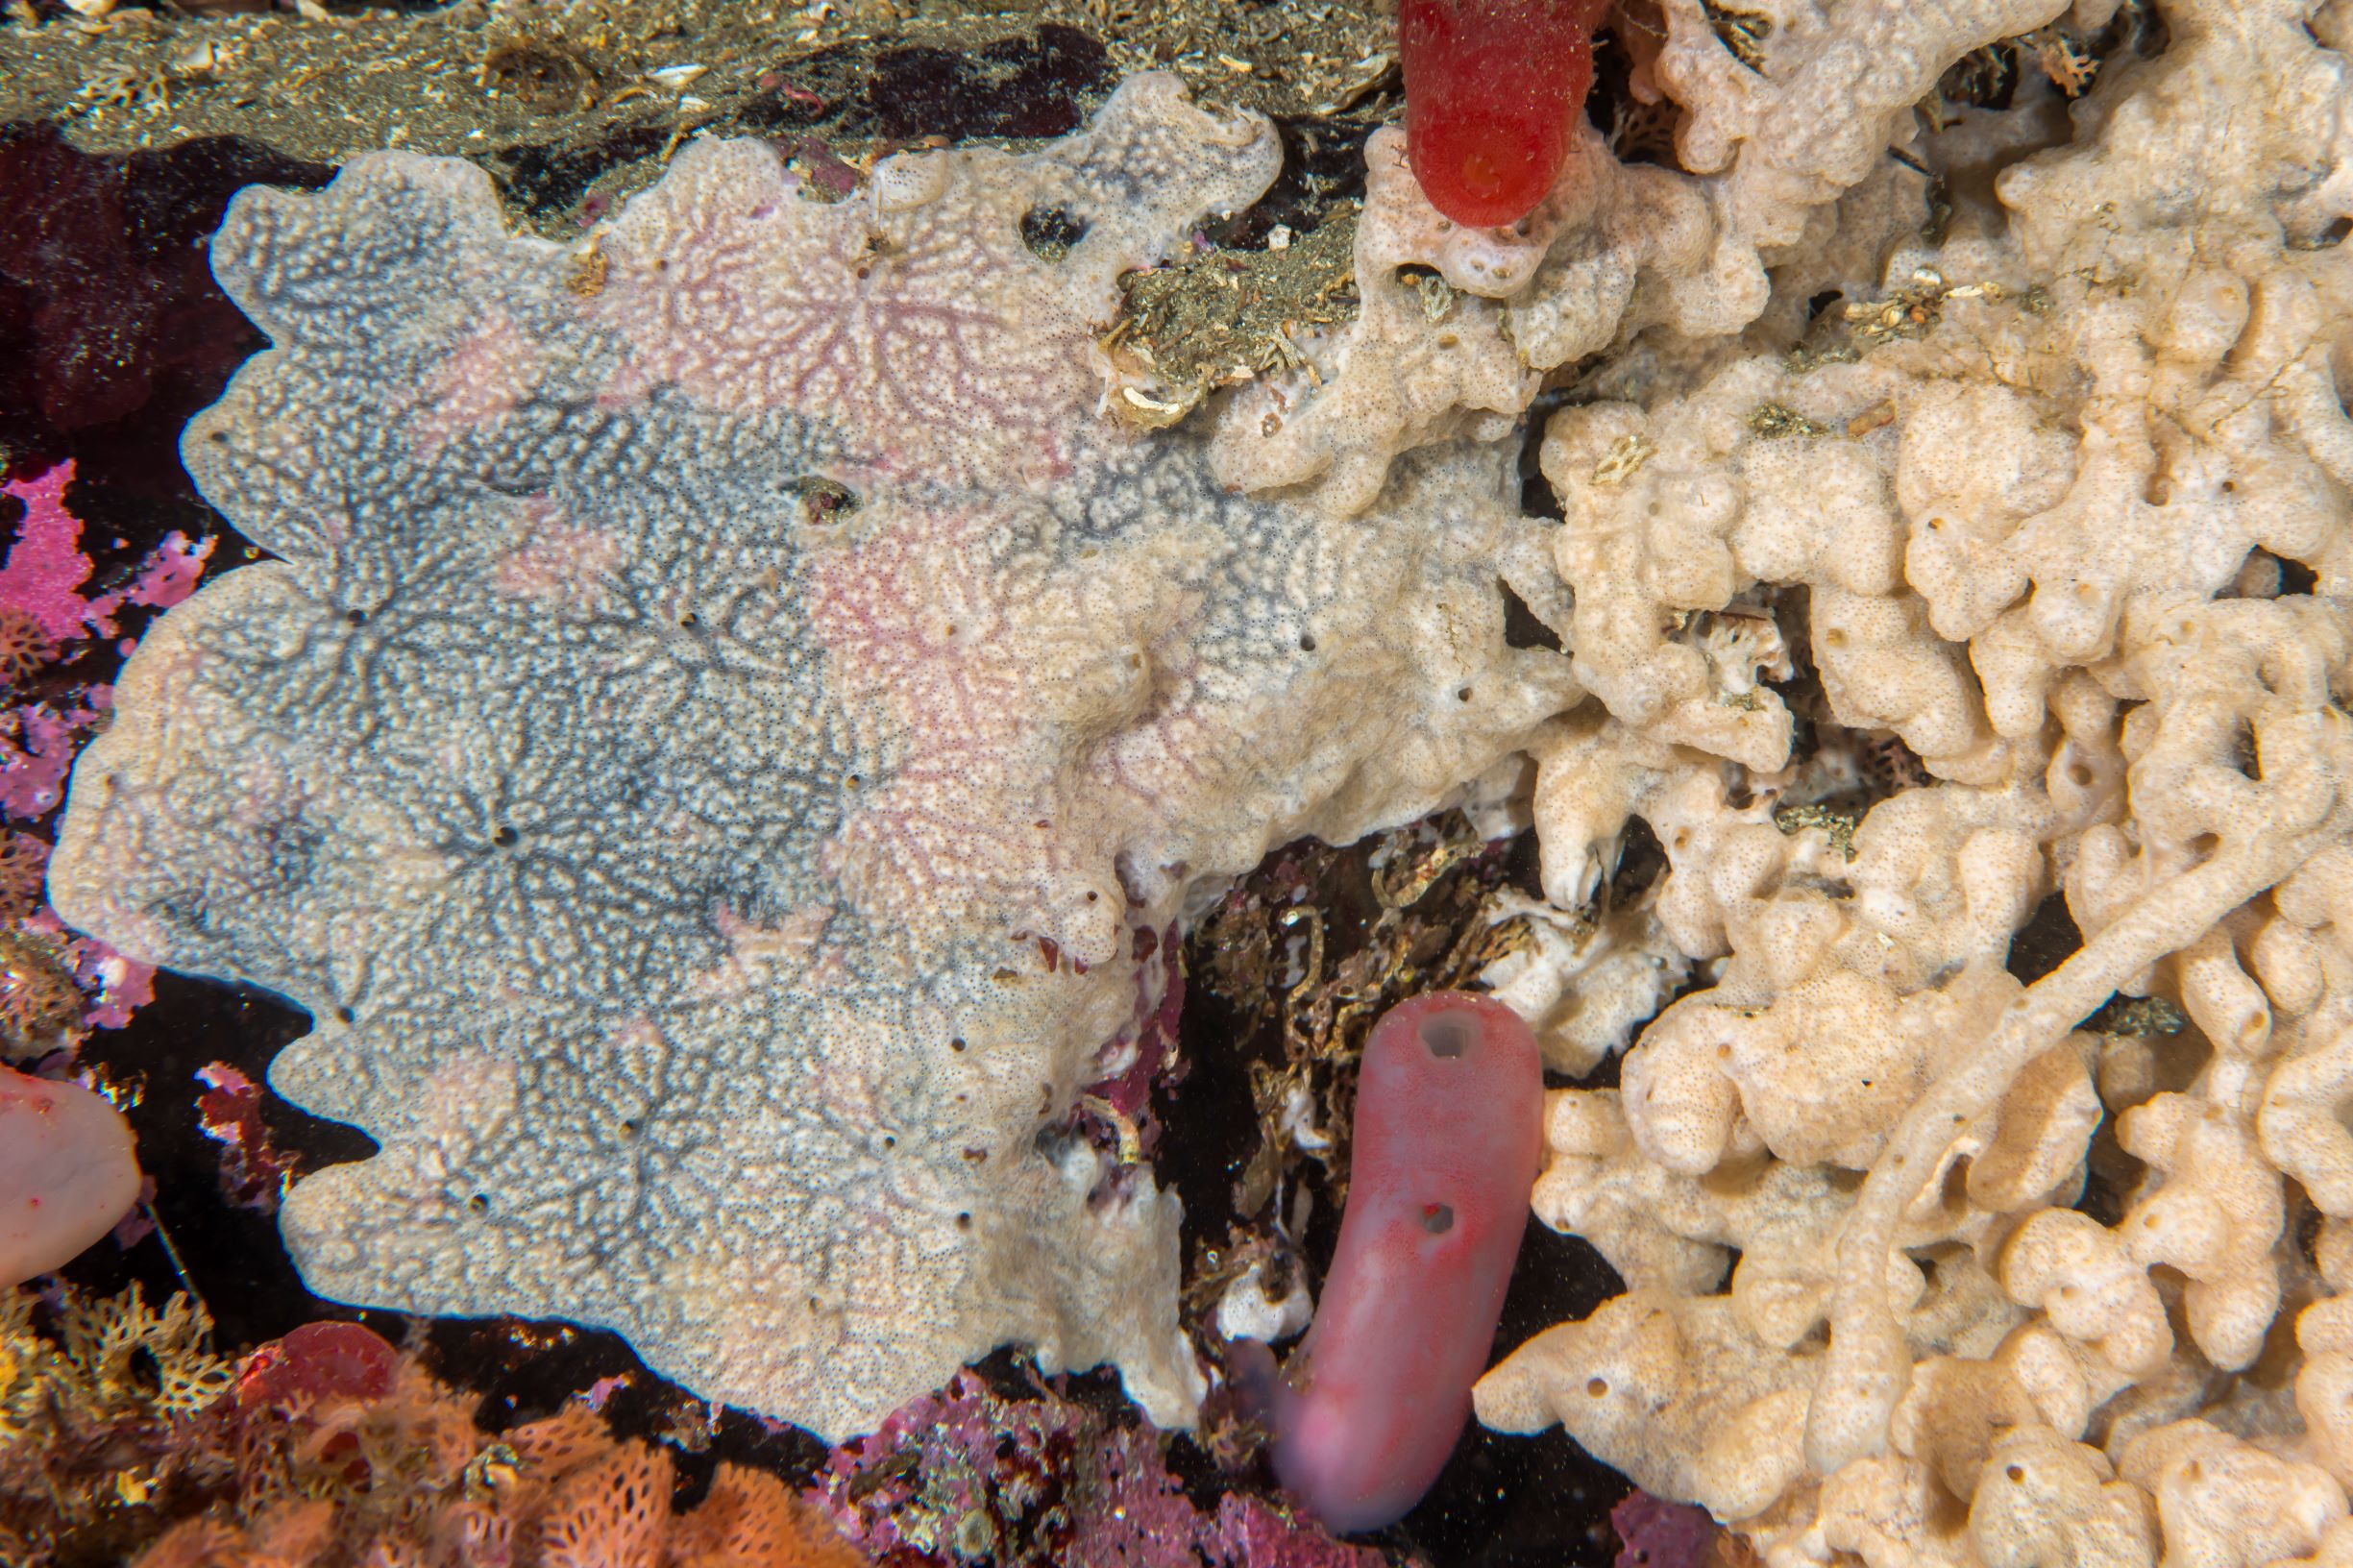
2.7 - Didemnum vexillum
The invasive colonial ascidian Didemnum vexillum (Figure 9) was recorded near Stavanger for the first time in Norwegian waters in November 2020. The species is one of the world’s worst alien species as it grows quickly, cover and hampers marine habitats from 0-65 meters depth (McKenzie et al. 2017 and references therein) It is also expected that it will have economic impact as it grows willingly on oyster and mussel cultures, kelp and finfish farms. Moreover, it can cause the shipping industry considerable cost for cleaning of vessels going out from infected areas. The species have temperature tolerance limits between -2 and 24 C°, (McKenzie et al. 2017 and references therein) which means it has the potential to establish along the entire coastline of Norway.
A monitoring project of the growth potential of D. vexillum colonies during the year was set up in 2020 in the Stavanger area in corporation with Stavanger diving club, the Museum of Stavanger, and Stavanger Municipality. Preliminary results from this project show that the colonies were shrinking a bit in March-April when the water temperatures were below 4 C°, but a remarkable growth of colonies continued during the summer/autumn season 2021.
The species grows best in salinities above 25 psu and dies under 20 psu (McKenzie et al. 2017 and references therein), and its distribution will likely be restricted in inner parts of Norwegian fjords with low salinity. During August 2021 a survey of 70 stations in Rogaland was performed by diving, video recordings and investigations of structures in ports and marinas. The survey showed that the species was very abundant in Engøysundet (Stavanger) where it was first recorded. The species covered up to 50 % of the seafloor with highest abundance close to a moored pram, where probably a vessel with D. vexillum on the hull has been situated and dripped to the seafloor (Figure 10). 50-60 stations in Rogaland were investigated in this survey, with no more records of D. vexillum.
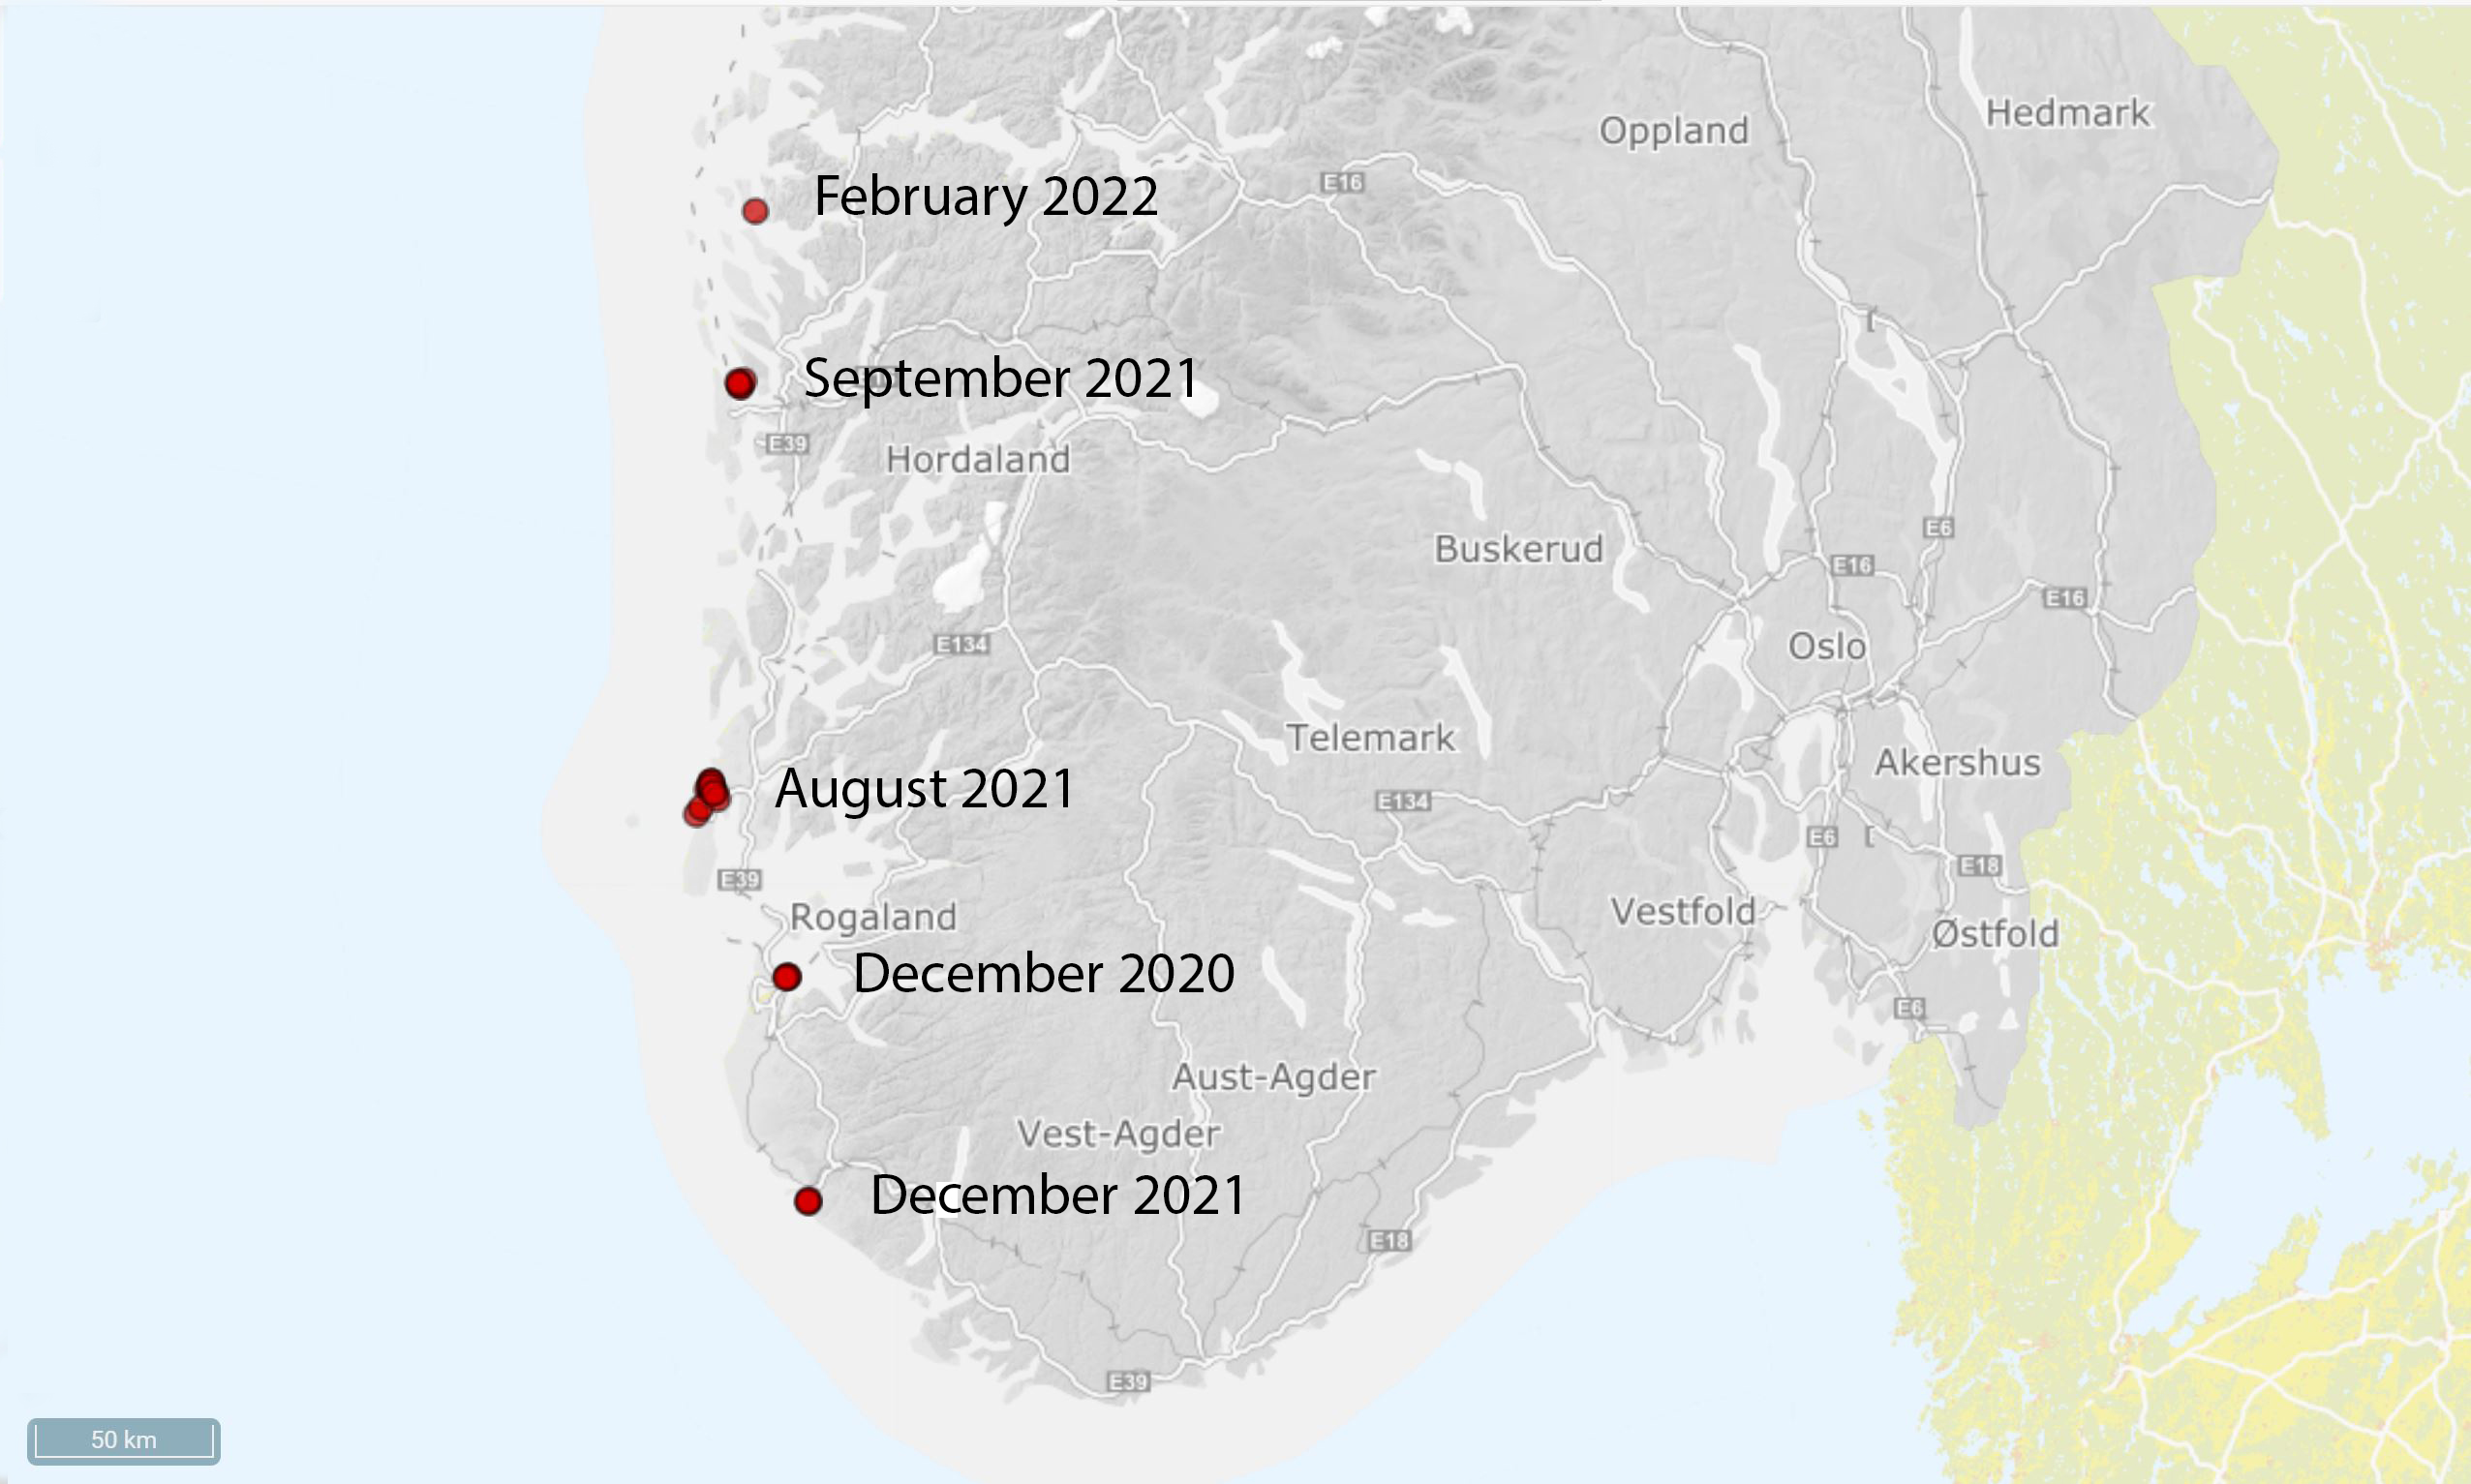
In September 2021 we received reports from divers in Haugesund (60 km further north in Rogaland County) with new records of the species. In this area the species is more widespread, with a dense cover in Karmsundet and around Vibrandsøy (Figure 10). Data from the Haugesund area is obtained from trained divers from Sletta Dykkeklubb. Later in September, the species was discovered from an oil rig in a commercial port at Askøy north of Bergen (Vestland county) (Figure 10). D. vexillum was growing on the seafloor at the port and has spread to three more locations outside the port. A survey in Bergen harbour in October yielded no records of D. vexillum. In December 2021 a diver reported several colonies (Erling Svensen pers. comm.) at three sites in Egersund approximately 80 km south of Stavanger. This makes it clear that the species is spreading fast between busy port cities.
These surveys were performed as a part of an internal IMR project funded by the Ministry of Trade, Industry and Fisheries. A monitoring project was initiated by the Norwegian Environment Agency in November 2021 to use e-DNA for mapping of D. vexillum in ports from Stavanger to Bergen. This mapping is performed by NINA in corporation with IMR. The results from the e-DNA mapping showed strong signals at all sites where D. vexillum has previously been recorded and some sites nearby, where the species occurrence also was confirmed recently by visual investigations. There were no e-DNA signals between Bergen and Haugesund, but a strong signal at several sites in Gulen municipality north of Bergen. D. vexillum was recorded at one of these sites, a lay-up place for oil rigs, in February 2022. The study also showed some uncertain or unclear e-DNA signal at several sites, which will be checked up by visual surveys forthcoming (Fossøy et al. 2022, unpublished data IMR).
Figure 10. Distribution of Didemnum vexillum in Norway and year of first record in specific area (Maps from the Norwegian Biodiversity Center).
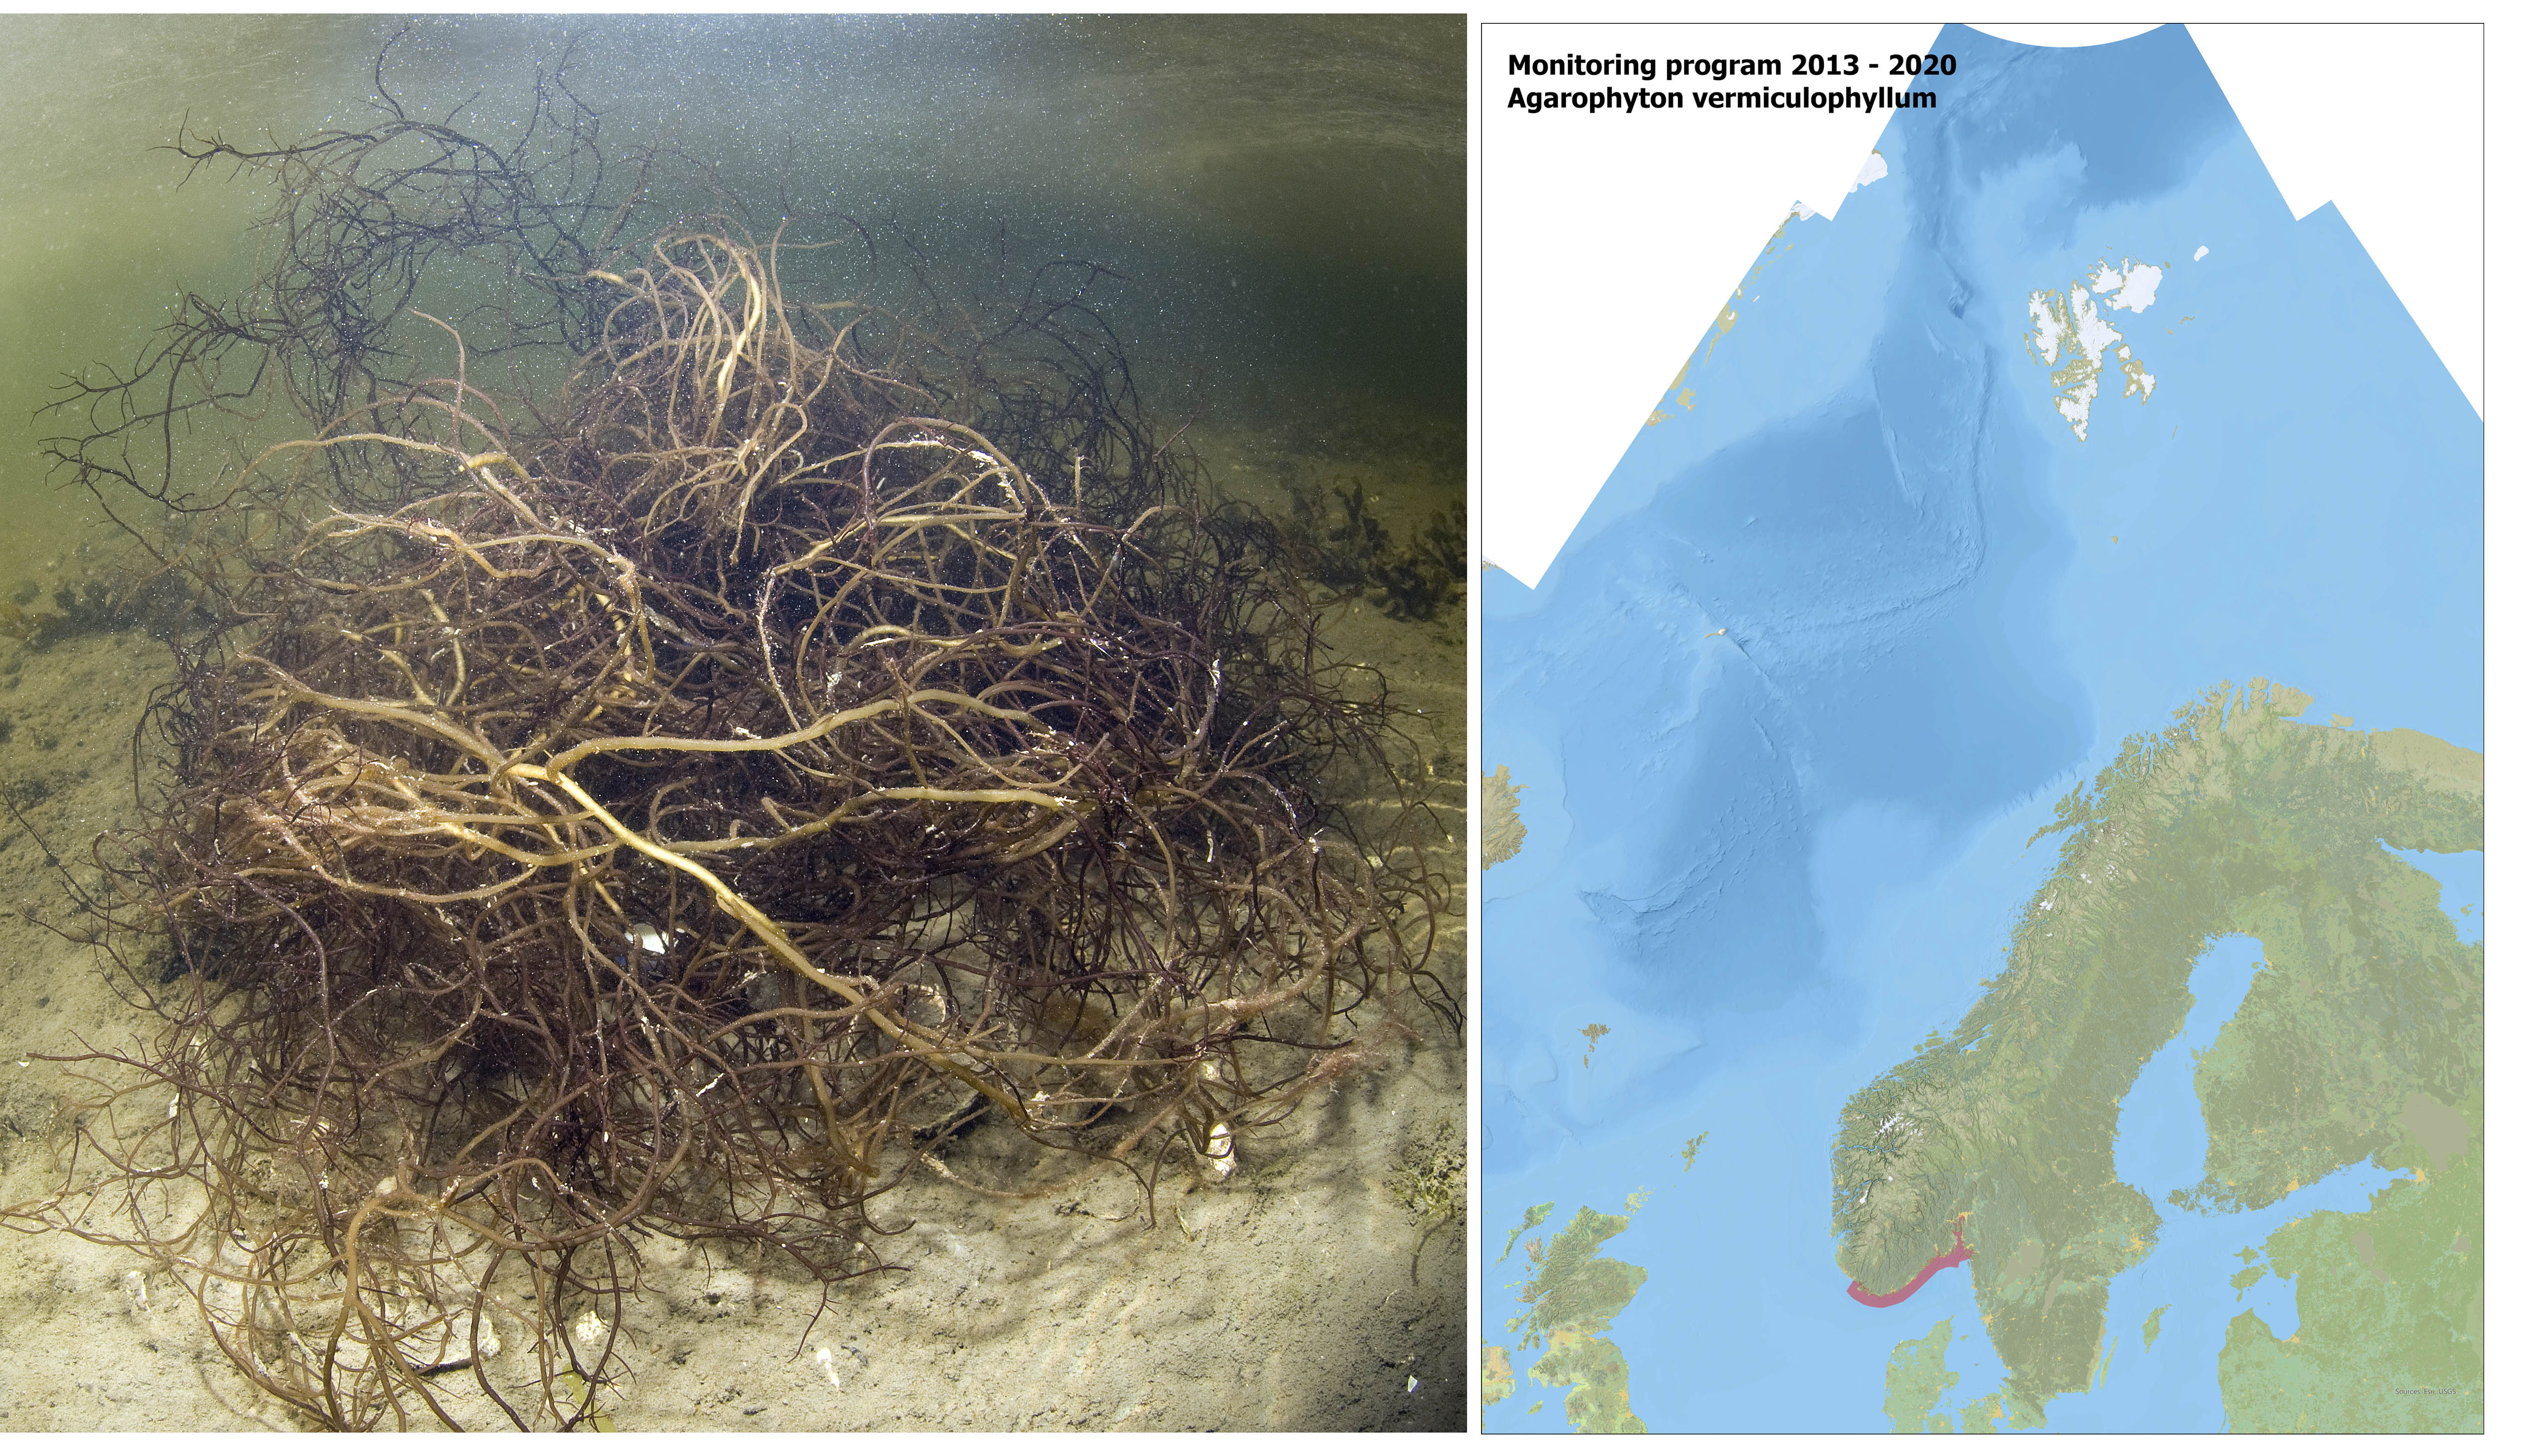
2.8 - Agarophyton vermiculophyllum
The red algae Agarophyton vermiculophyllum (Figure 11) was recorded for the first time at the Norwegian coast near Tønsberg (Vestfold & Telemark County) in 2012. As this species has become very abundant in several countries, an annual mapping program in inner and outer Oslofjord was performed in the period 2013 to 2019 (Figure 11). The mapping has been limited, and only a part of the coastline has been examined each year, but some stations have been investigated several times. As A. vermiculophyllum thrive best in wave protected, shallow and muddy habitats, the mapping have been restricted to such areas. Abundance of the species has been done with observations (beach survey) and collection of material with a grapnel. The abundance of A. vermiculophyllum in seagrass meadows (Zostera marina) was studied in three areas in Oslofjord in 2020 and showed only low abundance in this habitat in Viksfjorden, Tjøme and inner Oslofjord (Sundal-Joys 2021).
Figure 11. (left) Agarophyton vermiculophullym. Photo: Rudolf Svensen. (right) Monitoring of A. vermiculophyllum in Norway, red area shows where monitoring is taking place.
2.8.1 - Zooplankton
Zooplankton are animals that live all or part of their life drifting in the water column. Zooplankton includes a wide range of animals, such as copepods, cladoceran, jellyfish and the larvae of benthic invertebrates. Ballast water is one of the primary transport vectors for the transfer and introduction of non-indigenous zooplankton, while ocean currents play an important role for the secondary spreading.
The institute of Marine Research operates several zooplankton monitoring programs in all Norwegian seas, including open ocean as well as coastal waters. The IMR zooplankton monitoring focuses on meso-zooplankton (size 180 µm-20 mm) and the sampling methods are usually targeting crustacean plankton. Although the monitoring aims to include all taxa, there is no dedicated monitoring program specifically addressing alien zooplankton species. Information on occurrences of alien zooplankton in Norwegian waters are derived from various sources, often as qualitative data. A few examples of non-indigenous marine zooplankton species in Norway are mentioned below.
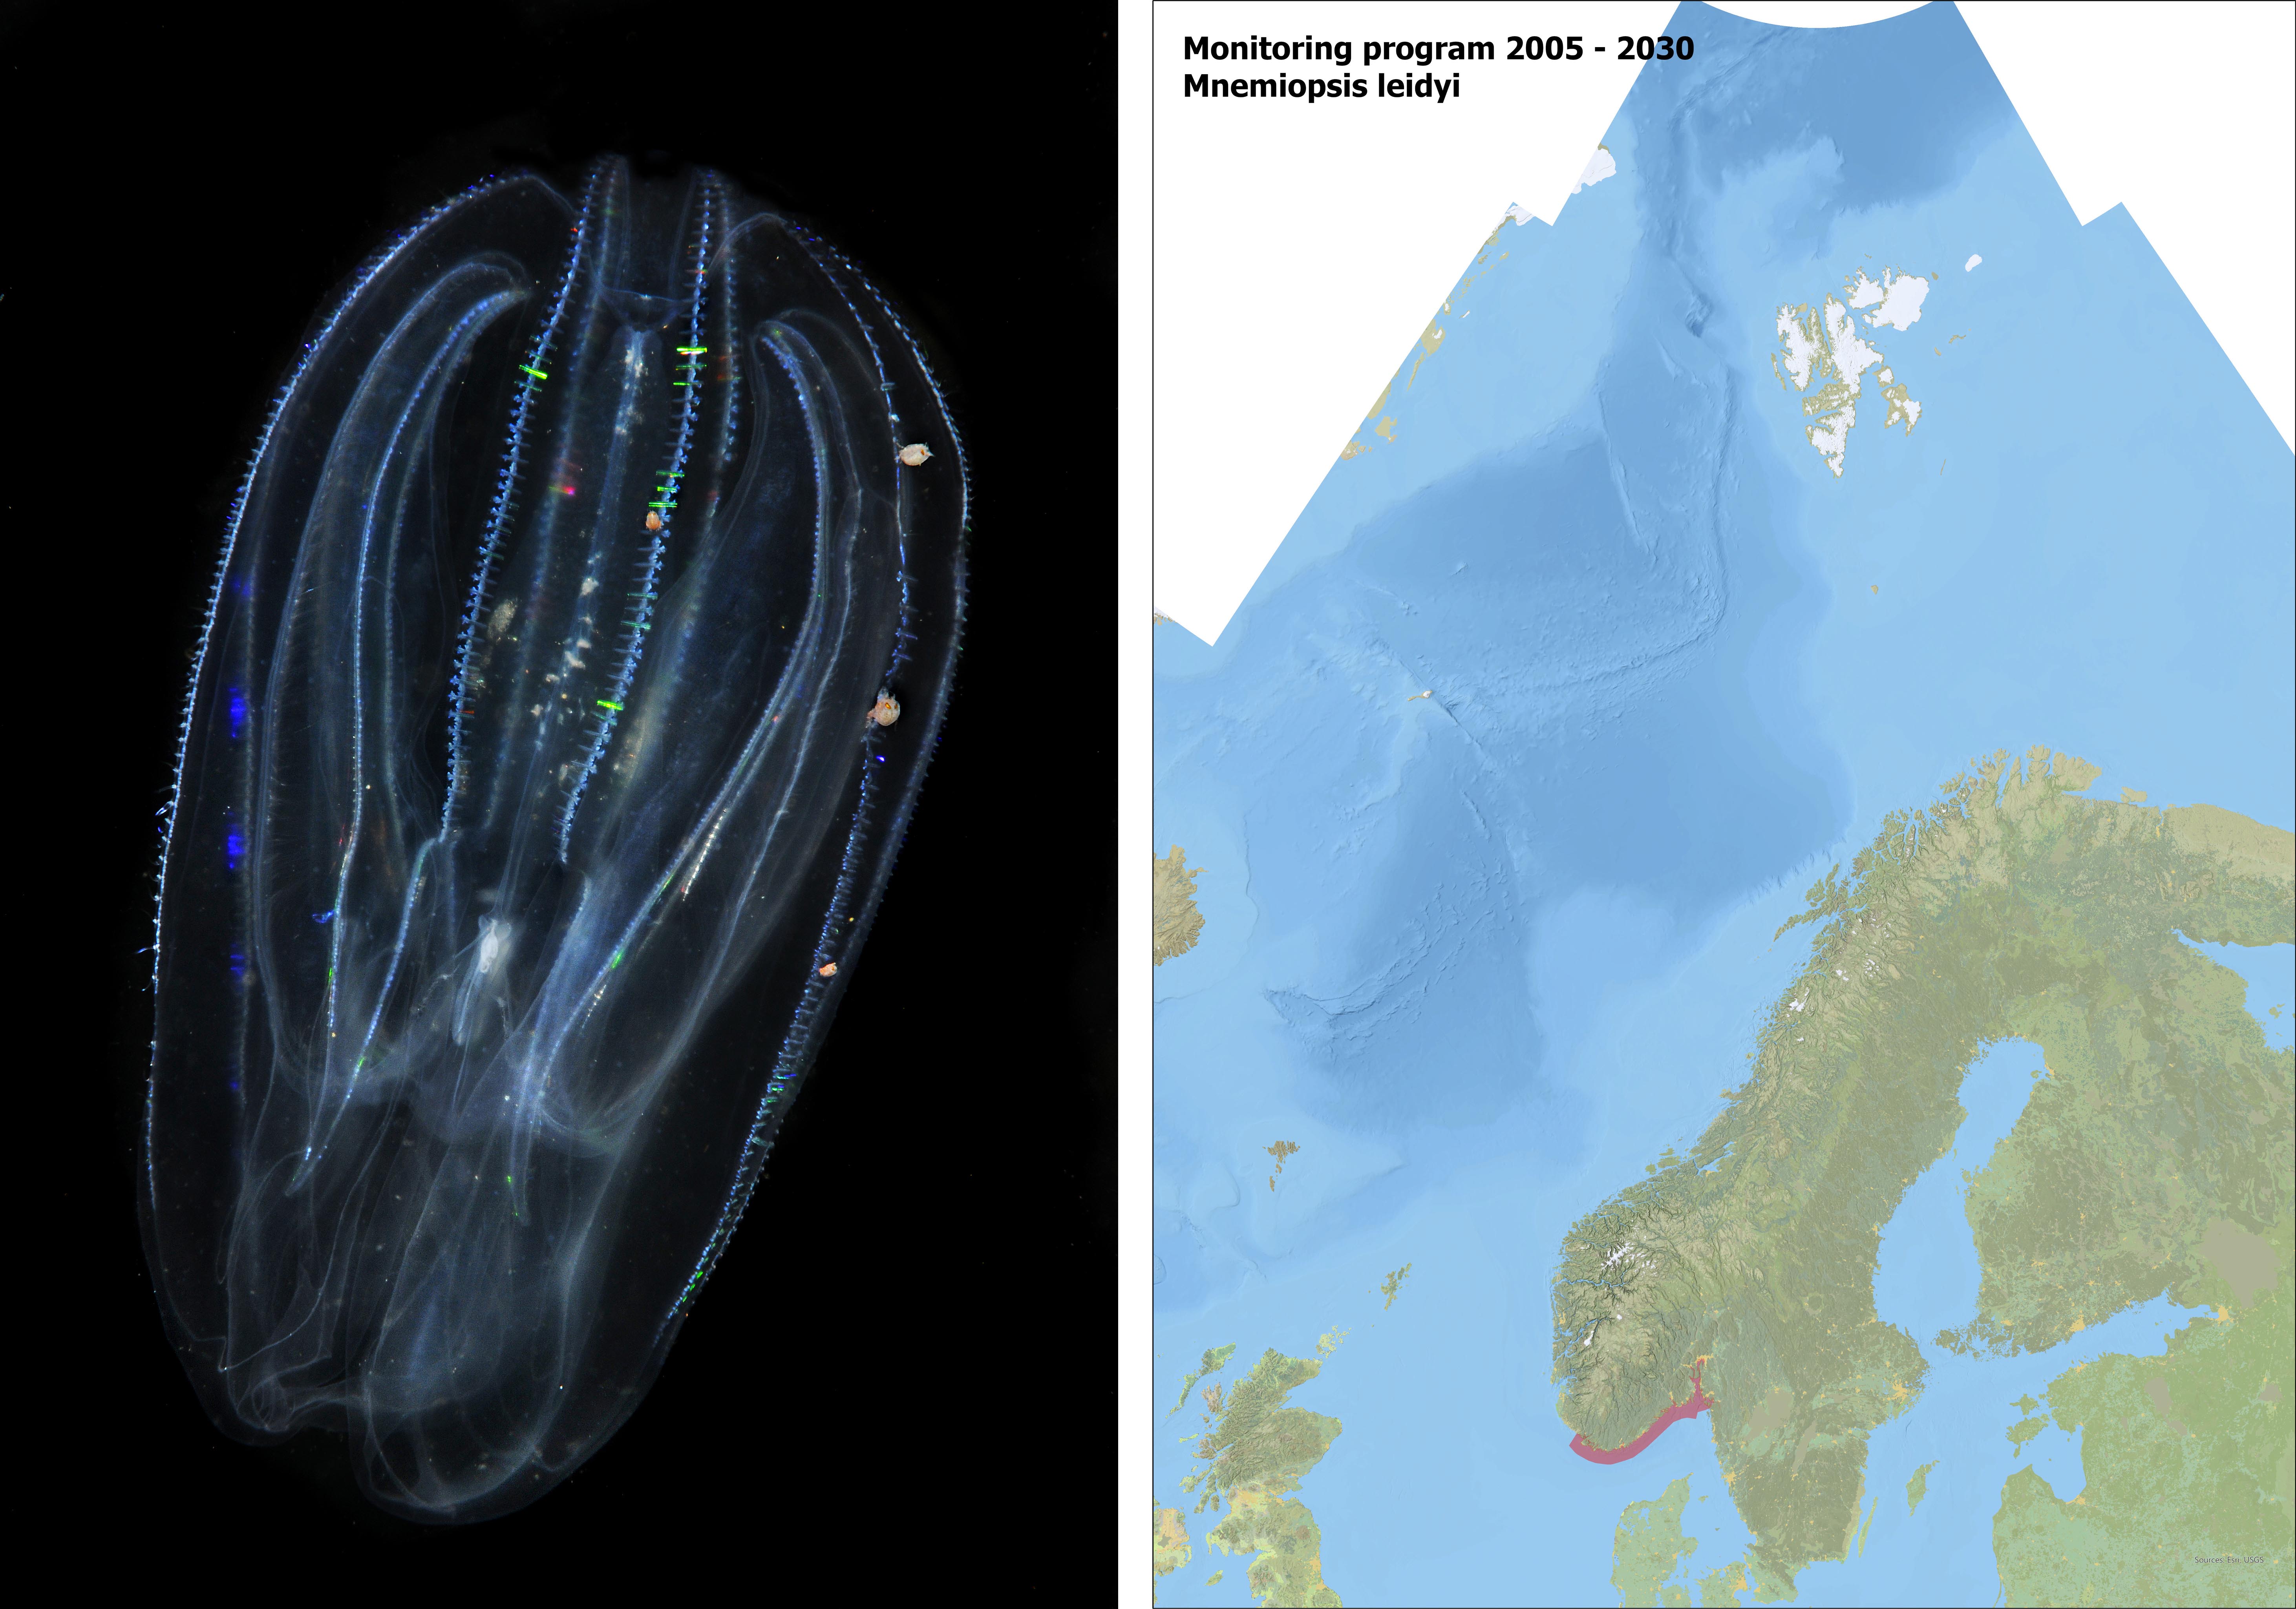
2.8.2 - Mnemiopsis leidyi
Mnemiopsis leidyi is a lobate ctenophore (comb jelly) native to the east coast of North and South America (Figure 12). The species was introduced with ballast water to Europe (the Black Sea) in the early 80’s. The first observation of M. leidyi in Norwegian waters was made in Oslofjord, November 2005 (Olivera 2007). During 2005 – 2007 the species was recorded in several areas of northern Europe, including southern North Sea, Kattegat, and the Baltic (Javidpour et al. 2006, Hansson 2006, Boersma et al. 2007). The introduction to Northern Europe in the 2000’s probably occurred as an independent introduction, directly originating from the northeast coast of the USA, probably with ballast water (Costello et al. 2012).
Since 2005, the species has occurred in high densities in Norwegian coastal waters during August-December, from Oslofjord to Trondheimsfjorden. The exception is the years 2011-2013 when M. leidyi was absent, probably due to low winter temperatures. Binndalsfjorden (approx. 65.2° N) is the northernmost observation made so far by M. leidyi on a global basis.
M. leidyi is a hermaphrodite (bisexual) with high reproductive capacity and the ability to self-fertilization. M. leidyi is highly adaptable and tolerates a wide range of temperatures and salinities. The species may occur in temperatures from -0.7 to 35 °C and in salinities between 3.4-70 ppt (Hansson 2006, Costello et al. 2012). Furthermore, the species survives food shortages for as long as three weeks or more. These traits enable M. leidyi to survive long transport in ballast water, and quickly colonize new areas.
M. leidyi is a carnivore with a broad food spectrum, including small zooplankton, copepods, fish eggs and larvae (Næss 2015). The species have a high predation rate and is able to eat up to ten times its body weight in food per day. In areas with dense populations of this ctenophore, it may locally have strong effect on zooplankton populations which can and affect several trophic levels (cascade effect, Granhag et al. 2011, Tiselius and Møller 2017).
M. leidyi spends the entire life cycle in the free, marine water masses (holoplanktonic) and spreads rapidly with ocean currents. The coastal current is an important dispersal route for the species, and its distribution in Norwegian waters is linked to coastal areas and within fjords. The temperatures and salinities along the entire Norwegian coast are within the species' tolerance level (Hosia & Falkenhaug 2015), and the species has the potential to overwinter by seeking deeper (and warmer) water layers throughout the winter. It is expected that the species will colonize areas further north along the coast, due to future higher temperatures. Reproductive stages of M. leidyi have been observed in coastal waters in August-September. However, M. leidyi has so far not been recorded in Norwegian waters during the winter. This indicates that the occurrence in Norwegian sea areas is driven by so-called «Source-sink dynamics», where the population is maintained by the annual supply of individuals from overwintering areas in southern North Sea (Jaspers et al. 2006, Costello et al. 2012, Hosia and Falkenhaug 2015).
There is no coordinated monitoring program, targeting the distribution and spreading of M. leidyi in Norway. Gelatinous plankton is recorded as by-catch in the standard zooplankton monitoring carried out by the Institute of Marine Research. However, the methods used (plankton nets) is targeting crustacean plankton and will not give reliable data on delicate gelatinous plankton. Nevertheless, records of M. leidyi from plankton nets and the beach seine programme (Skagerrak), have provided qualitative information on distributions as well as seasonal and interannual variations of this species (Figure 12).
Figure 12. (left) Mnemiopsis leidyi. Photo: Erling Svensen. (right) Mapping area (red) of distribution of M. leidyi in Norway.
Observations made by the public are an important supplement to the information on distributions and blooms of M. leidyi in coastal waters. Information on the species, and how to distinguish M. leidyi from the native Bolinopsis infundibulum is posted on the IMR website. The IMR receives numerous observations of M. leidyi from the public each year by email. Since 2019 a new platform for Citizen Science has been used (https://dugnadforhavet.no/) with a separate section on gelatinous plankton. This application has provided georeferenced records of the species, particularly during bloom events. In 2021 more than 50 observations of M. leidyi were received from the public via “Dugnad for Havet” (Figure 13).
The research project “Distribution and ecosystem impacts of the invasive ctenophore Mnemiopsis leidyi in Norwegian waters” was funded by the Norwegian Research Council 2009-2013.
Figure 13. Observations obtained from the Citizen science application “Dugnad for havet” in 2021. a) Mnemiopsis leidyi, b) Gonionemus vertens.
2.8.3 - Gonionemus vertens
Gonionemus vertens is a small hydromedusa (20-25 mm in diameter), native to the northwest Pacific Ocean (Figure 14). The species is often associated with eelgrass beds and macro algae in sheltered, coastal areas. The medusae is "semi-planktonic" and attaches to eelgrass and seaweed during the day using specialized "adhesive plates" on the tentacles. G. vertens was observed in the North Sea in 1913 and then spread throughout the North Sea area until the middle of the 20th century. The first observation of G. vertens in Norway is from 1921, at Drøbak in the Oslofjord (Kramp 1922). Later, two individuals were found in Hardangerfjorden in 1958 (Tambs-Lyche 1964) and Trondheimsfjorden 1969 (Gulliksen 1971). The northernmost observation was made in 2020, at Andenes (approx. 69.3° N). Since 2016 the number observations of G. vertens have increased, especially in southwestern Norway (Rogaland-Agder), indicating a possible new introduction to Europe. There have also been several reports on severe stings to humans in Norway. Regional variations in burning effect (toxicity) indicate that there may be several genetic lineages of the species. The recent records of G. vertens in both Sweden and Norway probably belong to a more toxic phenotype, compared to the former (historical) records of the species (Govindarajan et al. 2019). There is great uncertainty about how G. vertens spreads to new areas. The species is probably transported on ships' hulls at the polyp stage and by ballast water and currents (medusae stage and eggs). It is also believed that polyps of the species were introduced to Europe in connection with the import of oysters from Japan and the United States.
There is no coordinated monitoring program, targeting the distribution and spreading of G. vertens. The preferred habitat for this species (shallow areas, within the algae belt) is not covered by standard zooplankton monitoring. Data on occurrences of G. vertens is based on observations made by the public. The medusae is small and is easily overlooked unless people get stung. Since 2019 observations of G. vertens submitted through the IMR platform for Citizen Science (https://dugnadforhavet.no/) has provided valuable georeferenced records.
Acartia tonsa is a small planktonic copepod (Figure 14), native to American and Indo–Pacific waters (Leppäkoski & Olenin, 2000), but has been spread worldwide and is now regarded as cosmopolitan. In Europe it was first discovered in 1916, and in Sweden it was registered in 1934. The first Norwegian record of A. tonsa was made in 2012, in a land locked fjord in Southern Norway (Landvikvannet, Haraldstad et al. 2013) and the species has recently been registered in Skagerrak coastal waters (Moseid et al. 2021).
A. tonsa is a coastal and estuarine species that occurs in brackish water areas with reduced salinity (15-20 psu) and well adapted for highly eutrophic waters. The species requires temperatures of at least 10 oC for reproduction. A. tonsa produces benthic diapause eggs, which survive the winter and hatch in the spring when temperature reaches 10 ºC. The ability to produce highly resistant diapause eggs has probably played an important role for its wide distribution. Ballast water seems to be the most likely means of transferring copepodites or resting eggs of this species. A. tonsa is planktonic, and therefore spreads rapidly with the coastal current.
Acartia sp is not identified to species in the IMR standard monitoring programs. It is probable that the species is present in several fjords and estuaries. However, brackish water areas are generally a poorly studied habitat type in Norway and the distribution of A. tonsa along the Norwegian coast is poorly known. A. tonsa is morphologically very similar to native Acartia species, and it is time-consuming and demands taxonomic expertise to identify and monitor this species by traditional morphological techniques. Molecular based species-specific assays have been developed and proven to be a powerful tool to confirm the presence of A. tonsa in mixed plankton samples (Moseid et al. 2021).
2.9 - Benthic species
A mapping program for benthic introduced species in marinas along the coast were initiated in 2010 and is still ongoing (Figure 15). This investigation is inspired by the methods used in Rapid Coastal Survey RCS (Minchin 2007) and focuses on targeted established NIMS and door knocker species. The general idea is to use a cost and time efficient method to provide a general picture of the distribution of species. The methods have developed during the years and now includes beach survey, snorkelling and diving at selected localities. The field work is usually performed during five days in summer with several teams examining 50-70 stations altogether in a selected area of the coast. Approximately 450 marinas and beaches along a coastline of approximately 1750 km have been covered in this survey, some stations twice (Husa et al. 2012a, b, 2013). 18 established NIMS were recorded in this project, among those the four recent newcomers Schizoporella japonica (2014), Agarophyton vermiculophyllum (2012), Grateloupia turuturu (2018) (Figure 15) and Didemnum vexillum (2020).
Figure 15. (left) Grateloupia turuturu at Ula harbour. Photo: Rudolf Svensen. (right) Mapping area (red) of distribution of targeted door knockers and established NIMS in marinas in the period 2010-2019.
We have also tested out the efficiency of other methods such as dredging in the subtidal, fishing nets, traps and crab pots during the project. We also tested out a complete harbour inventory in the port of Narvik in 2012 (Husa et al. 2014), where all groups of taxa were collected by several methods and all species identified to lowest possible taxonomic level.
In 2016 we tried out a citizen science project where volunteers and diver club were trained to identify introduced marine species. The success of this project was variable, but some divers and volunteers kept on looking for introduced species and reports regularly, for example new records of D. vexillum. An easy way to report introduced species by geotagged photos on mobile application was developed in connection with this project: https://dugnadforhavet.no/. Three records of Hemigrapsus takanoi, which has not been spotted in Norway before, was reported in the application in 2019-2021 from the Oslofjord area.
All records from these projects are reported in the Norwegian Biodiversity Centre and gives valuable information on distribution of species (Figure 16). These projects were funded by the Norwegian Environment Agency in the period 2010-2014 and since then through internal projects at IMR funded by the Ministry of Trade, Industry and Fisheries.
Figure 16. Caprella mutica. Photo: Rudolf Svensen. Map showing records of C. mutica along the coast of southern Norway (Norwegian Biodiversity Centre).
2.10 - Species in ballast water
Ocean going vessels need ballast to maintain stability, regulate buoyancy and manoeuvrability when sailing with limited or no cargo on board. Originally this was achieved by solid ballast, typically stones, soil and sand, and we do in fact have numerous examples of land plants translocated by this means https://no.wikipedia.org/wiki/Ballastplanter. With the advent of water as ballast in vessels, aquatic organisms were given opportunities to hitchhike beyond their natural boundaries. The problem was addressed in a seminal paper by Jim Carlton in 1985 (Carlton 1985). Several dramatic events linked to ballast water, like HABs (harmful algal blooms), (Hallegraeff 1993) and outbreaks of Cholera epidemies in the 1990’s, (Takehashi et al. 2007) fuelled a substantial research effort into the field in the following decades. The research results, and subsequent knowledge transfer to the political and managemental sectors, were acknowledged in the UN Conference on Environment and Development (UNCED), held in Rio de Janeiro in 1992.The UN IMO (International Maritime Organization) initiated negotiations to consider the possibilities of developing an internationally binding instrument to address the transfer of harmful aquatic organisms and pathogens in ships’ ballast water.
Ballast tanks are typically dark, may contain considerable amounts of sediments, and provides both “planktonic” habitat and hard-bottom substrate. Depending on sediment content, they may also provide soft-bottom substrate. Even sessile organisms may find opportunities in ballast tanks, either as adults colonizing ballast tank walls, or as the sessile organisms’ usually planktonic propagule (most sessile organisms have a planktonic spreading unit (typically egg/larvae) (Kinlan & Gaines, 2003). Ballast tanks are filled and emptied by gravity, by pumps, or by a combination of these. Pumping will involve considerable pressure- and speed differences (shearing forces) that may harm larger fragile organisms. Smaller organisms and microorganisms will remain unaffected by pumping.
Since the 1980’s, high number of studies around the globe have documented the large number (both of species and specimen) transported between the world’s larger and smaller ports. In 14 shipping studies, Gollasch et al. (2002) surveyed more than 550 vessels entering European ports. In 1508 samples (1219 ballast water, 289 tank sediment) collected and analysed, a total of 990 different taxa were recorded. The diversity of species found included bacteria, fungi, protozoans, algae, invertebrates of different life stages including resting stages, and fishes with a body length up to 15 cm (Gollasch et al. 2002).
Arctic and Antarctic regions are not immune to the introductions of alien species (although the temperature conditions will be preventing many species from being established). In the Antarctic, live specimen of barnacles and Mytilus galloprovincialis have been found on vessels, and size measurements of the latter signified that the specimens had survived several visits to the Antarctic, (Lee and Chown, 2007). In the Arctic, several studies have documented transportation of live NIMS to Svalbard, (Ware et al. 2015) and in the Canadian Arctic (Goldsmit et al. 2018).
Currently the knowledge on the biogeography of bacteria is limited, but the data are clearly indicating that the “global microbiome” is geographically structured. Species and strains are to some extent “local”, and the concept “alien species” therefore also is relevant for these functional groups.
(Hess-Egra et al. 2019). The knowledge of the global distribution of virus is poorly studied, but newer studies have demonstrated that a) the viral content in ballast water can be high indeed, and b) several human pathogens were discovered in ballast water (Hwang et al. 2018). In Norway, only a few studies of the biota in ballast water have been made. The most comprehensive was a part of a European initiative (Gollasch et al. 2002), and a study in Svalbard (Ware et al. 2015).
2.11 - Species on vessels
The biofouling community on vessels entering the Norwegian coast from abroad has been little studied. It is difficult to get permission to inspect the hull from the shipping companies, and safety for the divers is also an issue during such operations. Most vessels are from time to time inspected by divers or ROV’s, but those footages are not available to the public and often of such quality that it is difficult to distinguish species from them. In corporation with a local shipping company and an oil company IMR have inspected in total six vessels in period 2016-2019: two heavy lifting vessels and four supply vessels. Heavy lifting vessels often stays for months in a port while constructions for the oil or power industry is made ready on the shipyards, and though pose a substantial risk of getting heavily fouled. Many of these constructions are built in Korea, in waters that have similar temperature conditions as Norwegian waters. One such vessel coming in from Korea were examined in 2018. Although the ship had been cleaned before departure from Korea, we still found several species of barnacles and goose barnacles, oysters, and other mussels in niche areas around the propeller. A similar vessel from Gothenburg were investigated the same year but had only a large number of Pacific oysters on the hull.
A supply vessel coming into the Norwegian coast after four years as a standby diving vessel at an oil field in the Gulf of Mexico, were surveyed by divers in the autumn 2016. The vessel had a moon pool and had travelled from the gulf to Norway with no bottom doors in the moon pool. The moon pool contained an almost complete ecosystem with species that are commonly associated with artificial structures in the Gulf of Mexico. In the moon pool there were swarms of blennies (Scartella cristata) and a yellow Parablennius sp. (Figure 17). Several specimens of the crab Cronius ruber and three species of shrimps were hiding in the holes at the sides of the moon pool. The walls were covered with sun corals, pearl-oysters and several other species of oysters and mussels, calcareous worms, sponges, ascidians, and bryozoans. A revisit at the moon pool in April the following year after a cold winter, no living animals from Mexico occurred and the pool was taken over by native ascidians and swimming crabs. One of the supply vessels coming in from Africa was completely clean, two other vessels from Chile and Brazil had remains of barnacles and empty mussels, but everything on these ships were dead because the because the vessels had stayed in Norwegian waters under winter conditions before the investigation. A last supply vessel was examined directly after the arrival from the Red Sea (Egyptian side) and was heavily fouled after being moored for years. This ship had a up to 10 cm thick layer of barnacles, oysters and other molluscs, ascidians, bryozoans, and sponges (Figure 18). When scraping off the fouling community it revealed that small crabs and polychaetes were living within the biofouling. We even recorded an endemic blenny (Parablennius zvonimiri) from the Mediterranean hiding in one of the large barnacles. This hitchhiker had probably entered the ship during a few days stay in Malta on the journey to Norway.
These occasional studies are not sufficient to establish a full picture of biofouling on ships entering Norwegian waters but gives us a taste of the potential for this vector.
Figure 17. Unidentified shrimp, sun corals and Molly Miller blenny (Scartella cristata) collected in the moon pool of a vessel coming in to the Norwegian coast from the Mexican gulf.
Figure 18. Bilge of supply vessel coming into a Norwegian port with dense populations of mussel (Brachidontes pharaonis) originating from the Red Sea.
2.12 - Parasites and pathogens
Parasites and pathogens may be introduced with import or translocations of live animals for aquaculture, unintentionally via vectors or with live seafood that is re-laid in water.
Introduction and spreading of fish diseases is a well-recognized hazard, after a long period with severe disease problems and huge economical losses in the aquaculture industry. Today, the industry is restrictive, and imports are banned, to minimize the risk. A remarkable exception is the import and translocation of cleaner fish with un-known health status released in the salmon and rainbow trout net pens, and thus creating a polyculture which may lead to introductions of “new” pathogens or changes in virulence of pathogens already present in salmonids and cleaner fish species.
Spreading of pathogens is not only related to import. It is also relevant between regions in Norway. However, zoning to protect a good health status is difficult, due to the adaptation to EU legislation (former directive 2006/88, now the new Animal Health Law, regulation 2016/429). Surveillance is focused on pathogens that are notifiable, according to EU and national legislation. As a general rule, movements are allowed between areas / water compartments of equal health status or from areas of high status into areas with a lower status.
To avoid introduction of the listed / notifiable diseases, there is a need for documentation. In Norway, there is limited monitoring of fish and shellfish parasites, and pathogens present outside Norwegian waters. However, The Norwegian Food Safety Authority (NFSA) aims at obtaining an overview of the notifiable diseases. Three Surveillance programmes, funded by the NFSA are carried out:
The Norwegian Veterinary Institute carries out a surveillance programme for Viral haemorrhagic septicaemia virus and infectious haematopoietic necrosis virus in farmed salmonids, pink salmon (caught in one river) and a limited number of samples from cleaner fish. The programme has a risk-based approach, and the main surveillance activity is the routine clinical inspections on sites with farmed salmonids and analyses of samples collected from diseased fish. Viral haemorrhagic septicaemia virus and infectious haematopoietic necrosis virus were not detected at any of the sites tested in the 2020.
The Veterinary institute also carries out a surveillance programme for Freshwater Crayfish plague. Environmental DNA (eDNA) monitoring is used for the detection of species-specific DNA from spores of Aphanomyces astaci directly from water filtrates. The presence/absence of eDNA from noble crayfish (Astacus astacus) and signal crayfish (Pacifastacus leniusculus) is also determined to supplement the results.
The Institute of Marine Research carries out a surveillance programme for bonamiosis and marteiliosis in European flat oysters, Ostrea edulis, and blue mussels, Mytilus sp. in Norway. The programme is based on a targeted surveillance combined with research activities following up mortality events. The programme combines histology and PCR-based diagnostic methods, and may thus detect other pathogens than Bonamia sp. and Marteilia sp. In the bivalve populations, and over time get an overview of the health situation of Norwegian bivalves and protect the stocks from the introduction of exotic pathogens. Bonamia sp. is detected in Norwegian oysters. Marteilia refringens Type M. / M. pararefringens has been detected in blue mussels from five sites. A collaboration has been established between IMR, IFREMER (France) and CEFAS (UK) to elucidate the distribution, spreading potential, life cycle and host range of M. pararefringens. To disseminate results and information, the programme has close contact with Scandinavian shellfish farmers. Results are published annually, through IMR report series (see Mortensen and Skår 2020).
In addition to these surveillance programmes, pathogens in wild and farmed fish and shellfish are sometimes studied in research projects and/or screening initiated by the farming industry. These activities are however not done on regular basis.
Surveillance of oysters and mussels is the only programme that may catch other pathogens than those targeted. Selected populations are monitored to detect mortality events. The general state (condition) of bivalves is noted during sampling, and histology methods are used in the health screening. This will reveal the condition of the individual bivalve, pathogenic changes in tissues and any foreign organism visible through the microscope.
The surveillance programme for bonamiosis and marteiliosis reports to the NFSA and the European reference Laboratory for mollusc diseases (EURL). This enables a dynamic collaboration on any pathogen detection or finding of abnormal tissues. The work is strengthened through collaboration with research teams at IFREMER (France) and CEFAS (UK). The work has also been linked to international research projects and a Scandinavian network used to disseminate information and exchange information and data (see below).
The surveillance programme for bonamiosis and marteiliosis is funded by NFSA, research by IMR, through funding from the Ministry NFD, and partly through research projects (EU – Vivaldi (ended 2020) and networking - Scandinavian network (Nordic Council of Ministers) (ending 2021).
2.13 - Other mapping programs
The Norwegian Biodiversity Centre is funding several inventory projects on marine species in Norwegian waters within the program “The Norwegian Taxonomy Initiative (NTI)”. The aim of these projects is to provide inventories of all multicellular species occurring in Norway and to build validated DNA-barcode reference databases for all species. Barcoding is conducted in collaboration with the Norwegian Barcode of Life (Nor-BOL), the local node of iBOL, and the resulting data are made available through the Barcode of Life Data Systems (http:// www. bolds systems. org/). The NTI projects will provide georeferenced records of non-native species (submitted to the Norwegian Biodiversity Information Centre). In addition, the barcodes provided from these projects, is available in BOLD and can be used within activities on metabarcoding and eDNA. All collected material are stored and curated in the university museums' collections, for documentation and future research.
Examples of NTI projects providing species inventories and barcode databases: The project COPCLAD (2015–2017, IMR) performed an inventory of planktonic copepods and Cladocera in Norwegian waters. The project HYPCOP (2020–2022; IMR) is focusing on the diversity of copepods in the hyperbenthic marine habitats in Norwegian waters and will build a reference DNA-database on primarily harpacticoids. The project “Hardbunnsfauna” (2019-2022, Natural History Museum, UiB) will provide new knowledge on the distributions of marine invertebrate species in shallow hard bottom sites. Special focus is on sponges, bryozoans and ascidians. The project also contributes with DNA barcodes from a variety of species, which are submitted to the BOLD database.
2.14 - Summary of monitoring and mapping in Norwegian Waters
Monitoring of king crab and snow crab is mostly with the purpose of stock assessment for advice given to the management of the fisheries, but also to follow population development and dispersal in the Barents Sea and Norwegian Sea. Pink salmon is monitored through a network of activities along the entire coast. Pacific oyster has been monitored in its distribution area along the coast of Norway trough a Nordic network and the project stops in 2021. Likewise, the pathogens in native and introduced oyster has been subject to monitoring. The red algae Agarophyton vermiculophyllum, which have caused problems in many countries, has been mapped along the coast of the Oslofjord south to Kristiansand. However, this mapping is very limited, as only one area has been mapped each year and the abundance of the species has only been recorded as presence/absence. The abundance of the species is only recorded properly at three sites. Alien species of zooplankton is occasionally detected in general monitoring programs of zooplankton. Additionally, is alien jelly fish reported in citizen science projects.
The Norwegian coast is the second longest in the world and mapping and monitoring of introduced species is time consuming and costly. About ¼ of the coast have been mapped with the purpose of getting a general picture of distribution of established species and possible newcomers. Each area has only been mapped once in a 10-year time-period and most sites have not been revisited. Several door knocker species may already be established along the coast, but the low mapping and monitoring effort have not been able to conclude on this. We have also little knowledge on the distribution on recent newcomers like Hemigrapsus takanoi,Grateloupia turuturu and Didemnum vexillum as no determined mapping program is yet in place. The round goby Neogobius melanostomus is present both on the Swedish west coast close to the Norwegian border and in Denmark and is expected to arrive here soon or is already present without being detected yet. In summer 2021 a small pilot study was performed on several sites in the Oslofjord, but this activity might not be enough to detect the species potential presence in Norwegian waters.
New species may be detected trough general biodiversity projects, and by increasing our knowledge on general biodiversity we also increase our knowledge on alien species.
We also have little knowledge on the species associated with specific vector into the Norwegian coast such as transport water for cleaning fish, floating debris and species on ships. Biofouling communities on vessels arriving from foreign ports have only been performed in a handful og vessels.
3 - Vectors for introduction of NIMS into the Norwegian coast
3.1 - Ballast water
Following more than a decade of work at the MEPC (Marine Environmental Protection Committee, IMO), the Ballast Water Management Convention was adopted in 2004. There were, however, numerous unsettled issues to be finalized in the years to come. The convention should enter into force 12 months after ratification by a minimum of 30 States, representing 35% of world merchant shipping tonnage. This requirement was met when Finland ratified the convention on 8th September 2016, hence the convention entered into force in 2017. By this time, most of the practical and regulatory remaining issues in the original convention had been resolved. The Convention requires all ships to implement a ballast water management plan. All ships must carry a ballast water record book and are required to carry out ballast water management procedures to a given standard. Parties to the Convention are given the option to take additional measures which are subject to criteria set out in the Convention and to IMO guidelines.
Ballast water treatment was scheduled in a two-tier approach. While allowing for a substantial “grace-period” (The global shipyard capacity simply was too small to facilitate retrofitting in existing vessels fast enough), an alternative standard (D1) was adopted. See infographics, Figure 19. The D1-standard requires the vessel to exchange ballast water at a distance > 200 nautical miles offshore, and preferably at depths > 200m. The requirements are specified in “Guidelines G6” in the Convention (2017 Guidelines for ballast water exchange (G6) (resolution MEPC.288(71)).
Figure 19. Infographics of the implementation of the Ballast Water Management Convention (Source: IMO).
New vessels built after 8th September 2017 must meet the D2 standard.
The D-2 standard specifies that ships can only discharge ballast water that meets the following criteria:
less than 10 viable organisms per cubic metre which are greater than or equal to 50 micrometres in minimum dimension
less than 10 viable organisms per millilitre which are between 10 micrometres and 50 micrometres in minimum dimension
less than 1 colony-forming unit (cfu) per 100 millilitres of Toxicogenic Vibrio cholerae
less than 250 cfu per 100 millilitres of Escherichia coli
less than 100 cfu per 100 millilitres of Intestinal Enterococci
Older vessels must also meet the D2 when they are having
IOPPC Renewal survey after 8th September 2019 A ship undergoing a renewal survey linked to the ship's International Oil Pollution Prevention Certificate after 8th September 2019 will need to meet the D2 standard by the date of this renewal survey.
IOPPC Renewal survey between 8 September 2017 and 8 September 2019. - If the previous IOPPC renewal survey was between 8 September 2014 and 8 September 2017, then the ship must comply with D2 standard by this renewal survey. If the previous IOPPC renewal survey was before 8 September 2014, then the ship can wait until the next renewal survey (which will be after 8 September 2019).
While vessels built after 8th September 2017 are required to meet the D2 standard, older vessels (not having to retrofit in conjunction with IOPPC renewal surveys (see above) may still operate under the D1 standard until the end of the “grace period” (8th September 2024). Areas for ballast water exchange (Figure 20) in compliance with the D1 standard are specified in the Norwegian by-law: “Forskrift om ballastvannbehandling på skip og flyttbare innretninger.” (Anon 2015).
Figure 20. Areas for ballast water exchange along the Norwegian coast (Map from Norwegian Maritime Authority).
While it is anticipated that the Ballast Water Management Convention will reduce the risk for NIS introductions, there are several types of vessels that are exempt from the Convention.
In addition to commercial vessels < 400 gross tons, cf. Regulation E-1.1., war ships, naval auxiliary, or other ships owned and operated by a state and used only on government non-commercial service, as stated in Article 3.2(d) of the convention. While the volume of ballast water carried by the bulk of these vessels are modest, the high number, and the unrestricted sailing pattern still represent risk for further spread of NIS.
3.2 - Biofouling on vessels
In 2011 guidelines for the control and management of ships’ s biofouling to minimize the transfer of invasive aquatic species were presented by IMO (MEPC 62/24-2011). The guidelines include actions like biofouling management plan and record book, anti-fouling system installations and maintenance, and in-water inspection, cleaning and maintenance. The idea was to test out these guidelines on a voluntary basis before mandatory regulations were implemented. Currently there is ongoing work in IMO to assess these experiences and develop standardized regulations.
With the ballast water under better control, biofouling on ships probably is the vector with highest risk of bringing new species to Norwegian waters. From being a country with mostly fishing boats and smaller cargo up to the 1970’s the development of the oil and aquaculture industry, the increased demand for imported goods and increased tourist activity has led to a dramatic change in the vessel intensity along the Norwegian coast the last five decades.
3.3 - Analyses of shipping activity in Norwegian ports
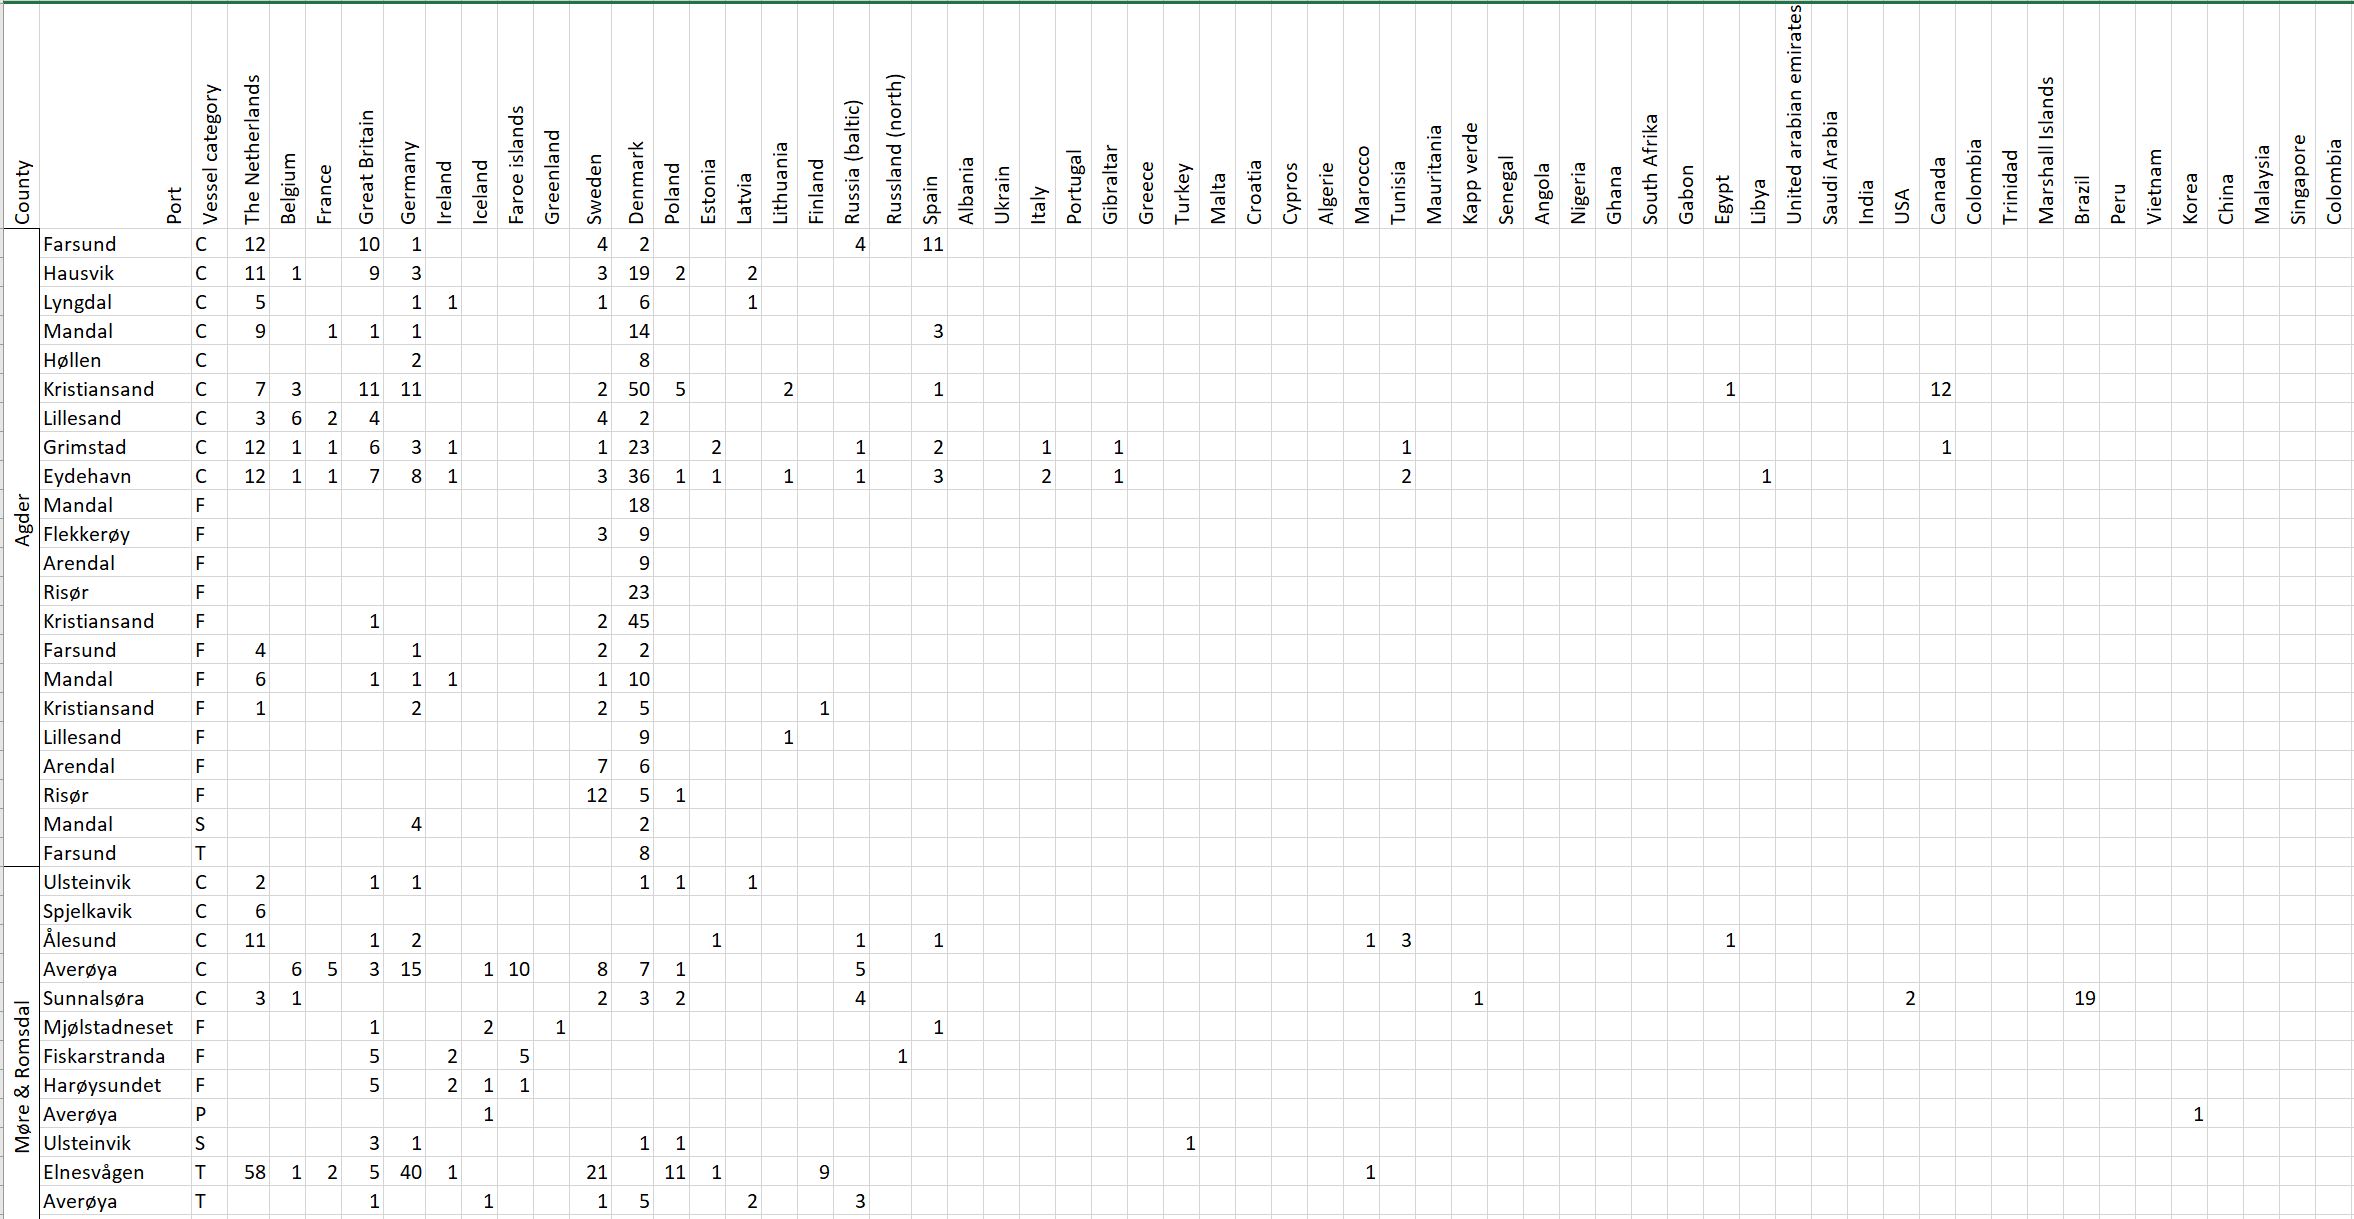
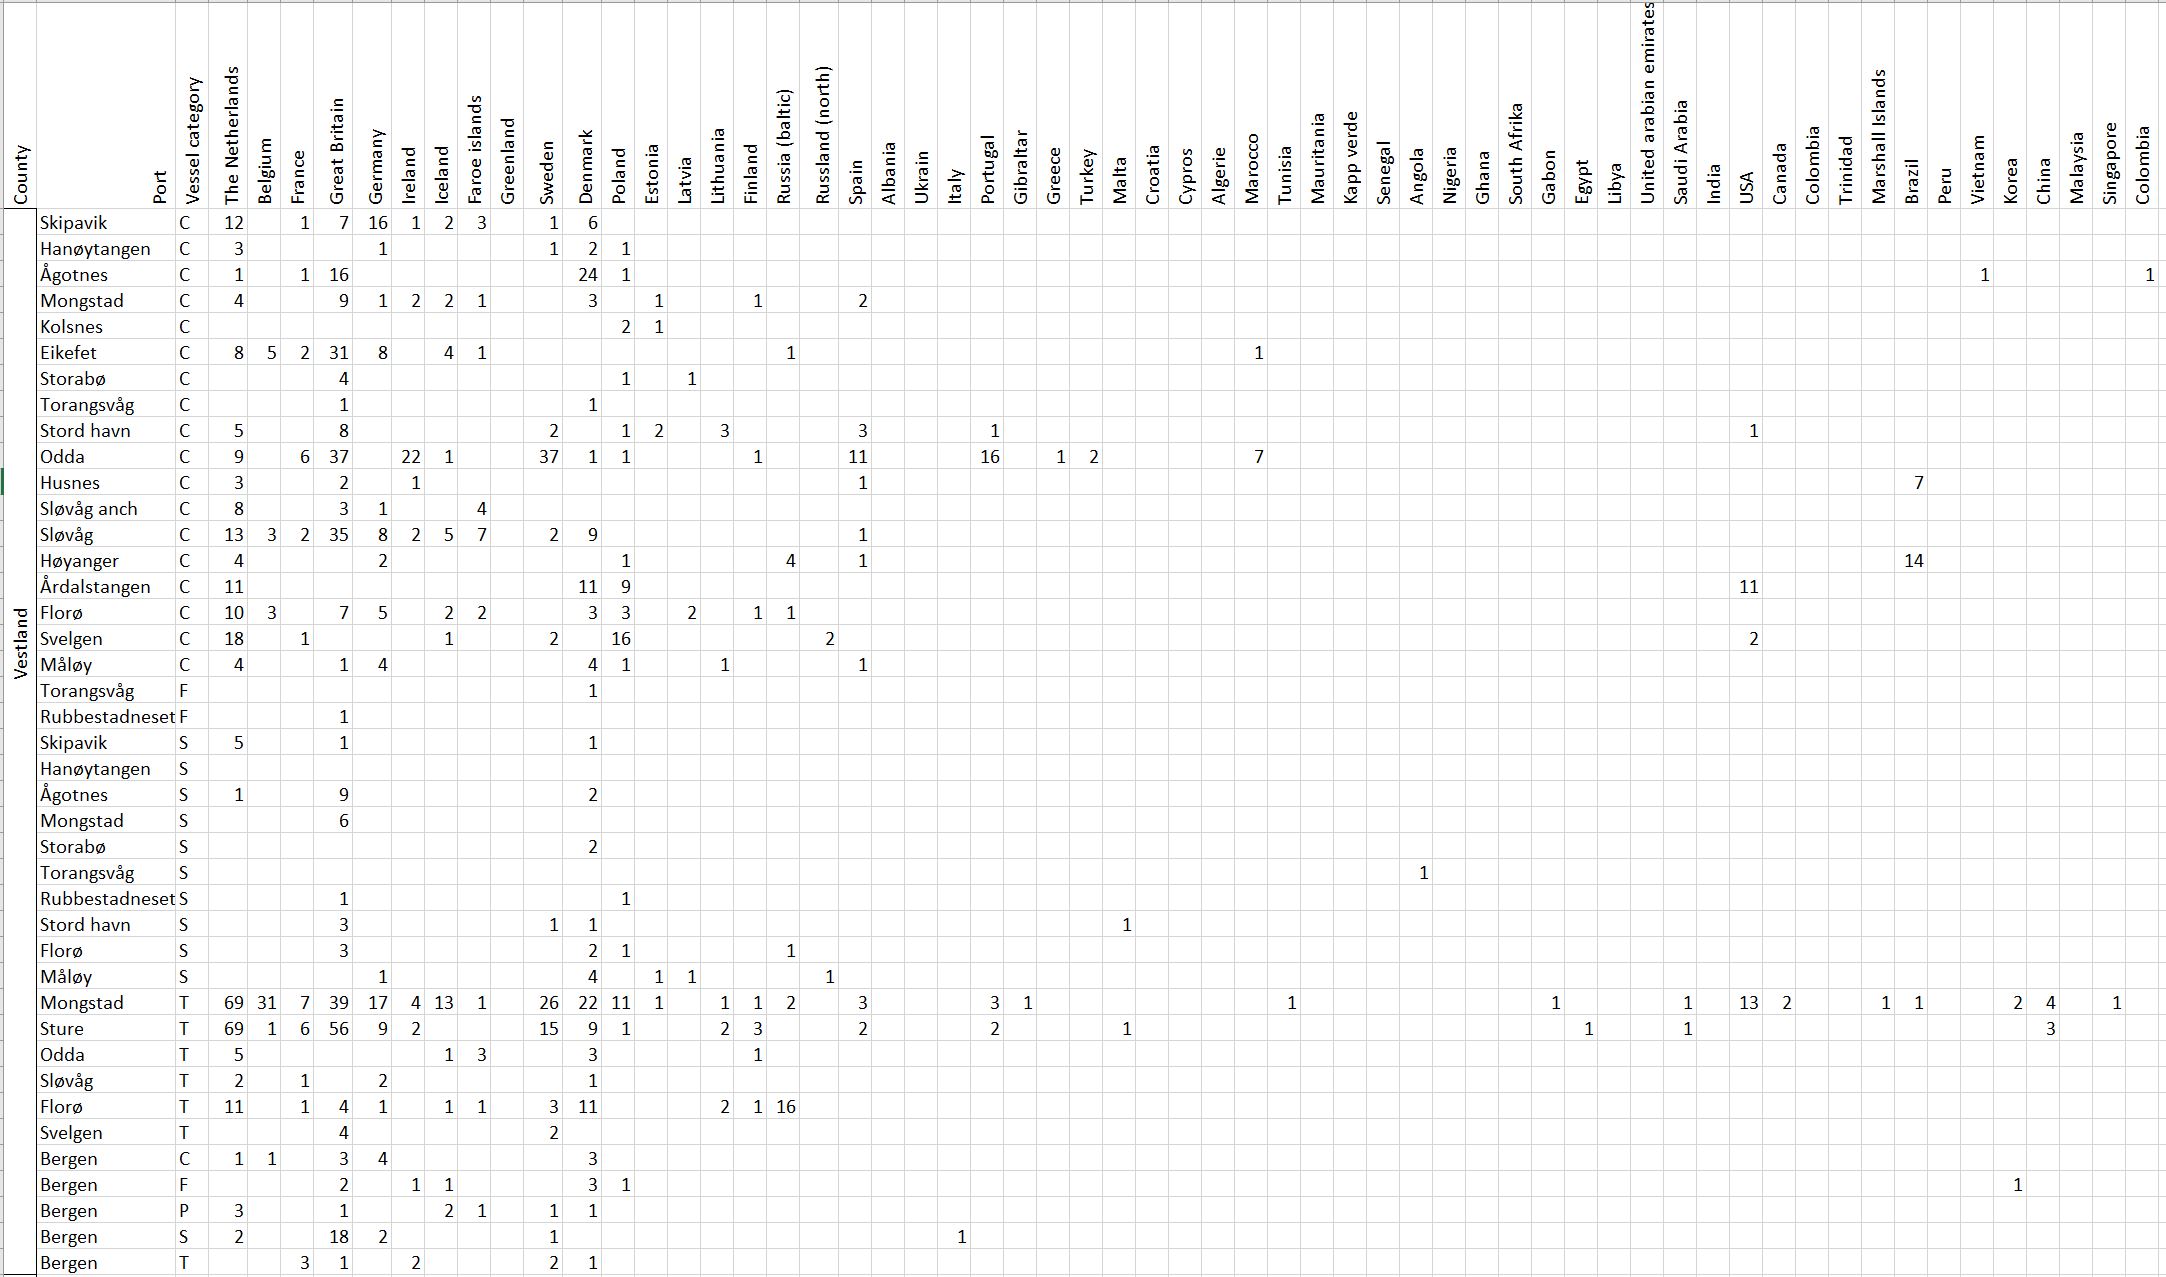
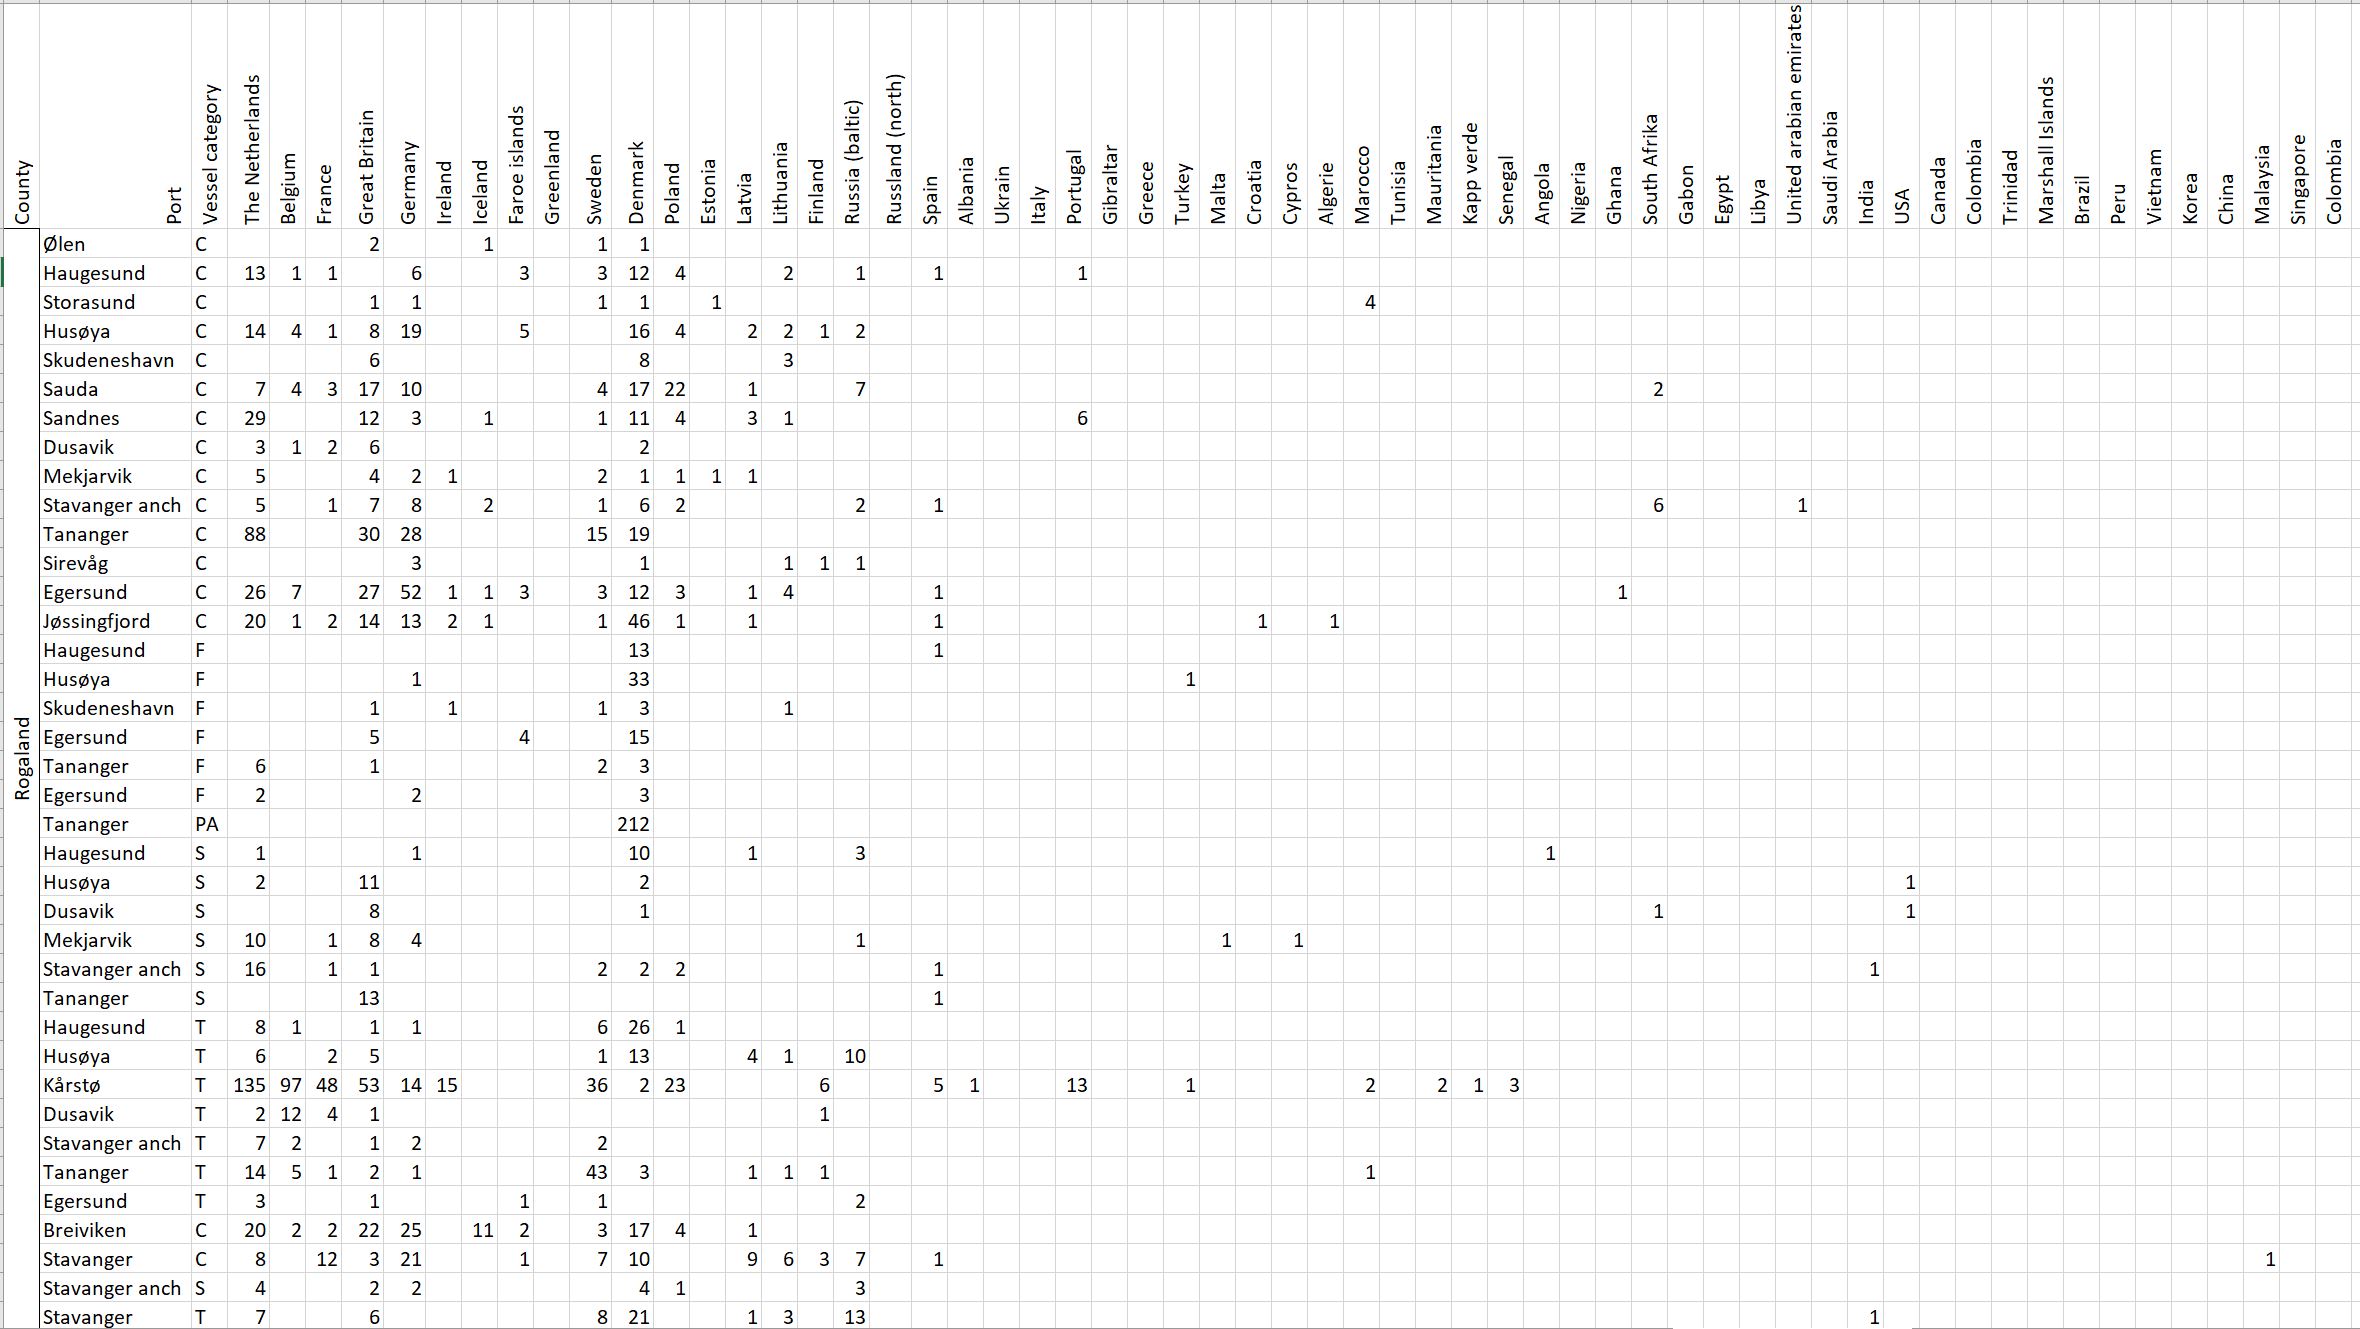
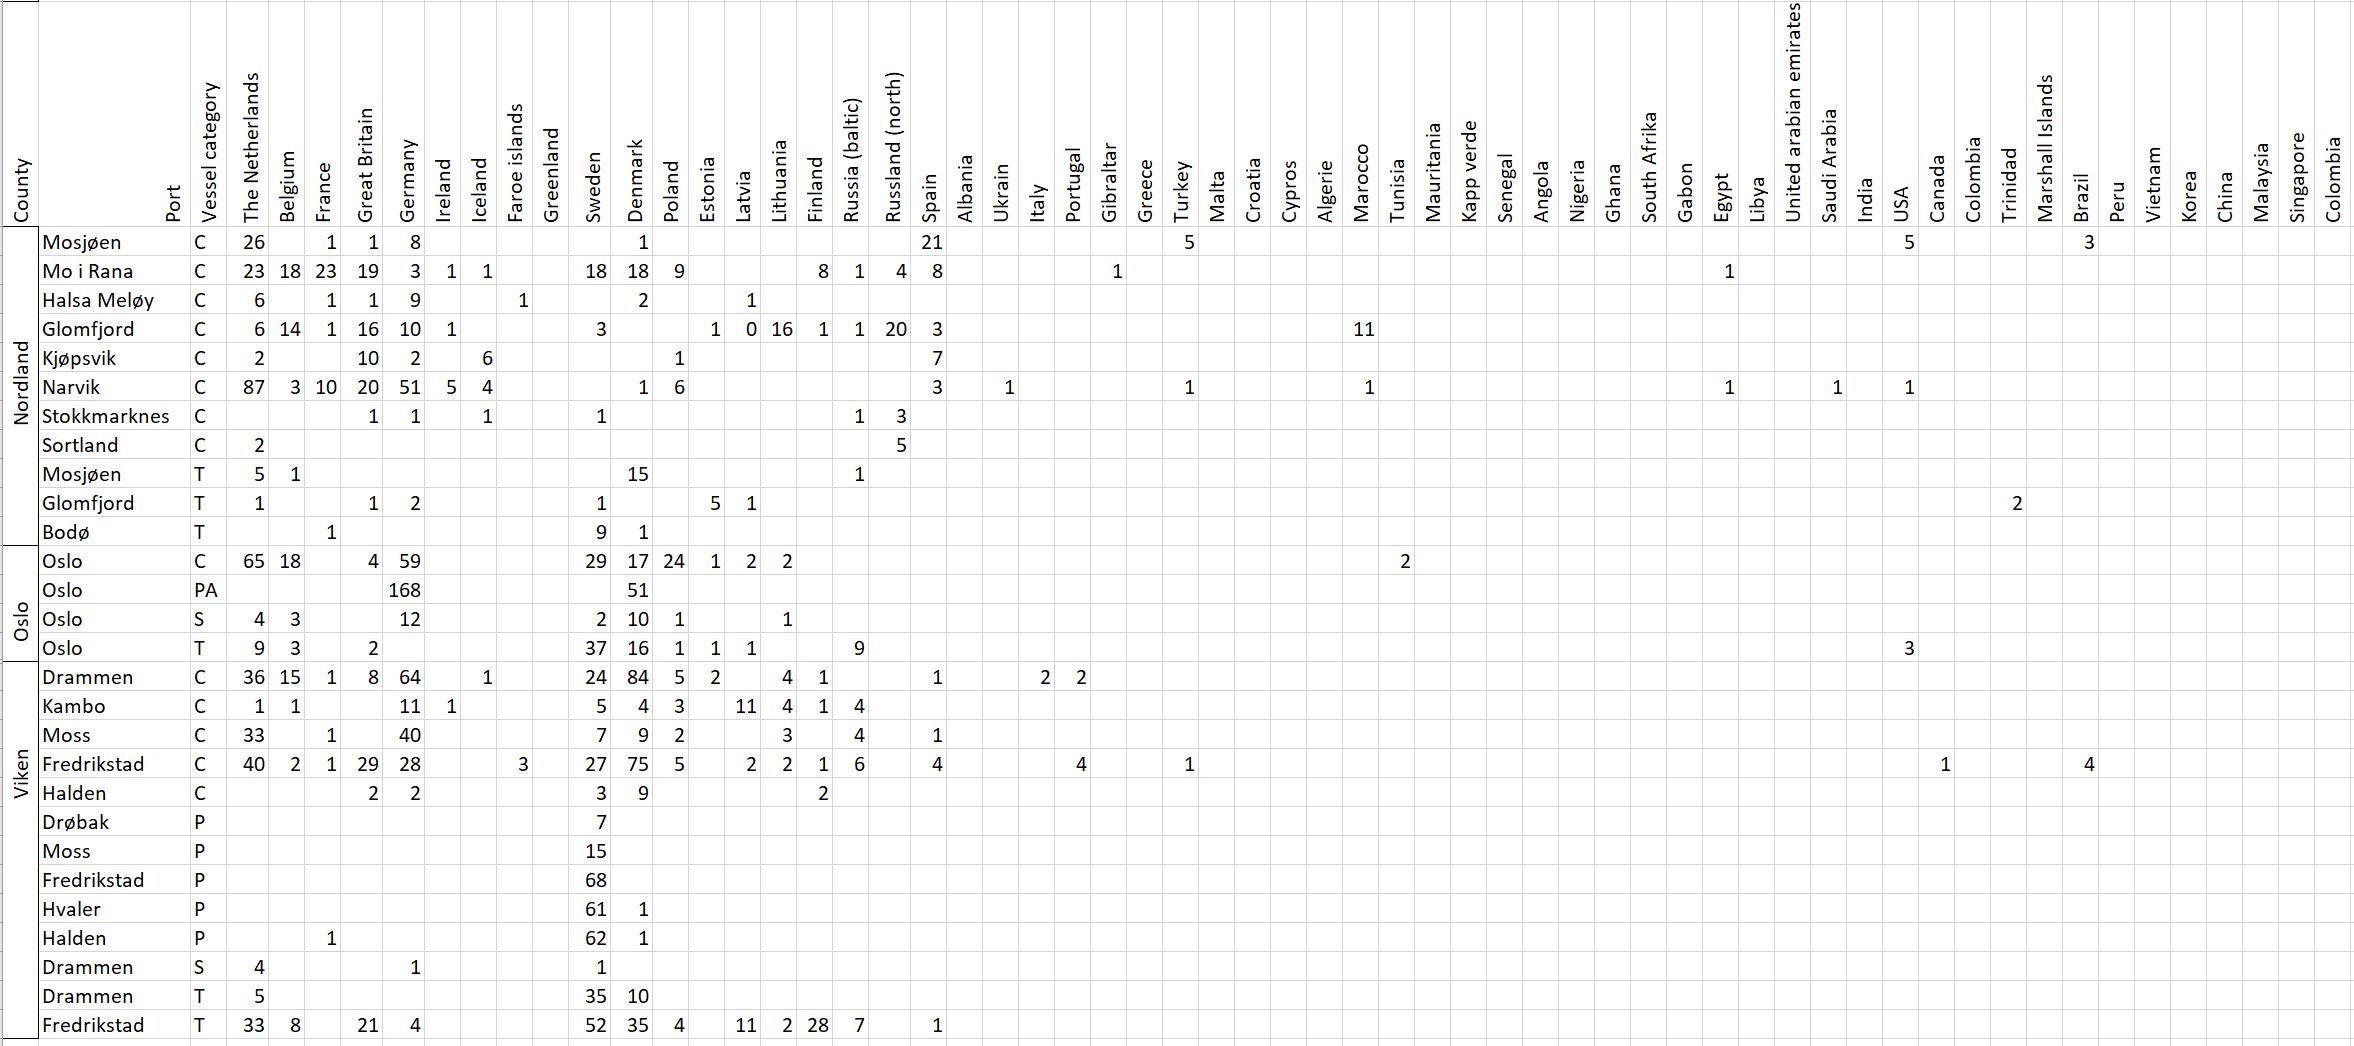
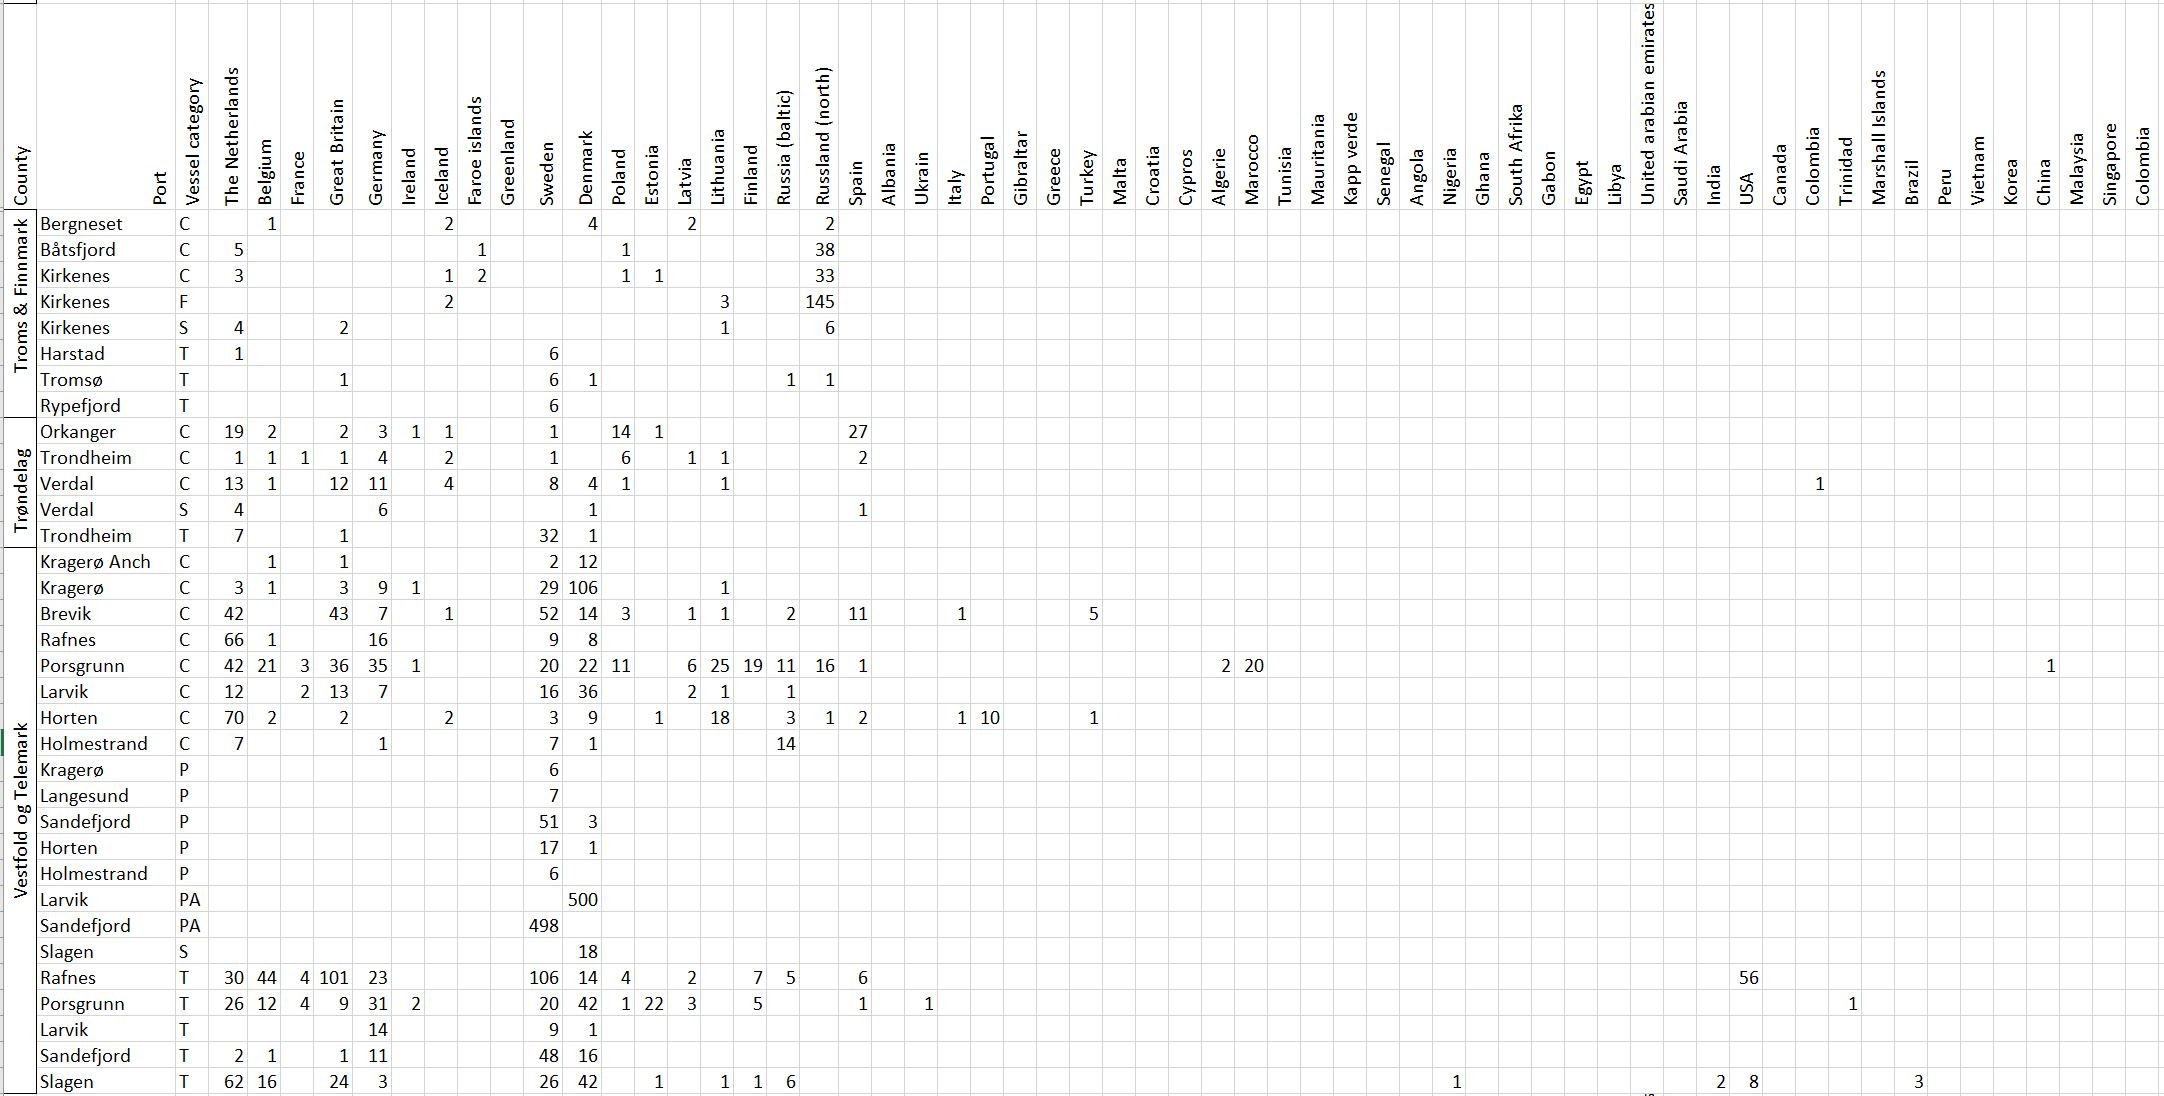
Voyage origin (last port call) were assembled from port history in Marine Traffic for vessels (n = 157 641) entering 143 Norwegian ports in the period October 2020 to November 2021. Port call in these categories were analysed: Cargo, tankers, tugs and special crafts (including all types of vessels related to the oil industry), fishing vessels and leisure crafts. Passenger vessels were excluded from the study, since most passenger vessels in this period were of national origin due to Covid-19 restrictions. Data for Ro-ro passenger vessels to ports that have ferries to Sweden and Denmark were assembled. To get a picture of the cruise traffic into a port in a normal year, data for port calls in 2019 were provided from Bergen Port Authorities, as Bergen port is one of the busiest cruise ports in Norway. Norwegian ports that received > 500 arrivals per year were included in the study. Total number of arrivals and arrivals from foreign ports for each vessel category were counted. Origin port for all vessels from foreign ports were identified to country for ports that received > 5 foreign arrivals per year. Marine traffic only gives historical data for port calls back one year and yields a maximum of 500 vessels in each category. For busy ports the number of 500 arrivals were exceeded in a variable time span for most vessel categories. The number of days in this timespan were noted and a mean daily rate of arrivals in this period were calculated and used to estimate a total number of annual arrivals in each category. Number of foreign arrivals were calculated in the same way for ports with > 500 arrivals. Data on shipping intensity is retrieved from European Marine Observation and Data network (EMODnet: https://emodnet.ec.europa.eu/en).
3.3.1 - Cargo
The group cargo includes vessels from small carriers to large container ships. A total estimated number of 65 500 cargo vessels arrived annually in Norwegian ports in 2020-2021. The highest total number of cargo arrivals was in Haugesund (5703), followed by Tromsø (2724), Florø (2500), Måløy (2607) and Ålesund (2253). Oslo port had the highest number of foreign cargo arrivals (925), followed by Porsgrunn (550), Haugesund (547) and Tananger (530) (Figure 21). (Detailed data is available in Appendix 1, Table 1).
Figure 21. (Left): Annual number of arrivals of cargo vessels into Norwegian ports. Shipping intensity for this group shown as routes/ km 2/year. (Right): Annual number of foreign cargo arrivals into Norwegian ports. Annual arrivals are estimated for ports which receives >500 arrivals a year (Data from Marine Traffic and EMODnet).
3.3.2 - Tankers
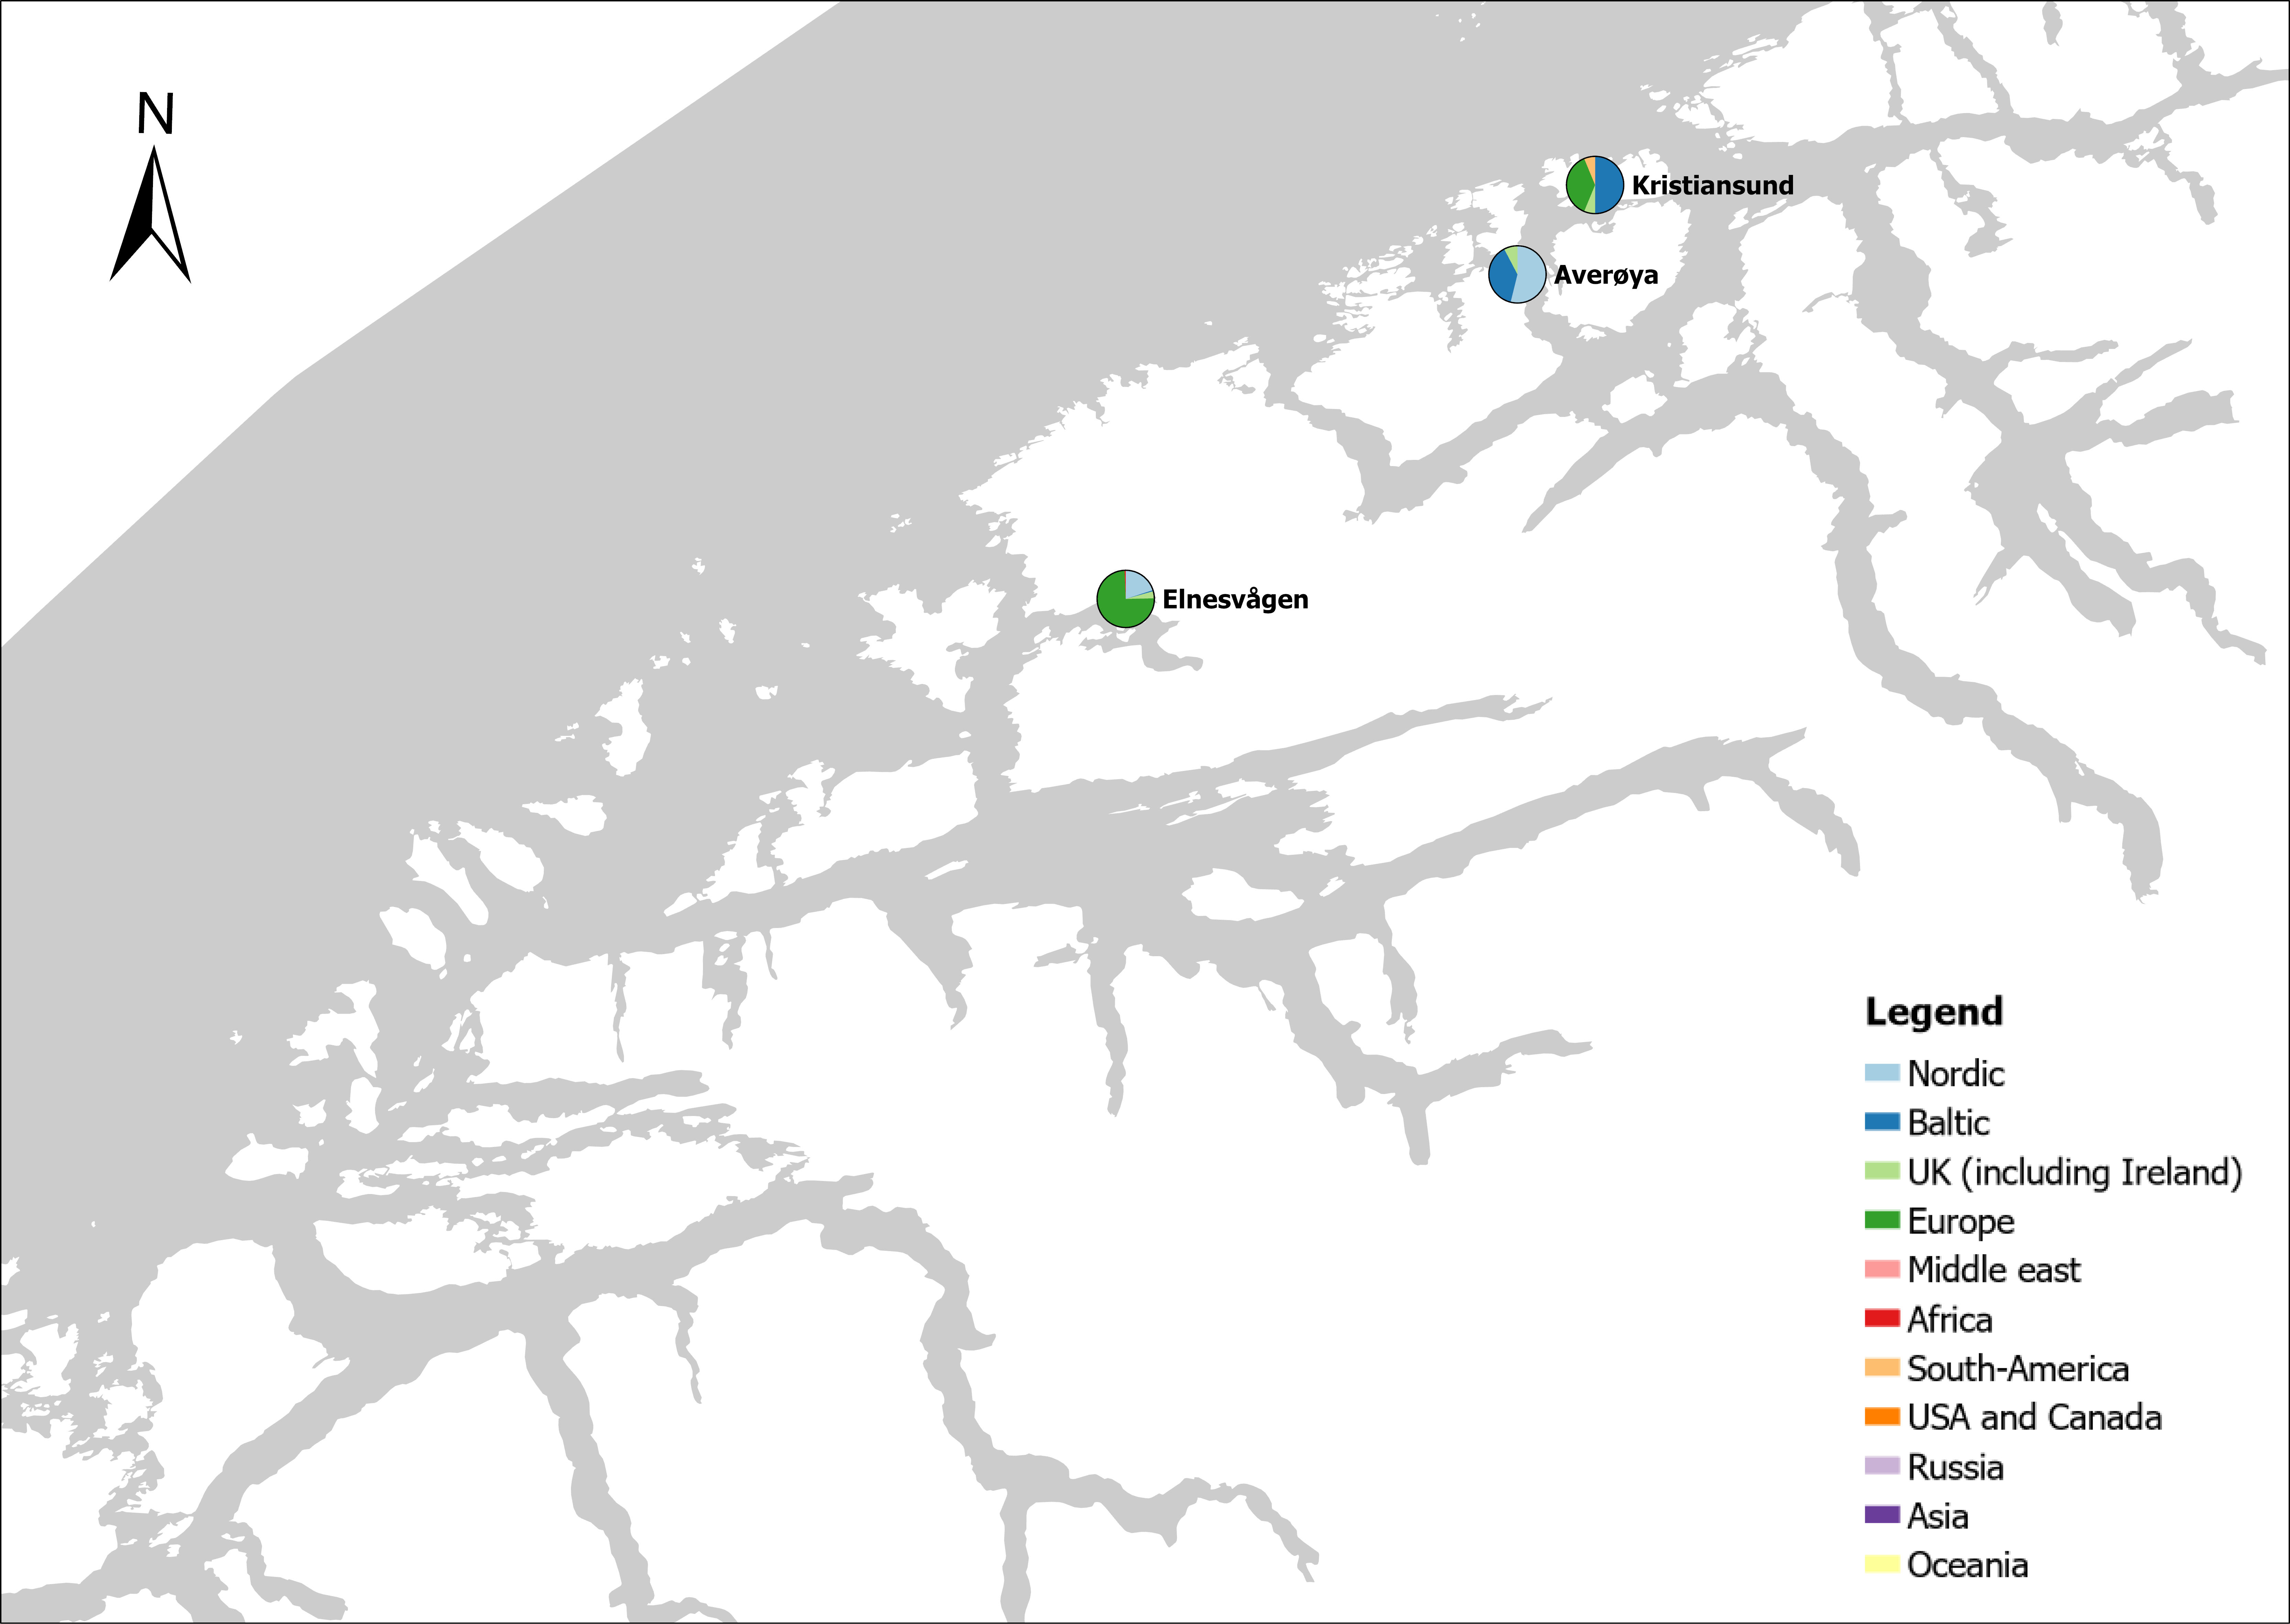
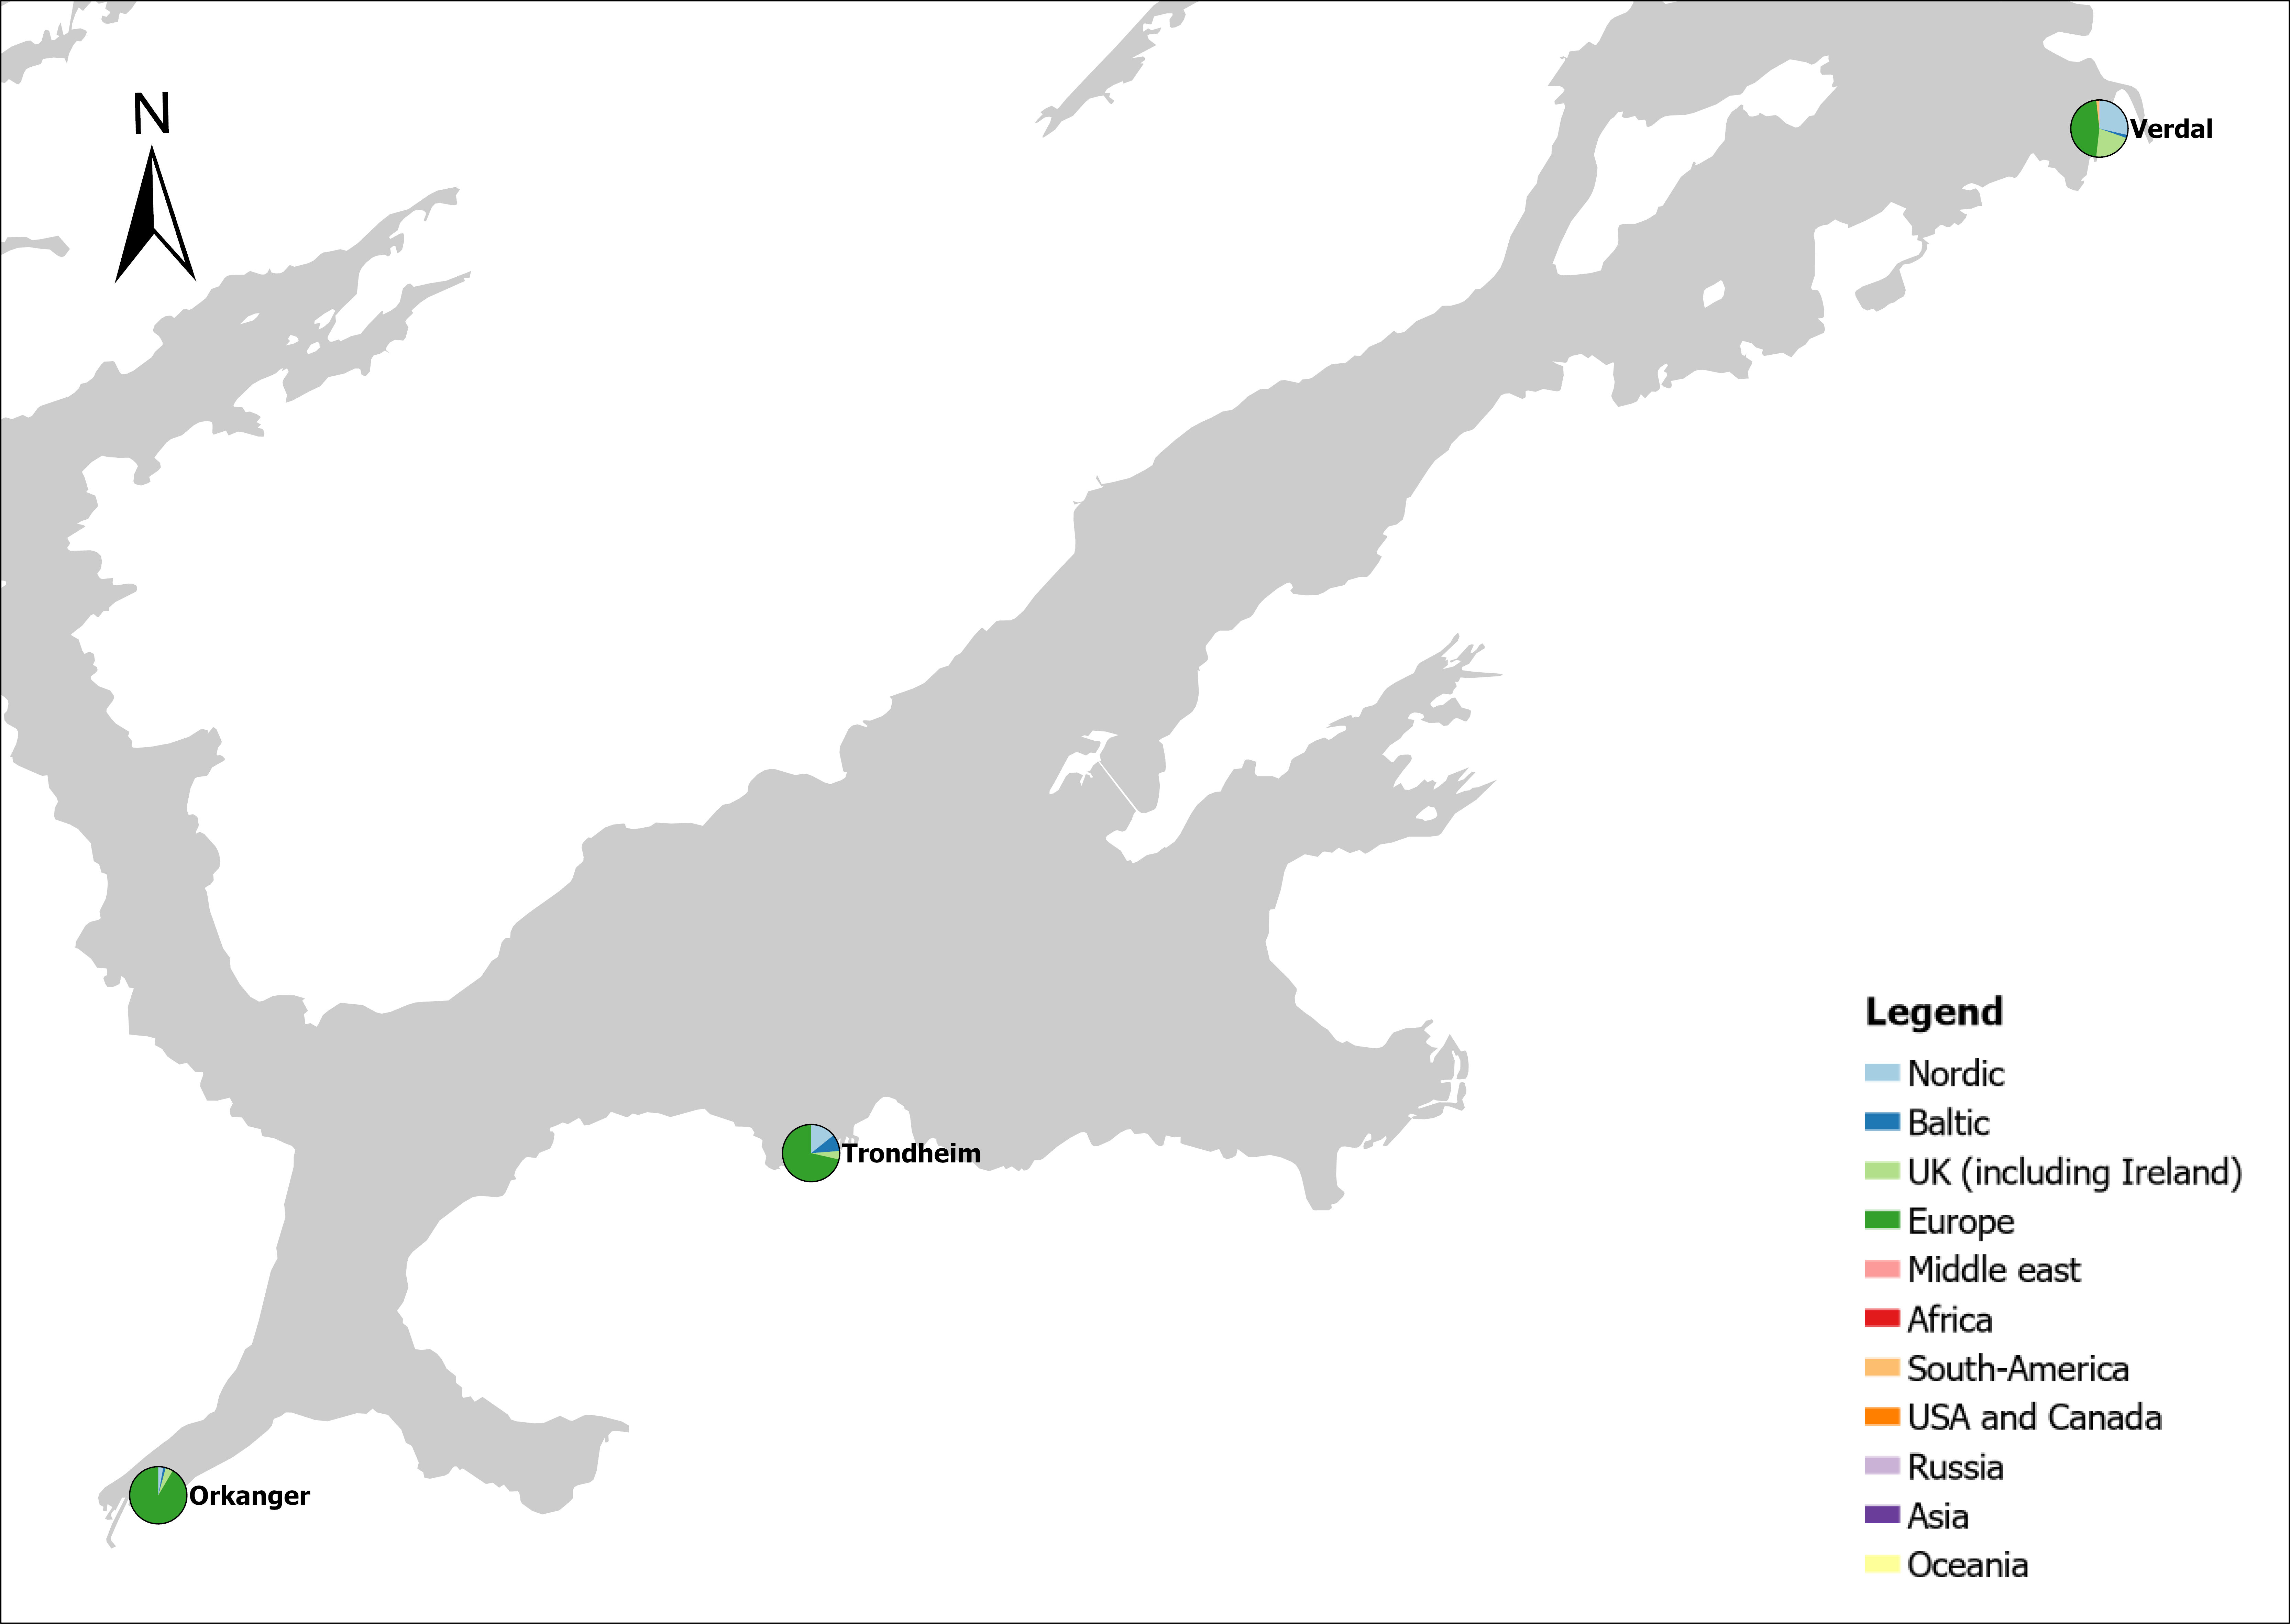
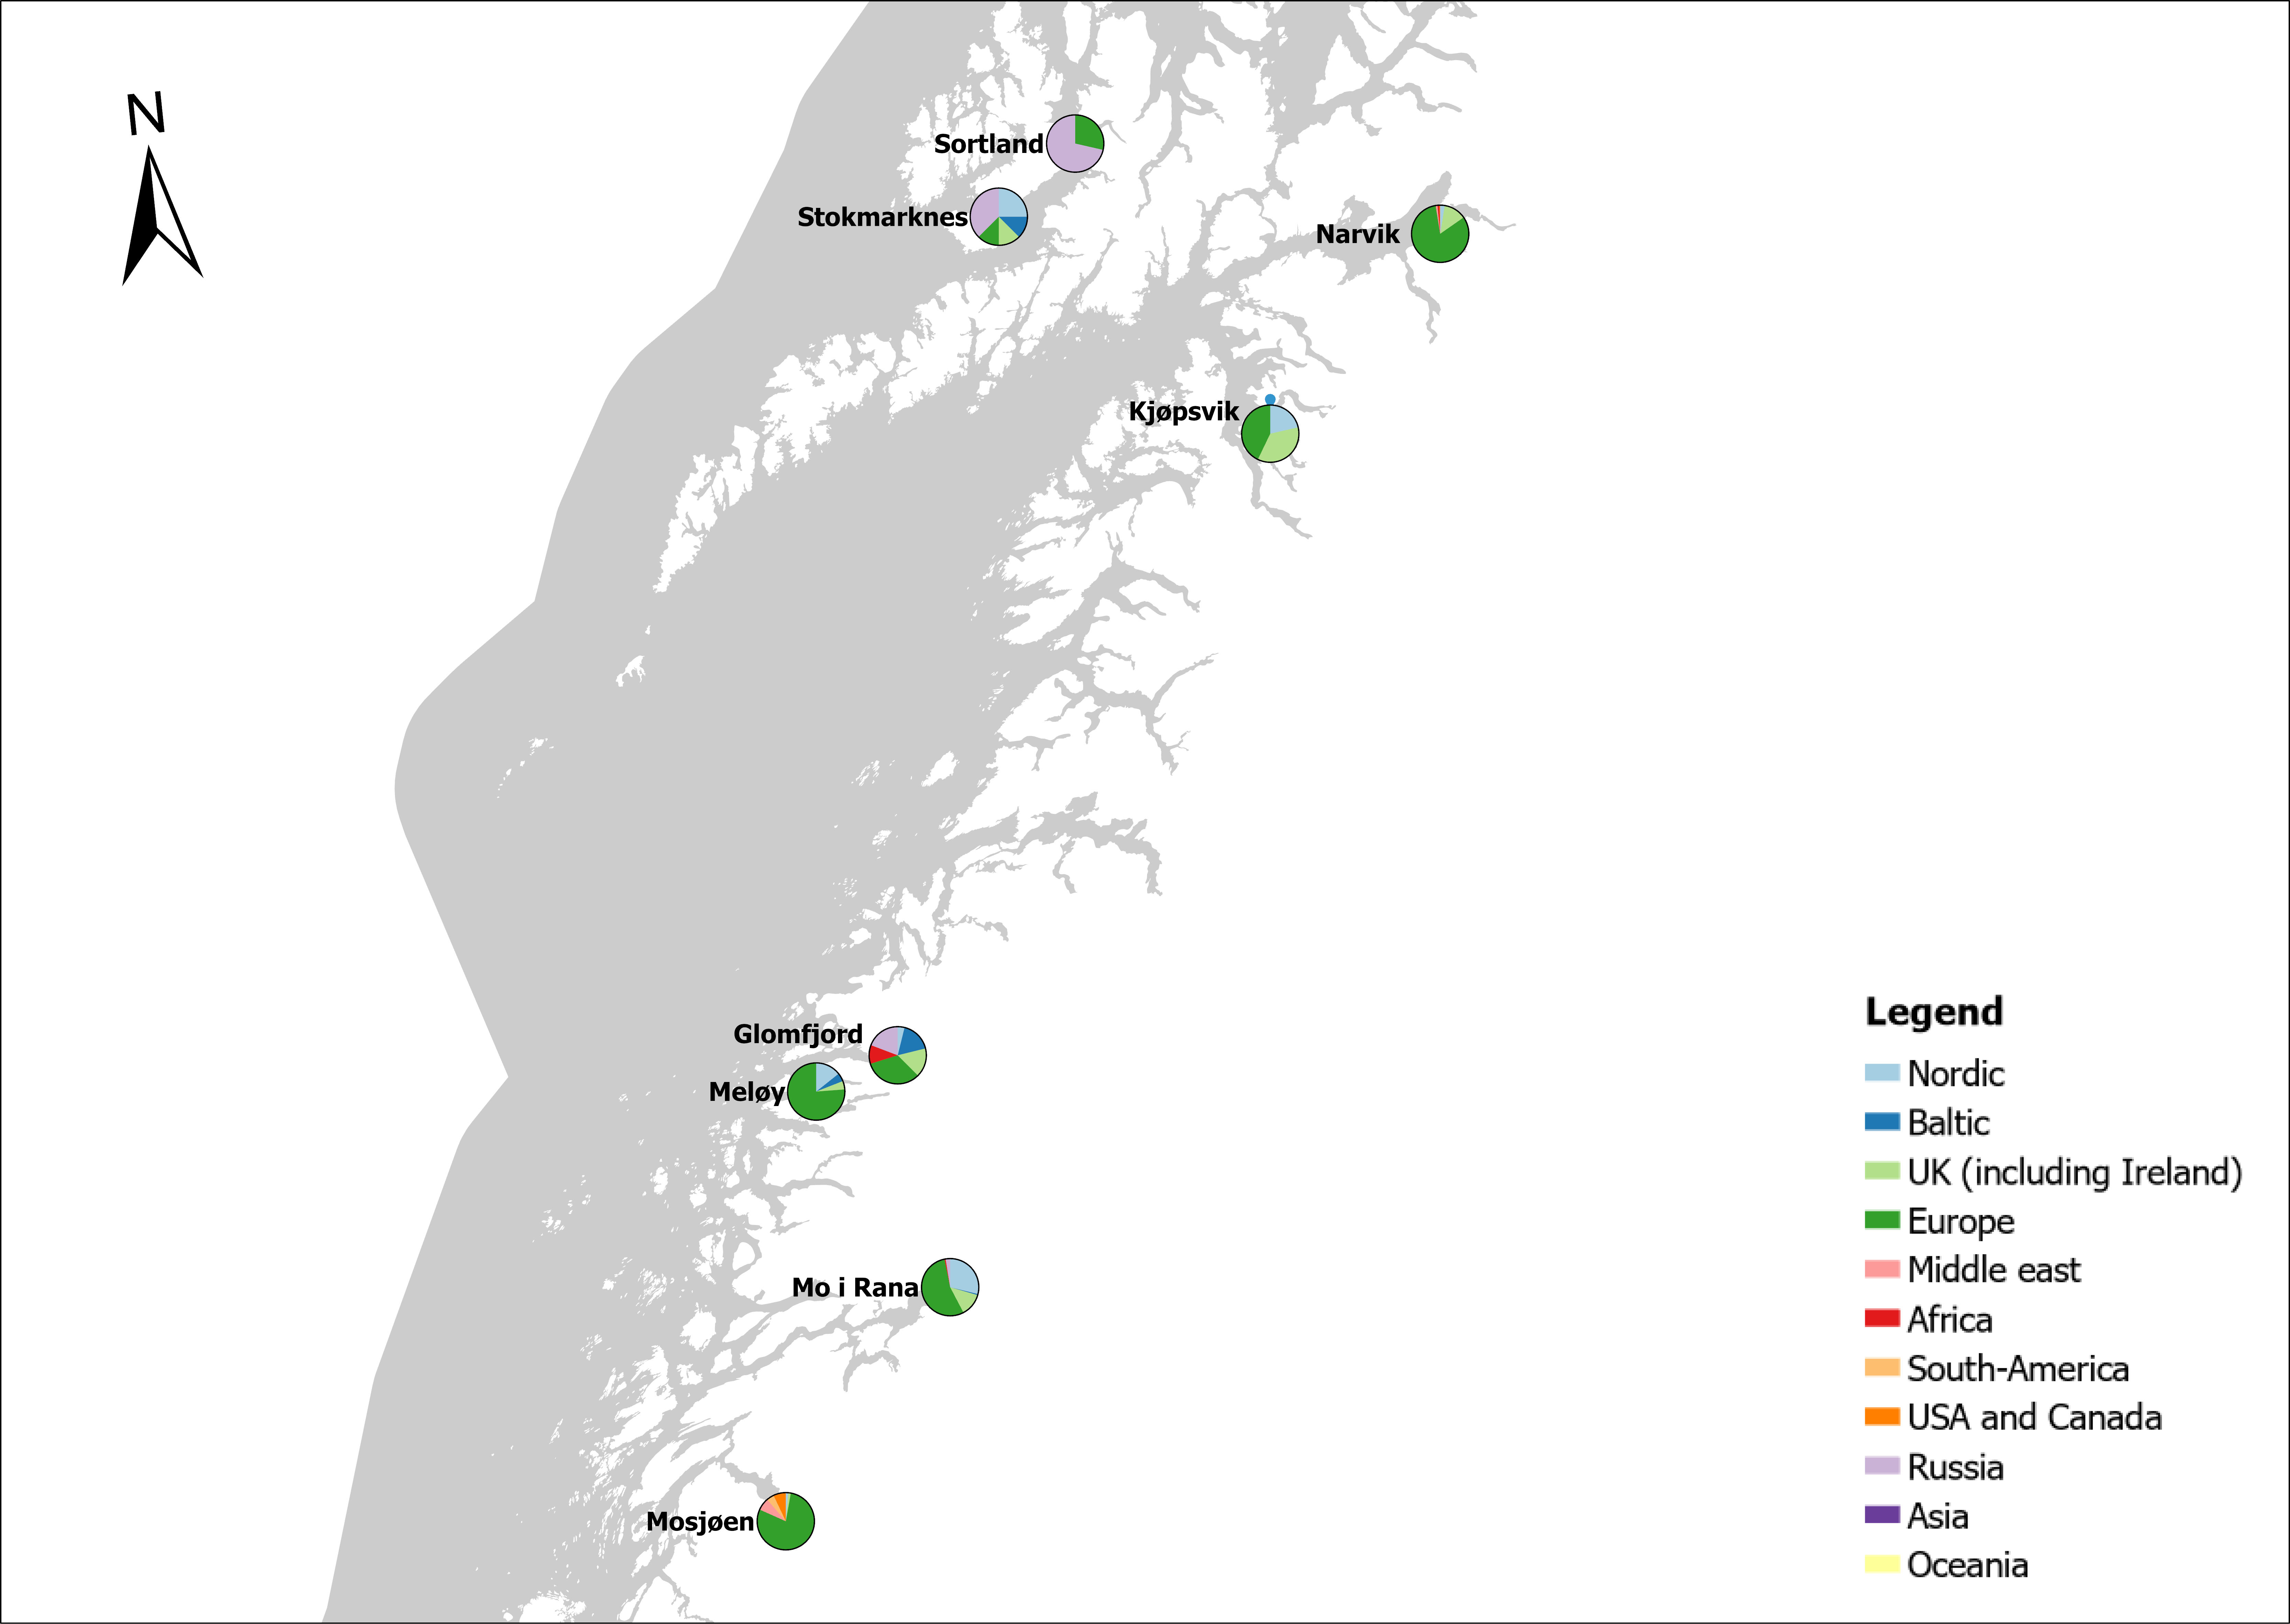
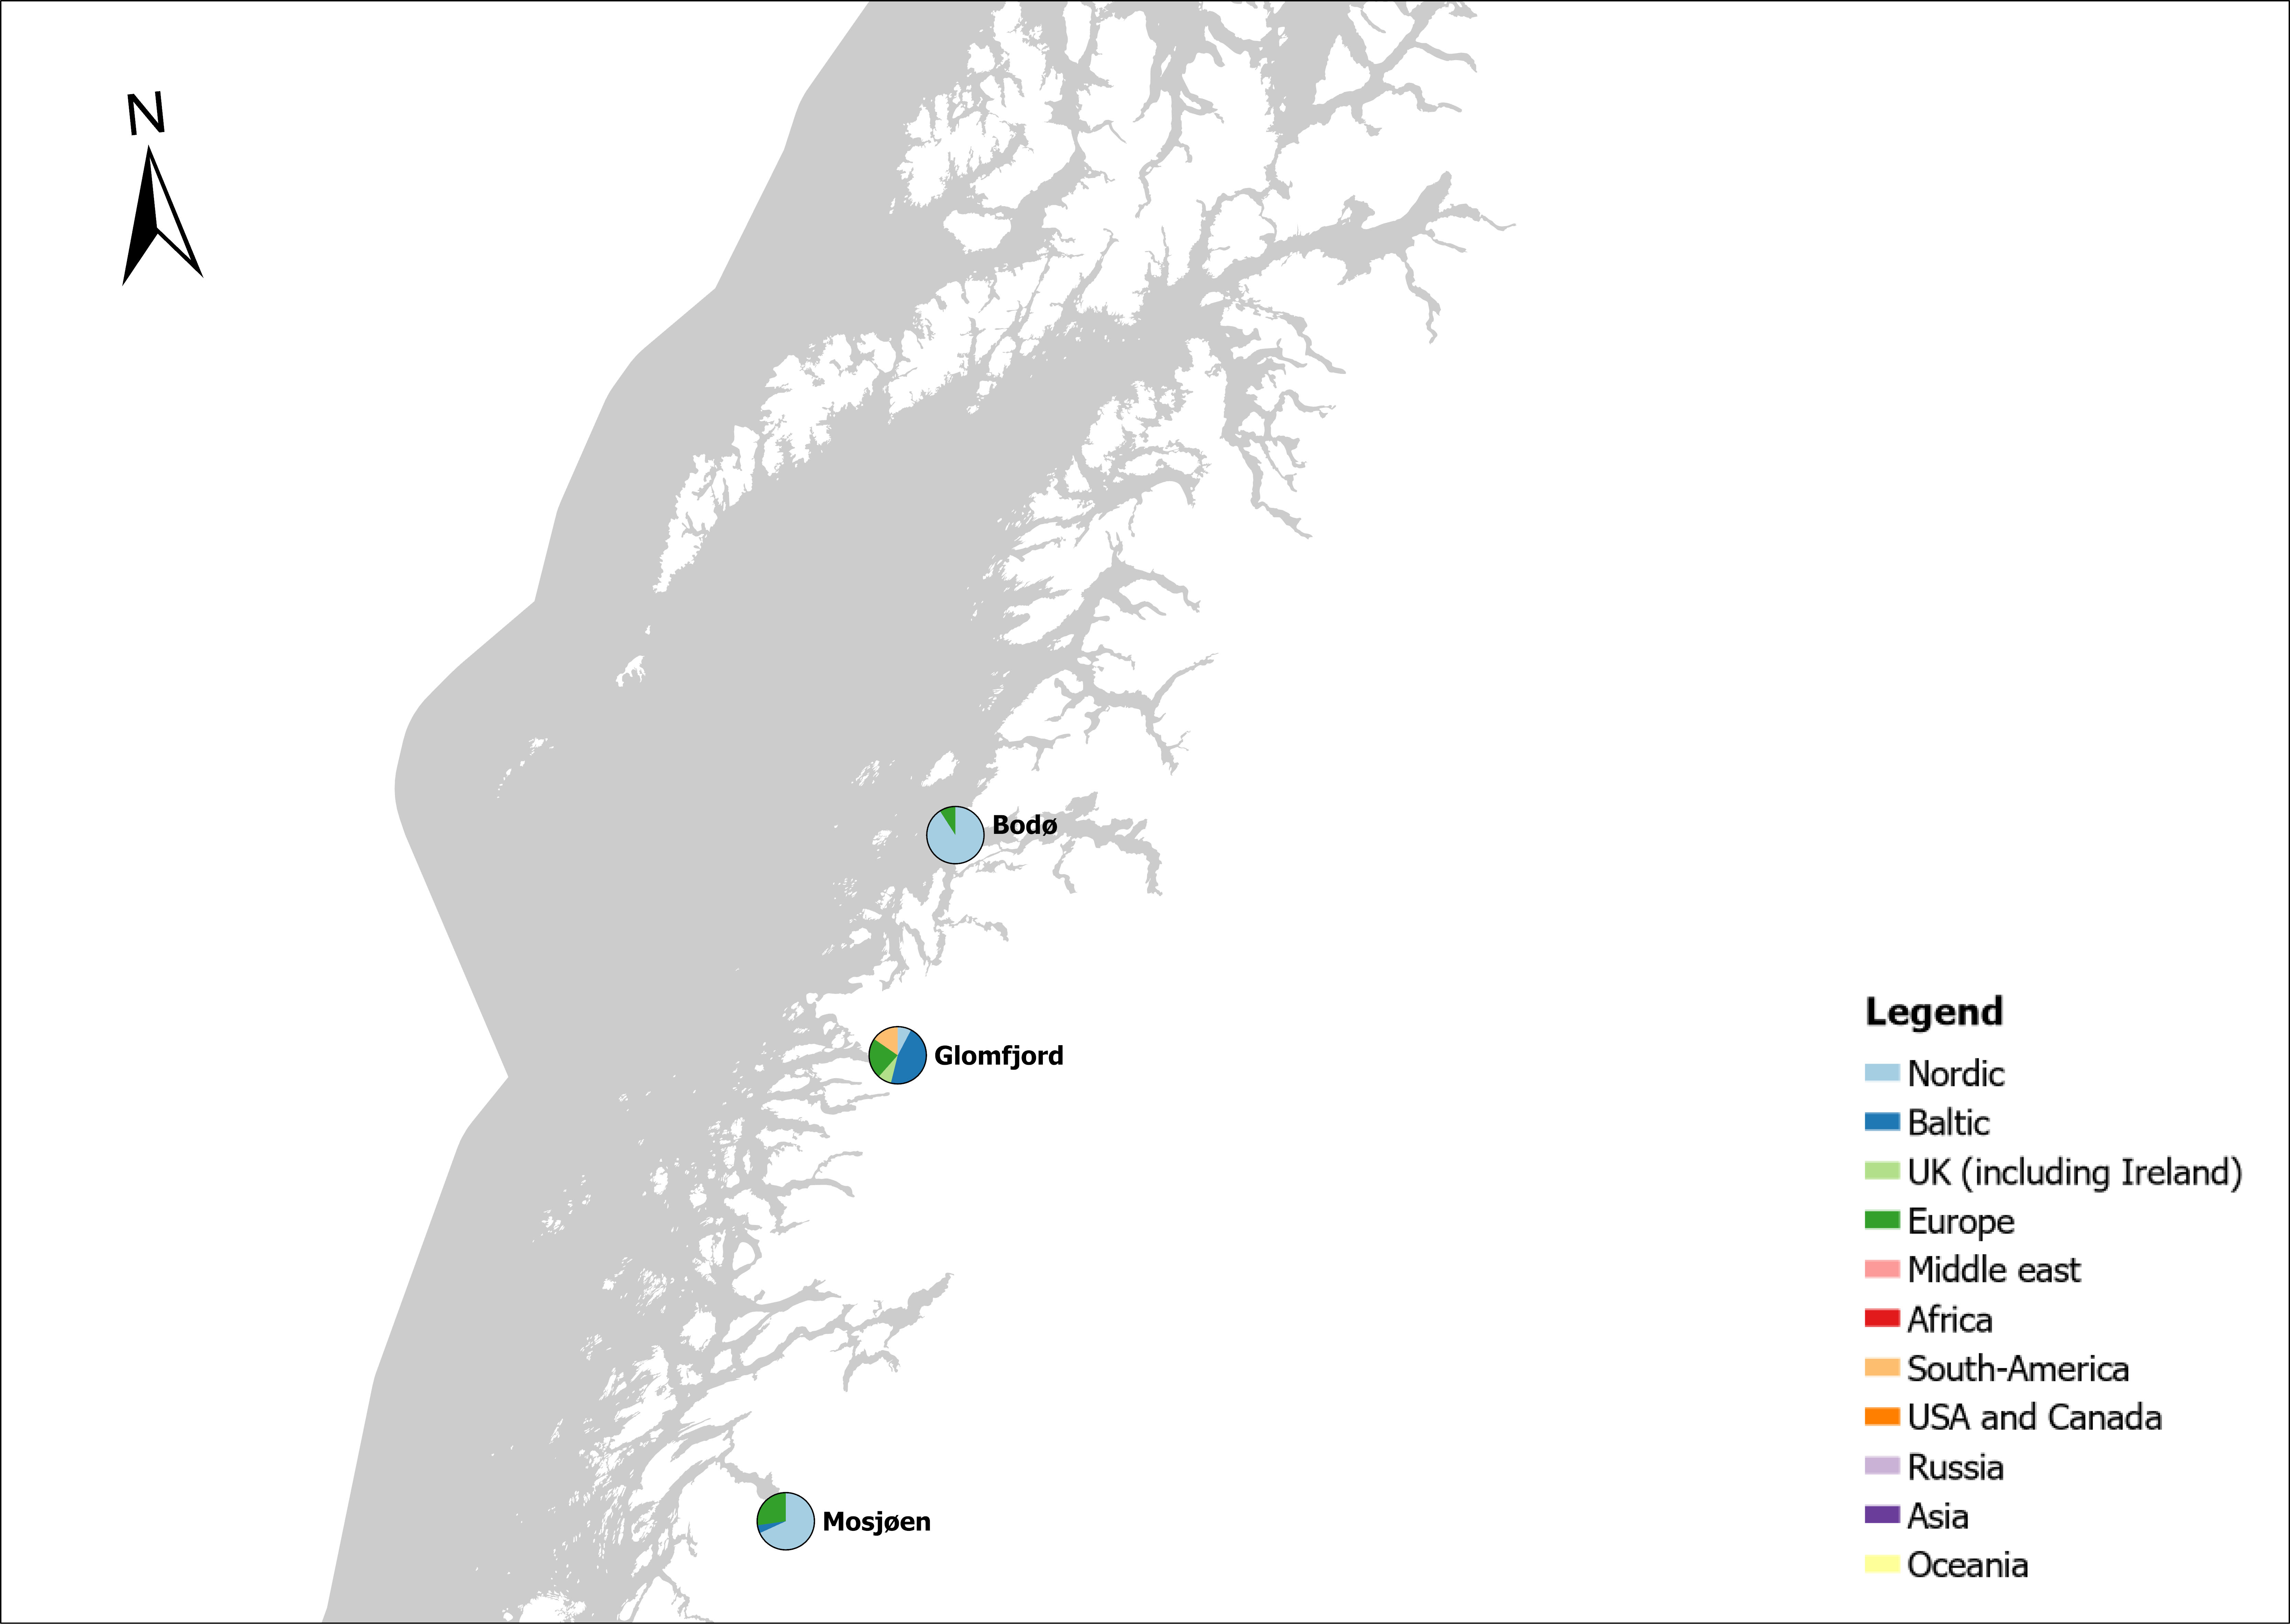
The group tankers include vessels from small harbour tankers to large oil and LNG tankers. A total estimated number of 17 200 tankers arrived annually in Norwegian ports in 2020-2021. The highest estimated number of tanker arrivals was in Mongstad port (2607) of which 1642 of the arrivals were from a foreign port followed by Rafnes (542) of which 434 was from a foreign port and Kårstø (500) of which 467 where of foreign origin. Several other ports had a high number of foreign tankers such as Fredrikstad (206), Slagen (196), Sture (183), Porsgrunn (180) and Elnesvågen (150) (Figure 22). (Detailed data is available in Appendix 1, Table 3).
Figure 22. (Left): Annual number of arrivals of tankers into Norwegian ports. Shipping intensity for this group shown as routes/ km 2/year. (Right): Annual number of foreign tanker arrivals into Norwegian ports. Annual arrivals are estimated for ports which receives >500 arrivals a year (Data from Marine Traffic and EMODnet).
3.3.3 - Tugs and special crafts
The group ‘tugs and special crafts’ contains various types of vessels; small harbour tug, rescue boats, large international tugs and crane vessels, barges, all types of support vessels for the oil industry. A total estimated number of 144 848 ‘tugs and species craft’ port calls annually in Norwegian ports in 2020-2021. As the map of route density shows most of the long-distance traffic is going between Norwegian ports and the oil fields in the North Sea and the Norwegian Sea (Figure 23). The highest estimated number of arrivals in this group was in Oslo (22813), followed by Brevik (14038) and Tromsø (4803). Oslo port had the highest number of foreign arrivals (1506), followed by Bergen (155), Brevik (112), Tananger (109) and Stavanger (102) (Figure 23). (Detailed data is available in Appendix 1, Table 2).
Figure 23. (Left): Estimated annual number of arrivals of tugs and special crafts into Norwegian ports. Shipping intensity for this group shown as routes/ km 2/year. (Right): Percent annual foreign tugs and special crafts arrivals into Norwegian ports. (Data from Marine Traffic and EMODnet).
3.3.4 - Fishing vessels
The group fishing vessels contains small local fishing boats that goes in and out of the same harbour frequently to larger trawler. A total estimated number of 104 926 fishing vessels arrived annually in Norwegian ports in 2020-2021, of which 1,3 % was of foreign origin. As the map of route density shows there is high activity along the entire coast of the North Sea and the Norwegian Sea (Figure 24).
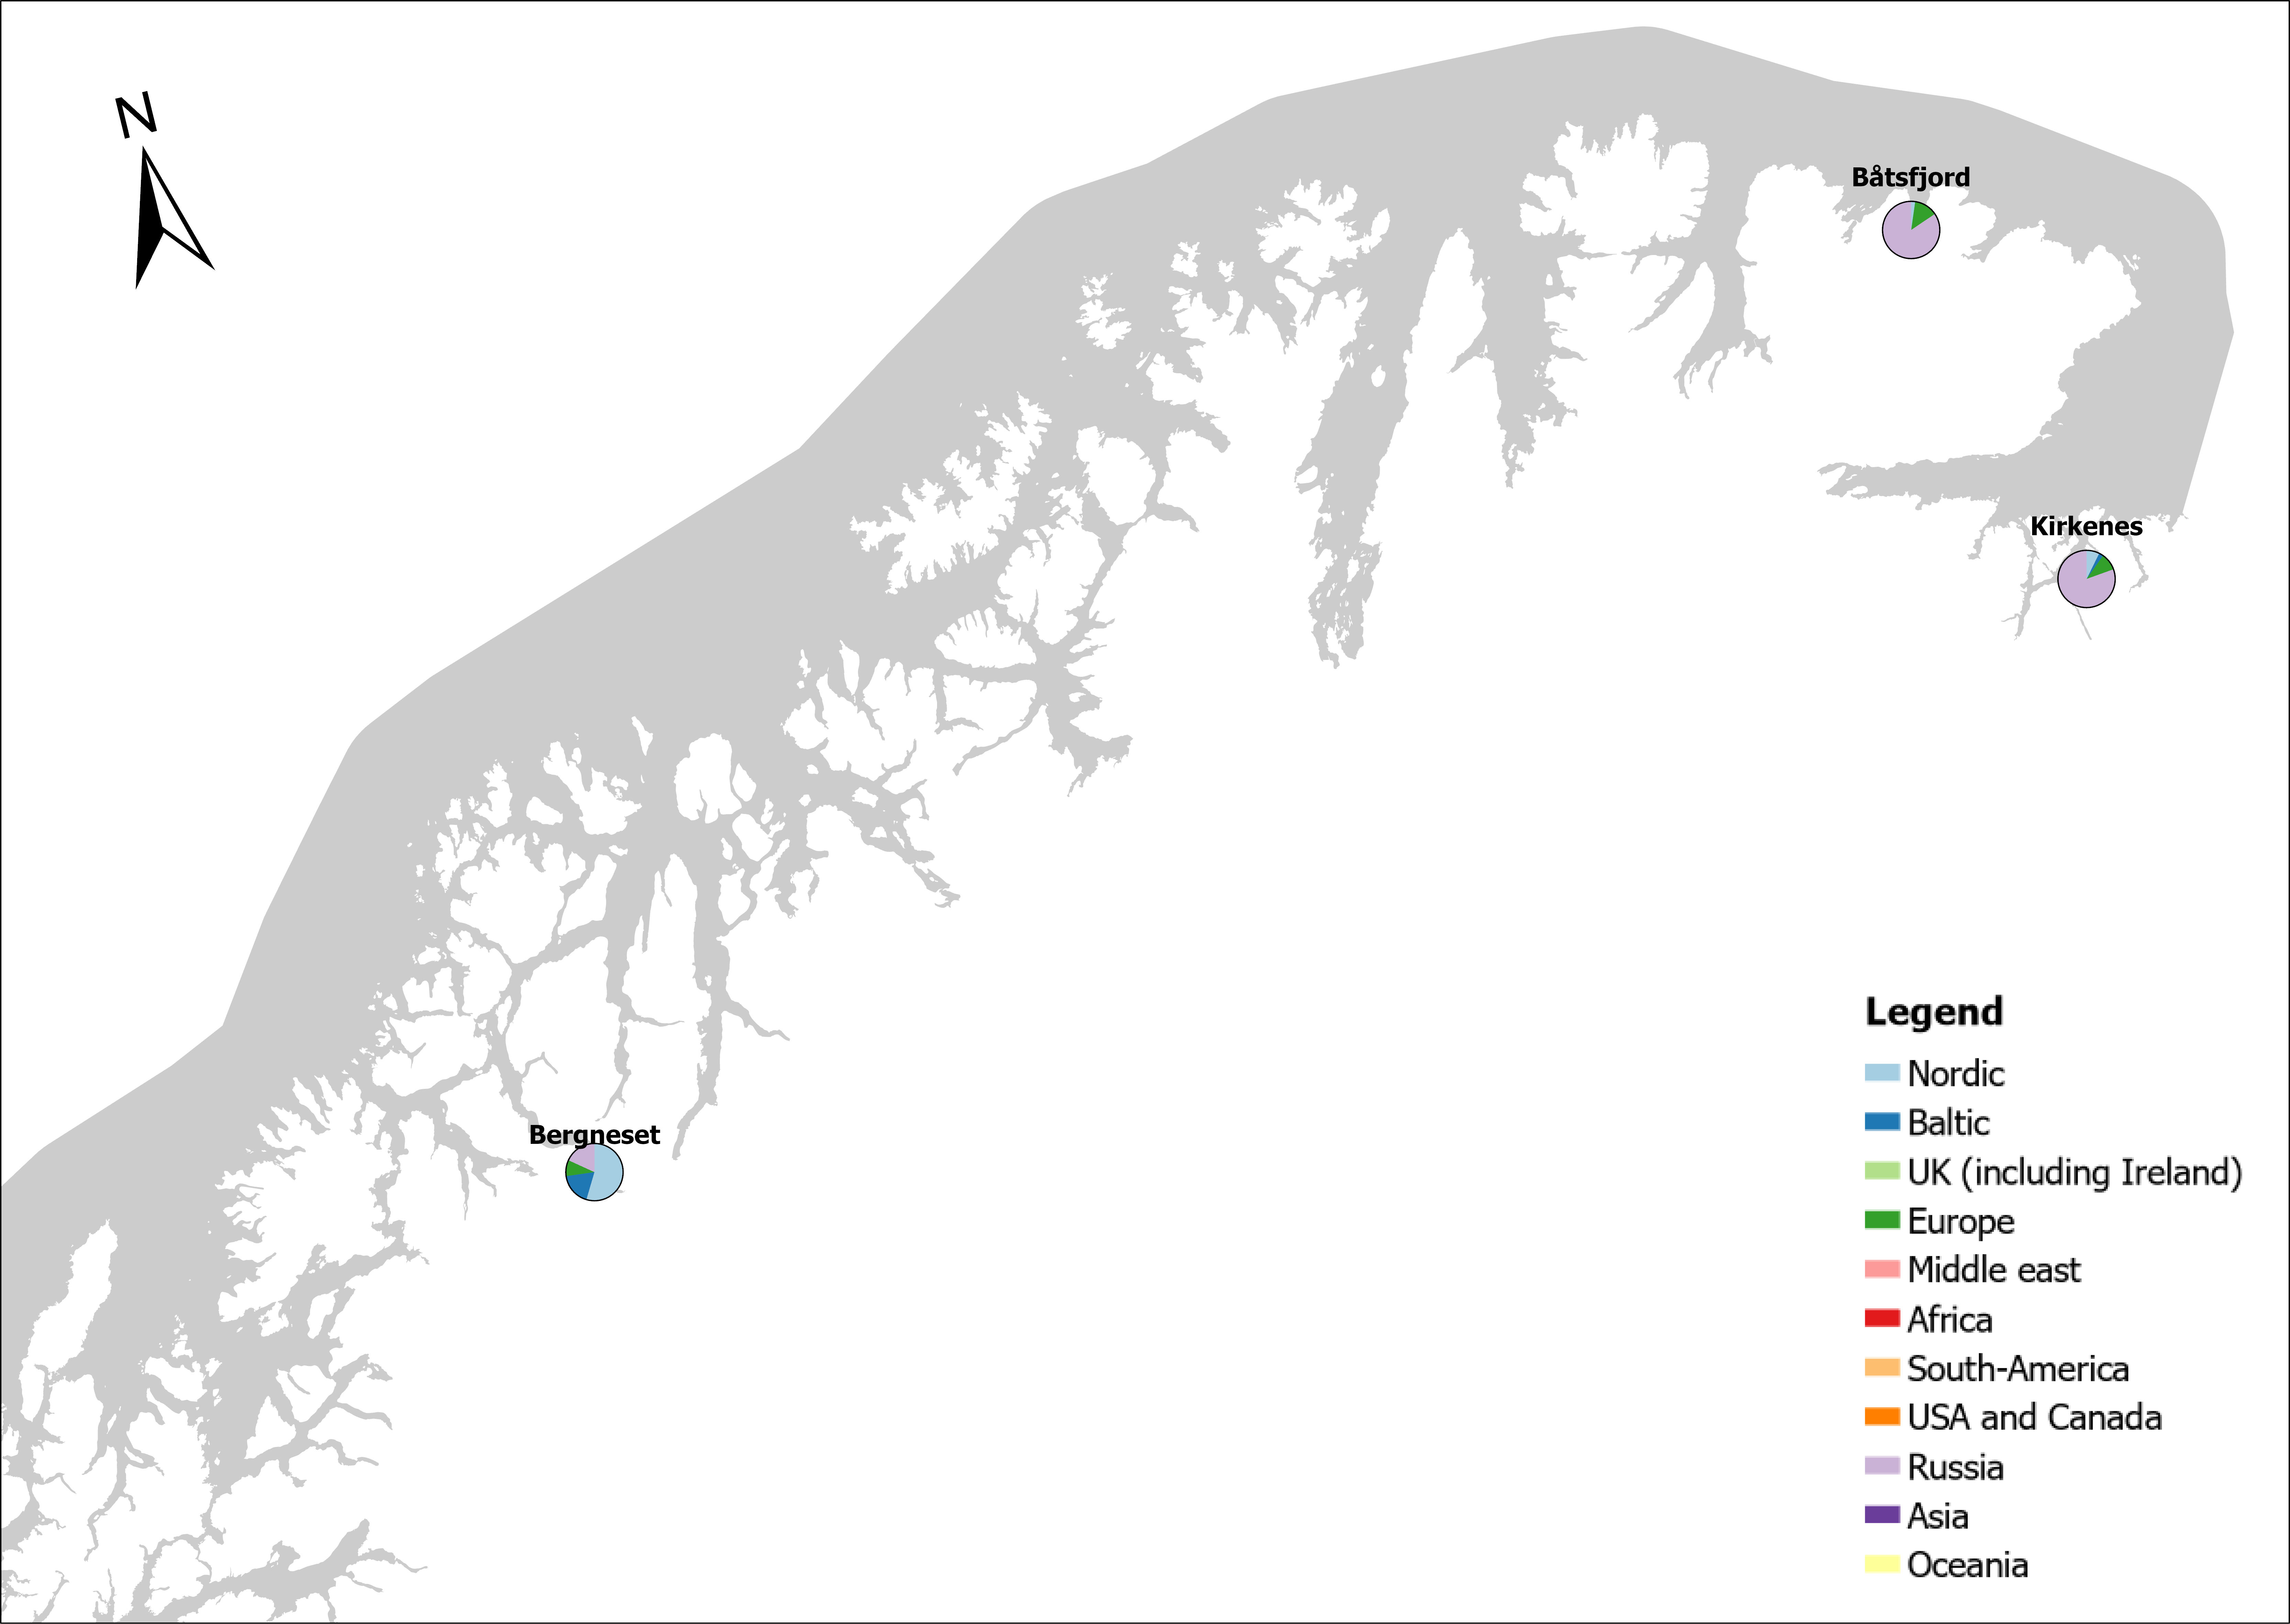
The highest estimated number of arrivals of fishing vessels in this group was in Tromsø (10139) of which none was of foreign origin. The same is the case for larger fishing port ranging from 3967 to 2340 annual arrivals such as Båtsfjord, Vardø, Vadsø, Honningsvåg, Rørvik, Måløy, Kristiansund and Ålesund (Foreign share 0-1%).
The highest share of foreign fishing vessels was in Kirkenes in the north (30%) where most of the boats came from ports in Northern Russia and a few from Iceland and Lithuania. Kristiansand in the south have 10 % share of foreign fishing boats most of them coming in from Denmark. Ports in the Skagerrak and North Sea area receives a relatively low share of fishing vessels, most of them coming from the other Nordic countries but also GB, Ireland, Iceland, Faroe Islands and Germany (Figure 24).
Figure 24. Estimated annual number of arrivals of fishing vessels into Norwegian ports. Shipping intensity for this group shown as routes/ km 2/year. (Data from Marine Traffic and EMODnet).
3.3.5 - Passenger vessels and leisure crafts
3.3.5.1 - Ferries
There is frequently ferries (ro-ro passenger) going back and forth to Denmark, Sweden and Germany and into Norwegian ports. The ports of Tananger, Kristiansand and Larvik had respectively 212 and 500 arrivals from Hirtshals in Denmark. Oslo received 51 ferries from Fredrikshavn in Denmark and 168 from Kiel in Germany. The port of Sandefjord received 498 arrivals from Strømstad in Sweden.
3.3.5.2 - Leisure craft
The majority of port calls in this group are boats going in and out of the marina daily or travellers along the coast during summer season. The ports along in the Skagerrak area and Oslofjord received also some travellers from Sweden and Denmark. Occasionally some port received boats from Iceland, Faroe Island, GB, Ireland, The Netherlands, Germany and the Baltic Sea. In a normal year with no Covid-19 restriction there is probably more leisure craft arrivals from abroad.
3.3.5.3 - Cruise ships
The cruise traffic in Norway has increased steadily the last decades from 1033 arrivals in 1993 to 2159 in 2018 (Dybedal 2018). The number of cruise passenger has in the same period been four-doubled, which means that the ships arriving is larger than before. Bergen is the busiest cruise port in Norway, followed by Geiranger, Stavanger, Ålesund, Flåm, Tromsø, Nordkapp and Oslo.
The last two years the activity has been low in all ports due to Covid-19 restrictions. Many of the cruise ships are sailing in warmer parts of the world during winter and returns to European port to get ready for cruises up north in spring/early summer.
To get a picture of the origin of cruise ships to the Norwegian coast an analysis of the last port before arrival for 378 cruise ships into Bergen in 2019 is performed. Most of the cruise ships came from other Norwegian cruise harbours, which reflects that passengers are flown in and the ships goes back and forth along the coast (Figure 25). The foreign arrivals were from Germany, Denmark, Belgium, the Netherlands, Great Britain, Iceland, and Faroe Islands. 12 ships came from the northeast coast of the US (not shown in map in Figure 25).
Figure 25. Last port call before arrival in Bergen for 378 cruise ships in 2019 (Data and map: Bergen Port Authorities).
3.3.6 - Svalbard
The two ports in Svalbard, Longyearbyen og Ny-Ålesund, had 2117 annual port calls in 2020-2021 (Figure 26). Seven of the vessels came from ports outside Norwegian territory, while 113 came from mainland Norway. The seven foreign vessels were leisure crafts from Iceland, Belgium and Poland. As figure 26 shows there is high fishing activity around Svalbard, but few boats go into the ports.
Figure 26. Estimated annual number of arrivals of cargo (top left), tankers (top right), Special ships (bottom left) and fishing vessels (bottom right) into Svalbard ports in 2020-2021. Shipping intensity for is shown as routes/ km 2/year. (Data from Marine Traffic and EMODnet).
3.3.7 - The ports behind the ports
The Norwegian coast is long and for smaller vessels coming from abroad it is more and more likely that they have stopped in several Norwegian harbours before entering northern Norway. This will of course be reflected as bias in the data and probably underestimate the vector as going northwards along the coast. Larger boat like tankers and large cargo vessels with a specific task in one harbour is more likely to go directly from international waters into Norwegian ports. Furthermore, many vessels come from large ports in UK and western Europa such as Aberdeen, Rotterdam and Amsterdam. Though many of them most likely have had an operational area the last year which covers a much larger geographical span. To uncover the full picture, one must assemble historical data on each vessel in Marine Traffic, which is an almost impossible task when the number of arrivals exceeds 150 000. To elucidate this problem, we have picked 20 of the last arrivals from Rotterdam into Rogaland County in the groups cargo and tankers which clearly shows that the geographical origin of species on arriving vessels might be much larger (Figure 27). The number of vessels operating in area exceeds 40 since most ships have been in several areas. An analysis of the ports visited during 2019 by cruise ships that visited Bergen port that year also shows the extent of wider operation area of vessels. The cruise ships have visited ports all around the world during that year before entering European waters. Each vessel had a mean number of 75 port call during 2019 (Figure 28).
Figure 27. Operational area the last year of 40 randomly selected vessels (cargo & tankers) entering ports (Haugesund, Tananger and Kårstø) in Rogaland from Rotterdam in 2021 (Data from Marine Traffic).
3.3.8 - Geographical distribution and origin of foreign arrivals in Norwegian Counties
Number of annual arrivals is based on manually counted arrivals in each vessel group but gives a skewed picture since only the last 500 port calls are shown in Marine Traffic history. Given the rate of vessels coming from abroad are approximately the same during the year, an estimate of the number of foreign arrivals into ports with >500 arrivals a year is calculated (Figure 29).
Viken & Oslo is the county with the highest annual number of foreign arrivals (3738) in the groups cargo, tankers and special crafts, followed by Rogaland (3585) , Vestland (3197) and Vestfold & Telemark (2293). Svalbard had no records of vessels in this group coming from countries outside Norway, but 113 arrivals from mainland Norway. Rogaland had the highest number of cargo vessels coming from abroad, Vestland the highest number of tankers, while Viken & Oslo had the highest number of foreign special crafts (Figure 29).
Figure 29. Annual foreign arrivals (estimated for ports with >500 annual arrivals) in the groups cargo, tanker and special crafts in Norwegian Counties (Data from Marine traffic).
3.3.8.1 - Viken & Oslo, Vestfold & Telemark
These are the four counties surrounding the inner and outer Oslofjord. Viken and Oslo receives annually 3738 foreign arrivals in the groups cargo, tankers, tugs and special crafts. Cargo vessels represents the largest group with 1859 arrivals, followed by tugs and special craft (1536) and tankers (343). Vestfold & Telemark receives annually 2293 foreign arrivals in these groups. Cargo vessels represents the largest group with 1316 arrivals, followed by tankers (915) and tugs & special craft (62). For detailed information on each port and vessel type see Appendix 1, Table 1, 2, 3. For detailed data on origin of foreign vessels see Appendix 2, Table 1.
Cargo into this region mainly originates from European countries like the Netherlands, Belgium, Germany, Spain, UK, Sweden and Denmark and countries in the Baltic area. The industrial ports of Brevik and Porsgrunn receives some cargo from the Middle east, North Africa, and Asia (Figure 30). Fredrikstad had some arrivals of cargo from Brazil and Canada (Figure 30).
Tankers into this area mainly originates from European countries like the Netherlands, Belgium, Germany, Spain, UK, Sweden and Denmark and countries in the Baltic area, as well as a fair share of arrivals from USA, India, Oceania, and Brazil (Figure 31).
Tugs and special crafts of foreign origin comes mainly into the port of Oslo from Sweden and Denmark, the Netherlands, Belgium, Germany and Poland (Figure 32). The port of Slagen receives frequently vessels from Denmark and the port of Drammen from the Netherlands, Germany, and Sweden.
Figure 30. Origin (last port) of 3175 cargo vessels arriving in ports in the counties Oslo, Viken, Vestfold & Telemark in the period October 2020-2021 (Data from Marine Traffic).
Figure 31. Origin (last port) of 1258 tankers arriving in ports in the counties Oslo, Viken, Vestfold & Telemark in the period October 2020-2021 (Data from Marine Traffic).
Figure 32. Origin (last port) of 1598 tugs and special crafts arriving in ports in the counties Oslo, Viken, Vestfold & Telemark in the period October 2020-2021 (Data from Marine Traffic).
3.3.8.2 - Agder
The ports in Agder have a relatively low annual share of foreign arrivals in the groups cargo (518), tankers (8), and tugs and special crafts (62). For detailed information on each port and vessel type see Appendix 1, Table 1, 2, 3.
Cargo into this region mainly originates from European countries like the Netherlands, Belgium, France, Spain, Germany, UK, Sweden and Denmark and countries in the Baltic area. Kristiansand port receives several cargo vessels from Canada. Eydehavn and Grimstad additionally have some arrivals from the Mediterranean and North African countries (Figure 33).
Farsund, Mandal, Kristiansand and Arendal are the port that receives most foreign tugs and special craft, mostly arriving from Denmark, Germany, Sweden, Finland, and UK (not shown in map).
The only port which received tankers from abroad were Farsund, with eight arrivals from Sweden (not shown in map).
Figure 33. Origin (last port) of 487 cargo vessels arriving in ports in Agder County in the period October 2020-2021 (Data from Marine Traffic).
3.3.8.3 - Rogaland
Rogaland receives annually 3738 foreign arrivals in the groups cargo, tankers, tugs and special crafts. Cargo represents the largest group with 2402 arrivals, followed by tankers (749), and tugs and special crafts (434). For detailed information on each port and vessel type see Appendix 1, Table 1, 2, 3. For detailed data on origin of foreign vessels see Appendix 2, Table 1.
The majority of cargo vessel comes in from the Netherlands, followed by Germany, UK, Sweden, Denmark and the Baltic Sea. Some vessels come from further south in Europe, France, Spain and the Mediterranean, also on the African side and South Africa (Figure 34).
The oil terminal at Kårstø is the port with the highest traffic of tankers with annual arrivals of 500 vessels, of which 91 % comes from a port abroad. Tankers into this port arrives mainly from the Netherlands, France, Germany, UK (including Ireland), Sweden and the Baltic Sea. Some vessels also arrive from the Mediterranean, Africa, North and South America (Figure 35).
The ports in Haugesund and Husøy receives most special crafts from UK and Denmark with some vessels coming from the Netherlands and Germany, USA, Angola and South Africa. The port of Stavanger and the nearby ports receives most special crafts from UK and the Netherlands, with some arrivals from other European, Nordic and Baltic countries, the Mediterranean, Africa, India and USA (Figure 36).
Figure 34. Origin (last port) of 2402 cargo vessels arriving in ports in Rogaland County in the period October 2020-2021 (Data from Marine Traffic).
Figure 35. Origin (last port) of 4342 tankers arriving in ports in Rogaland County in the period October 2020-2021 (Data from Marine Traffic).
Figure 36. Origin (last port) of 434 tugs and special crafts arriving in ports in Rogaland County in the period October 2020-2021 (Data from Marine Traffic).
3.3.8.4 - Vestland
Vestland receives annually 3197 foreign arrivals in the groups cargo, tankers, tugs and special crafts. Tankers represents the largest group with 1913 arrivals, followed by cargo (946), and tugs and special crafts (338). For detailed information on each port and vessel type see Appendix 1, Table 1, 2, 3. For detailed data on origin of foreign vessels see Appendix 2, Table 1.
Florø is the port that receives most foreign cargo vessels, followed by Odda, Måløy and Sløvåg. Cargo vessel into this county mainly arrives from the Netherlands, followed by UK, Germany, Sweden, France, Denmark and the Baltic Sea. Odda has a fair share of vessels from Spain, Portugal, and North Africa. The industrial ports of Høyanger and Husnes have several arrivals from Brazil (Figure 37).
The port of Mongstad has the highest traffic of tankers with annual arrivals of 2607 vessels, of which 63 % comes from a port abroad. The oil terminal at Sture is the second largest port in this group with 203 arrivals where 90 % comes from abroad. Tankers into these ports arrives mainly from the Netherlands, France, Germany, UK (including Ireland), Sweden, Denmark and the Baltic Sea. Some vessels also arrive from the Mediterranean, Africa, North & South America, the Arabic Gulf and Asia (Figure 38).
Bergen is the port with most arrivals of foreign tugs and special crafts, followed by Florø, Mongstad, Måløy and Ågotnes. Most of the vessels arrives from UK and Denmark with some vessels coming from the Netherlands and Germany, Sweden, Denmark and the Baltic Sea. Note that the records of vessels from Africa in the port of Torangsvåg is based on one recorded vessel from Angola and is mistakenly included in the data (Figure 39).
Figure 37. Origin (last port) of 946 cargo vessels arriving in ports in Vestland County in the period October 2020-2021 (Data from Marine Traffic).
Figure 38. Origin (last port) of 1913 tankers arriving in ports in Vestland County in the period October 2020-2021 (Data from Marine Traffic).
Figure 39. Origin (last port) of 338 tugs and special crafts arriving in ports in Vestland County in the period October 2020-2021. Note that the records of vessels from Africa in the port of Torangsvåg is based on one recorded vessel from Angola and is mistakenly included in the data (Data from Marine Traffic).
3.3.8.5 - Møre & Romsdal
Møre & Romsdal have relatively few arrivals from foreign ports (508), but this far north on the coast there is a high probability that vessels arriving from a Norwegian port have a wider international operating area. The area receives 270 cargo vessels, 194 tankers and 44 tugs and special crafts. For detailed information on each port and vessel type see Appendix 1, Table 1, 2, 3. For detailed data on origin of foreign vessels see Appendix 2, Table 1.
Ålesund is the port which receives most cargo vessels (2253) of which 4 % is from a foreign port followed by Kristiansund (1534) with only 1% of foreign origin. The port at Averøya receives most foreign cargo vessels (92) followed by Ålesund (90) and Sunndalsøra (37). The ports in this area mainly receives vessels from western Europe, Sweden and Denmark, the Baltic Sea. Ålesund had some arrivals from Egypt and north Africa. Sunndalsøra had 19 arrivals from Brazil and 2 from USA (Figure 40).
The port of Elnesvågen has the highest number of foreign tankers arriving (150) mainly from the Netherlands, Germany, and Sweden but also some from other European ports, the Baltic and North Africa. Kristiansund and Averøya have some arrivals of tankers from European, Nordic and Baltic ports (Figure 41).
The only two ports that had arrivals of foreign tugs and special crafts was Ulsteinvik with seven vessels and Ålesund with 15 vessels from UK, Germany, Denmark, Poland and Turkey (not shown in map).
Figure 40. Origin (last port) of 270 cargo vessels arriving in ports in Møre & Romsdal County in the period October 2020-2021 (Data from Marine Traffic).
Figure 41. Origin (last port) of 194 tankers arriving in ports in Møre & Romsdal County in the period October 2020-2021 (Data from Marine Traffic).
3.3.8.6 - Trøndelag
Trøndelag had relatively few arrivals from foreign ports (228), but this far north on the coast there is a high probability that vessels arriving from a Norwegian port have a wider international operating area. The area receives 162 cargo vessels, 45 tankers and 21 tugs and special crafts. For detailed information on each port and vessel type see Appendix 1, Table 1, 2, 3. For detailed data on origin of foreign vessels see Appendix 2, Table 1.
Cargo vessels from foreign ports in this county is only coming into the ports of Orkanger (71), Trondheim (35) and Verdal (56). Origin of cargo vessels into these ports are mainly the Netherlands, Spain (Verdal), UK, Sweden, Denmark and Poland (Figure 42).
Trondheim is the only port which received >5 foreign tankers in this county (41), most of them arriving from Sweden and some from the Netherlands (not shown in map).
Verdal is the only port which received >5 foreign tugs and special craft in this county (12), most of them arriving from the Netherlands, Germany, Denmark and Spain (not shown in map).
Figure 42. Origin (last port) of 162 cargo vessels arriving in ports in Trøndelag County in the period October 2020-2021 (Data from Marine Traffic).
3.3.8.7 - Nordland
Nordland have relatively few arrivals from foreign ports (806), but this far north on the coast there is a high probability that vessels arriving from a Norwegian port have a wider international operating area. The area receives 738 cargo vessels, 52 tankers and 16 tugs and special crafts. For detailed information on each port and vessel type see Appendix 1, Table 1, 2, 3. For detailed data on origin of foreign vessels see Appendix 2, Table 1.
Cargo vessels in this county mainly comes from countries around the North Sea, Nordic and Baltic countries. The industrial port in Glomfjord additionally receives vessels from northern Russia and Morocco. Mosjøen have also several cargo vessels coming in from Spain, Turkey, USA and Brazil. The port of Narvik, which have been shipping out minerals from Kiruna in more than 100 years, received additional vessels from Turkey, Morocco, Saudi Arabia, USA, India and Egypt. Sortland and Stokkmarknes had a low number of visits but a fair share of cargo vessels from northern Russia (Figure 43).
Mosjøen, Bodø and Glomfjord are the only ports which received >5 foreign tankers in this county, most of them arriving from Sweden and Denmark and some from other European and Baltic countries. Glomfjord had additional one port call from Trinidad (Figure 44).
None of the 21 ports examined in Nordland had >5 foreign tugs and special craft, and the origin of the 16 vessels in this group is therefore not noted.
Figure 43. Origin (last port) of 738 cargo vessels arriving in ports in Nordland County in the period October 2020-2021 (Data from Marine Traffic).
Figure 44. Origin (last port) of 52 tankers arriving in ports in Nordland County in the period October 2020-2021 (Data from Marine Traffic).
3.3.8.8 - Troms & Finnmark
Troms & Finnmark had the lowest number of arrivals from foreign ports (126), but this far north on the coast there is a high probability that vessels arriving from a Norwegian port have a wider international operating area. The area receives 126 cargo vessels, 30 tankers and 32 tugs and special crafts. For detailed information on each port and vessel type see Appendix 1, Table 1, 2, 3. For detailed data on origin of foreign vessels see Appendix 2, Table 1.
Cargo vessels from abroad mainly arrived in Kirkenes (41), Båtsfjord (45), Tromsø (22) and Bergsneset (11). The vessels mainly came from northern Russia and the Netherlands, Iceland and the Faroe Islands and from Denmark and the Baltic Sea (Figure 45).
Tromsø and Harstad are the only ports that received >5 tankers from abroad, mainly originating from Sweden, but also some port calls from the Netherlands UK and Denmark (not shown in map).
Kirkenes is the only port that received >5 tugs and special craft from abroad, mainly originating from northern Russia and the Netherlands (not shown in map).
Figure 45. Origin (last port) of 126 cargo vessels arriving in ports in Troms & Finnmark County in the period October 2020-2021 (Data from Marine Traffic).
3.4 - Import and sale of living seafood
Handling of living imported seafood is regulated by law (Anon. 2015). Keeping imported organisms in containers requires measurements to avoid escape and emission of larvae in the waste water. Moreover is the seller responsible to inform customers that this is an alien species and how to prevent it from entering the environment.
Live Pacific oysters (Crassostrea gigas) are imported from France and The Netherlands to supply the Norwegian market for live oysters. There is no control of oyster diseases, as the oysters are classified as food and destined for “the table”, without repacking or re-laying. The oysters come from dispatch centres and are usually packed in units that fits the restaurant or fresh seafood market. This minimizes the risk associated with re-laying in tank units without proper water treatment or in open waters. It is difficult to get hold of information on which species of bivalves are imported for consume to the Norwegian market. Well assorted seafood shops offer living oysters, razor clams, cockles and various hard shell clams etc. but it is difficult to know whether they are of Norwegian origin without a more throughout investigation (Figure 46).
The extensive import of living American lobster into Europe, has led to several records of this species in Norway. Lobsters were often found with stripped claws and had most likely escaped from containers in the sea. In 2016 it became illegal to import living oysters to Norway. One company has a dispensation from this regulation, but the living lobster is kept in escape secured containers and waste waters is filtered and UV-radiated. The lobster is cooked before it goes to the marked. After 2017 there has been no records of American lobsters in Norway, but wild populations might be established in areas with many records or where hybrid eggs have been spawned. We have no knowledge about other crustaceans imported live to Norway.
Figure 46. Pacific oysters, razor clams and European flat oyster in a seafood shop (Photo: Fjellskål, Bergen).
3.5 - Transport of live cleaner fish
Parasitic salmon lice represent a major problem in Norwegian aquaculture and cause economic losses in the aquaculture of Atlantic salmon and rainbow trout. It also has a significant impact on wild populations of salmonids, particularly sea trout in coastal areas with aquaculture activity. Several pharmaceuticals have been used for treatment of salmon lice infestations, but over time the lice have developed resistance to these treatments, and there is a growing concern regarding the environmental impact of chemical and pharmaceutical treatments.
There is a strong incentive to find alternative methods of de-lousing. The use of cleaner fish, which pick lice from the skin of salmon and rainbow trout, has become an important tool (although this is associated with other problems). Lumpfish and several species of wrasses are transferred to the net pens and used as cleaner fish. To supply the fish farms with cleaner fish, extensive fisheries for wrasses have developed along the Swedish west coast and in southern and western Norway. In addition, there is aquaculture of ballan wrasse and lumpfish in Norway.
The Norwegian fish farming industry uses around 60 million cleaner fish annually. Most wrasses used in the fish farms are caught locally, but around 25 % are moved from South-eastern Norway and Southwestern Sweden and translocated to fish farms further north. Farms in mid-Norway are the main “importers” of live wrasses. In 2020 around 18 million wrasses were fished in Norway. In addition, around one million were fished in Sweden. When cleaner fish are introduced and escape outside their natural distribution range in Norway they are defined as regionally alien fish, which is the case for corkwing wrasse Symphodus melops and rock cook Centrolabrus exoletus (Norwegian Biodiversity Information Centre 2018).
3.5.1 - Risk factors related to translocation of live cleaner fish
Translocation of cleaner fish between distant populations can affect native populations through disease transfer and result in irreversible genetic changes if they escape. The risk associated with import and translocation of fish has been assessed by The Norwegian Scientific Committee for Food and Environment (Vitenskapskomiteen for mat og miljø, VKM) (VKM 2017, 2019), and by the Institute of Marine Research (Grefsrud et al. 2021a,b). Risk is associated both with the transfer of the fish and the transport water.
To avoid transmission of disease, it is as a general principle not possible to mix wild and farmed animals, within a farming unit, or even keep wild caught and farmed fish in proximity. Cleaner fish and salmonids may share pathogens (Erkinharju et al. 2020). Pathogens may change virulence, and polyculture with a mixture of susceptible hosts and new pathogens may trigger host-switching and adaptation to new species and environment. Repetitive long-distance transport of wild caught wrasses with unknown health status represents a risk of disease transfer. The current farm practice with its open design increases the risk of transmission between farmed and wild fish. In addition, the high density of hosts in the fish farms may also increases disease prevalence.
Reports from the Institute of Marine Research have focused on pathogenic viruses, and particularly emphasized the risk of introducing viral haemorrhagic septicaemia virus (VHSV). It has also been recommended by VKM in 2019 to start screening of cleaner fish for VHSV (VKM 2019). VHSV adapts to new hosts and habitats. VHSV is a notifiable disease that is present in wild fish (http://web.oie.int/eng/maladies/en_classification2010.htm). Outbreaks of VHS have been reported in wrasses in the Shetland Isles (Munro et al. 2015) and lumpfish in Iceland (Guðmundsdóttir et al. 2019). It is known that VHSV can transmit via food (Ahne 1980, Schönherz et al. 2012). Small wrasses are sometimes eaten by salmon or rainbow trout, particularly during the period of starvation before slaughter. Salmonids may thus be exposed to VHSV through infected wrasse. Another example is the Nerval necrosis virus (NNV) has been detected in wild Ballan, goldsinny and corkwing wrasse (Korsnes et al. 2017). NNV has been described from several marine fish species and is known from disease outbreaks in farmed Atlantic cod and Atlantic halibut (Patel et al. 2007; Grotmol et al. 1997). Different variants of the virus have been found in southern and northern parts of the distribution range of the wrasses, and translocations may lead to an import of the southern virus variant to northern areas.
Recent genetic studies show that cleaner fish escape and reproduce with local populations in the northern range, which can result in genetic changes and potentially reduced fitness in the local populations. Three species are translocated; the ballan, corkwing and goldsinny wrasses. These species live in shallow water habitats and in geographically distinct populations. Recent studies have revealed significant genetical differences between these populations. Seljestad et al. (2020) found a clear genetic break dividing Scandinavian populations of Ballan wrasse into north-western and south-eastern groups.
For corkwing wrasse, there is a large genetic break between Scandinavian and UK populations, and additionally a strong population structure within Scandinavia (Blanco Gonzalez et al. 2016, Robalo et al. 2012, Knutsen et al. 2013). The goldsinny wrasse populations are also clearly genetically divided across the North Sea (Jansson et al. 2017; 2020) but in contrast to the corkwing and ballan wrasse, goldsinny has a relatively weak population structure, but with a clear pattern of isolation-by-distance (Jansson et al. 2017).
Wrasse can escape from the salmon pens through holes in the net, small fish slipping through the mesh (Svåsand et al. 2017, Woll et al. 2013). Recent genetic studies show that cleaner fish in Trøndelag are escaping and reproducing with local populations (Jansson et al. 2017, Faust et al. 2018). Currently, it is permitted to import wrasse from Sweden during the spawning period – which probably increase the likelihood of genetic introgression.
No studies have been performed on the transport water. Repeated long-distance transport and release of un-treated water from shallow water areas represents a hazard of moving the entire microbiota from the donor habitat to the recipient habitat. This includes plankton organisms as well as propagules from benthic algae and larvae of alien mollusc, crustacean and fish species.
3.6 - Trade of species for saltwater aquaria
There is no need for permission to import marine plants, invertebrates or fish to be kept in aquaria where they cannot escape, however, there is a need to inform the Norwegian Environmental Agency (Anon. 2015). Most saltwater species in aquarium shops in Norway come from tropical or subtropical regions and will therefore most likely not be able to establish in Norway, should they be released. Based on the low probability of warm-water marine organisms surviving under Norwegian conditions if released, the risk of new invasive marine species coming from aquarium trade is considered low. However, there can be exceptions, and the possibility of buying species on the web makes it difficult to get an overview of the magnitude of this, thus better data and reporting systems is needed to increase the knowledge and reduce the uncertainty on possible impact of this vector.
3.7 - Species transported by floating debris
Attention to the ability of alien species to hitch hike with floating debris was brought to attention when a mass event of non-native species crossing the Pacific Ocean with floating debris from the tsunami disaster in Japan in 2011 took place. A study counted 289 Japanese marine species on debris along the shore (Carlton et al. 2017). Taxa in the phyla Mollusca, Annelida, Cnidaria, Bryozoan, Crustacea, Porifera, Ascidia, Echinodermata and Pisces have survived for a six years journey across the ocean. Biota were attached or entangled in substances like boats, docks, buoys or beams.
Rafting of species on natural floats like kelp or fallen trees has been known from ancient times. However, floating debris from other human activity is an increasing problem in the oceans. Rech et al. (2016) consider floating debris to be of high importance for both dispersal of new marine species and for the secondary dispersal of established ones. The risk for establishment of NIMS on floating debris is dependent on the material and buoyancy of the debris, the donor region and on the conditions when arriving at the coast. On litter that has landed on the beach and dried out calcified and crustose organisms is more common. On litter still in the sea organisms from almost all phyla can be present (Figure 47).
In recent years several studies have investigated the biota on floating debris. (Gregory 2009, Campbell et al. 2017, Gündoğdu et al. 2017, Tutman et al. 2017). Kiessling et al. (2015) reports on 387 taxa, including pro- and eukaryotic micro-organisms, seaweeds and invertebrates found on floating litter.
A model-study of the origin of plastic litter, based on collected litter on seven beaches along the coast and at Svalbard, showed that most of the litter that comes ashore along the southern coast of Norway originates from the southern North Sea and Skagerrak area. The beaches at the western coast and northern coast comes from the Northern part of the North Sea and the Norwegians Sea. Litter arriving on the Svalbard beaches mostly originates from the areas around Svalbard and the Barents Sea (Strand et al. 2021).
In Norway no studies on species on marine debris has been conducted, but it can be of higher importance for primary and secondary spread of NIMS than anticipated.
Figure 47. Seaweeds, ascidians, and bryozoans growing on a buoy. Photo: Erling Svensen
3.8 - Transport of species with fishing gear
Transport of invasive species with fishing gear is well known for limnic species but less studied in the marine environment. Several adult species, larvae and algal propagules can probably survive in heaps of beams and trawls when left in moist conditions. As there has been few studies on which species can survive such transport, we can only make a qualified guess on this matter. Several introduced seaweeds which reproduce clonally by fragments, such as Dasysiphonia japonica and Agarophyton vermiculophyllum (Nyberg & Wallentinus 2005, Husa et al. 2008) can probably survive in moist nets. Species of crustaceans, bryozoans, and ascidians as well. Of particular concern is the newly recorded species Didemnum vexillum which can probably survive on moist nets. Species like mussels, oysters, gastropods, sponges and crustaceans might also survive such conditions, while fish is probably less likely.
3.9 - Intentional introduction of species and import of species for aquaculture
Historically Norway has a very limited praxis of intentional introduction of species and import of species for aquaculture in the sea.
In 1988-1990 manila clam Ruditapes philippinarum was set out at six locations to study whether the species was a suitable species for aquaculture Upon revisit of the sites in 1996 living animals were found, but there were no signs of recruitment (Mortensen & Strand 2000). However, species intentionally introduced to the marine environment in neighbouring countries have spread to the Norwegian coast.
Rainbow trout (Oncorhynchus mykiss), from North America, was introduced and released to lakes and rivers in Norway in the early 1900s to increase salmonid fisheries. Rainbow trout is also used in aquaculture in the coastal zone. Aquaculture of rainbow trout in Norway has increased since the 1990s and varies between 50 000 and 90 000 tonnes a year. Escapees of rainbow trout can interact with native salmonid fish by disturbing breeding areas and disperse parasites to the environment (Skaala et al. 2021).
In the early 1980’s, permits were given to import Pacific oyster brood stock. The aim was to establish hatchery production of seed in two hatcheries and farming in oyster farms along the coast. The import was however continued, and relatively large amounts of imported oysters meant for human consumption were kept in farms or in dispatch centres without water treatments. Oysters were also re-laid outside one of the centres and have spawned (Wrange et al. 2010). Although the main invasion of Pacific oysters came with drifting larvae carried with the northward water currents, it is possible that re-laid oysters may have contributed to the establishment of feral populations. As oysters destined for human consumption are not subjected to health control, the oysters may carry oyster pathogens pose a disease risk for native bivalves.
New intentional introductions and import of aquaculture organisms to open systems in the sea are not likely to happen in Norway nowadays as this practice is regulated by law (Anon 2015). Permissions are given for aquaculture of alien species in escape secured land-based farms with treatment of waste water, such as Russian and Siberian sturgeon, scampi and abalone.
4 - Ecological impact assessment of vectors, species, and biogeography
In this chapter we take a closer look at pathways of introduction to Norway based on the information assembled in the Alien Species List of Norway (Norwegian Biodiversity Information Centre 2018). This list contains all alien species (within certain delimitations, see Sandvik et al. 2019) known to reproduce in the wild in Norway, in addition to selected door knocker species. The latter are species that do not currently reproduce (or even occur) in Norway but may be expected to do so in the near future (within 50 years). The Alien Species List does not only represent a catalogue of these species, but also lists the results of an ecological impact assessment, known and suspected pathways of introduction and spread, area of occupancy etc., for each species (Sandvik et al. 2020).
Pathways were recorded according to the subdivisions introduced by Hulme et al. (2008), adopted by the Convention on Biological Diversity (CBD 2014) and refined by Harrower et al. (2020). Regarding information on pathways in the Alien Species List, however, some pathway categories had been misinterpreted during impact assessments, as was evident from the fact that the pathway (sub)categories chosen were incompatible with the detailed descriptions given (Norwegian Biodiversity Information Centre 2018). For species for which sufficient information had been provided in the Alien Species List, the misinterpreted pathways have here been re-coded to the correct pathways following the detailed definitions by Harrower et al. (2020), see Box 1.
Box. 1 Re-coded pathways
4.1 - Alien species currently reproducing in Norwegian waters
According to the Alien Species List, 37 alien marine species occurred in Norway by 2018, 17 of which were categorised as having a high or severe ecological impact (Table 1). Information on pathways of introduction was available for all species. A total of 80 pathways of introduction were reported, which amounts to an average of 2.2 pathways per species (range 1–4). All main pathways categories except corridors (interconnected waterways) were represented (Table 2). Stowaways and unaided spread were the dominant pathways of introduction. Pathways did not differ much between different taxonomic groups or between species with high/severe impact and the remaining species (Table 2).
As regards pathways of secondary spread within Norway (i.e. following introduction), 44 such pathways were reported for 33 of the species, amounting to an average of 1.2 pathways per species (range 0–4). Unaided spread was the dominant pathway of secondary spread. Again, there were no pronounced differences between taxonomic groups or impact categories (Table 3).
Subcategories of pathways are summarised in Table 4. The most important subcategories of stowaways were ballast water, hull fouling and fishing equipment. This is in accordance with the fact that shipping is the most important factor for introduction of marine alien species to European seas (Nunes et al. 2014). A detailed summary for the species in the highest impact category ("SE") is provided in Table 5.
The geographical distribution of alien marine species shows that Southern and Western Norway is most exposed to introductions (Figures 49 and 50). The distribution is shown for all 39 alien species with individuals that are capable of "surviving in the wild" (categories C1–E sensu Blackburn et al. 2011; Figure 49) and the subset of 27 species "with individuals dispersing, surviving and reproducing at multiple sites" (only category E sensu Blackburn et al. 2011; Figure 50; data from Sandvik et al. 2019).
The temporal pattern of introductions of marine species to Norwegian waters does not display any saturation (Figure 51). To the contrary, decadal introduction rates of novel marine alien species have clearly been increasing from 1.1 ± 0.1 (1900–1953, N = 8) via 3.5 ± 0.1 (1953–1995, N = 15) to 7.5±0.1 (1995–2014, N = 17) species per decade.
Taxon
N
NK
LO
PH
HI
SE
Algae
10
-
2
3
-
5
- Bonnemaisoniales
1
-
-
-
-
1
- Ceramiales
5
-
2
2
-
1
- Gracilariales
1
-
1
- Phaeophyceae
2
-
-
1
-
1
- Ulvophyceae
1
-
-
-
-
1
Crustacea
8
-
2
3
-
3
- Amphipoda
2
-
-
1
-
1
- Cirripedia
1
-
-
1
-
-
- Copepoda
1
-
1
-
-
-
- Decapoda
3
-
-
1
-
2
- Diplostraca
1
-
1
-
-
-
Other taxa
19
1
8
1
4
5
- Actinopterygii
2
-
-
-
2
-
- Annelida
2
-
-
1
-
1
- Bryozoa
2
-
-
-
1
1
- Cnidaria
3
1
2
-
-
-
- Ctenophora
1
-
-
-
-
1
- Hexapoda
1
-
1
-
-
-
- Mollusca
4
-
3
-
-
1
- Nematoda
1
-
-
-
-
1
- Tunicata
3
-
2
-
1
-
Totals
37
1
12
7
4
13
Table 1 . Ecological impact assessments of marine alien species known to reproduce in Norway by 2018. Tabulated by taxon and ecological impact category (NK = "no known impact", LO = "low impact", PH = "potentially high impact", HI = "high impact", SE = "severe impact"). (Source: Norwegian Biodiversity Information Centre , 2018).
Subset
N
Release
Escape
Contaminant
Stowaway
Unaided
All introductions
37
2
4
4
27
19
By impact
- NK–PH
20
-
1
2
16
11
- HI+SE
17
2
3
2
11
8
By taxonomy
- Algae
10
-
1
-
10
5
- Crustaceans
8
1
1
2
6
5
- Other taxa
19
1
2
2
11
9
Table 2 . Pathways of introduction of marine alien species known to reproduce in Norway by 2018. Numbers are provided for all marine alien species, as well as split by ecological impact (NK–PH = "potentially high" or lower impact, HI+SE = "high" or "severe impact") and taxonomy. The number of the pathways in a row does not add up to the number of species ( N ) because a species may have more than one pathway. (Modified from Norwegian Biodiversity Information Centre , 2018).
Subset
N
Release
Escape
Contaminant
Stowaway
Unaided
All sec. spread
33
1
-
2
12
24
By impact
- NK–PH
17
-
-
1
5
12
- HI+SE
16
1
-
1
7
12
By taxonomy
- Algae
7
-
-
-
3
7
- Crustaceans
8
-
-
1
3
7
- Other taxa
18
1
-
1
6
10
Table 3. Pathways of secondary spread of marine alien species known to reproduce in Norway by 2018. Information on secondary spread was unavailable or inapplicable for four species. See Table 2 for further explanations.
Pathway subcategory
Introduction
Secondary spread
All species
HI+SE
All species
HI+SE
Unaided – natural dispersal
21
8
26
13
Stowaway – ballast water
19
9
3
2
Stowaway – hull fouling
17
7
7
3
Stowaway – fishing equipment
9
5
1
1
Stowaway – others
2
1
2
2
Stowaway – hitchhikers on boats
1
1
1
1
Release – for fishery
2
2
1
1
Contaminant – parasites on animals
3
2
2
1
Contaminant – on animals (except par.)
2
1
-
-
Escape – from aquaculture
2
2
-
-
Escape – life food/bait
1
1
-
-
Escape – from aquaria
1
-
-
-
Totals (species)
37
17
33
16
Table 4. Pathway subcategories of marine alien species known to reproduce in Norway by 2018. Pathways are listed for introduction to, and secondary spread within, Norwegian nature; both for the entire set of marine alien species and for the subset with high or severe ecological impact ("HI+SE"). The number of the pathways in a column does not add up to the number of species because a species may have more than one pathway. (Modified from Norwegian Biodiversity Information Centre , 2018).
Species
Taxon. group
Un-aid.
Stowaway
Rel.
Cont.
Escape
BW
HF
FE
other
Boat
Fish
PA
CA
AC
LF
Bonnemaisonia hamifera
Algae
X
X
X
X
Codium fragile
Algae
X
X
X
Dasysiphonia japonica
Algae
X
X
Gracilaria vermiculophylla
Algae
X
X
X
Sargassum muticum
Algae
X
X
X
Caprella mutica
Crustacea
X
X
X
Homarus americanus
Crustacea
X
Paralithodes camtschaticus
Crustacea
X
X
Anguillicoloides crassus
Nematoda
X
Crassostrea gigas
Mollusca
X
X
Marenzelleria viridis
Annelida
X
X
Mnemiopsis leidyi
Ctenophora
X
X
Tricellaria inopinata
Bryozoa
X
Table 5. Pathways of introduction for the 13 marine alien species in Norway that have severe ecological impact. Pathway (sub)categories are unaided, stowaway (ballast water, hull fouling, fishing equipment, others, boats), release (for fishery), contaminant (parasites or other contaminants on animals) and escape (from aquaculture or of life food) (Modified from Norwegian Biodiversity Information Centre , 2018).
Figure 49. Geographical distribution of all marine alien species in Norway. Numbers of alien reported from different Norwegian counties (plus Jan Mayen and Svalbard), for all species with an establishment category of C1 or higher (i.e. "surviving in the wild", N = 39; source: Sandvik et al., 2019).Figure 50. Geographical distribution of invasive marine alien species in Norway. Numbers of alien reported from different Norwegian counties (plus Jan Mayen and Svalbard), only species with an establishment category of E (i.e. "dispersing, surviving and reproducing at multiple sites", N = 27; source: Sandvik et al., 2019).
Figure 51. Cumulative number of newly recorded marine alien species in Norway by year. Based on the 37 marine alien species known to reproduce in Norway by 2018 (Source: Artsdatabanken, 2018).
4.2 - Door knocker species to Norwegian waters
In addition to alien species reproducing in Norway, the Alien Species List contains 60 impact assessments of door knockers to Norwegian marine waters, 22 of which were categorised as having a high or severe ecological impact (Table 6). Information on pathways of introduction was available for 58 of the species. A total of 114 pathways of introduction were reported, which amounts to an average of 2.0 pathways per species (range 1–4). Again, stowaways and unaided spread were the dominant pathways of introduction, and pathways did not differ between taxonomic groups or impact categories (Table 7).
Subcategories of pathways are summarised in Table 8. As with alien species already present in Norway, the most important subcategories of stowaways were hull fouling, ballast water and fishing equipment.
Taxon
N
NK
LO
PH
HI
SE
Algae
12
3
2
5
-
2
Bonnemaisoniales
1
-
-
1
-
-
Ceramiales
4
1
1
2
-
-
Gigartinales
1
-
1
-
-
-
Halymeniales
2
-
-
2
-
-
Phaeophyceae
3
2
-
-
-
1
Ulvophyceae
1
-
-
-
-
1
Crustacea
20
-
8
3
6
3
Amphipoda
2
-
-
-
1
1
Cirripedia
3
-
2
-
1
-
Decapoda
8
-
3
1
2
2
Diplostraca
3
-
1
1
1
-
Poecilostomatoida
3
-
2
-
1
-
Pycnogonida
1
-
-
1
-
-
Other taxa
28
1
12
4
7
4
Actinopterygii
3
-
1
-
1
1
Annelida
3
-
1
1
1
-
Bryozoa
3
-
2
-
1
-
Cnidaria
3
1
2
-
-
-
Mollusca
11
-
5
2
2
2
Porifera
1
-
-
-
1
-
Trematoda
1
-
1
-
-
-
Tunicata
3
-
-
1
1
1
Totals
60
4
22
12
13
9
Table 6. Ecological impact assessments of marine door-knockers to Norway risk-assessed in 2018. Tabulated by taxon and ecological impact category (NK = "no known impact", LO = "low impact", PH = "potentially high impact", HI = "high impact", SE = "severe impact"). (Source: Norwegian Biodiversity Information Centre , 2018).
Subset
N
Contaminant
Stowaway
Unaided
All introductions
58
10
48
30
By impact
NK–PH
37
8
30
21
HI+SE
21
2
18
9
By taxonomy
Algae
12
3
12
7
Crustaceans
20
3
16
12
Mollusca
9
2
6
4
Other taxa
17
2
14
7
Table 7. Pathways of introduction of marine door-knocker species to Norway risk-assessed in 2018. None of the species was expected to be introduced by means of release or escape. Numbers are provided for all species, as well as split by ecological impact (NK–PH = "potentially high" or lower impact, HI+SE = "high" or "severe impact") and taxonomy. The number of the pathways in a row does not add up to the number of species ( N ) because a species may have more than one pathway. (Modified from Norwegian Biodiversity Information Centre , 2018).
Pathway subcategory
Introduction
All species
HI+SE
Unaided – natural dispersal
29
9
Stowaway – ballast water
20
10
Stowaway – hull fouling
41
14
Stowaway – fishing equipment
14
5
Contaminant – parasites on animals
5
1
Contaminant – on animals (except par.)
5
1
Totals (species)
58
21
Table 8. Pathway subcategories of marine door-knocker species to Norway risk-assessed in 2018. Pathways are listed both for the entire set of door-knockers and for the subset with high or severe ecological impact ("HI+SE"). The number of the pathways in a column does not add up to the number of species because a species may have more than one pathway. (Modified from Norwegian Biodiversity Information Centre , 2018).
For fish, so far there are only two established species relevant for marine ecosystems, however there are several door knockers and potential door knockers which deserves attention (Table 9). The Norwegian Biodiversity Information Centre has in 2021 identified potential door knockers, which are going through a horizon scanning for possible inclusion in the new risk assessment starting in 2022. The door knocker associated with the highest risk so far is the round goby, Neogobius melanostomus (Artsdatabanken 2018). The most likely dispersal pathways for this species are unaided dispersal from Sweden and Denmark and ship traffic (ballast water and possibly eggs deposited on ships’ hulls). Notably, many of the potential door knockers are gobies from the Ponto-Caspian region (Black Sea, Caspian Sea, Azov Sea). These are spread via ballast water, and in continental Eurasia also by corridors. After being introduced to new areas, they often have a high potential for unaided secondary dispersal.
For Svalbard, the door knocker pink salmon, Oncorhynchus gorbuscha (Table 10), came unaided from Russia and is already present in the sea around Svalbard but is not reproducing. Increasing temperatures may make reproduction possible in the future (in fresh water).
Shipping, together with unaided dispersal, are the most likely vectors for new introductions of alien marine fish to Norway. Ballast water and hulls in ships can transport fish of all life stages. An adult blenny, Parablennius zvonimiri, was for example found in western Norway inside a barnacle shell on a ship from the Mediterranean a few years ago. Occasional findings of new fish species introduced by ships do occur, but so far these do not seem to have established (Table 9). A review showed that fish found in ballast tanks most often were from the families Gobiidae and Clupeiidae. On lists of ballast mediated introductions, Gobiidae, Blenniidae and Pleuronectidae was frequent, and gobies and blennies were the families that most often managed to establish (Wonham et al. 2000).
Table 9. Marine, anadromous, catadromous and amphidromous alien fish (Actinopterygii) of relevance for Norway, their associated risk, occurrence and main vectors.
Species
Risk1
Native Area
Occurence in Norway or closest occurrence as NIS
Main vector(s) for introduction to Norway
1Established alien species:
Pink salmon, Oncorhynchus gorbuscha
HI
N Pacific, Arctic
yes
Unaided
Rainbow trout, Oncorhynchus mykiss
HI
N Pacific, NW America
yes
Escape, release, unaided
1Door-knockers:
American eel, Anguilla rostrata
HI
W Atlantic
Germany(?)
Unaided
Round goby, Neogobius melanostomus
SE
Ponto-Caspian
Sweden
Ship traffic, unaided
False kelpfish, Sebastiscus marmoratus
NR
Asia, Oceania
Fredrikstad 2016
Ship traffic (ballast water)
Atlantic croaker, Micropogonias undulatus
LO
W Atlantic
Denmark
Ship traffic (ballast water),
unaided
2Potential door knockers (selection):
Babka gymnotrachelus, racer goby
-
Ponto-Caspian
Germany, Poland
Ship traffic (ballast water)
Coregonus peled, peled
-
e.g. Russia
Germany, Poland
Release
Fundulus heteroclitus, mummichog
-
W Atlantic, NE America
Portugal, Spain
Release, escape
Gobiosoma bosc, naked goby
-
W Atlantic
Netherlands, Germany
Ship traffic, unaided
Morone americana, white perch
-
W Atlantic, NE America
-
Aquarium? Release?
Neogobius fluviatilis, monkey goby
-
Ponto-Caspian
Netherlands, Poland
Ship traffic, unaided
Oncorhynchus kisutch, coho salmon
-
N Pacific
Belgium
Unaided
Ponticola kessleri, big head goby
-
Ponto-Caspian
Netherlands, Germany
Ship traffic, unaided
Proterorhinus marmoratus, tubenose goby
-
Ponto-Caspian
Netherlands, Germany
Ship traffic, unaided
Sphoeroides pachygaster, blunthead puffer
-
Circumglobal, nearest: UK
Mediterranean
Ship traffic (ballast water)
Vimba vimba, vimba bream
-
Eurasia
Netherland
Release
3Occasional finding of potential door knockers (selection):
Glossanodon leioglossus, small toothed argentine
NR
E Atlantic, Mediterranean
Sognefjord 1942
Ship traffic (ballast water)
Parablennius zvonimiri
NR
Mediterranean, Black Sea
Karmøy 2017
Ship traffic
Scartella cristata, Molly miller
-
W & E Atlantic, Mediterranean
Karmøy 2016
Ship traffic
1From the Alien Species List of Norway (Artsdatabanken, 2018). Ecological risk assessment, SE=severe impact, HI= high impact, LO=low impact, NR=not risk assessed. 2Selected fish species of interest from the ongoing horizon scanning by the Norwegian Biodiversity Information Centre (unpubl., autumn 2021). 3Occasional findings of nonindigenous marine fish in Norway, from the Alien Species List of Norway (2018) and Norwegian Institute of Marine Research
Table 10. Marine and anadromous alien fish (Actinopterygii) relevant for Svalbard, geographical occurrence and likely vectors for introduction.
Species
Native Area
Occurence Europe/Norway/Svalbard
Main vector(s)
1Door knocker:
Pink salmon, Oncorhynchus gorbuscha
N Pacific, Arctic
yes / yes / yes
unaided
2Potential door knockers:
Yellowfin goby, Acanthogobius flavimanus
NW Pacific, Asia
no / no / no
shipping, ballast water
Giant grenadier, Albatrossia pectoralis
N Pacific
no / no / no
ballast water
European flounder, Platichthys flesus
N Atlantic
yes / yes / no
ballast water
Coho salmon, Oncorhynchus kisutch
N Pacific
yes / no / no
unaided, release?
Rainbow trout, Oncorhynchus mykiss
NW America
yes / yes / no
unaided, release?
1 From the Alien Species List of Norway (Norwegian Biodiversity Information Centre, 2018). Likely to establish with warmer temperatures. 2 Mentioned in online resource to van den Heuvel-Greve et al. (2021)
5 - Management of dispersal vectors and high impact species
5.1 - Measures for prevention of introduction and dispersal of NIMS
Preventive measures early in the process of biological invasions are more cost-efficient than control measures later (Leung et al. 2002). If prevention fails, early detection and rapid response are important in fighting alien species (Hulme 2006, Lehtiniemi et al. 2015). There are many different types of action to take from securing international collaboration and agreements, national monitoring and surveys at high-risk sites, to local eradication measures (e.g. Lehtiniemi et al. 2015, Table 11). Also, one should not forget the importance of maintaining healthy well-functioning ecosystems not too much affected by human impacts, which likely are more robust to invasion of alien species. Predators have an important role and biological control by natural predators should help keep the density of alien species down (Madenjian et al. 2011, Ojaveer et al. 2015).
Process for biological invasion
Dispersal pathway
Goal of measure
Example of measure
Transport, arrival, introduction
Shipping
Ballast water
Fouling
Escape cultivation
Aquaculture
Release
Live sea food
Aquarium
Unaided
Prevent introduction, precautionary approach
-Legislation and international agreements (ballast water and sediments, biofouling, trade in live organisms) -closed cages and/or aquaculture on land -public awareness
Establishment
Early detection, rapid response, eradication
-Predicting hotspots for introduction -Port monitoring -Surveys of offshore infrastructure -Inspecting boat hulls -Public awareness and citizen science -Catching -Healthy ecosystem
Secondary spread
Unaided Ship and boat traffic
Limit and control
-Marina surveys -Catching/removal -Removing hull fouling -Ballast water management
Impact on ecosystems
Mitigation of impact
-Catching -Removal in especially vulnerable areas
Table 11. Process for biological invasion, main dispersal pathways, and possible measures to reduce the effect of alien marine species.
In Norway several measures for preventing NIMS entering coastal ecosystems is already in place such as ballast water treatment and regulations on import of organisms for aquaculture or food.
Even though it is stated by law that it is the sellers of alien species for food or aquarium duty to inform about the risk associated with specimens or larvae accidentally released to the environment, there is a certain uncertainty whether this system is functioning well enough. Increased information to traders on this duty is recommended.
Biofouling on vessels is then probably the vectors with the highest risk for introduction of NIMS into the Norwegian coast currently. There is currently ongoing work in IMO to evaluate experience from the guideline and develop standards for cleaning and control of vessels. As a part of this work an industrial standard for in-water cleaning with capture is under development (Anon 2021). This work will most likely take years before measures are implemented internationally. In the mean while it is recommended to give more information and encourage the ships owners to keep their vessels as clean as possible. Regional regulations on vessel traffic out from port with Didemnum vexillum should be considered.
Long distance transport of living cleaner fish and release of transport water into the environment is not recommended (Mortensen et al. 2021).
The increasing problem with floating litter and hitch hikers on this cannot be solved without a worldwide change in human behaviour to decrease this flow.
5.2 - Measures for eradication of problematic NIMS
Due to the lack of systematic monitoring and mapping programmes of NIMS in Norway is it often too late for eradication when a problematic species first is discovered. To be able to make a quick and determined eradication attempt one relies on an early warning system based on regularly monitoring of coastal sites. Moreover, there is a need for an alert group consisting of relevant management directories and researchers to decide on which actions it is appropriate to take. Such a group could have a sleeping funding system, which quickly allows actions in form of mapping of the abundance and dispersal of the species and eradication attempts. The need for such an action group is highlighted by the example of the newly introduced species Didemnum vexillum in Norway where it has taken time to establish contact between relevant authorities and to date no sizable measures have been taken to minimize the spread between ports one year after the first record.
5.2.1 - Pathogens
Pathogens may be spread via translocation of farmed species, release of non-indigenous species or live seafood meant for human consumption. Once established in a marine species, pathogens are difficult or impossible to eradicate. Pathogens of farmed animals are listed according to their severity / effect on the susceptible host species. Detection of such notifiable diseases require a response, and mitigation measures are establishment of a protection/eradication zone and removal of infected stock. For some notifiable diseases there are national surveillance programmes. Other diseases may be detected during health inspections or control. For wild animals there is no such surveillance. To minimize risk of disease introductions and transmission, long-distance translocations of live animals with un-known health status should, as a general rule, be avoided.
5.2.2 - Pacific oysters
After the bio-invasion of Pacific oysters, commencing in 2007 (Wrange et al. 2010), mitigation was discussed, and measures were taken to remove oysters from beaches and areas used by the public. Pacific oysters settle on shallow water and may build dense populations. The oysters have sharp edges and stepping on them may cause severe wounds. Removal is organized every summer, as local campaigns. The campaigns however remove only a small fraction of the total amount of oysters. They help to protect users of beaches and other public areas but have no effect on the further spread of oysters along the coast. Pacific oysters must be regarded as a new species, permanently established in the Norwegian fauna. We consider it important to discuss the mitigation and management issues and turn the situation from being a problem into also being a resource (Mortensen et al 2019). We have therefore assessed the risk and studied the effect on affected habitats, thus providing background for mitigation measures as well as management of the resource (Mortensen et al. 2017; 2019). The 2019-report proposes a process focusing on a new management model, combining exploitation with removal. We are now carrying out studies on the establishment in different habitats in the invasion front (south and north).
5.2.3 - Pink salmon
There has been a dramatic invasion of pink salmon in Norway every second year from 2017, especially in the north. The number of registered pink salmon increased from 2017 to 2019 (Berntsen et al. 2018, 2020). There has been targeted removal of pink salmon in designated rivers by intense angling and/or fishing with nets or traps, from June to September all three years (2017, 2029, 2021). In addition, sports fishing in rivers and bag- or bend-net fishing in the sea has caught a substantial number of pink salmon. The activity was accomplished thanks to the Norwegian Environmental Agency, the County governor, several Norwegian institutions and research institutes, and voluntary efforts. Removal of pink salmon in rivers summertime is a good and necessary measure to mitigate the effects of the species as much as possible. The next expected invasion is in 2023, and increased resources are needed to remove as many pink salmon as possible.
5.2.4 - Didemnum vexillum
Several studies have been performed to find the best method to destroy D. vexillum when growing on mussel and oyster cultures without impacting the mollusc. Different chemical solutions such as acetic acid, lime, chlorine, sodium hydroxide and bleach as well as brine, fresh water and desiccation. Lime solutions (3-4%), sodium hydroxide (0,5) and acetic acid (5%) effectively killed D. vexillum in less than 10 minutes, but acetic acid and sodium hydroxide had a severe impact on the molluscs. The use of brine and freshwater needed four hours to kill D. vexillum (McKenzie et al. 2017 and references therein). Testing out different chemical solutions in special made enclosed berths for removal of biofouling species on recreational vessels showed that acetic acid and sodium hydroxide efficiently removed the biota from the vessels (Roche et al. 2015).
Due to the combined sexual and clonal reproduction of the species, it has proved extremely hard to eradicate D. vexillum from natural sites even if the distribution of colonies has been limited. A massive eradication attempt was tried out in New Zealand in the period 2003-2009 by cleaning of all vessels, capsuling pilings and artificial structures with plastic sheeting and covering up the seafloor with new sediment. Th operation was costly and removed the species for a short time, but new biomass of the species built up rapidly the following year. A similar attempt was made in Holyhead Marina, UK with the same results (McKenzie et al. 2017 and references therein). D. vexillum is now spread to five ports in Norway and new colonies are reported frequently in the vicinity of the ports, and a costly eradication attempt is likely to fail.
As ascidians have a limited natural dispersal capacity due to the larval settlement within 24 hours after spawning, measures to prevent/slow down further human aided dispersal can be taken. Such measures can be for example cleaning of vessels that has been laying for a period (>24 hours in summer (April-October), 14-30 days in winter) in ports which is infected before leaving the port. Cleaning of fishing gear, instruments etc which have been in the sea for more than 24 hours is recommended, by drying or freshwater treatment in more than 4 hours. D. vexillum is yet to be detected on Norwegian salmon farms but will probably cause large problems if fouling the nets. The usual praxis of flushing the nets frequently during the summer season will likely cause further spread of the species, as small fragments of the colonies grow rapidly into new colonies. Likewise, will the species potential cause problems for mussel farms and kelp farms by overgrowing and smothering of the aquaculture organisms. More research is needed to find the best protocol for early detections and removal of D. vexillum at aquaculture facilities.
5.2.5 - Round goby
The round goby, a door knocker with severe impact, can serve as an example of measures to handle potential introductions of new alien marine fish species dispersing unaided or by shipping. The round goby is a brackish species with a broad salinity tolerance (Kornis et al. 2012). In a spatial analysis based on the main dispersal pathways together with environmental preferences of the species (Kotta et al. 2016), hotspots for likely introduction and establishment were modelled (Forsgren & Hanssen, unpubl.). Shallow, brackish areas near large international ports, especially in the Oslofjord region, came out as the most likely areas for introduction and establishment. Since early detection is crucial for efficient mitigation, yearly monitoring of selected ports by means of eDNA sampling would be a good strategy. Efforts to try and catch fish with passive or active fishing gear may be useful in addition. After establishment, the species have a high potential to disperse and further expanding its range. Range expansion was in Denmark estimated to about 30 km per year (Azour et al. 2015). In the Baltic, eradication of the round goby is unrealistic but several measures to limit impact and spread has been suggested, including monitoring and management of ships’ ballast water and hull fouling (Ojaveer et al. 2015). The round goby can also disperse from the sea into freshwater, as found in the Baltic where it now has invaded several salmonid streams (Verliin et al. 2017). In North America, electrical barriers in rivers to stop dispersal have been tried and proved efficient, in addition to baited traps and other measures (reviewed in Kornis et al 2012, Forsgren & Florin 2018).
6 - References
Agnalt A-L, Jørstad KE, Pavlov, Farestveit E, Sundet J. 2011. The snow crab, Chionoecetes opilio (Decapoda, Majoidae, Oregoniidae) in the Barents Sea. In: In the Wrong Place: Alien Marine Crustaceans—Distribution, Biology and Impacts. Invading Nature, Springer Series in Invasion Ecology, 6, pp. 283–300. Ed. by B. S. Galil, P. F. Clark, and J. T. Springer Science and Business Media Carltong, London.
Ahne W. 1980. Experimental infection of pike (Esox lucius) with Egtvedvirus. Tierarztl Umsch 35: 225-229.
Alvsvåg J, Agnalt A-L, Jørstad KE. 2009. Evidence for a permanent establishment of the snow crab (Chionoecetes opilio) in the Barents Sea. Biological Invasions, 11, 587-595.
Anon. 2015. Forskrift om fremmede organismer. LOVDATA. FOR-2015-06-19-716.
Azour F, van Deurs M, Behrens J, Carl H, Hüssy K, Greisen K, Ebert R, Møller PR. 2015. Invasion rate and population characteristics of the round goby Neogobius melanostomus: effects of density and invasion history. Aquatic Biology 24:41-52.
Barrett, CJ, A Cook, D Stone, C Evans, D Murphy, P Johnson, M Thain, G Wyn, M Grey, H Edwards, D Quigley, Stebbing PD. 2020. A review of American lobster (Homarus americanus) records around the British Isles: 2012-2018. Hydrobiologia, 847: 3247-3255.
Berntsen HH, Sandlund OT, Ugedal, O, Thorstad E, Fiske P, et al. 2018. Pukkellaks i Norge, 2017. NINA Rapport 1571. Norsk institutt for naturforskning. http://hdl.handle.net/11250/2575646
Berntsen HH, Sandlund OT, Thorstad EB, Fiske P. 2020. Pukkellaks i Norge, 2019. NINA Rapport 1821. Norsk institutt for naturforskning. https://hdl.handle.net/11250/2651741
Blackburn TM, Pyšek P, Bacher S, Carlton JT, Duncan RP, Jarošík V, Wilson JRU, Richardson DM. 2011. A proposed unified framework for biological invasions. Trends in Ecology and Evolution 26: 333–339. http://dx.doi.org/10.1016/j.tree.2011.03.023
Blanco Gonzalez E, Knutsen H, Jorde PE. 2016. Habitat discontinuities separate genetically divergent populations of a rocky shore marine fish. PLoS ONE 11. https://doi.org/10.1371/journal.pone.0163052
Boersma M, Malzahn A M, Greve W, et al. 2007. The first occurrence of the ctenophore Mnemiopsis leidyi in the North Sea, Helgol. Mar. Res., 61:153-155
Brockerhoff A, McLay C. 2011. Human-mediated spread of alien crabs. In: Galil BS, Clark PF, Carlton JT (eds) In the wrong place—Alien marine crustaceans: distribution, biology and impacts, vol 6. Invading Nature- Springer Series in Invasion Ecology. pp 27–106. https://doi.org/10.1007/978-94-007-0591-3_2
Campell ML, King S, Heppenstall LD, van Gool E, Martin R, Hewitt CH. 2017. Aquaculture and urban marine structures facilitate native and non-indigenous species transfer through generation and accumulation of marine debris. Marine Pollution Bulletin 123: 304-312.
Carlton, JT. 1985. Transoceanic and interoceanic dispersal of coastal marine organisms: the biology of ballast water. Oceanogr. Mar. Biol. Ann. Rev. 23: 313-371.
Carlton JT, Chapman JW, Geller JB, Miller JA, Carlton DA, MCCuller MI, Treneman NC, Steeves BP, Ruiz G. 2017. Tsunami-driven rafting: Transoceanic species dispersal and implications for marine biogeography. Science 357: 1402-1406.
Costello JH, Bayha KM, Mianzan HW, Shiganova TA, Purcell JE. 2012. Transitions of Mnemiopsis leidyi (Ctenophora: Lobata) from a native to an exotic species: a review. Hydrobiologia 690: 21-46
Dahle G, Sainte-Marie B, Mincks SL, Farestveit E, Jørstad KE, Hjelset AM, Agnalt A-L. Submitted. Genetic analysis of the expoloiited snow crab (Chionoecetes opilio) in the Barents Sea – revealing pathway of introducitons. ICES J. Mar. Sci.
Danielsen HEH, Hjelset AM, Bluhm BA, Hvingel C, Agnalt A-L. 2019. A first fecundity study of the female snow crab Chionoecetes opilio Fabricius, 1788 (Decapoda: Brachyura: Oregoniidae) of the newly established population in the Barents Sea. J Crust Biol. https://doi.org/10.1093/jcbiol/ruz039Furlani 1996.
Darling JA, Bagley MJ, Roman J, Tepolt CK, Gellers JB. 2008. Genetic patterns across multiple introductions of the globally invasive crab genus Carcinus. Molecular Ecology, 17: 4992-5007.
Dionne M, Sainte-Marie B, Bourget D, Gilbert D. 2003. Distribution and habitat selection of early benthic stages of snow crab Chionoecetes opilio. Mari. Ecol. Prog. Ser., 259: 117-128.
Dybedal P. 2018. Cruise passenger traffic to Norway-history and forecasts 2018-2060. Report nr 1651/2018. Norwegian centre for transport research.
Faust E, André C, Meurling S, Kochmann J, Chritiansen H, Jensen LF, Charrier G, Laugen AT, Strand Å. 2017. Origin and route of establishment of the invasive Pacific oyster Crassostrea gigas in Scandinavia. Marine Ecology Progress Series 575:95-105. http://www.int-res.com/abstracts/meps/v575/p95-105/
Faust E, Halvorsen KT, Andersen P, Knutsen H, André C. 2018. Cleaner fish escape salmon farms and hybridize with local wrasse populations. Royal Society Open Science 5: 171752. https://doi.org/10.1098/rsos.171752
Forsgren E, Florin A-B. 2018. Svartmunnet kutling – en invaderende fremmed fiskeart på vei mot Norge. NINA Rapport 1454. Norsk institutt for naturforskning. http://hdl.handle.net/11250/2479873
Fossøy F, Sivertsgård R, Ambjørndalen VM, Brandsegg H, Andersskog IPØ, Husa V, Forsgren E. 2022. Kartlegging av den fremmede marine arten havnespy Didemnum vexillum ved hjelp av miljø-DNA. En rask respons undersøkelse. NINA Rapport 2092. Norsk institutt for naturforskning.
Goldsmit J, Nudds SH, Stewart DB, Higdon JW, Hannah CG, Howland KL. 2018. Where else? Assessing zones of alternate ballast water exchange in the Canadian eastern Arctic. Mar Pollut Bull. 139:74–90.
Gollasch S. et al. 2002. Life in Ballast Tanks. In: Leppäkoski E., Gollasch S., Olenin S. (eds) Invasive Aquatic Species of Europe. Distribution, Impacts and Management. Springer, Dordrecht. https://doi.org/10.1007/978-94-015-9956-6_23
Govindarajan AF, Källström B, Selander E, Östman C, Dahlgren TG. 2019. The highly toxic and cryptogenic clinging jellyfish Gonionemus sp. (Hydrozoa, Limnomedusae) on the Swedish west coast. PeerJ. 7:e6883. doi: 10.7717/peerj.6883
Granhag L, Møller LF, and Hansson LJ 2011. Size-specific clearance rates of the ctenophore Mnemiopsis leidyi based on in situ gut content analyses. Journal of Plankton Research 33,: 1043–1052.
Grefsrud ES, Karlsen Ø, Kvamme BO, Glover K, Husa V, Hansen PK, Samuelsen OB, Sandlund N, Stien LH, Svåsand T. 2021a. Risikorapport norsk fiskeoppdrett - risikovurdering (in Norwegian), Rapport fra Havforskningen, 2021-8, 198 pp. https://www.hi.no/hi/nettrapporter/rapport-fra-havforskningen-2021-8
Grefsrud ES, Karlsen Ø, Kvamme BO, Glover K, Husa V, Hansen PK, Samuelsen OB, Sandlund N, Stien LH, Svåsand T. 2021b. Risikorapport norsk fiskeoppdrett 2021 - kunnskapsstatus (in Norwegian), Rapport fra Havforskningen, 2021-7, 280 pp.
Gregory M. 2009. Environmental implications of plastic debris in marine settings-entanglement, ingestion, smothering, hangers-on, hitch-hiking and alien invasions. Philosophical Transactions 364:2013-2025.
Grotmol S, Totland GK, Thorud K, Hjeltnes BK. 1997. Vacuolating encephalopathy and retinopathy associated with a nodavirus-like agent: a probable cause of mass mortality of cultured larval and juvenile Atlantic halibut Hippoglossus hippoglossus. Diseases of Aquatic Organisms 29: 85–97.
Guðmundsdóttir S, Vendramin N, Cuenca A, Sigurðardóttir H, Kristmundsson A, Moesgaard Iburg T, Jørgen Olesen N 2019. Outbreak of viral haemorrhagic septicaemia (VHS) in lumpfish (Cyclopterus lumpus) in Iceland caused by VHS virus genotype IV. Journal of Fish Diseases 42: 47–62. https://doi.org/10.1111/jfd.12910
Gulliksen B. 1971. A new record of Gonionemus vertens Agassiz (Limnomedusea) in Norway. K. norske Vidensk. Selsk. Skr. 1971. 1-4
Gündoğdu S, Ҫevik C, Karaca S. 2017. Fouling assemblage of benthic debris collected from Mersin Bay, NE Levantine coast of Turkey. Marine Pollution Bulletin 124: 147-154.
Hallegraeff GM. 1993. A review of harmful algal bloomsand their apparent global increase* Phycologia (1993) Volume 32 (2)
Hansen HSB. 2016. Three major challenges in managing non-native sedentary Barents Sea snow crab (Chionoecetes opilio). Marine Policy, 71: 38-43.
Hansen C, Mousing EA, Hvingel C. In prep. Snow crab in the Barents Sea, winner or villain?
Hansson HG. 2006. Ctenophores of the Baltic andadjacent seas - the invader Mnemiopsis is here! Aquatic Invasions 1, Issue 4: 295 -298
Haraldstad T, Hindar A, Hobæk A, Håvardstun J, Skjelbred B. 2013. Resipientundersøkelse av Reddalsvann, Grimstad. NIVA Rapport L.NR. 6485-2013.
Harrower CA, Scalera R, Pagad S, Schönrogge K, Roy HE. 2020. Guidance for interpretation of the CBD categories of pathways for the introduction of invasive alien species. Publications Office of the European Union, Luxembourg. http://dx.doi.org/10.2779/6172
Hess-Erga OK, Moreno-Andrés J, Enger Ø, Vadstein O. 2019. Microorganisms in ballast water: disinfection, community dynamics, and implications for management. Science of the Total Environment 657, 704-716
Heuvel-Greve MJ, van den Brink AM, Glorius ST, de Groot A, Laros I, Renaud PE, Pettersen R, Weslawski JM, Kutlinski P, Murk AJ. 2021. Early detection of marine non-indigenous species on Svalbard by DNA metabarcoding of sediment. Polar Biology 44:653-665.
Hjelset AM. 2012. Female life-history parameters in the introduced red king crab (Paralithodes camtschaticus, Tilesius 1815) in the Barents Sea: A study of temporal and spatial vibration in three Norwegian fjords. PhD. Faculty of Biosciences, Fisheries and Economics. Department of Arctic and Marine Biolgy, University of Tromsø, Norway.
Hjelset AM, Danielsen HEH, Westgaard JI, Agnalt A-L. 2021. Taxonomic and genetic confirmed findings of snow crab (Chionoecetes opilio) larvae in the Barents Sea. Polar Biology 44:2107-2115.
Holt RE, Hvingel C, Agnalt A-L, Dolgov AV, Hjelset AM, Bogstad B. 2021. Snow crab (Chionoecetes opilio), a new food item for North-east Arctic cod (Gadus morhua) in the Barents Sea. ICES J. Mar. Sci. 78: 491-501.
Holte B, Fuhrmann MM, Tandberg AHS, Hjelset (AM). In prep. New data on infaunal and epifaunal benthic secondary production in the Barents Sea, with focus on snow crab (Chionoecetes opilio) consumption
Hosia A, Falkenhaug T. 2015. Invasive ctenophore Mnemiopsis leidyi in Norway. Marine Biodiversity Records 8: 1-9
Hulme PE. 2006. Beyond control: wider implications for the management of biological invasions. -Journal of Applied Ecology 43:835–847.
Hulme PE, Bacher S, Kenis M, Klotz S, Kühn I, Minchin D. et al. 2008. Grasping at the routes of biological invasions: a framework for integrating pathways into policy. Journal of Applied Ecology 45: 403–414. http://dx.doi.org/10.1111/j.1365-2664.2007.01442.x
Husa V, Sjøtun KI. 2006. Vegetative reproduction in «Heterosiphonia japonica» (Dasyaceae, Ceramiales, Rhodophyta) an intoduced red alga on European coasts. Botanica Marina 49: 191-199.
Husa V, Heggøy E, Sjøtun K, Agnalt AL, Johansen PO, Glenner H, Hatlen K. 2012 a. Kartlegging av fremmede marine arter i Hordaland. Utredning for DN 2-2012. Direktoratet for naturforvaltning.
Husa V, Heggøy E, Agnalt A-L, Sjøtun K, Svensen R, Rokkan-Iversen K, Alvestad T. 2012 b. Kartlegging av fremmede marine arter i Rogaland. Utredning for DN 3-2012. Direktoratet for naturforvaltning.
Husa V, Agnalt AL, Svensen R, Rokkan Iversen K, Steen H, Jelmert A, Farestvedt E, Petersen H. 2013. Kartlegging av fremmede marine arter i indre og ytre Oslofjord. Utredning for DN 4-2013. Direktoratet for naturforvaltning
Husa V, Agnalt AL, Svensen R, Floerl O, Brattegard T, Rokkan-Iversen K, Glenner H, Bruntveit L. 2014. På jakt etter fremmede marine arter i Narvik havn. Rapport fra Miljødirektoratet M222-2014
Huserbråten, M, Hvingel C, Danielsen HEH, Agnalt AL, Hjelset AM. In prep. Understanding the early life history of the invading snow crab (Chionoecetes opilio) in the Barents.
Hwang J, Park SY, Lee S, Lee T-K. 2018. High diversity and potential translocation of DNA viruses in ballast water, Marine Pollution Bulletin, Volume 137, 2018, P .449-455,
Jansson E, Quintela M, Dahle G, Albretsen J, Knutsen H, André C, Strand Å, Mortensen S, Taggart JB, Karlsbakk E, Kvamme BO, Glover KA. 2017. Genetic analysis of goldsinny wrasse reveals evolutionary insights into population connectivity and potential evidence of inadvertent translocation via aquaculture. ICES Journal of Marine Science 74: 2135–2147. https://doi.org/10.1093/icesjms/fsx046
Jansson E, Besnier F, Malde K, André C, Dahle G, Glover KA. 2020. Genome wide analysis reveals genetic divergence between Goldsinny wrasse populations. BMC Genetics 21(1): 118. https://doi.org/10.1186/s12863-020-00921-8
Jaspers C, Huwer B, Antajan E, et al. 2018. Ocean current connectivity propelling the secondary spread of a marine invasive comb jelly across western Eurasia. Global Ecol Biogeogr. 27: 814– 827. https://doi.org/10.1111/geb.12742
Javidpour J, Sommer U, Shiganova T A, et al. 2006. First record of Mnemiopsis leidyi A. Agassiz 1865 in the Baltic Sea, Aquatic Invasions. vol. 1 (pg. 299-302)
Jørstad, KE, E Farestveit, H Rudra, A-L Agnalt, Olsen S. 2002. Studies on red king crab (Paralithodes camtschaticus) introduced to the Barents Sea, pp. 425-438. In: Crabs in Cold Water Regions: Biology, Management, and Economics, AJ Paul, EG Dawe, R Elner, GS Jamieson, GH Kruse, RS Otto, B Sainte-Marie, TC Shirley 6 D Woodby (eds). 19th Lowell Wakefield Fisheries Symposium. Alaska Sea Grant College Program. AK-SG-02-01. 866 p.
Jørstad K, Agnalt AL, Farestveit E. 2011. The Introduced American Lobster, Homarus americanus in Scandinavian Waters. In (Vol. 6, pp. 625-638).
Kaiser BA, Kourantidou M, Fernandez L. 2018. A case for the commons: The snow crab in the Barents: journal of Environmental Management, 210: 338-348.
Kiessling T, Gutow L, Thiel M. 2015. Marine Litter as Habitat and Dispersal Vector. In: Bergmann M., Gutow L., Klages M. (eds) Marine Anthropogenic Litter. Springer, Cham.
Kinlan BP, Gaines SD. “Propagule Dispersal in Marine and Terrestrial Environments: A Community Perspective.” Ecology, vol. 84, no. 8, Ecological Society of America, 2003, pp. 2007–20, http://www.jstor.org/stable/3450025
Knutsen H, Jorde PE, Gonzalez EB, Robalo J, Albretsen J, Almada V. 2013. Climate Change and Genetic Structure of Leading Edge and Rear End Populations in a Northwards Shifting Marine Fish Species, the Corkwing Wrasse (Symphodus melops). PLoS ONE 8, e67492. https://doi.org/10.1371/journal.pone.0067492
Kornis MS, Mercado-Silva N, Vander Zanden MJ. 2012. Twenty years of invasion: a review of round goby Neogobius melanostomus biology, spread and ecological implications. Journal of Fish Biology 80:235-285.
Korsnes K, Karlsbakk E, Skaar CK, Sælemyr L, Nylund A, Kvamme BO, Mortensen S. 2017. High nervous necrosis virus (NNV) diversity in wild wrasse (Labridae) in Norway. Diseases of Aquatic Organisms 126, 43–50. https://doi.org/10.3354/dao03159
Kotta J, Nurkse K, Puntila R, Ojaveer H. 2016. Shipping and natural environmental conditions determine the distribution of the invasive non-indigenous round goby Neogobius melanostomus in a regional sea. Estaurine, Coastal Shelf Science 169:15-24.
Kramp PL. 1922. "Demonstration of Gonionemus murbachii from Kristianiafjord, Norway." Vidensk. Medd. dansk. naturh. Foren. Kbh. (Meeting-report) 74: xi
Kuzmin S, Olsen S. 1994. Barents Sea king crab (Paralithodes camtschatica). The transplantation experiments were successful. ICES C.M. 1994/K:12.
Kuzmin S, Olsen S, Gerasimova O. 1996. Barents Sea king crab (Paralithodes camtschatica): The transplantation experiments were successful, pp. 649-663. In: High Latitude Crabs: Biology, Management, and Economics. Alaska Sea Grant College Program. AK-SG-96-02. 713 p.
Kuzmin SA, Akhatrin SM, Menins DT. 1999. The first findings of the snow crab Chionoecetes opilio (Decapoda, Majidae) in the Barents Sea. Zool Zh 77:489–491
Kuzmin SA. 2000. Spreading of snow crab Chionoecetes opilio (Fabricius) in the Barents Sea. Int. Counc. Expl. Sea. CM 2000/U:21, 7 p.
Lee JE, Chown SL. 2007 Mytilus on the move: Transport of an invasive bivalve to the Antarctic. Marine Ecology Progress Series 339:307 - 310 https//doi.org/10.3354/meps339307
Lehtiniemi M, Ojaveer H, David M, Galil B, Gollasch S, McKenzie C, Minchin D, Occhipinti-Ambrogi A, Olenin S, Pederson J. 2015. Dose of truth – monitoring marine non-indigenous species to serve legislative requirements. Marine Policy 54:26-35.
Leppäkoski E, Olenin S. 2000. Non-native species and rates of spread: lessons from the brackish Baltic Sea. Biol. Invasions, 2, 151–163.
Leung B, Lodge DM, Finnoff D, Shogren JF, Lewis MA, Lamberti G. 2002. An ounce of prevention or a pound of cure: bioeconomic risk analysis of invasive species. Proceedings of the Royal Society B 269: 2407-2413.
Madenjian CP, Tapanian MA, Witzel LD, Einhouse DW, Pothoven SA, Whitford HL. 2011. Evidence for predatory control of the invasive round goby. Biological Invasions 13:987–1002.
McKenzie CH, Reid V, Lampert G, Matheson K, Minchin D, Pederson J, Brown L, Curd A, Gollasch S, Coulletquer P, Occhipinti-Ambrogi A, Simard N, Therriault TW. 2017. Alien Species Alert: Didemnum vexillum Kott, 2002: Invasion, impact, and control. ICES COOPERATIVE RESEARCH REPORT RAPPORT DES RECHERCHES COLLECTIVES NO. 335
Minchin D. 2007. Rapid coastal survey for targeted alien species associated with floating pontoons in Ireland. Aquatic Invasions 2:63-70.
Mortensen S, et al. 2021. Towards a sustainable fishery and use of cleaner fish in salmonid aquaculture.
Mortensen S, Strand Ø. 2000. Releases and recaptures of Manila clams (Ruditapes philippinarum) introduced to Norway.
Mortensen S, Strand Å, Bodvin T, Alfjorden A, Skår CK, Jelmert A, Aspán A, Sælemyr L, Naustvoll LJ, Albretsen J. 2016. Summer mortalities and detection of ostreid herpesvirus microvariant in Pacific oyster Crassostrea gigas in Sweden and Norway. Diseases of Aquatic Organisms 117: 171–176, https://doi.org/10.3354/dao02944
Mortensen S, Bodvin T, Strand Å, Holm MW, Dolmer P. 2017. Effects of a bio-invasion of the Pacific oyster, Crassostrea gigas (Thunberg, 1793) in five shallow water habitats in Scandinavia. Managing Biological Invasions 8: 543-552.
Mortensen S, Strand Å, Dolmer P, Laugen AT, Naustvoll L-J. 2019. Høsting av stillehavsøsters. TemaNord 2019:552, Nordisk ministerråd, ISBN 978-92-893-6425-6 (pdf) http://dx.doi.org/10.6027/tn2019-552, 115s. (in Norwegian).
Mortensen S, Skår C. 2020. The surveillance and control programme for bonamiosis and marteiliosis in European flat oysters, Ostrea edulis, and blue mussels, Mytilus sp. in Norway in 2019. Rapport fra havforskningen nr 36, 2020, 16 s. https://www.hi.no//hi/nettrapporter/rapport-fra-havforskningen-en-2020-36
Moseid CVS, Falkenhaug T, Slettan A. 2021. Development of a TaqMan PCR assay for the identification of the non-native copepod Acartia tonsa, and detection of this species in Norwegian coastal waters, Journal of Plankton Research, Volume 43:3, Pages 497–499, https://doi.org/10.1093/plankt/fbab029
Munro ES, McIntosh RE, Weir SJ, Noguera PA, Sandilands JM, Matejusova I, Mayes AS, Smith, R. 2015. A mortality event in wrasse species (Labridae) associated with the presence of viral haemorrhagic septicaemia virus. Journal of Fish Diseases 38: 335–341. DOI: 10.1111/jfd.12237
Nunkoo I, Hemmingsen W, McKenzie K, Karlsbakk E, Arneberg P. Submitted. The Barents Sea snow crab (Chionoecetes opilio) invasion and Trypanosoma murmanense infections in cod (Gadus morhua).
Nunes AL, Katsanevakis A, Zenetos A, Cardoso AC. 2014. Gateways to alien invasions in the European seas. Aquatic Invasions 9:133-144. doi: http://dx.doi.org/10.3391/ai.2014.9.2.02
Nyberg CD, Wallentinus I. 2005. Can species traits be used to predict marine macroalgal introductions? Biological Invasions 7: 265-279
Næss, R. 2015. Populasjonsdynamikk og diett hos Mnemiopsis leidyi (Amerikansk lobemanet) UiA Bacehloroppgave i biologi. referansenummer 086-BIO
Ojaveer H, Galil BS, Lehtiniemi M, Christoffersen M, Clink S, Florin A-B, Gruszka P, Puntila R, Behrens J. 2015. Twenty five years of invasion: management of the round goby Neogobius melanostomus in the Baltic Sea. Management of Biological Invasions 6:329-339.
Oliveira OMP. 2007. The presence of the ctenophore Mnemiopsis leidyi in the Oslofjorden and considerations on the initial invasion pathways to the North and Baltic Seas. European Research Network on Aquatic Invasive Species. Aquatic Invasions (2007) 2(3): 185-189.
Orlov YI, Ivanov BG. 1978. On the introduction of Kamchatka king crab Paralithodes camtschatica (Decapoda: Anomura: Lithodidae) into Barents Sea. Mar. Biol. 48, 373-375.
Orlov YuI, Karpevich AF. 1965. On the introduction of the commercial crab Paralithodes camtschaticus (Tilesius) into the Barents Sea. Rapp. P.-V. Reun. Cons. Int. Explor. Mer 156: 59-61.
Ouellet P, Sainte-Marie B. 2018. Vertical distribution of snow crab (Chionoecetes opilio) pelagic stages in the Gulf of St. Lawrence (Canada) and effect of temperature on development and survival. ICES J. Mar. Sci., 75 (2): 773-784.
Oug E, Cohrane KJ, SundetJH, Norling K, Nilsson HC. 2011. Effects of the invasive red king crab (Paralithodes camtschaticus) on soft-bottom fauna in Varangerfjorden, northern Norway. Mar. Biodiv. 41: 467-479.
Patel S, Korsnes K, Bergh Ø, Vik-Mo F, Pedersen J, Nerland AH. 2007. Nodavirus in farmed Atlantic cod Gadus morhua in Norway. Diseases of Aquatic Organisms 77: 169–173. https://doi.org/10.3354/dao01842
Pavičić M, Dragičević B, Žužul I, Vrdoljak D, Matić- Skoko S, Šegvić-Bubić T. 2020. First record of American lobster, Homarus americanus (H. Milne Edwards, 1837), in the Mediterranean Sea. BioInvasions Records 9: 83–88.
Rech S, Borell Y, Garcia-Vazquez E. 2016. Marine litter as a vector for non-native species: What we need to know. Marine Pollution Bulletin 113: 40-43.
Reise K, Olenin S, Thieltges DW. 2006. Are aliens threatening European aquatic coastal ecosystems? Helgoland Marine Research 60: 77–83, https://doi.org/10.1007/s10152-006-0024-9
Robalo JI, Castilho R, Francisco SM, Almada F, Knutsen H, Jorde PE, Pereira AM, Almada V. 2012. Northern refugia and recent expansion in the North Sea: the case of the wrasse Symphodus melops (Linnaeus, 1758). Ecology and Evolution 2: 153–164. https://doi.org/10.1002/ece3.77
Roche RC, Monnington JM, Newstead RG, Sambrook K, Griffith K, Holt RHF, Jenkins SR. 2015. Recreational vessels as a vector for marine non-natives: developing biosecurity measures and managing risk through an in-water encapsulation system. Hydrobiologia, 750(1): 187–199.
Sandvik H, Dolmen D, Elven R, Falkenhaug T, Forsgren E, Hansen H, et al. 2019. Alien plants, animals, fungi and algae in Norway: an inventory of neobiota. Biological Invasions 21: 2997–3012. http://dx.doi.org/10.1007/s10530-019-02058-x
Sandvik H, Hilmo O, Henriksen S, Elven R, Åsen PA, Hegre H, et al. 2020. Alien species in Norway: results from quantitative ecological impact assessments. Ecological Solutions and Evidence 1: e12006. http://dx.doi.org/10.1002/2688-8319.12006
Schönherz AA, Hansen MHH, Jorgensen HBH, Berg P, Lorenzen N, Einer-Jensen K. 2012. Oral transmission as a route of infection for viral haemorrhagic septicaemia virus in rainbow trout, Oncorhynchus mykiss (Walbaum). Journal of Fish Diseases 35: 395-406. https://doi.org/10.1111/j.1365-2761.2012.01358.x
Seljestad G, Quintela M, Faust E, Halvorsen KT, Besnier F, Jansson E, Dahle G, Knutsen H, André C, Folkvord A, Glover KA. 2020. “A cleaner-break”: Genetic divergence between geographic groups and sympatric phenotypes revealed in Ballan wrasse (Labrus bergylta). Ecology and Evolution 10: 6120–6135. https://doi.org/10.1002/ece3.6404
Skaala Ø, Borstrøm R, Fiske P, Hindar K, Jensen AJ, Mo TA. 2021. Rengbueørret (Onchorhyncus mykiss); produksjon og interaskjoner med stedegne arter. Rapport fra Hvaforskningen 2020-21.
Slizkin AG. 1982. Distribution of snow crabs of the genus Chionoecetes and their habitat in the northern part of the Pacific Ocean: population dynamics and reproductive conditions of commercial invertebrates and algae in the Far Eastern Seas. Izv Tikhookean Nauchno-Issled Inst Ryb Khoz Oceanogr, 106:26–33 (Canadian Translation of Fisheries and Aquatic Sciences No. 5664).
Stevens, BG. 2014. Devleopment and biology of king crab larvae, pp. 233-259. In King Crabs of the World. Biology and Fisheries Management, BG Stevens (ed). CRC Press, Taylor and Francis Group. 608 p.
Strand KO, Huserbråten M, Dagestad K-F, Mauritzen C, Grøsvik BE, Nogueira LA, Melsom A, Røhrs J. 2021. Potential sources of marine plastic from survey beaches in the Arctic and Northeast Atlantic. Science of the Total Environment 790: 1-13.
Strand Å, Blanda E, Bodvin T, Davids JK, Jensen LF, Holm-Hansen TH, Jelmert A, Lindegarth S, Mortensen S, Moy FE, Nielsen P, Norling P, Nyberg C, Christensen HT, Vismann B, Holm MW, Hansen BW, Dolmer P. 2012. Impact of an icy winter on the Pacific oyster (Crassostrea gigas Thunberg, 1793) populations in Scandinavia. Aquatic Invasions 7: 433–440, https://doi.org/10.3391/ai.2012.7.3.014
Stebbing, P, P Johnson, A Delahunty, PF Clark, T McCollin, C hale & S Clark. 2012. Reports of American lobsters, Homarus americanus (H. Milne Edwards, 1837), in British waters. BioInvasions Records, 1(1): 17-23.
Sundal-Joys IK. 2021. Temperature tolerance and distribution of the invasive non-indigenous red algae Agarophyton vermiculophyllum in seagras meadows in Norway. Master Thesis, University og Bergen. 2.11.2021.
Sundet JH. 2014. Red king crab in the Barents Sea, pp. 485-500. In King Crabs of the World. Biology and Fisheries Management, BG Stevens (ed). CRC Press, Taylor and Francis Group. 608 p.
Sundet JH, Hoel AH. 2016. The Norwegian management of an introduced species: the Arctic red king crab fishery. Marine Policy, 72: 278-284.
Sundet JH, Tranang CA, Nilssen EM, Jenssen M. In prep. Stomach content of the snow crab (Chionoecetes opilio) from the western Barents Sea.
Sussarellu R, Huvet A, Lapègue S, Quillen V, Lelong C, Cornette F, Jensen LF, Bierne N, Boudry P. 2015. Additive transcriptomic variation associated with reproductive traits suggest local adaptation in a recently settled population of the Pacific oyster, Crassostrea gigas. BMC Genomics 16: 808, https://doi.org/10.1186/s12864-015-1972-8
Takahashi CK, Lourenço NGGS, Lopes TF, Rall LM, Lopes CAM. 2008. BALLAST WATER: A REVIEW OF THE IMPACT ON THE WORLD PUBLIC HEALTH. J. Venom. Anim. Toxins incl. Trop. Dis., 2008, 14, 3, p. 398
Tambs-Lyche, H. 1964. Gonionemus vertens L. AGASSIZ (Limnomedusae) - a zoogeographical puzzle. Sarsia 15: 1-8
Tiselius P, Møller LF 2017. Community casacades in a marine pelagic food web controlled by the non-visual apex predator Mnemiopsis leidyi J. Plankton res. 39: 271-279
Tutman P, Kaparis K, Kirincic M, Pallaoro A. 2017. Floating marine litter as a raft of drifting voyages for Planes minutus (Crustacea: Decapoda: Grapsidae) and Liocarcinus navigator (Crustacea: Decapoda: Polybiidae). Marine Pollution Bulletin 120: 217-221.
Verliin A, Kesler M, Svirgsden R, Taal I, Saks L, Rohtla M, Hubel, K, Eshbaum R, Vetemaa M. 2017. Invasion of round goby to the temperate salmon streams in the Baltic Sea. Ichtyological Research 64:155-158.
VKM 2019. Rueness E, Berg PR, Gulla S, Halvorsen K, Järnegren J, Malmstrøm M, Mo TA, Rimstad E, de Boer H, Eldegard K, Hindar K, Hole LR, Kausrud K, Kirkendall L, Måren I, Nilsen EB, Thorstad EB, Nielsen A, Velle G 2019. Assessment of the risk to Norwegian biodiversity from import of wrasses and other cleaner fish for use in aquaculture. Opinion of the Panel on Alien Organisms and Trade in Endangered Species (CITES) of the Norwegian Scientific Committee for Food and Environment. VKM report 2019: 15, ISBN: 978-82-8259-330-4, ISSN: 2535-4019. Oslo, Norway
Ware C, Berge J, Jelmert A, Olsen SM, Pellissier L, Wisz M, Kriticos D, Semenov G, Kwaśniewski S, Alsos IG. 2015. Biological introduction risks from shipping in a warming Arctic. Journal of Applied Ecology. doi: 10.1111/1365-2664.12566 10.1111/1365-2664.12566
Wiegleb J, Hirsch PE, Seidel F, Rauter G, Burkhardt-Holm P. 2021. Flow, force, behaviour: assessment of a prototype hydraulic barrier for invasive fish. Hydrobiologia. https://doi.org/10.1007/s10750-021-04762-z
Williams AB. 1984. Shrimps, lobster and crabs of the Atlantic coast and eastern United States, Main to Florida, Smithsonian Institution Press, Washington DC
Woll A, Skiftesvik AB, Solevåg SE, Hansen Aas G, Bakke S, Bjelland R. 2013. Fiskestørrelse og rømming fra laksemerd. Norsk Fiskeoppdrett August 2013 (in Norwegian).
Wonham MJ, Carlton JT, Ruiz GM, Smith LD. 2000. Fish and ships: relating dispersal frequency to success in biological invasions. Marine Biology 136:1111-1121.
Wrange AL, Valero J, Harkestad LS, Strand Ø, Lindegarth S, Christensen HT, Dolmer P, Kristensen PS, Mortensen S. 2010. Massive settlements of the Pacific oyster, Crassostrea gigas, in Scandinavia. Biological Invasions 12: 1145–115, https://doi.org/10.1007/s10530-009-9535-z
Østhagen A, Raspotnik A. 2018. Crab! How a dispute over snow crab became a diplomatic headache between Norway and the EU. Marine policy, 98: 58-61.
Øresland V, Ulmestrand M, Agnalt A-L, Oxby G. 2017. Recorded captures of American lobster (Homarus americanus) in Swedish waters and an observation of predation on the European lobster (Homarus gammarus). Can. J. Fish. Aquat. Sci, 74: 1503-1506.
7 - Appendix 1
Table 1. Arrival of cargo vessels into Norwegian ports in the period oktober 2020- oktober 2021. * 500 arrivals =>500 arrivals. ** The annual number of arrivals is estimated for ports which recieved more than 500 arrivals per year, calculated by days/500 arrivals.
County
Port
*Arrivals
Foreign
% Foreign
Days/500 arrivals
**Annual arrivals
Agder
Flekkefjord
29
3
10 %
29
Agder
Farsund
253
44
17 %
253
Agder
Hausvik
155
50
32 %
155
Agder
Lyngdal
90
15
17 %
90
Agder
Mandal
271
29
11 %
271
Agder
Høllen
297
10
3 %
297
Agder
Flekkerøy
5
0
0 %
5
Agder
Kristiansand
500
105
21 %
189
966
Agder
Lillesand
80
15
19 %
80
Agder
Grimstad
28
11
39 %
28
Agder
Arendal
211
56
27 %
211
Agder
Eydehavn
171
82
48 %
171
Agder
Risør
10
0
0 %
10
Møre & Romsdal
Larsnes
44
0
0 %
44
Møre & Romsdal
Mjølstadneset
98
1
1 %
98
Møre & Romsdal
Fosnavåg
37
0
0 %
37
Møre & Romsdal
Ulsteinvik
99
7
7 %
99
Møre & Romsdal
Hjørungavåg
60
3
5 %
60
Møre & Romsdal
Hareid
67
1
1 %
67
Møre & Romsdal
Ørsta
138
2
1 %
138
Møre & Romsdal
Fiskarstranda
48
1
2 %
48
Møre & Romsdal
Spjelkavik
402
6
1 %
402
Møre & Romsdal
Ålesund
500
21
4 %
81
2253
Møre & Romsdal
Søvik
50
2
4 %
50
Møre & Romsdal
Steinshamn
40
0
0 %
40
Møre & Romsdal
Brattvåg
26
1
4 %
26
Møre & Romsdal
Vestnes
346
2
1 %
346
Møre & Romsdal
Molde
250
3
1 %
250
Møre & Romsdal
Elnesvågen
222
4
2 %
222
Møre & Romsdal
Harøysundet
187
3
2 %
187
Møre & Romsdal
Averøya
500
61
12 %
237
770
Møre & Romsdal
Sunnalsøra
308
37
12 %
308
Møre & Romsdal
Kristiansund
500
4
1 %
119
1534
Nordland
Brønnøysund
500
2
0 %
187
976
Nordland
Herøy
500
0
0 %
346
527
Nordland
Sandnessjøen
490
0
0 %
490
Nordland
Mosjøen
182
71
39 %
182
Nordland
Mo i Rana
500
156
31 %
238
767
Nordland
Halsa Meløy
500
21
4 %
169
1080
Nordland
Glomfjord
319
104
33 %
319
Nordland
Ørnes
312
0
0 %
312
Nordland
Fauske
165
0
0 %
165
Nordland
Rognan
35
4
11 %
35
Nordland
Bodø
500
0
0 %
144
1267
Nordland
Kjøpsvik
169
28
17 %
169
Nordland
Hekkelstrand
500
1
0 %
286
638
Nordland
Narvik
376
196
52 %
376
Nordland
Lødingen
280
2
1 %
280
Nordland
Svolvær
371
0
0 %
371
Nordland
Leknes
159
1
1 %
159
Nordland
Stokkmarknes
500
8
2 %
281
649
Nordland
Sortland
500
7
1 %
128
1426
Nordland
Myre
486
5
1 %
486
Nordland
Andenes
50
0
0 %
50
Oslo
Oslo
500
223
45 %
88
2074
Rogaland
Ølen
167
5
3 %
167
Rogaland
Haugesund
500
48
10 %
32
5703
Rogaland
Storasund
500
9
2 %
153
1193
Rogaland
Husøya
500
78
16 %
100
1825
Rogaland
Skudeneshavn
105
17
16 %
105
Rogaland
Kårstø
11
0
0 %
11
Rogaland
Sauda
291
94
32 %
291
Rogaland
Forsand
332
0 %
332
Rogaland
Sandnes
408
71
17 %
408
Rogaland
Stavanger anch
139
42
30 %
139
Rogaland
Mekjarvik
129
18
14 %
129
Rogaland
Tananger
500
180
36 %
124
1472
Rogaland
Sirevåg
48
8
17 %
48
Rogaland
Egersund
481
142
30 %
481
Rogaland
Jøssingfjord
218
105
48 %
218
Rogaland
Breiviken
500
109
22 %
148
1233
Rogaland
Stavanger
500
89
18 %
225
811
Rogaland
Dusavik
216
14
6 %
216
Svalbard
Ny Ålesund
20
0
0 %
20
Svalbard
Longyearbyen
44
0
0 %
44
Troms & Finnmark
Bergneset
370
11
3 %
370
Troms & Finnmark
Harstad
500
2
0 %
193
946
Troms & Finnmark
Finnsnes
320
0
0 %
320
Troms & Finnmark
Tromsø
500
4
1 %
67
2724
Troms & Finnmark
Øksfjord
350
0
0 %
350
Troms & Finnmark
Alta
127
0
0 %
127
Troms & Finnmark
Rypefjord
500
1
0 %
196
931
Troms & Finnmark
Hammerfest
500
0
0 %
165
1106
Troms & Finnmark
Melkeøya
9
0
0 %
9
Troms & Finnmark
Havøysund
396
0
0 %
396
Troms & Finnmark
Honningsvåg
197
0
0 %
197
Troms & Finnmark
Mehamn
42
0
0 %
42
Troms & Finnmark
Båtsfjord
204
45
22 %
204
Troms & Finnmark
Vardø
20
1
5 %
20
Troms & Finnmark
Vadsø
19
0
0 %
19
Troms & Finnmark
Kirkenes
121
41
34 %
121
Trøndelag
Nordskaget
19
0
0 %
19
Trøndelag
Orkanger
298
71
24 %
298
Trøndelag
Trondheim
500
21
4 %
217
841
Trøndelag
Verdal
238
56
24 %
238
Trøndelag
Lysøysund
45
0
0 %
45
Trøndelag
Kjerkeholmen
94
0
0 %
94
Trøndelag
Sandviksberget
500
0
0 %
323
565
Trøndelag
Namsos
224
0
0 %
224
Trøndelag
Rørvik
500
0
0 %
169
1080
Vestfold og Telemark
Kragerø Anch
33
16
48 %
33
Vestfold og Telemark
Kragerø
446
153
34 %
446
Vestfold og Telemark
Langesund
141
0
0 %
141
Vestfold og Telemark
Brevik
500
183
37 %
265
689
Vestfold og Telemark
Rafnes
131
100
76 %
131
Vestfold og Telemark
Porsgrunn
500
292
58 %
194
941
Vestfold og Telemark
Larvik
395
90
23 %
395
Vestfold og Telemark
Sandefjord
4
0
0 %
4
Vestfold og Telemark
Slagen
0
0
0 %
0
Vestfold og Telemark
Horten
196
125
64 %
196
Vestfold og Telemark
Holmestrand
34
30
88 %
34
Vestland
Hanøytangen
86
8
9 %
86
Vestland
Ågotnes
458
45
10 %
458
Vestland
Skipavik
216
49
23 %
216
Vestland
Mongstad
410
26
6 %
410
Vestland
Sture
2
0
0 %
2
Vestland
Storabø
156
5
3 %
156
Vestland
Torangsvåg
415
3
1 %
415
Vestland
Rubbestadneset
64
1
2 %
64
Vestland
Stord havn
152
26
17 %
152
Vestland
Odda
249
152
61 %
249
Vestland
Husnes
173
15
9 %
173
Vestland
Høylandsbygd
15
0
0 %
15
Vestland
Sløvåg anch
68
16
24 %
68
Vestland
Sløvåg
427
87
20 %
427
Vestland
Leirvik Hyllestad
103
2
2 %
103
Vestland
Høyanger
446
26
6 %
446
Vestland
Årdalstangen
197
42
21 %
197
Vestland
Florø
500
39
8 %
73
2500
Vestland
Svelgen
209
42
20 %
209
Vestland
Kalvåg
96
0
0 %
96
Vestland
Måløy
500
17
3 %
70
2607
Vestland
Raudeberg
93
2
2 %
93
Vestland
Kolsnes
39
3
8 %
39
Vestland
Eikefet
500
64
13 %
500
Vestland
Bergen
500
12
2 %
94
1941
Vestland
Leirvik
265
1
0 %
265
Viken
Drammen
473
250
53 %
473
Viken
Drøbak
1
0
0 %
1
Viken
Kambo
97
46
47 %
97
Viken
Moss
306
100
33 %
306
Viken
Fredrikstad
500
235
47 %
165
1106
Viken
Hvaler
0
0
0 %
0
Viken
Halden
112
18
16 %
112
Table 2. Arrival of tugs & special crafts into Norwegian ports in the period oktober 2020- oktober 2021. * 500 arrivals =>500 arrivals. ** The annual number of arrivals is estimated for ports which recieved more than 500 arrivals per year, calculated by days/500 arrivals.
County
Port
*Arrivals
Foreign
% Foreign
Days/500 arrivals
*Annual arrivals
Agder
Flekkefjord
135
3
2 %
135
Agder
Farsund
500
5
1 %
158
1155
Agder
Hausvik
24
0
0 %
24
Agder
Lyngdal
51
3
6 %
51
Agder
Mandal
374
6
2 %
374
Agder
Høllen
218
0
0 %
218
Agder
Flekkerøy
261
0
0 %
261
Agder
Kristiansand
500
3
1 %
67
2724
Agder
Lillesand
385
0
0 %
385
Agder
Grimstad
189
1
1 %
189
Agder
Arendal
500
2
0 %
167
1093
Agder
Eydehavn
140
3
2 %
140
Agder
Risør
116
3
3 %
116
Møre & Romsdal
Larsnes
500
0
0 %
252
724
Møre & Romsdal
Mjølstadneset
99
2
2 %
99
Møre & Romsdal
Fosnavåg
254
1
0 %
254
Møre & Romsdal
Ulsteinvik
191
7
4 %
191
Møre & Romsdal
Hjørungavåg
22
0
0 %
22
Møre & Romsdal
Hareid
114
4
4 %
114
Møre & Romsdal
Ørsta
26
2
8 %
26
Møre & Romsdal
Fiskarstranda
86
2
2 %
86
Møre & Romsdal
Spjelkavik
124
5
4 %
124
Møre & Romsdal
Ålesund
500
2
0 %
48
3802
Møre & Romsdal
Søvik
114
0
0 %
114
Møre & Romsdal
Steinshamn
241
0
0 %
241
Møre & Romsdal
Brattvåg
269
0
0 %
269
Møre & Romsdal
Vestnes
500
3
1 %
500
Møre & Romsdal
Molde
500
1
0 %
326
560
Møre & Romsdal
Elnesvågen
87
0
0 %
87
Møre & Romsdal
Harøysundet
96
0
0 %
96
Møre & Romsdal
Averøya
263
2
1 %
263
Møre & Romsdal
Sunnalsøra
86
0
0 %
86
Møre & Romsdal
Kristiansund
500
0
0 %
33
5530
Nordland
Brønnøysund
500
2
0 %
213
857
Nordland
Herøy
500
0
0 %
194
941
Nordland
Sandnessjøen
500
0
0 %
53
3443
Nordland
Mosjøen
71
0
0 %
71
Nordland
Mo i Rana
111
2
2 %
111
Nordland
Halsa Meløy
87
0
0 %
87
Nordland
Glomfjord
61
0
0 %
61
Nordland
Ørnes
74
0
0 %
74
Nordland
Fauske
110
0
0 %
110
Nordland
Rognan
19
1
5 %
19
Nordland
Bodø
500
3
1 %
115
1587
Nordland
Kjøpsvik
12
0
0 %
12
Nordland
Hekkelstrand
335
0
0 %
335
Nordland
Narvik
500
0
0 %
288
634
Nordland
Lødingen
500
0
0 %
147
1241
Nordland
Svolvær
500
0
0 %
293
623
Nordland
Leknes
68
0
0 %
68
Nordland
Stokkmarknes
466
0
0 %
466
Nordland
Sortland
500
0
0 %
93
1962
Nordland
Myre
500
0
0 %
256
713
Nordland
Andenes
299
0
0 %
299
Oslo
Oslo
500
33
7 %
8
22813
Rogaland
Ølen
155
2
1 %
155
Rogaland
Haugesund
500
17
3 %
66
2765
Rogaland
Storasund
500
1
0 %
140
1304
Rogaland
Husøya
500
16
3 %
261
699
Rogaland
Skudeneshavn
139
0
0 %
139
Rogaland
Kårstø
500
0
0 %
116
1573
Rogaland
Sauda
189
0
0 %
189
Rogaland
Forsand
37
0
0 %
37
Rogaland
Sandnes
130
1
1 %
130
Rogaland
Stavanger anch
500
26
5 %
309
591
Rogaland
Mekjarvik
484
27
6 %
484
Rogaland
Tananger
500
14
3 %
47
3883
Rogaland
Sirevåg
31
0
0 %
31
Rogaland
Egersund
500
3
1 %
306
596
Rogaland
Jøssingfjord
89
1
1 %
89
Rogaland
Breiviken
289
0
0 %
289
Rogaland
Stavanger
500
16
3 %
57
3202
Rogaland
Dusavik
500
11
2 %
105
1738
Svalbard
Ny Ålesund
153
0
0 %
153
Svalbard
Longyearbyen
500
0
0 %
163
1120
Troms & Finnmark
Bergneset
14
0
0 %
14
Troms & Finnmark
Harstad
500
1
0 %
65
2808
Troms & Finnmark
Finnsnes
447
0
0 %
447
Troms & Finnmark
Tromsø
500
0
0 %
38
4803
Troms & Finnmark
Øksfjord
74
0
0 %
74
Troms & Finnmark
Alta
348
0
0 %
348
Troms & Finnmark
Rypefjord
500
0
0 %
143
1276
Troms & Finnmark
Hammerfest
500
1
0 %
101
1807
Troms & Finnmark
Melkeøya
122
0
0 %
122
Troms & Finnmark
Havøysund
431
0
0 %
431
Troms & Finnmark
Honningsvåg
500
0
0 %
282
647
Troms & Finnmark
Mehamn
188
0
0 %
188
Troms & Finnmark
Båtsfjord
277
0
0 %
277
Troms & Finnmark
Vardø
500
0
0 %
236
773
Troms & Finnmark
Vadsø
27
5
19 %
27
Troms & Finnmark
Kirkenes
500
13
3 %
278
656
Trøndelag
Nordskaget
39
0
0 %
39
Trøndelag
Orkanger
45
2
4 %
45
Trøndelag
Trondheim
500
1
0 %
123
1484
Trøndelag
Verdal
156
12
8 %
156
Trøndelag
Lysøysund
321
1
0 %
321
Trøndelag
Kjerkeholmen
496
0
0 %
496
Trøndelag
Sandviksberget
330
0
0 %
330
Trøndelag
Namsos
148
0
0 %
148
Trøndelag
Rørvik
500
1
0 %
107
1706
Vestfold og Telemark
Kragerø
500
4
1 %
128
1426
Vestfold og Telemark
Langesund
500
0
0 %
54
3380
Vestfold og Telemark
Brevik
500
4
1 %
13
14038
Vestfold og Telemark
Rafnes
500
0
0 %
139
1313
Vestfold og Telemark
Porsgrunn
500
1
0 %
90
2028
Vestfold og Telemark
Larvik
124
2
2 %
124
Vestfold og Telemark
Sandefjord
139
1
1 %
139
Vestfold og Telemark
Slagen
500
18
4 %
289
631
Vestfold og Telemark
Horten
500
1
0 %
176
1037
Vestfold og Telemark
Holmestrand
153
0
0 %
153
Vestland
Hanøytangen
271
6
2 %
271
Vestland
Ågotnes
500
12
2 %
270
676
Vestland
Skipavik
411
6
1 %
411
Vestland
Mongstad
500
6
1 %
47
3883
Vestland
Sture
500
0
0 %
210
869
Vestland
Storabø
132
2
2 %
132
Vestland
Torangsvåg
417
1
0 %
417
Vestland
Rubbestadneset
269
2
1 %
269
Vestland
Stord havn
340
6
2 %
340
Vestland
Odda
43
0
0 %
43
Vestland
Husnes
111
0
0 %
111
Vestland
Høylandsbygd
292
3
1 %
292
Vestland
Sløvåg anch
288
4
1 %
288
Vestland
Sløvåg
500
2
0 %
133
1372
Vestland
Leirvik Hyllestad
284
0
0 %
284
Vestland
Høyanger
105
2
2 %
105
Vestland
Årdalstangen
66
0
0 %
66
Vestland
Florø
500
7
1 %
46
3967
Vestland
Svelgen
51
0
0 %
51
Vestland
Kalvåg
182
0
0 %
182
Vestland
Måløy
500
9
2 %
131
1393
Vestland
Raudeberg
269
2
1 %
269
Vestland
Kolsnes
500
0
0 %
90
2028
Vestland
Eikefet
40
0
0 %
40
Vestland
Bergen
500
23
5 %
54
3380
Vestland
Leirvik
500
3
1 %
310
589
Viken
Drammen
310
6
2 %
310
Viken
Drøbak
387
0
0 %
387
Viken
Kambo
205
3
1 %
205
Viken
Moss
500
0
0 %
283
645
Viken
Fredrikstad
500
3
1 %
195
936
Viken
Hvaler
500
5
1 %
183
997
Viken
Halden
202
5
2 %
202
Table 3. Arrival of tankers into Norwegian ports in the period oktober 2020- oktober 2021. * 500 arrivals =>500 arrivals. ** The annual number of arrivals is estimated for ports which recieved more than 500 arrivals per year, calculated by days/500 arrivals.
County
Port
*Arrivals
Foreign
% Foreign
Days/500 arrivals
**Annual arrivals
Agder
Flekkefjord
1
0
0 %
1
Agder
Farsund
32
8
25 %
32
Agder
Hausvik
2
0
0 %
2
Agder
Lyngdal
1
0
0 %
1
Agder
Mandal
4
0
0 %
4
Agder
Høllen
1
0
0 %
1
Agder
Flekkerøy
0
0
0 %
0
Agder
Kristiansand
134
0
0 %
134
Agder
Lillesand
0
0
0 %
0
Agder
Grimstad
0
0
0 %
0
Agder
Arendal
3
0
0 %
3
Agder
Eydehavn
0
0
0 %
0
Agder
Risør
2
0
0 %
2
Møre & Romsdal
Larsnes
2
0
0 %
2
Møre & Romsdal
Mjølstadneset
5
0
0 %
5
Møre & Romsdal
Fosnavåg
18
0
0 %
18
Møre & Romsdal
Ulsteinvik
11
0
0 %
11
Møre & Romsdal
Hjørungavåg
4
0
0 %
4
Møre & Romsdal
Hareid
5
0
0 %
5
Møre & Romsdal
Ørsta
1
0
0 %
1
Møre & Romsdal
Fiskarstranda
14
0
0 %
14
Møre & Romsdal
Spjelkavik
28
15
54 %
28
Møre & Romsdal
Ålesund
500
0
0 %
319
572
Møre & Romsdal
Søvik
10
0
0 %
10
Møre & Romsdal
Steinshamn
6
0
0 %
6
Møre & Romsdal
Brattvåg
6
0
0 %
6
Møre & Romsdal
Vestnes
15
3
20 %
15
Møre & Romsdal
Molde
4
0
0 %
4
Møre & Romsdal
Elnesvågen
216
150
69 %
216
Møre & Romsdal
Harøysundet
5
0
0 %
5
Møre & Romsdal
Averøya
123
13
11 %
123
Møre & Romsdal
Sunnalsøra
34
0
0 %
34
Møre & Romsdal
Kristiansund
496
16
3 %
496
Nordland
Brønnøysund
170
0
0 %
170
Nordland
Herøy
55
0
0 %
55
Nordland
Sandnessjøen
97
3
3 %
97
Nordland
Mosjøen
73
22
30 %
73
Nordland
Mo i Rana
13
0
0 %
13
Nordland
Halsa Meløy
67
2
3 %
67
Nordland
Glomfjord
26
12
46 %
26
Nordland
Ørnes
3
0
0 %
3
Nordland
Fauske
0
0
0 %
0
Nordland
Rognan
1
0
0 %
1
Nordland
Bodø
144
11
8 %
144
Nordland
Kjøpsvik
2
0
0 %
2
Nordland
Hekkelstrand
1
0
0 %
1
Nordland
Narvik
7
0
0 %
7
Nordland
Lødingen
11
0
0 %
11
Nordland
Svolvær
9
0
0 %
9
Nordland
Leknes
1
0
0 %
1
Nordland
Stokkmarknes
73
1
1 %
73
Nordland
Sortland
3
0
0 %
3
Nordland
Myre
80
0
0 %
80
Nordland
Andenes
9
1
11 %
9
Oslo
Oslo
191
82
43 %
191
Rogaland
Ølen
14
0
0 %
14
Rogaland
Haugesund
500
44
9 %
226
808
Rogaland
Storasund
150
0
0 %
150
Rogaland
Husøya
98
42
43 %
98
Rogaland
Skudeneshavn
2
0
0 %
2
Rogaland
Kårstø
500
457
91 %
500
Rogaland
Sauda
4
0
0 %
4
Rogaland
Forsand
0
0
0 %
0
Rogaland
Sandnes
0
0
0 %
0
Rogaland
Stavanger anch
36
14
39 %
36
Rogaland
Mekjarvik
11
1
9 %
11
Rogaland
Tananger
241
73
30 %
241
Rogaland
Sirevåg
1
0
0 %
1
Rogaland
Egersund
48
9
19 %
48
Rogaland
Jøssingfjord
3
0
0 %
3
Rogaland
Breiviken
0
0
0 %
0
Rogaland
Stavanger
159
60
38 %
159
Rogaland
Dusavik
83
20
24 %
83
Svalbard
Ny Ålesund
3
0
0 %
3
Svalbard
Longyearbyen
18
0
0 %
18
Troms & Finnmark
Bergneset
66
0
0 %
66
Troms & Finnmark
Harstad
193
7
4 %
193
Troms & Finnmark
Finnsnes
25
0
0 %
25
Troms & Finnmark
Tromsø
500
9
2 %
293
623
Troms & Finnmark
Øksfjord
2
0
0 %
2
Troms & Finnmark
Alta
35
4
11 %
35
Troms & Finnmark
Rypefjord
65
6
9 %
65
Troms & Finnmark
Hammerfest
58
0
0 %
58
Troms & Finnmark
Melkeøya
5
2
40 %
5
Troms & Finnmark
Havøysund
0
0
0 %
0
Troms & Finnmark
Honningsvåg
11
0
0 %
11
Troms & Finnmark
Mehamn
7
0
0 %
7
Troms & Finnmark
Båtsfjord
26
0
0 %
26
Troms & Finnmark
Vardø
1
0
0 %
1
Troms & Finnmark
Vadsø
0
0
0 %
0
Troms & Finnmark
Kirkenes
29
1
3 %
29
Trøndelag
Nordskaget
48
2
4 %
48
Trøndelag
Orkanger
3
0
0 %
3
Trøndelag
Trondheim
170
41
24 %
170
Trøndelag
Verdal
14
1
7 %
14
Trøndelag
Lysøysund
155
1
1 %
155
Trøndelag
Kjerkeholmen
15
0
0 %
15
Trøndelag
Sandviksberget
7
0
0 %
7
Trøndelag
Namsos
0
0
0 %
0
Trøndelag
Rørvik
119
0
0 %
119
Vestfold og Telemark
Kragerø
1
0
0 %
1
Vestfold og Telemark
Langesund
1
0
0 %
1
Vestfold og Telemark
Brevik
2
1
50 %
2
Vestfold og Telemark
Rafnes
500
402
80 %
337
542
Vestfold og Telemark
Porsgrunn
233
180
77 %
233
Vestfold og Telemark
Larvik
25
24
96 %
25
Vestfold og Telemark
Sandefjord
91
79
87 %
91
Vestfold og Telemark
Slagen
452
196
43 %
452
Vestfold og Telemark
Horten
1
1
100 %
1
Vestfold og Telemark
Holmestrand
0
0
0 %
0
Vestland
Hanøytangen
9
0
0 %
9
Vestland
Ågotnes
101
1
1 %
101
Vestland
Skipavik
17
0
0 %
17
Vestland
Mongstad
500
316
63 %
70
2607
Vestland
Sture
203
183
90 %
203
Vestland
Storabø
35
0
0 %
35
Vestland
Torangsvåg
75
0
0 %
75
Vestland
Rubbestadneset
2
1
50 %
2
Vestland
Stord havn
7
0
0 %
7
Vestland
Odda
21
11
52 %
21
Vestland
Husnes
3
0
0 %
3
Vestland
Høylandsbygd
0
0
0 %
0
Vestland
Sløvåg anch
5
1
20 %
5
Vestland
Sløvåg
37
6
16 %
37
Vestland
Leirvik Hyllestad
1
0
0 %
1
Vestland
Høyanger
28
0
0 %
28
Vestland
Årdalstangen
0
0
0 %
0
Vestland
Florø
286
52
18 %
286
Vestland
Svelgen
29
6
21 %
29
Vestland
Kalvåg
2
0
0 %
2
Vestland
Måløy
405
4
1 %
405
Vestland
Raudeberg
1
0
0 %
1
Vestland
Kolsnes
164
0
0 %
164
Vestland
Eikefet
7
2
29 %
7
Vestland
Bergen
473
9
2 %
473
Vestland
Leirvik
8
0
0 %
8
Viken
Drammen
53
50
94 %
53
Viken
Drøbak
0
0
0 %
0
Viken
Kambo
16
1
6 %
16
Viken
Moss
3
2
67 %
3
Viken
Fredrikstad
473
206
44 %
473
Viken
Hvaler
0
0
0 %
0
Viken
Halden
4
2
50 %
4
8 - Appendix 2
Table 1. Country of last port call before entering Norwegian ports in the period 2020-2021. Vessel type codes: C= cargo, T= tankers, S= tugs & special crafts, F= fishing vessel, P= pleasure crafts.
Table 1 (continued). Country of last port call before entering Norwegian ports in the period 2020-2021. Vessel type codes: C= cargo, T= tankers, S= tugs & special crafts, F= fishing vessel, P= pleasure crafts.
Table 1 (continued). Country of last port call before entering Norwegian ports in the period 2020-2021. Vessel type codes: C= cargo, T= tankers, S= tugs & special crafts, F= fishing vessel, P= pleasure crafts.
Table 1 (continued). Country of last port call before entering Norwegian ports in the period 2020-2021. Vessel type codes: C= cargo, T= tankers, S= tugs & special crafts, F= fishing vessel, P= pleasure crafts.
Table 1 (continued). Country of last port call before entering Norwegian ports in the period 2020-2021. Vessel type codes: C= cargo, T= tankers, S= tugs & special crafts, F= fishing vessel, P= pleasure crafts.