Toktet for estimering av ungeproduksjon av grønlandssel og klappmyss i Grønlandshavet ble utført for å få oppdaterte estimater som skal brukes til å vurdere dagens status og oppdatere forvaltningsrådgivningen for disse to selartene. Siden den forrige undersøkelsen i 2018 indikerte en 40 % reduksjon i grønlandsselvalpeproduksjonen sammenlignet med 2012, og mangelen på økning i ungeproduksjon av den sterkt utarmede klappmyss-stammen til tross for beskyttelsen mot jakt siden 2007, var det viktig med en ny undersøkelse etter en periode på bare 4 år. Undersøkelsen ble utført ved bruk av veletablerte metoder for disse artene, inkludert 1) rekognosering av drivisen fra helikopter forskningsisbryteren R/V Kronprins Haakon, samt et fly stasjonert på Constable Pynt på Øst-Grønland, 2) utplassere GPS-sendere rundt de identifiserte kasteområdene for å overvåke forflyttingen med havstrømmene utenfor Østgrønland, 3) utføre stadiebestemmelser for å overvåke utviklingen i ungenes aldersstruktur og estimere den optimale dagen for ungetelling samt korreksjonsfaktorer som tar hensyn til unger som ikke er tilstede på isen på tellingstidspunktet, og 4) gjennomføring av flyfotografiering ved bruk av fastmontert kamera i flyet på Constable Pynt. Isforholdene i Grønlandshavet var lik de som ble opplevd i 2018, med et relativt smalt bånd med pakkis over sokkelskråningen nær kysten av Øst-Grønland. Kasteområder ble først oppdaget 21. og 22. mars, innenfor et område som strekket seg fra 72°53'N / 16°42'W i nord til 71°51'N / 17°30'W i sør. Fem GPS-sendere ble utplassert ved de viktigste kasteplassene i dette området, slik at vi kunne spore den kontinuerlige driften på grunn av sterk nordavind i perioden mellom innledende rekognosering og endelig ungetelling. Stadiebestemmelse ble utført 22., 23., 25., 28. og 30. mars, og de endelige fotografiske undersøkelsene ble utført 28. mars i et relativt smalt (20-30 nm) N/S-bånd som strekket seg fra 71°00'N / 20°00'W i NØ til 69°34'N / 20°36 'W i SV. Totalt ble det tatt 2 463 bilder, og når forbehandling (stadfesting og orto-rektifisering) er gjennomført vil bildene bli analysert både manuelt og ved hjelp av et spesialutviklet maskinlæringssystem, for å bestemme antall unger som er tilstede på bildene. Resultatene vil bli brukt til å estimere den totale ungeproduksjonen for hver art i 2022, og vil også bli kombinert med estimater fra tidligere år for å estimere populasjonsstørrelsene ved å bruke den dedikerte populasjonsdynamikkmodellen som er utviklet for dette formålet. Hele det oppdaterte datasettet vil bli gjort tilgjengelig for det kommende ICES benchmarking-møtet for populasjonsmodellering av grønlandssel og klappmyss, og resultatene vil endelig bli evaluert på møte i ICES WGHARP-arbeidsgruppen i 2023.
Report From Surveys To Assess Harp And Hooded Seal Pup Production In The Greenland Sea Pack-Ice In 2022
Report series:
Toktrapport 2022-7
ISSN: 1503-6294
Published: 07.06.2022
Cruise no.: 2022703
Project No.: 14391
On request by: Fiskeridepartementet
Research group(s):
Sjøpattedyr
Subject:
Grønlandssel,
Klappmyss
Program:
Norskehavet
Approved by:
Research Director(s):
Geir Huse
Program leader(s):
Bjørn Erik Axelsen
Norsk sammendrag
Summary
The 2022 survey of harp and hooded seal pup production in the Greenland Sea was carried out to obtain updated estimates to be used to assess current status of these two seal stocks. Since a similar survey in 2018 indicated a 40% reduction in harp seal pup production since the 2012 survey, and the continued lack of increase in pup production of the severely depleted hooded seal stock despite its protection from hunting since 2007, a new survey after a period of only 4 years was urgent. The survey was carried out using well established methodologies for these species, including 1) reconnaissance of the drift ice breeding habitat from a helicopter based on the research icebreaker R/V Kronprins Haakon and a fixed-wing aircraft stationed at Constable Pynt in East Greenland, 2) deploying GPS beacons around the identified breeding areas to monitor its displacement in the East Greenland Current, 3) carrying out staging surveys to monitor the pup age structure and estimate the optimal day of pup counting as well as correction factors accounting for pups not present on the ice at the time of counting, and 4) conducting aerial photographic surveys using the fixed-wing aircraft. Ice conditions in the Greenland Sea were similar as those experienced in 2018, with a relatively narrow band of pack ice over the shelf break near the coast of East Greenland. Seal whelping patches were initially discovered on March 21 & 22nd, within an area stretching from 72°53’N / 16°42’W in the north to 71°51’N / 17°30’W in the south. Five GPS beacons were deployed at the main whelping patches within this area, allowing us to track the continuous drift due to strong northerly winds during the period between initial reconnaissance and the final pup counting. Pup staging surveys were carried out on March 22nd, 23rd, 25th, 28th and 30th, providing us with a solid dataset with which to assess the development of pup age dynamics, determine the optimal day for photographic surveys, and to estimate correction factors to account for pups absent from the ice during the photographic surveys. The final photographic surveys were carried out on March 28th in a relatively narrow (20-30 nm) N/S band stretching from 71°00’N / 20°00’W in the NE to 69°34’N / 20°36’W in the SW. In total, 2,463 images were obtained during the aerial photographic survey, and following pre-processing (georeferencing and ortorectification), these will be analysed both manually and using dedicated machine learning systems, to determine the number of pups present in images. Results will be used to estimate the total 2022 pup production for each species and will also be combined with estimates from previous years to estimate the population sizes using the dedicated population dynamics model. The entire updated dataset will be made available to the upcoming ICES benchmarking meeting for harp and hooded seal population modelling, and results will finally be evaluated at the upcoming meeting of the ICES WGHARP working group in 2023.
1 - INTRODUCTION
Independent estimates of pup production, using aerial photo or visually based strip transect surveys, have been recommended and used to determine population size of harp (Pagophilus groenlandicus) and hooded (Cystophora cristata) seals in the northwest Atlantic (Bowen et al., 1987; Hammill et al., 1992; Stenson et al., 1993, 1997, 2002, 2003, 2005, 2006, 2010), in the Greenland Sea (Øritsland and Øien, 1995; Haug et al., 2006; ICES, 2006a; Salberg et al. 2008; Øigård et al. 2010, 2014a, 2014b; Biuw et al. 2022), and in the White Sea (Potelov et al., 2003; ICES, 2016). The status of the stocks is subsequently assessed by fitting population models to the independent estimates of pup production (e.g., Healey and Stenson, 2000; Hammill and Stenson, 2007; Skaug et al., 2007; Øigård et al., 2014a, 2014b). Both harp and hooded seal pup production was last assessed in the Greenland Sea in 2018 (Biuw et al., 2022). The ICES management of harp and hooded seals is based on a situation where these populations can be defined as “data rich” (ICES, 2006b). Data rich stocks should have data available for estimating abundance where a time series of at least three abundance estimates should be available spanning a period of 10-15, years with surveys separated by 2-5 years. The most recent abundance estimates should be prepared from surveys and supporting data (e.g., birth and mortality estimates) that are no more than 5 years old. The original plan was to conduct a new survey of the Greenland Sea harp and hooded seal stocks in 2023 to ensure these stocks met the data rich criterion. However, due to the observed reduction in harp seal pup production in 2018 (Biuw et al., 2022), it was decided to do a new survey already in 2022. The survey techniques applied were as decribed in Øigård et al. (2014a, 2014b) and in Biuw et al. (2022). The harp seal was the prime target species for the surveys, since this population is still hunted. Hooded seals have been protected since 2007 due to the low pup production numbers in recent decades (ICES 2006a, 2019) – to assess the effect of protection on the pup production, more than 5 years are needed due to the usually 4-5 years age at maturity observed in hooded seals (see Frie et al., 2012). One secondary goal of this latest survey was therefore to obtain a new abundance estimate for hooded seals in the area. Given the priority of harp seals, the possibility of obtaining a hooded seal pup production estimate would require that hooded seal breeding occurred within the same main areas as the harp seal breeding. This turned out to be the case for this survey, and pup production estimates for both harp and hooded seals in the Greenland Sea will be provided for the 2022 season. In addition to providing a short review of the status of the Greenland Sea harp and hooded seal populations, the present report reviews the activities on the ship-based part of the survey, including helicopter reconnaissance and pup staging surveys. Also, reconnaissance and photographic surveys using a fixed wing Grand Caravan aircraft based at Constable Pynt (Greenland) are described.
2 - STATUS OF THE SEAL STOCKS
2.1 - Harp seals
Three stocks of harp seals inhabit the North Atlantic Ocean (Sergeant, 1991). Whelping occurs east of Newfoundland and in the Gulf of StLawrence (the Northwest Atlantic stock), off the east coast of Greenland (the Greenland Sea or West Ice stock), and in the White Sea (the Barents Sea / White Sea stock). Relationships among the three North Atlantic populations of harp seals have been examined in studies of cranial measurements (Yablokov and Sergeant, 1963), underwater vocalizations (Perry and Terhune, 1999), serum transferrins (Møller et al., 1966; Nævdal, 1966, 1969, 1971), blood serum proteins (Borisov, 1966), allozymes (Meisfjord and Nævdal, 1994) and DNA (Meisfjord and Sundt, 1996; Perry et al., 2000). These studies have revealed significant differences between the Northwest Atlantic stock on one side and the Greenland Sea and Barents Sea harp seal stocks on the other, while Carr et al. (2015) found evidence of differenciation between the two latter. In late summer (July-August) seals from the Grenland Sea stock migrate into feeding grounds in the northern Barents Sea where they mingle with the Barents Sea stock before they return (in November-December) and spend the winter off south-east Greenland in the Denmark Strait (Folkow et al., 2004; Nordøy et al., 2008). Although tagging experiments suggest that mixing of immature animals between the West Ice and Barents Sea stocks may occur, there is no evidence of mixing on the breeding grounds (Øien & Øritsland, 1995). The two stocks are managed separately.
The Greenland Sea stocks of harp seals have been subject to commercial exploitation for centuries (Iversen, 1927; Nakken, 1988; Sergeant, 1991). Exploitation levels reached a historical maximum in the 1870s and 1880s when annual catches of harp seals (pups and adults) varied between 50 000 and 120 000 (Iversen, 1927). It was evident that the catch levels in the 1870s were higher than the stock could sustain, and some regulatory measures (mainly designed to protect adult females) were taken in 1876 (Iversen, 1927). In the first decades of the 20 th century, annual harp seal catches varied between 10 000 and 20 000 animals, whereas an increase to around 40 000 seals per year occurred in the 1930s (Iversen, 1927; Sergeant 1991). After a 5 year hiatus in the sealing operations during World War II, total annual catches quickly rose to a postwar maximum of about 70 000 in 1948, but then followed a decreasing trend until quotas were imposed in 1971 (Sergeant 1991, ICES 2001). From 1955 to 1994 some of the catches were taken by the Soviet Union / Russia, and the total annual catches have varied between a few hundreds to about 17 000 from 1971 to present (ICES, 2019).
Available knowledge of both previous and present abundance of Greenland Sea harp seals is rather restricted. As judged both from catch per unit of effort analyses and mark-recapture pup production estimates, it has been assumed that the stock has increased ever since the early 1960s, but evidence of the level of increase has been rather imprecise (Ulltang and Øien, 1988; Øien and Øritsland, 1995). During the period 1977-1991, about 17 000 harp seal pups were tagged in a comprehensive mark-recapture experiment in the Greenland Sea (Øien and Øritsland, 1995). From this experiment, a pup production of 40 000 – 50 000 was assumed in 1980. By modeling, the 1988 pup production was projected to have been within the range of 53 000 – 69 000, which would imply a stock of one year old and older (1+) animals within a range of 230 000- 290 000 (Ulltang and Øien, 1988). Updates of the mark-recapture based pup production estimates indicated a pup production in 1991 of 67 300 (s.e. = 5 400, cv = 8.0 %) (ICES, 2001). Results from aerial surveys suggested a minimum pup production in 1991 in excess of 55 000 (Øritsland and Øien, 1995). New aerial surveys conducted 11 years later in 2002 (see Haug et al., 2006) yielded an estimate of 98 500 (s.e. = 16 800, cv = 17.0%), whereas the two next estimates were 110 530 (s.e. = 27 680, cv = 25%) in 2007 (Øigård et al., 2010) and 89 590 (s.e. = 12 310, cv = 13.7%) in 2012 (Øigård et al. 2014a). Surveys conducted in 2018 yielded an estimated harp seal pup production of 54 181 (s.e. = 9 236, cv = 17%) which is significantly lower than the estimates obtained in 2002, 2007 and 2012 (Biuw et al., 2022). Incorporating available pup production estimates in a population model suggested a current population size of 426 808 (95% CI = 313 004-540 613) seals (ICES, 2019).
2.2 - Hooded seals
Two stocks of hooded seals are assumed to inhabit the North Atlantic Ocean (Sergeant, 1974; Kovacs and Lavigne, 1986). Whelping occurs east of Newfoundland, in the Gulf of StLawrence and in the Davis Strait between Greenland and Arctic Canada (the Northwest Atlantic stocks). Furthermore, hooded seals whelp in the Greenland Sea off the east coast of Greenland (the West Ice stock). So far no significant genetic differenciation (allozymes and DNA) have been found between hooded seals from the West Ice and from the Northwest Atlantic (Sundt et al., 1994; Coltman et al., 2007). Thus, while some degree of intermixing between the stocks must be assumed, the stocks are managed separately. In general, results from satellite telemetry programs indicate that hooded seals tagged in the West Ice during breeding and after moult remain within the Greenland, Norwegian and Icelandic Seas for the majority of the year (Folkow and Blix 1995, 1999; Folkow et al., 1996, Vacquie-Garcia et al., 2017). Recaptures of seals tagged as pups in the West Ice are consistent with these satellite tagging results (ICES, 1999).
The Greenland Sea stock of hooded seals has been subject to commercial exploitation for centuries (Iversen, 1927; Sergeant, 1966; Nakken, 1988; ICES, 2006a). The hunt increased substantially after 1920, and after a 5 year pause in the sealing operations during World War II, the postwar annual catches quickly rose to levels higher than the stock could sustain, and some regulatory measures (mainly to reduce effort) were taken in 1958 (Rasmussen, 1957, 1960; Øritsland, 1959; Sergeant, 1966). The total annual catches have subsequently followed a decreasing trend, primarily due to reduction in catch effort. Quotas were imposed in 1971, and except for a few animals taken for scientific purposes and by local Greenland hunters, the stock has been completely protected since 2007 (Kovacs and Lavigne, 1986; ICES, 2006a, 2019).
Knowledge of possible variations in the abundance of Greenland Sea hooded seals is rather restricted. As judged both from catch per unit of effort analyses and mark-recapture pup production estimates, it has been assumed that the stock has increased ever since the early 1960s, but evidence of the level of increase has been rather imprecise (Ulltang and Øien, 1988; Øritsland and Øien, 1995). Aerial surveys to estimate the hooded seal pup production were attempted, with rather limited success, in the Greenland Sea both in 1959 (Øritsland, 1959; Rasmussen, 1960) and in 1994 (Øritsland and Øien, 1995). More successful aerial surveys suggested a minimum pup production of c. 24 000 (s.e. = 4 600, cv = 19.0%) in 1997 (ICES, 1998, 1999). New aerial surveys to assess the Greenland Sea hooded seal pup production were conducted in 2005, 2007, 2012 and 2018. Using the same methodology as in the 1997 survey, the results from the 2005 survey suggested a hooded seal pup production in the Greenland Sea of 15 200 (s.e. = 3 790, cv = 24.9%, Salberg et al., 2008). The 2007, 2012 and 2018 surveys resulted in pup production of 16 140 (s.e. = 2 140, cv = 13.3%), 13 655 (s.e. = 1 900, cv = 13.9%) and 12 977 (s.e. = 1 823, cv = 14%), respectively (Øigård et al., 2010, 2014b; Biuw et al., 2022). While the 1997 estimate was a minimum estimate, not corrected for the temporal distribution of births or pups born outside of the whelping patches, the later estimates were corrected both for readers’ error and the temporal distribution of births. Thus, the results since 2005 indicated that pup production of hooded seals in the Greenland Sea were considerably lower than in 1997.
The historical data on pregnancy rates that are available for this population are unreliable. Hence, the population model was run assuming a range of pregnancy rates, in addition to one model run using the original model assuming constant reproduction rates. All model runs indicated a decrease in population abundance from the late 1940s and to the early 1980s. The most recent estimate for the total hooded seal population is 76 623 (95% CI = 58 299 – 94 947), which may be less than only 7% of the population level observed 70 years ago (ICES, 2019). Changes in size of harvested seal populations are often attributed to hunting pressure. However, during the periods 1982-2007, the average annual catch level has remained less than 5 000 animals (almost exclusively pups), and from 2007 there has been no hooded seal hunt in the Geenland Sea (ICES, 2019). Annual removals by Greenland hunters from the Northeast Atlantic stock were reported to be between 3 and 67 animals per year (ICES, 2006). It therefore seems unlikely that recent hunting pressure alone could cause a stock decline.
3 - LOGISTICS AND METHODS
3.1 - Ship, aircraft and personnel
The ice-strengthened Norwegian research ice breaker R/V Kronprins Haakon was used for operations in the Greeland Sea drift ice (Fig. 1). The ship has a helicopter platform and hangar and was equipped in compliance with all relevant requirements for helicopter operations.
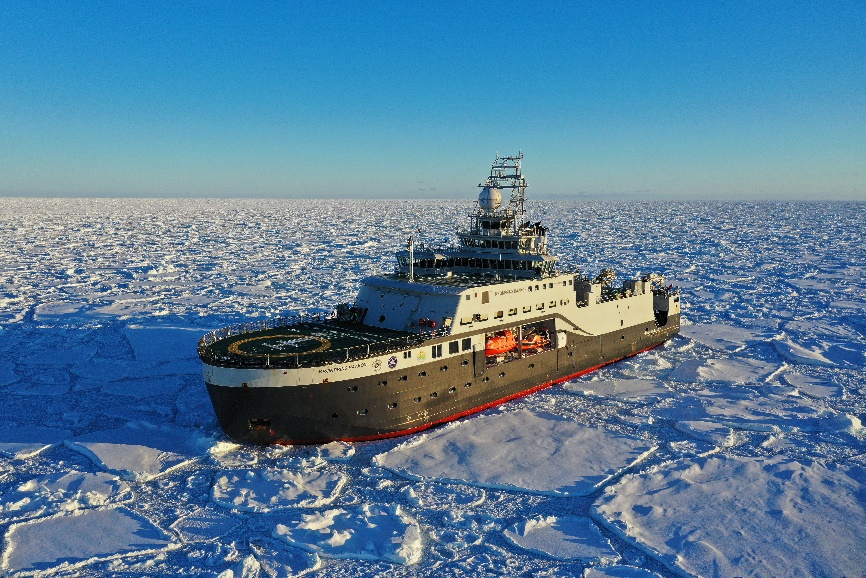
Fig. 1. R/V Kronprins Haakon in the West Ice (Photo: M. Poltermann).
An Ecureuil AS 350 B2 helicopter (owned and operated by Airlift AS, Bygstad, Norway) was chartered for the expedition (Fig. 2). This helicopter type has previously proved suitable in similar operations in the Greenland Sea pack ice (Øritsland and Øien, 1995; Haug et al., 2006; Salberg et al., 2008; Øigård et al. 2010, 2014a, 2014b; Biuw et al., 2022). Approximately 40.5 hours of helicopter operations were carried out over the ice during the survey.
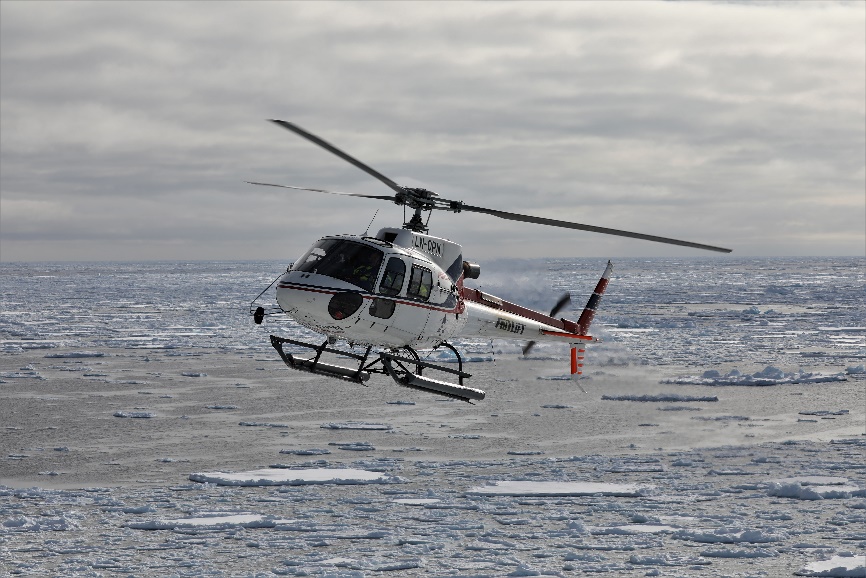
Fig. 2. The helicopter over the Greenland Sea pack ice. (Photo: M. Poltermann).
The scientific crew on the ship consisted of Martin Biuw (IMR, expedition leader), Tore Haug (IMR), Lotta Lindblom (IMR) and Michael Poltermann (IMR). Localization of whelping patches, deployment of GPS beacons and staging of pups were the primary goal during these helicopter surveys.
A fixed-wing Grand Caravan 208B EX aircraft (LN-TER, operated by Blom Aviation A/S, Lysaker, Norway) was used for reconnaissance and photographic surveys (Fig. 3A). The aircraft was able to be airborne for up to 5 hours. In addition to communication and GPS systems, the Caravan was fitted with radar altimeter and a camera system for vertical and oblique angle RBG photos and vertical IR photos. The aircraft operated over the drift ice east of the Greenland coast from 69°33’N / 20°38’W to 71°30’N / 17°48’W during the period 25-28 March. The aircraft was based at Constable Pynt airport (Nerlerit Inaat, 50 km north of Scoresbysund, East Greenland). Kjell T. Nilssen (IMR, leading the fixed-wing surveys) and Martin Kristiansen (IMR) operated on the Caravan, which had pilot (Blom Aviation A/S, Norway) and one camera operator (Terratec, Norway). Approximately 11 hours were flown (total airborne, excluding transit between Akureyuri and Constable Pynt).
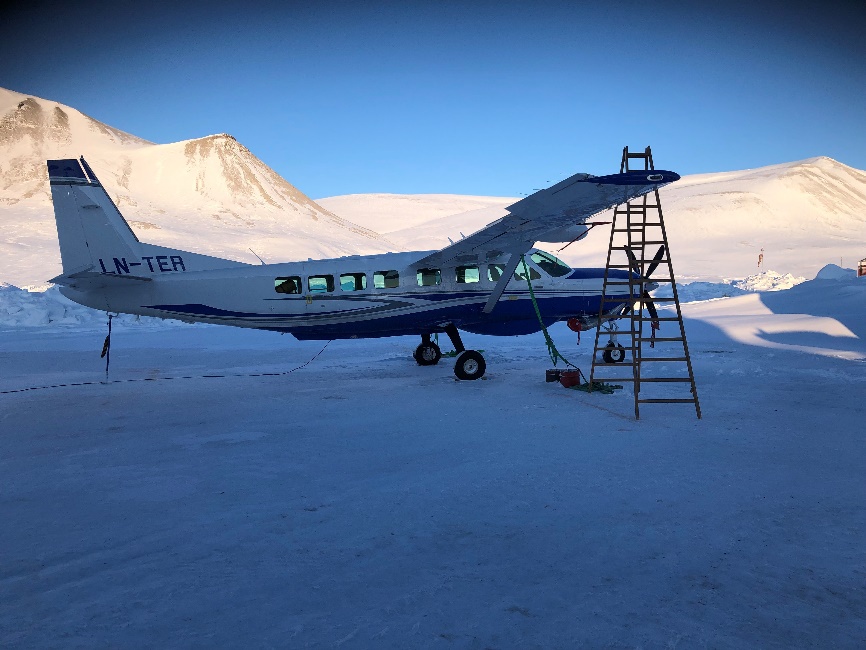
Fig. 3A. The Grand Caravan 208B EX aircraft at Constable Pynt, East Greenland (Photo: K. T. Nilssen).
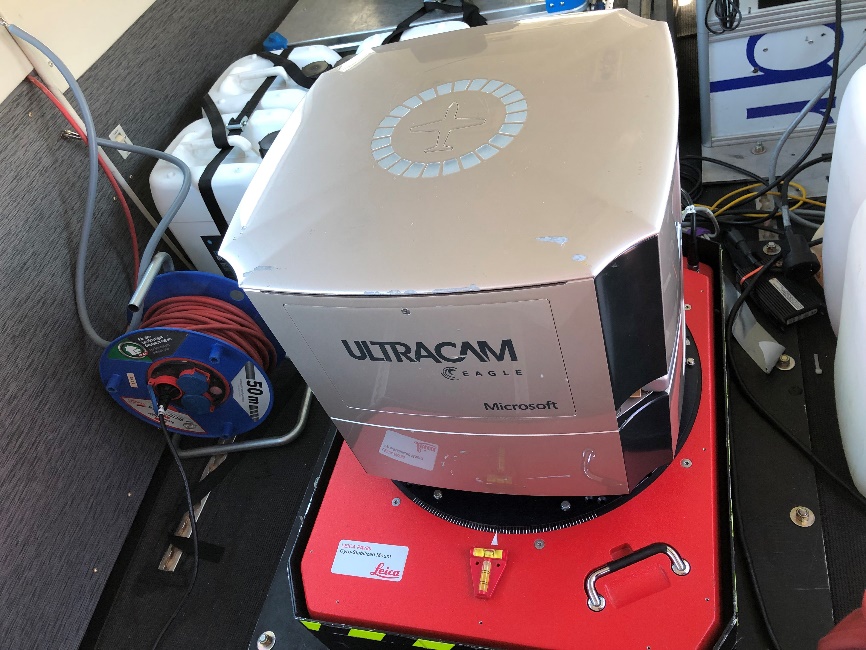
Fig. 3B. The Vexcel UltraCam Eagle Mark 3 aerial camera system mounted in the floor of the aircraft. (Photo: K. T. Nilssen).
3.2 - Reconnaissance surveys
The distribution and configuration of the drifting pack-ice in the survey period is given in Fig. 5. The ice cover in 2022 was relatively similar as that observed during the 2018 survey (Biuw et al., 2022). This is dramatically different from surveys carried out in 2007 (Øigård et al. 2010) and 2012 (Øigård et al. 2014a, 2014b), when the edge of the pack ice was situated much further east and away from the East Greenland coast. In addition to revisiting all areas historically used by harp and hooded seals for breeding purposes in the Greenland Sea (see Haug et al., 2006; Salberg et al., 2008; Øigård et al., 2010, 2014a, 2014b; Biuw et al., 2022), reconnaissance flights also covered areas to the north and south of these historical core areas, to account for potential distributional changes over time. Reconnaissance flights by helicopter were flown at an altitude of 160-300 ft, while those by the fixed-wing were flown at 600-700 ft. Reconnaissance transects were generally flown along in an east-west direction, with an approximate spacing of 5 nm between transect lines. However, transects were adapted to the actual ice-configuration during the survey period, with the ice edge generally delineating the eastern end and areas of fast ice or large ice sheets making up the western end. Due to the significant southwestward ice drift occurring in the region throughout the survey period, and a pupping period often spanning several weeks (mid to late March, see Rasmussen, 1960; Øritsland, 1964; Øritsland and Øien, 1995; ICES, 1998; Haug et al., 2006, Salberg et al., 2008; Øigård et al., 2010, 2014a, 2014b), some areas were surveyed repeatedly to minimize the chance of missing whelping concentrations. Five Iridium-linked GPS beacons (S1, Trusted A/S, Silkeborg, Denmark) were deployed in and around the major whelping concentrations to facilitate relocation and to monitor ice drift (see Fig. 4).
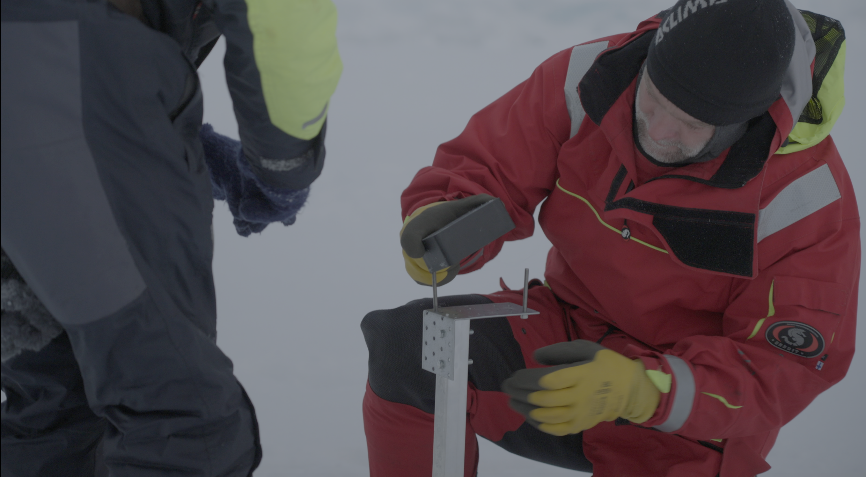
Fig. 4. Deployment of Iridium-linked GPS beacon beacons on an ice floe in the West Ice (Photo: Michael Poltermann).
The vessel departed Longyearbyen, Svalbard, in the afternoon of March 16th 2022, on a southwesterly heading towards 75°00’N / 8°30’W for an underweater glider recovery for the University of Bergen. After recovering the glider at midday on March 18th , the vessel headed due west until reaching the ice edge in the evening of March 18th at 74º58’N / 8º57’W.
Helicopter reconnaissance flights were flown from the vessel between 19 and 22 March in areas between 74º48’N and 71º48’N, as repeated systematic east-west transects from the ice edge in the east to more close drift ice to the west (Fig. 5). Transects were usually spaced 5 nm apart, with a length varying from about 10 to 30 nm, as modified according to the actual ice distribution during the individual survey flights. The fixed wing aircraft was used to cover potential seal whelping areas within the drift ice south of the areas covered by the helicopter (see Fig. 5) as far south as to 70°N on March 25th .
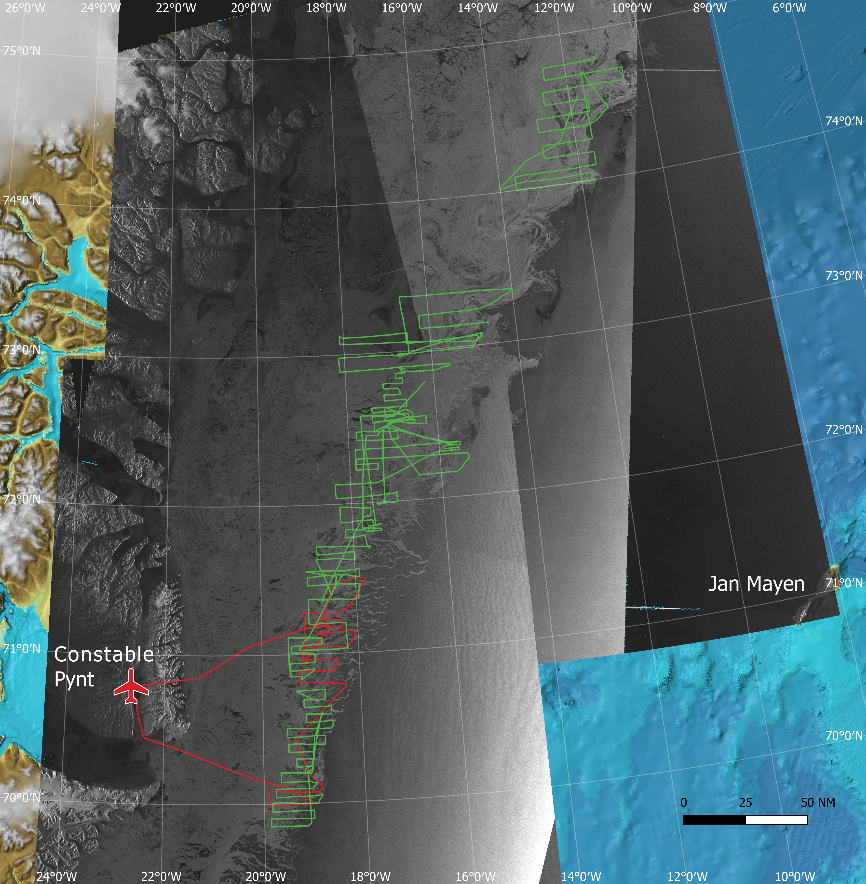
Fig. 5. Aircraft (red) and helicopter (green) flight tracks conducted during reconnaissance and pup staging surveys from R/V Kronprins Haakon on March 21st -28th 2022. The background image is a composite of Sentinel 1 SAR images of sea ice concentration on dates roughly corresponding to the dates of the surveys in the respective areas, overlaid on the IBCAO bathymetric chart.
3.3 - Visual surveys
No visual assessment surveys of pup production were conducted in 2022.
3.4 - Photographic surveys
The fixed-wing aircraft was equipped with a digital camera (Vexcel UltraCam Eagle Mark 3, Fig 3B). Images were taken at an altitude that was maintained at 1100 ft (335 m) using a radar altimeter, and at a flight speed of approximately 120 knots. The camera was operated to cover 80-90 % of the area along each transect line, with deliberate spacing between adjacent images to avoid overlap and the potential for double counting. The image footprint was 358m (cross track) x 230 m (flight direction), with a pixel ground resolution of approximately 13 mm. Transects were flown along east-west lines at a latitudinal spacing of approximately 3 nm.
3.5 - Temporal distribution of births
To correct the estimates of abundance for seal pups that were not yet born or had already left the ice at the time of the survey, it is necessary to estimate the distribution of births over the pupping season. This is done by using information on the proportion of pups in distinct age-dependent stages. These arbitrary but easily recognisable descriptive age categories were based on pelage color and body condition, overall appearance, and muscular coordination (see Stewart & Lavigne, 1980; Bowen et al., 1987; Stenson & Myers, 1988; Øigård et al., 2014a, 2014b).
To determine the proportion of pups in each stage on a given day, random samples of pups were obtained by flying a series of transects over the patch at low altitude (~100ft), and visually assigning pups to the appropriate age classes. The spacing between transects depended on the size of the actual patch (2, 3 or 5 nautical miles apart). A total of four repeated classifications were obtained from each patch 2 or 3 days apart.
4 - PRELIMINARY RESULTS
4.1 - Identification of whelping areas
After initial reconnaissance surveys in the northernmost regions confirmed the absence of large aggregations of seals and signs of pupping, a whelping patch of mostly hooded seals was encountered on March 21 st at 72°53’N / 16°42’W, and shortly thereafter a very large patch of breeding harp seals was encountered along a ~50km long pack ice strip surrounded by more open water, stretching from 72°35’N / 16°57’W in the southwest to 72°36’N / 16°34’W in the northeast (Fig 6). To mark this apparent northern edge of the main seal whelping area, one beacon was deployed at the SW end of the harp seal patch (T1), and a second beacon (T2) was deployed at the northern edge of the main hooded seal patch (Fig 7). On March 22 nd , a third beacon (T3) was deployed from the vessel near the NE end of the main harp seal patch (hereafter termed ‘Patch A’), at 72°32’N / 16°29’W, while helicopter reconnaissance flights continued towards the south. One more dense patch of both harp and hooded seals was encountered in the afternoon of March 22 nd , and a fourth beacon (T4) was deployed near the center of this patch at 72°21’N / 15°46’W (hereafter termed ‘Patch B’). On the last flight on March 22 nd , a more southerly whelping patch was discovered, and GPS beacon T5 was deployed at its northern end in position 71°59’N / 17°17’W. This southern patch (hereafter termed ‘Patch C’) was mapped during the first flight of March 23 rd , starting at the GPS beacon at the northern edge (in position 71°51’N / 17°30’W due to the SW drift of the pack ice) and stretching south to about 71°49’N. While reconnaissance surveys continued southward from this position, no major breeding aggregations were discovered during helicopter surveys.
While no dedicated reconnaissance surveys were carried out by the helicopter after March 22 nd , some reconnaissance activities continued during the pup staging surveys. After a period of poor weather conditions, the fixed-wing aircraft carried out a survey on March 25 th , working southwards from the position of beacon T5 (i.e., Patch C), and covering the region from 71°30’N / 17°47’W in the northeast, to 70°00’N / 19°54’W in the southwest. This reconnaissance confirmed that Patch C was the southernmost whelping patch, and thus the beacons provided a good representation of the entire extent of the area that needed to be covered during the aerial photography surveys.
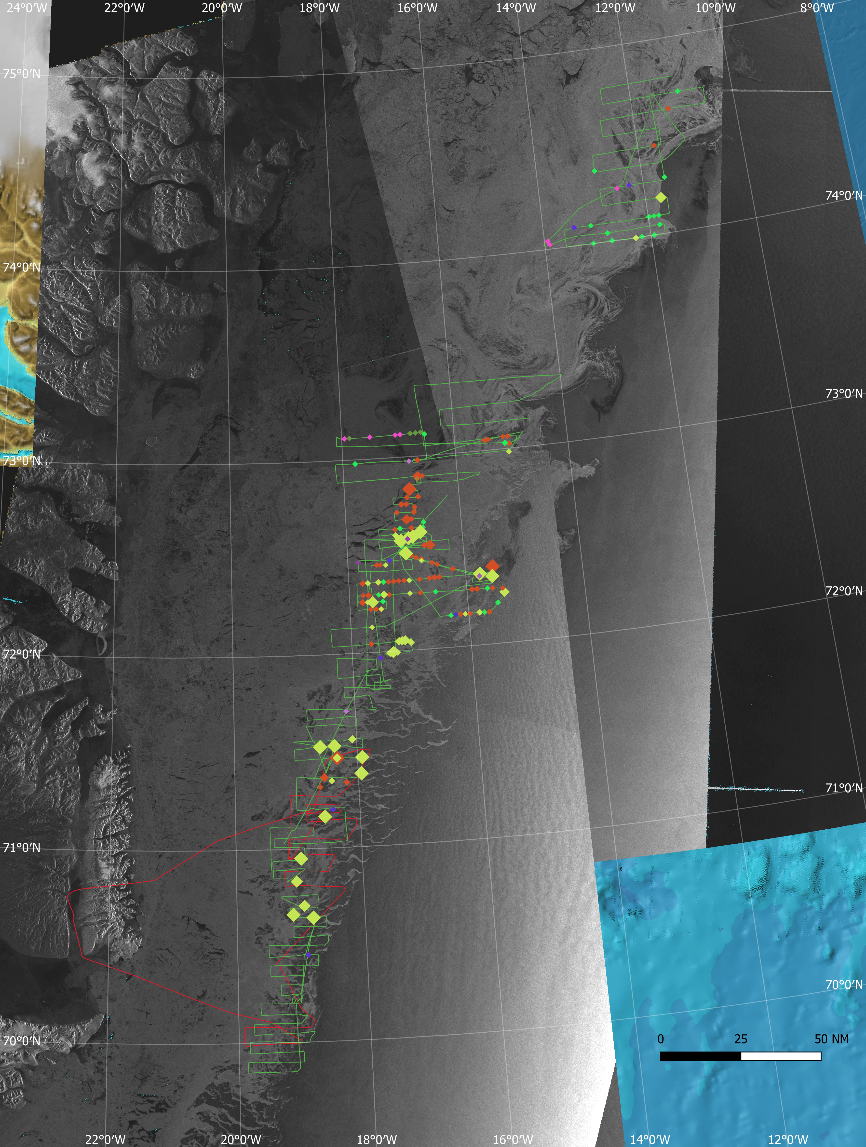
Fig. 6. Sightings obtained during reconnaissance flights conducted by helicopter from R/V Kronprins Haakon and by airplane from Constable Pynt on 10-25 March 2022. Opportunistic sightings of other marine mammals are also shown. Points are coloured by species (Red=Hooded seals, Yellow=Harp seals, Limegreen=Undetermined seals, Dark purple=Polar bear, Purple=Bowhead whale, Navy blue=Narwhal). The background image is a composite of Sentinel 1 SAR images of sea ice concentration on dates roughly corresponding to the dates of the surveys in the respective areas, overlaid on the IBCAO bathymetric chart.
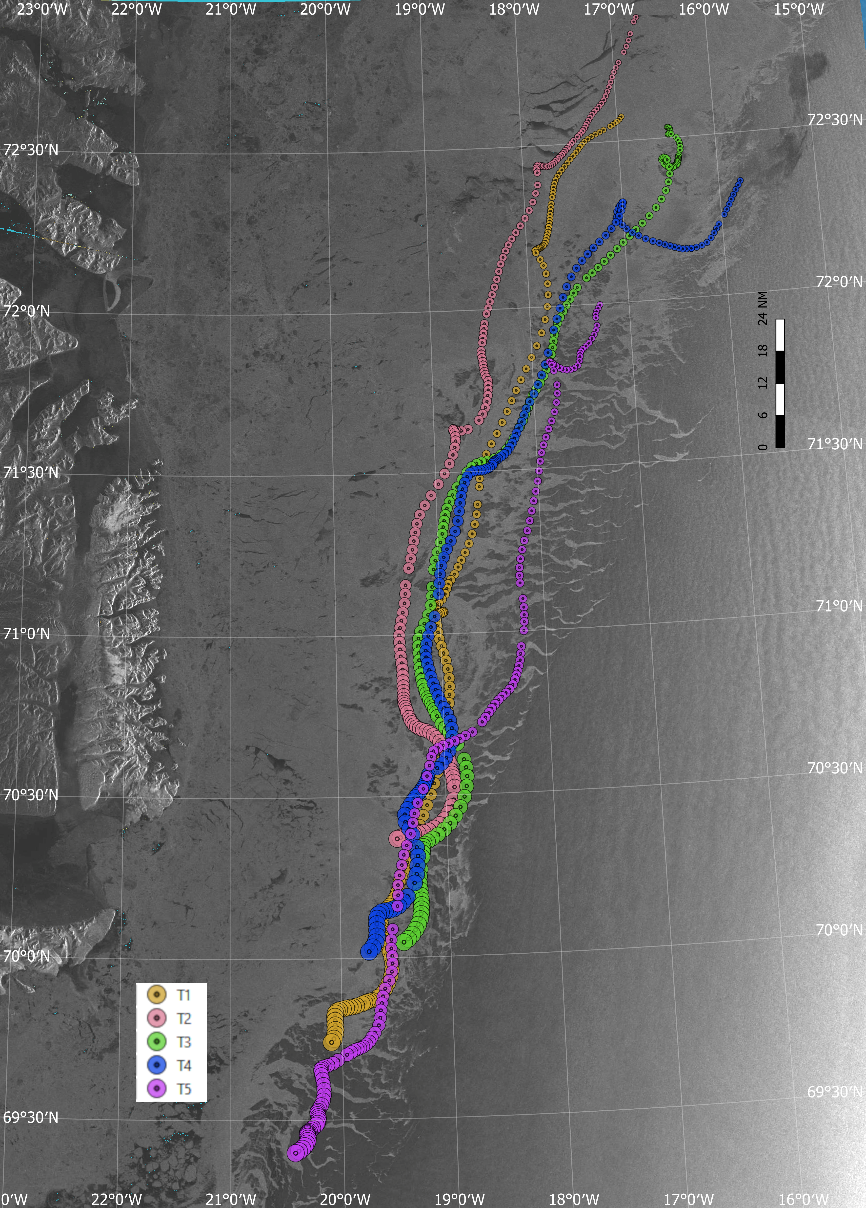
Fig. 7. Tracks of five GPS/Idirium tracking devices deployed by helicopter from KV Svalbard on ice floes around the main seal concentrations 18-24 March 2018. The tracks illustrated the ice drift up to and including March 24. The background image is a Sentinel 1 SAR image of sea ice concentration taken on March 27th .
4.2 - Temporal distribution of births
Pup staging surveys were carried out on March 22nd , 23rd , 25th , 28th and 30th . While the three patches were relatively spatially distinch when discovered on March 21-22nd , strong northerly winds caused then to merge into one coherent but less dense ‘patch’ that became more stretched out in the N/S direction. This patch was therefore renamed ‘Patch A _ B’. Table 1 shows all results from the pup staging surveys, for each patch separately. Due to the similarity in pup stage distribution between the three patches, these results were merged when carrying out analyses to estimate optimal day for aerial photographic surveys and to obtain correction factors for pups potentially missed during these surveys (Fig 8).
| Patch | Date | Newborn | Yellow | Thin | Fat | Grey | Ragged | Beater | |
| Harp seals | A | March 22 | 1 | 469 | 1072 | 0 | 0 | 0 | 0 |
| B | March 22 | 3 | 40 | 131 | 0 | 0 | 0 | 0 | |
| C | March 23 | 0 | 14 | 452 | 23 | 0 | 0 | 0 | |
| A_B | March 25 | 7 | 47 | 683 | 341 | 0 | 0 | 0 | |
| A_B | March 28 | 0 | 1 | 128 | 847 | 1 | 0 | 0 | |
| A_B | March 30 | 0 | 0 | 41 | 257 | 339 | 0 | 0 | |
| Patch | Date | Unborn | Newborn | Thin | Fat | Solitary | |||
| Hooded seals | A | March 22 | 3 | 1 | 292 | 0 | 2 | ||
| B | March 22 | 3 | 0 | 20 | 0 | 0 | |||
| C | March 23 | 0 | 0 | 0 | 0 | 6 | |||
| A_B | March 25 | 0 | 0 | 61 | 47 | 68 | |||
| A_B | March 28 | 0 | 0 | 4 | 34 | 57 | |||
| A_B | March 30 | 0 | 0 | 0 | 12 | 48 |
According to previous studies, aerial photography should ideally be carried out once no newborn harp seal pups are found on the ice. During the staging surverys on March 25th , only a very small number of newborn pups were found (7 of 1078), and aerial photography was planned for the next window of good weather, on March 28 th . This date also agrees well with surveys carried out in 2018 (March 27th & 28th , Biuw et al., 2022) and 2012 (March 28th , Øigård et al., 2014a).
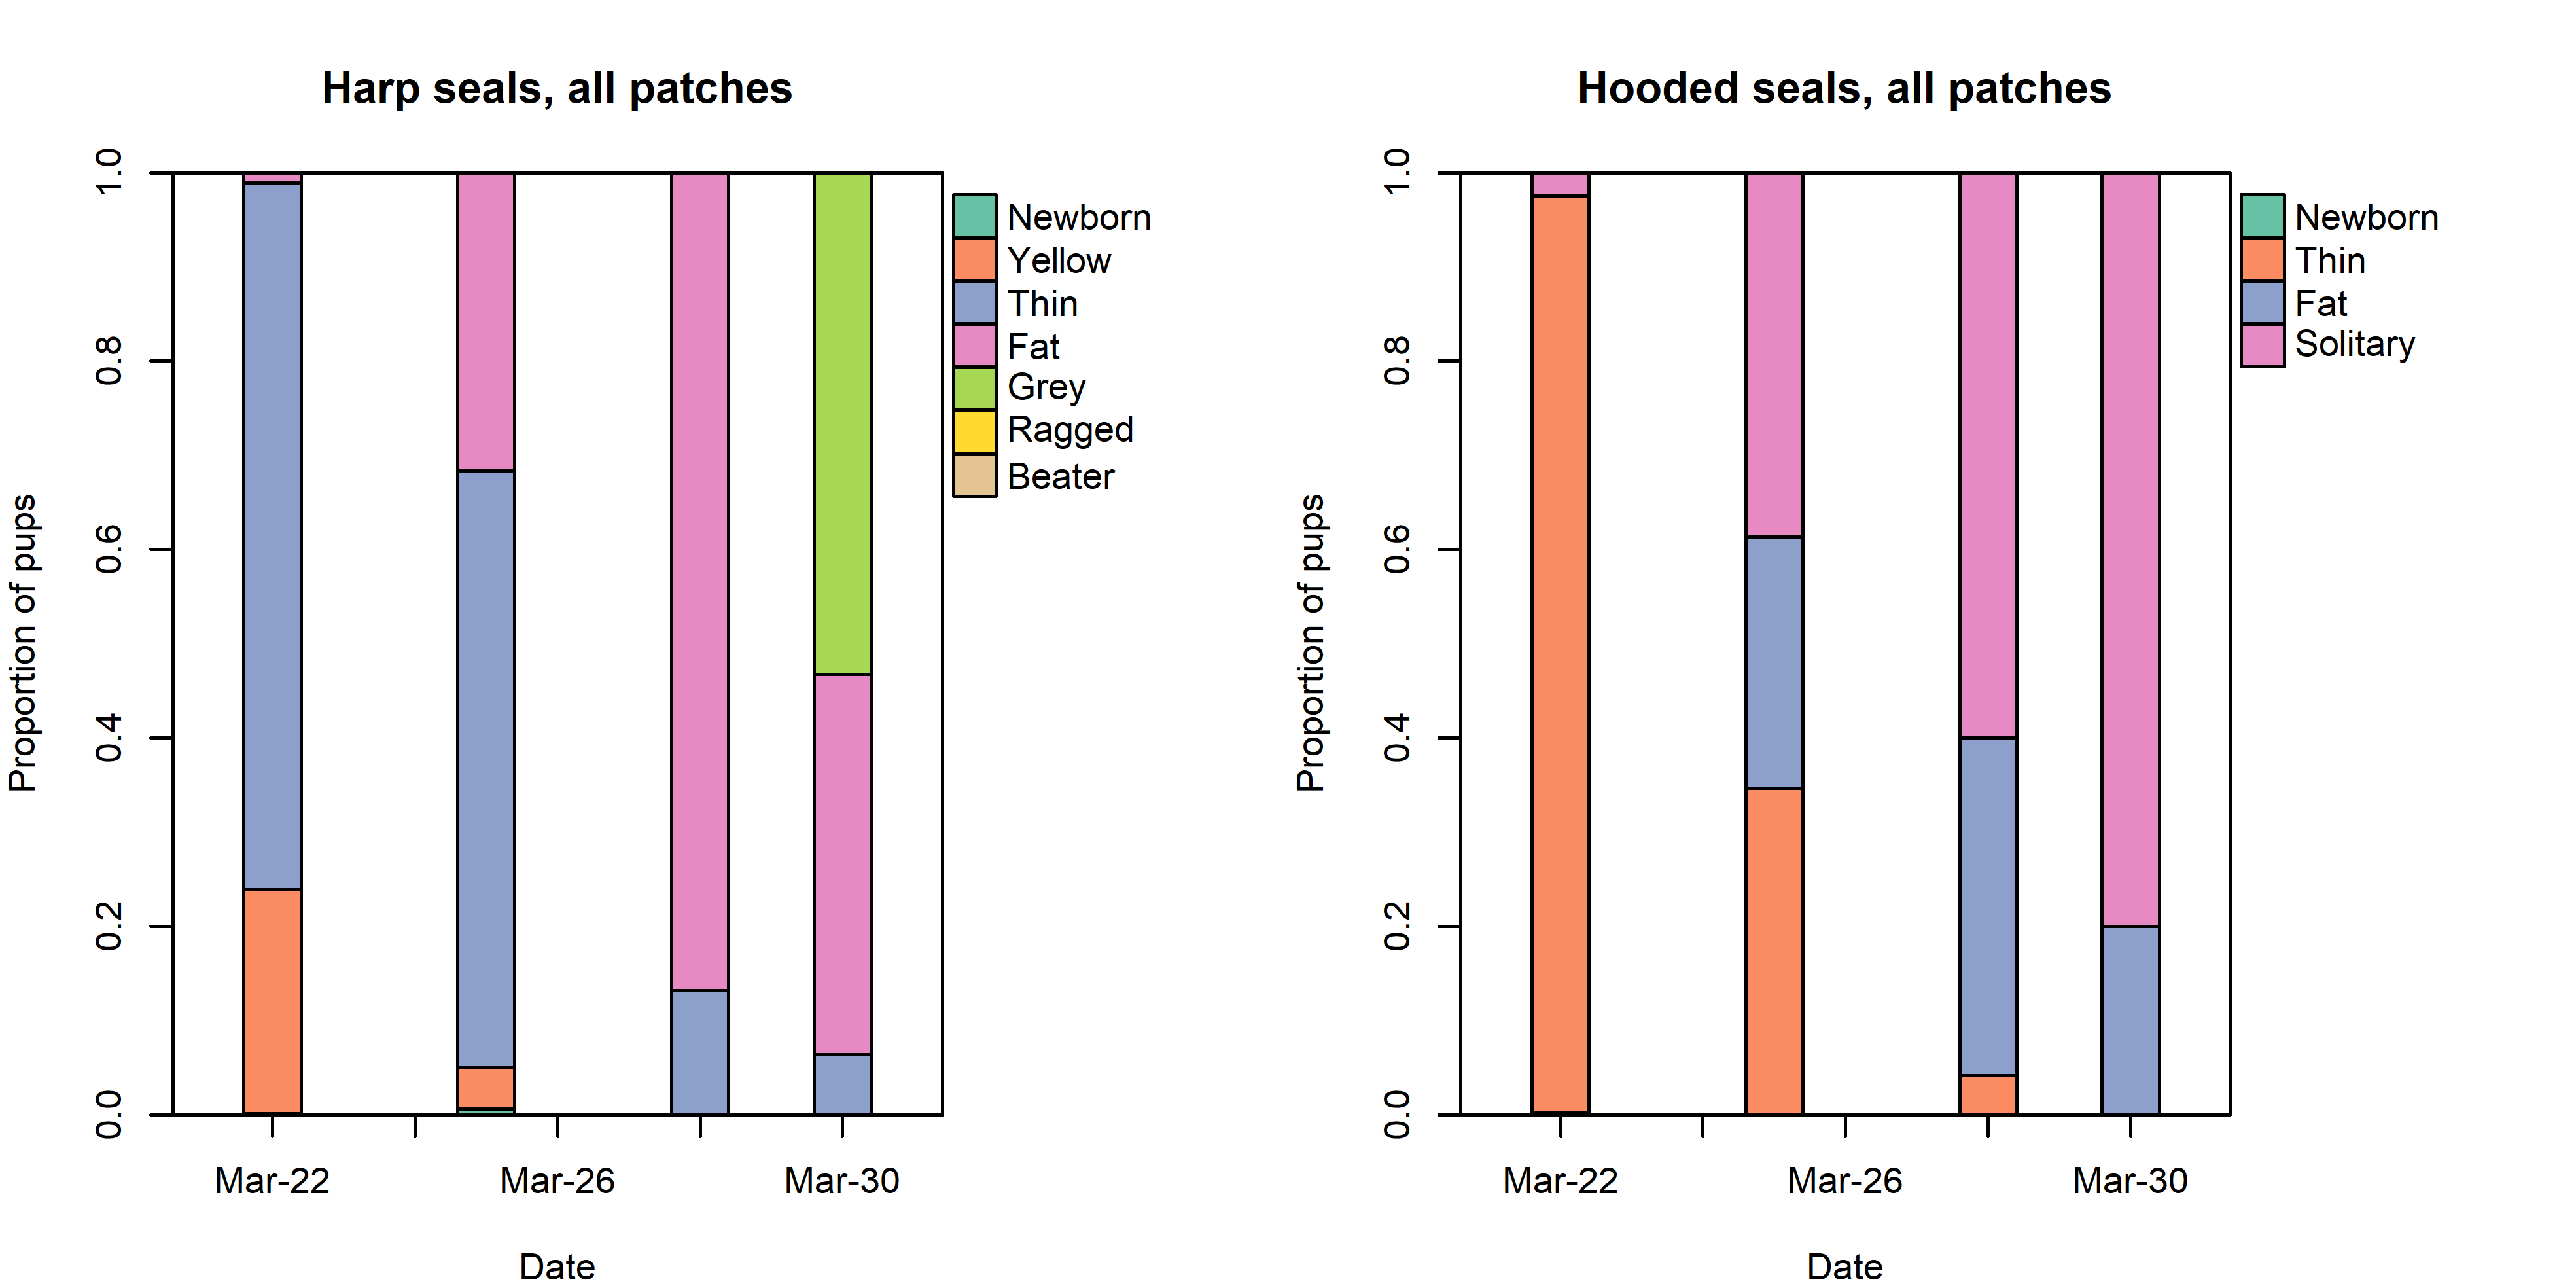
Fig. 8. Distribution of harp (left) and hooded (right) seal pups in individual age dependent stages in the whelping patch in March 2022.
The staging data were used to fit a model estimating the probability of a counted pup belonging to each of three stages. For harp seals, the first stage represents both newborn and yellow pups, the second represents thin poups, while the third stage represents fat or grey pups. As shown in Fig 9A, the model achieved a good fit to the observed recalculated stages based on the staging surveys. The corresponding estimated proportions of seal pups present on the ice are shown in Fig 9B. This resulted in an estimated correction factor of 0.99 for the day of the photographic surveys, suggesting that only about 1% of all pups born may have been unavailable for photography.
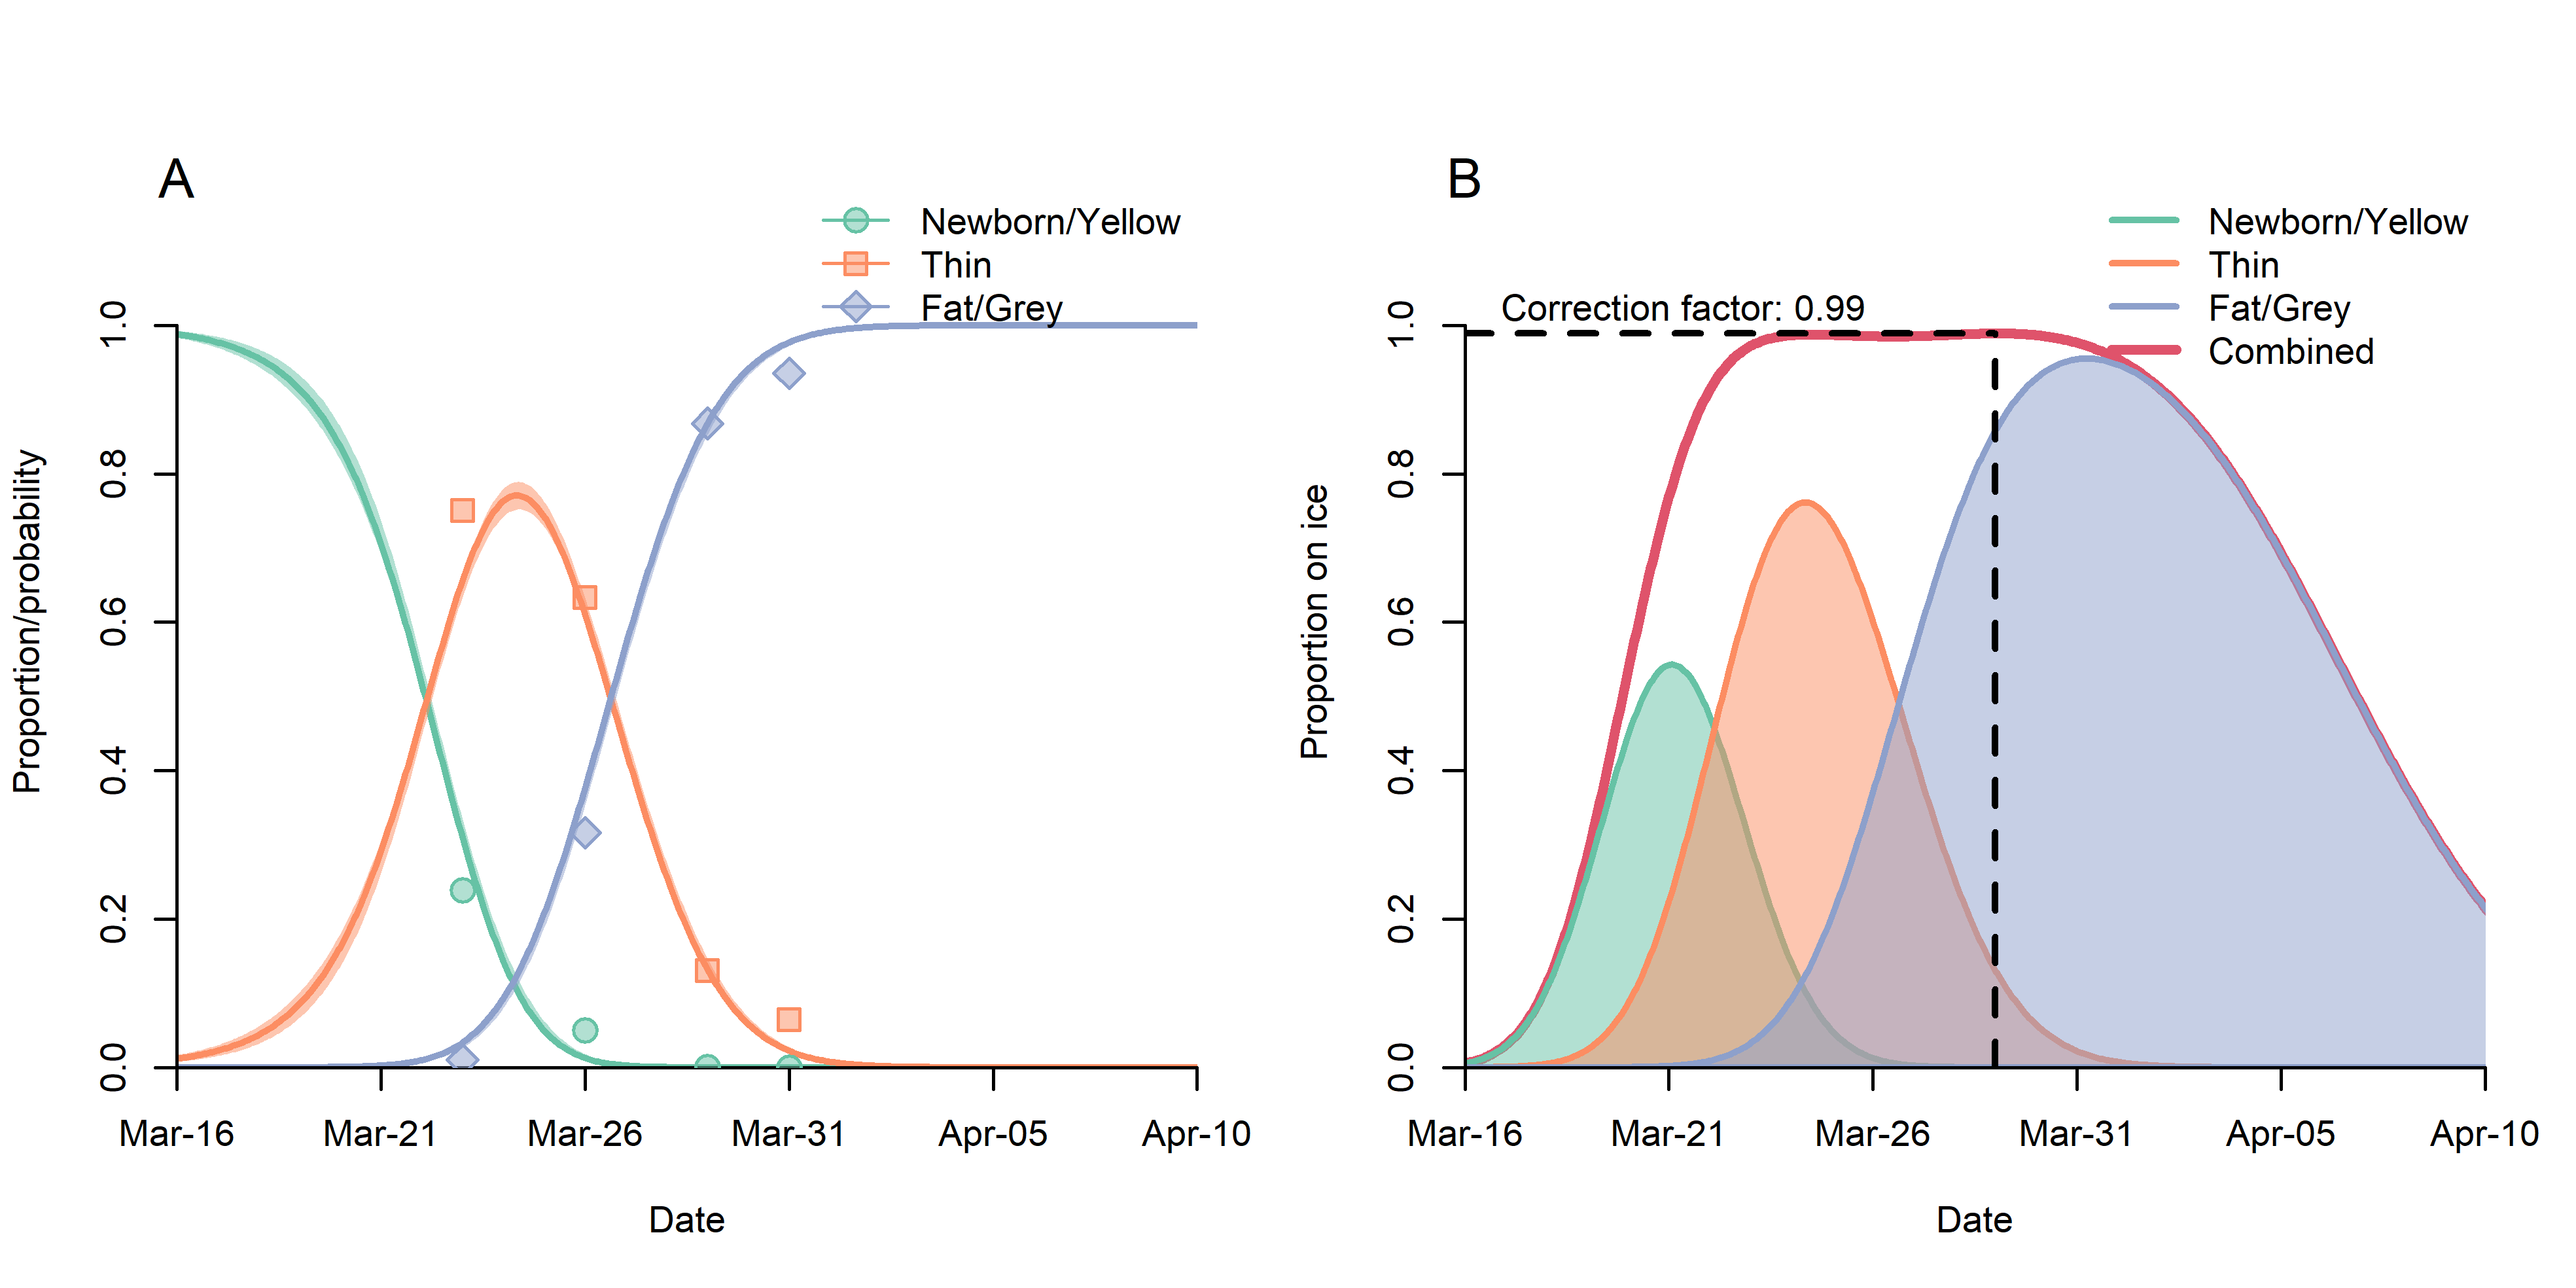
Fig. 9. (A) Observed proportions (points) and estimates of the probability (lines) of a harp seal pup being classified as belonging to the various stages, and (B) predicted proportion of harp seal pups on ice as a function of time. The dotted vertical line shows the proportion of pups visible on ice 28 March (when the photographic survey was carried out), and the dotted horizontal line represents the associated correction factor for missed pups.
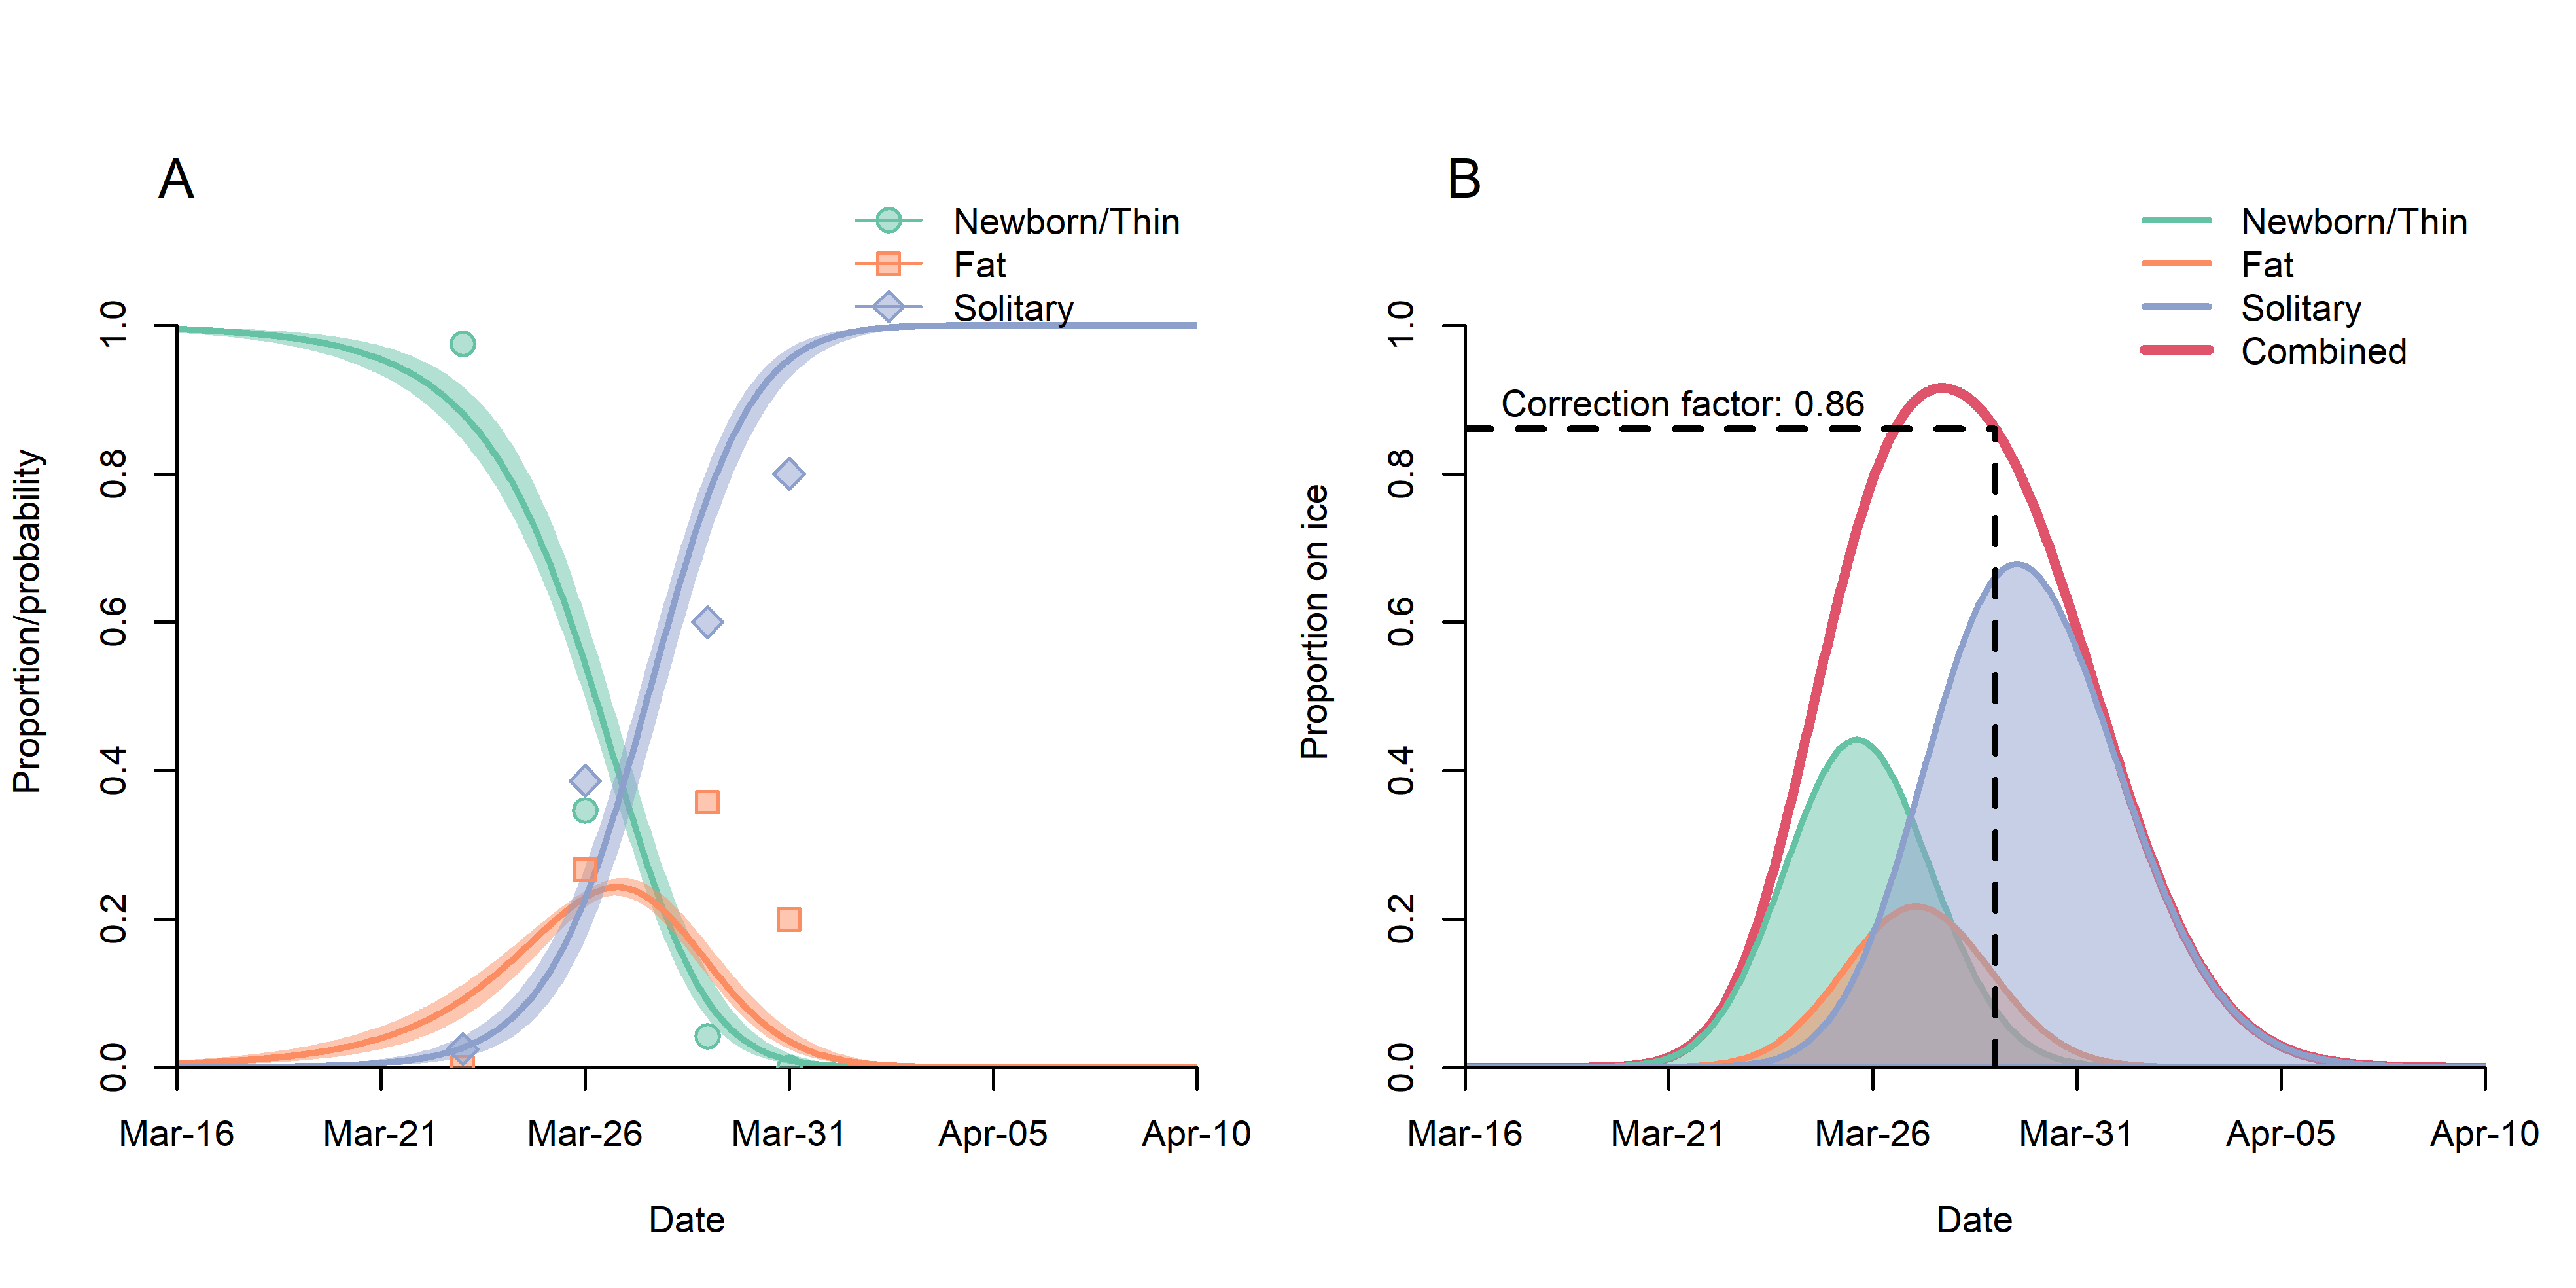 Fig. 10. (B) Observed proportions (points) and estimates of the probability (lines) of a hooded seal pup being classified as belonging to the various stages, and (B) predicted proportion of harp seal pups on ice as a function of time. The dotted vertical line shows the proportion of pups visible on ice 28 March (when the photographic survey was carried out), and the dotted horizontal line represents the associated correction factor for missed pups.
The corresponding results for hooded seals are shown in Fig 10, and resulted in a correction factor of 0.86 (i.e., ~14% of hooded seal pups born may have been unavailable due to departure from the ice prior to the survey). These correction factors agree well with those obtained from staging survey data in 2012 (harp seals: 0.98 & 0.99, Øigård et al., 2014a; hooded seals: 0.83, Øigård et al., 2014b). Due to the premature departure of the vessel from the ice in 2018, only one staging survey could be carried out, so no equivalent data are available (Biuw et al., 2022).
4.3 - Photographic surveys
Photographic surveys were carried out by the fixed-wing aircraft during two flights carried out on March 28th , covering the entire extent of the identified seal patch distribution (Fig 11). Surveys started in the north, at 71°00’N / 20°00’W, at an initial transect spacing of roughly 1 nm with the camera switched off, until the first seals were spotted on the 4th transect line at 70°56’N, at which time the camera was switched on. The first flight completed 17 transect lines, ending in the south at 70°08’N, before the plane returned to Constable Pynt for refueling. The second flight continued the southward coverage, completing 11 transect lines between 70°05’N and 69°34’N. Summary information for all transects are listed in Table 2.
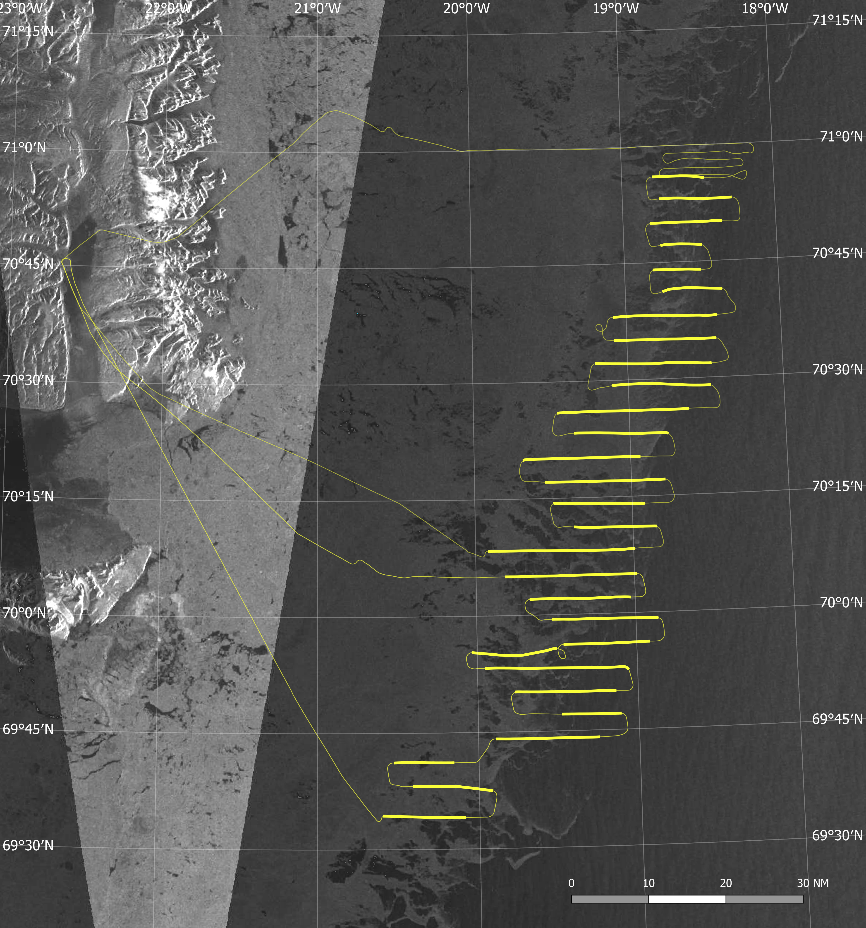
Fig. 11. Track lines from two aerial photographic survey transects, covering the entire area and conducted on 27 March in the West Ice. Spacing between transects were generally 3 nm. Bold lines represent transect segments actually covered by aerial photography.
| Run | Flight | Latitude | Course | Start time | End time | Length (nm) | Images | # images |
| 1 | 1 | 70° 56' N | 269 | 10:41:41 | 10:44:51 | 6.4 | 228-274 | 46 |
| 2 | 1 | 70° 53' N | 88 | 10:46:56 | 10:51:23 | 9.0 | 275-340 | 65 |
| 3 | 1 | 70° 50' N | 269 | 10:54:10 | 10:58:41 | 9.0 | 341-407 | 66 |
| 4 | 1 | 70° 47' N | 94 | 11:00:41 | 11:03:11 | 5.1 | 408-445 | 37 |
| 5 | 1 | 70° 44' N | 270 | 11:05:24 | 11:08:26 | 5.8 | 446-490 | 44 |
| 6 | 1 | 70° 42' N | 94 | 11:10:22 | 11:14:01 | 7.4 | 491-544 | 53 |
| 7 | 1 | 70° 38' N | 267 | 11:16:50 | 11:23:26 | 13.0 | 545-642 | 97 |
| 8 | 1 | 70° 35' N | 90 | 11:27:01 | 11:33:24 | 12.9 | 643-730 | 87 |
| 9 | 1 | 70° 32' N | 272 | 11:36:03 | 11:43:19 | 14.7 | 731-838 | 107 |
| 10 | 1 | 70° 29' N | 89 | 11:46:36 | 11:52:44 | 12.4 | 839- 929 | 90 |
| 11 | 1 | 70° 26' N | 269 | 11:56:11 | 12:04:28 | 16.7 | 930-1052 | 122 |
| 12 | 1 | 70° 23' N | 91 | 12:07:08 | 12:12:55 | 11.8 | 1053-1138 | 85 |
| 13 | 1 | 70° 20' N | 268 | 12:16:26 | 12:23:46 | 14.8 | 1139-1247 | 108 |
| 14 | 1 | 70° 17' N | 89 | 12:26:28 | 12:34:01 | 15.2 | 1248-1360 | 112 |
| 15 | 1 | 70° 14' N | 271 | 12:37:23 | 12:43:02 | 11.4 | 1361-1444 | 83 |
| 16 | 1 | 70° 11' N | 90 | 12:45:38 | 12:50:41 | 10.3 | 1445-1519 | 74 |
| 17 | 1 | 70° 08' N | 270 | 12:53:45 | 13:02:59 | 18.7 | 1520-1656 | 136 |
| 18 | 2 | 70° 05' N | 89 | 15:07:37 | 15:15:54 | 16.7 | 1657-1779 | 122 |
| 19 | 2 | 70° 02' N | 269 | 15:18:22 | 15:24:41 | 12.7 | 1780-1873 | 93 |
| 20 | 2 | 69° 59' N | 91 | 15:27:21 | 15:33:57 | 13.4 | 1874-1972 | 98 |
| 21 | 2 | 69° 56' N | 270 | 15:36:14 | 15:41:37 | 10.8 | 1973-2053 | 80 |
| 22 | 2 | 69° 55' N | 275 | 15:44:05 | 15:49:24 | 10.7 | 2054-2132 | 78 |
| 23 | 2 | 69° 53' N | 89 | 15:51:35 | 16:00:41 | 18.3 | 2133-2267 | 134 |
| 24 | 2 | 69° 50' N | 271 | 16:02:57 | 16:09:13 | 12.7 | 2268-2360 | 92 |
| 25 | 2 | 69° 47' N | 90 | 16:13:42 | 16:17:20 | 7.3 | 2361-2414 | 53 |
| 26 | 2 | 69° 44' N | 271 | 16:20:13 | 16:26:45 | 13.1 | 2415-2511 | 96 |
| 27 | 2 | 69° 41' N | 269 | 16:30:05 | 16:33:51 | 7.5 | 2512-2568 | 56 |
| 28 | 2 | 69° 38' N | 97 | 16:36:59 | 16:42:02 | 10.0 | 2569-2643 | 74 |
| 30 | 2 | 69° 34' N | 272 | 16:45:21 | 16:50:28 | 10.4 | 2644-2719 | 75 |
Transects ranged in length from 5.1 to 18.7 nm, and the number of photographs taken ranged from 37 on the shortest transect to 136 on the longest transect. In total, 2463 photographs were taken.
The vessel departed from the ice in the evening of March 30th , after concluding the final pup staging survey flight, and returned to Tromsø on April 3rd , after 19 days at sea and in the ice. The Caravan aircraft left Constable Pynt and flew to Akureyri on March 29th .
4.4 - Other observations
Tracks of polar bears were observed on several occasions, and several bears were seen both from the fixed-wing, helicopter and the vessel. Groups of between 2 and 5 narwhal ( Monodon monoceros ) were observed at seven different occasions in open leads within the drifting ice in the survey area, and bowhead whales ( Balaena mysticetus ) were observed at two different occasions.
High resolution synthetic aperture radar (SAR) RADARSAT-2 satellite images were ordered to overlap with the GPS/Iridium tracking devices, one for 27th March and one for 1 April. The 27th March was also planned to overlap with the high resolution optical images. Near daily Sentinel-1 SAR images were used to derive sea ice drift overlapping the area of the cruise. Data from the GPS/Iridium tracking devices will be used to validate the SAR derived drifts for an ongoing PhD student project at CIRFA/UiT.
5 - CONCLUDING REMARKS
The survey used methods which are comparable with previous surveys performed for harp and hooded seal assessments in the northwest Atlantic (Bowen et al., 1987; Hammill et al., 1992; Stenson et al., 1993, 1997, 2002, 2003, 2005, 2006, 2010), in the Greenland Sea (Øritsland and Øien, 1995; ICES, 1998; Haug et al., 2006; Salberg et al., 2007; Øigård et al., 2010, 2014a, 2014b; Biuw et al., 2022) and in the White Sea (ICES, 1999, 2001, 2004, 2011; Potelov et al., 2003). Extensive reconnaissance of all likely areas was conducted to locate whelping harp and hooded seals, and since both species occurred within the same general area, results from the photographic surveys will allow us to provide estimates of the 2022 pup production of both species.
Once completed, the results from the 2022 pup production survey will be used to assess the present status of Greenland Sea harp and hooded seals. As in 2018, all pupping of hooded seals occurred scattered throughout the area, with only one relatively small patch of concentrated breeding furthest to the north in the study area. Results from the complete analysis of the data from this survey should allow us to assess whether a) the apparent 40% decline in harp seal pup production between 2012 and 2018 is real and continuing, and b) whether or not the apparent low and slowly declining hooded seal pup production observed since 2005 (see Salberg et al., 2008; Øigård et al., 2010, 2014b; Biuw et al., 2022) still prevail.
The ice conditions in 2022 were similar as conditions seen in 2018, with somewhat more open areas of ice compared to previous years. Strong northerly winds during the survey period also caused dramatic changes in ice distribution, with associated changes in the distribution of the whelping patches. After initially being relatively concentrated within distinct patches spread out over an area of about 54 x 102 nm (N/S x E/W), several of the patches became less dense and seals more evenly distributed within a narrower but longer band of about 135 x 55 nm by the time the photographic surveys were carried out. Thanks to the GPS beacons, we could monitor this substantial ice drift and change in distribution, to successfully carry out the objective of the survey.
6 - ACKNOWLEDGEMENTS
We would like to thank Per Gudmund Waaler from Blom Aviation A/S for excellent operation of the fixed-wing aircraft, the camera operator Maria Laidla from Terratec, the captain and crew onboard the R/V Kronprins Haakon and the helicopter crew, pilot Øyvind Myhre and technician Elliot Jaako, from Airlift A/S, for invaluable assistance.
7 - REFERENCES
Biuw, M., Øigård, T.A., Nilssen, K.T., Stenson, G., Lindblom, L., Poltermann, M., Kristiansen, M. and Haug, T. 2022. Recent harp and hooded seal pup production estimates in the Greenland Sea suggest ecology-driven declines. NAMMCO Sci. Publ. 12. https://doi.org/10.7557/3.5821
Borisov, V.I. 1966. Some data of the serological analysis of Pagophilus groenlandicus Erxleben colonies. Zoologicheskii Zhurnal, 45: 1890-1892. (In Russian, with English summary)
Bowen, W.D. , Myers, R.A., and Hay, K. 1987. Abundance estimation of a dispersed, dynamic population: hooded seals ( Cystophora cristata ) in the Northwest Atlantic. Can. J. Fish. Aquat. Sci. 44: 282-295.
Carr, S.M., Duggan, A.T., Stenson, G.B., and Marshall, H.D. 2015. Quantitative phylogenomics of within-species mitogenome variation: Monte Carlo and non-parametric analysis of phylogeographic structure among discrete transatlantic breeding areas of harp seals ( Pagophilus groenlandicus ). PLoS ONE 10(8): e0134207. Doi: 10.1371/journal.pone.0134207.
Coltman, D. W. Stenson, G., Hammill, M. O., Haug, T., Davis, C. S., and Fulton, T. L. 2007. Panmictic population structure in the hooded seal ( Cystophora cristata ). Molecular Ecology 16: 1639-1648.
Folkow, L.P. and Blix, A.S. 1995. Distribution and diving behaviour of hooded seals. Pp 193–202 in Blix, A.S., Walløe, L. and Ulltang, Ø. (eds). Whales, seals, fish and man. Elsevier Science B.V., Amsterdam.
Folkow, L.P. and Blix, A.S. 1999. Diving behaviour of hooded seals ( Cystophora cristata ) in the Greenland and Norwegian Seas. Polar Biol. 22: 61–74.
Folkow, L.P., Mårtensson, P.E. and Blix, A.S. 1996. Annual distribution of hooded seals ( Cystophora cristata ) in the Greenland and Norwegian Seas. – Polar Biol. 16: 179–189.
Frie, A.K., Stenson, G.B. and Haug, T. 2012. Long term trends in reproductive and demographic parameters of the Northwest Atlantic hooded seals ( Cystophora cristata ): population responses to ecosystem changes. Can. J. Zool. 90: 376-392.
Hammill, M.O. and Stenson, G.B. 2007. Application of the Precautionary Approach and conservation reference points to the management of Atlantic seals. ICES J. Mar. Sci. 64:4, 702-706.
Hammill. M.O., Stenson, G. B., and Myers, R. A. 1992. Hooded seal pup production in the Gulf of St. Lawrence. Can. J. Fish. Aquat. Sci. 49: 2546-2550.
Haug, T., Stenson, G.B., Corkeron, P.J. and Nilssen, K.T. 2006. Estimation of harp seal ( Pagophilus groenlanicus ) pup production in the North Atlantic completed: Results from surveys in the Greenland Sea in 2002. ICES J. Mar. Sci. 63: 95-104.
Healey, B.P. and Stenson, G.B. 2000. Estimating pup production and population size of the northwest Atlantic harp seal (Phoca groenlandica). Canadian Stock Assessment Secretariat, Research Document 2000/081: 28 pp.
ICES 1998. Report of the Joint ICES/NAFO Working Group on Harp and Hooded Seals, ICES Headquarters, 28 August-3 September 1997. ICES CM 1998 / Assess: 3: 35 pp.
ICES 1999. Report of the Joint ICES/NAFO Working Group on Harp and Hooded Seals, Tromsø, Norway, 29 September-2 October 1998. ICES CM 1999 / ACFM: 7: 33 pp.
ICES 2001. Report of the Joint ICES/NAFO Working Group on Harp and Hooded Seals, ICES Headquarters, 2-6 October 2000. ICES CM 2001 / ACFM: 8: 40 pp.
ICES 2004. Report of the Joint ICES/NAFO Working Group on Harp and Hooded Seals, Arkhangelsk, Russia, 2-6 September 2003. ICES CM 2004, ACFM: 6: 53 pp.
ICES 2006a. Report of the Joint ICES/NAFO Working Group on Harp and Hooded Seals, ICES Headquarter, Copenhagen, Denmark, 12-16 June 2006. ICES CM 2006, ACFM: 32: 32 pp.
ICES 2006b. Report of the Joint ICES/NAFO Working Group on Harp and Hooded Seals, St.John’s, Newfoundland, Canada, 30 August-3 September 2005. ICES CM 2006, ACFM: 6: 52 pp.
ICES 2011. Report of the Joint ICES/NAFO Working Group on Harp and Hooded Seals, St.Andrews, Scotland, UK, 15-19 August 2011. ICES CM 2011, ACOM: 22: 72 pp.
ICES 2019. Report of the ICES/NAFO/NAMMCO Working Group on Harp and Hooded Seals (WGHARP), Tromsø, Norway, 2-6 September 2019. ICES Scientific Reports. 1:72. 193 pp. http://doi.org/10.17895/ices.pub.5617 .
Iversen, T. 1927. Drivis og selfangst. Årsber. vedk. Norges Fiskerier 1927(2): 1-84. (In Norwegian).
Kovacs, K.M. and Lavigne, D.M. 1986. Cystophora cristata . Mammalian Species 258: 1–9.
Meisfjord, J. and Nævdal, G. 1994. Using isoelectric focusing to discern enzyme variation in northeast Atlantic stocks of the harp seal ( Phoca groenlandica ). Hereditas 121: 273-281.
Meisfjord, J. and Sundt, G. 1996. Genetic variation between populations of the harp seal, Phoca groenlandica . ICES J. Mar. Sci. 53: 89-95.
Møller, D.G., Nævdal, G. and Valen, A. 1966. Report on serological work in population studies. Fisken Hav. 1966: 1-17. (In Norwegian, with English summary)
Nævdal, G. 1966. Protein polymorphism used for identification of harp seal populations. Årbok Univ. Bergen (Matematisk Naturvitenskapelig Serie), 9: 1-20.
Nævdal, G. 1969. Blood protein polymorphism in harp seals off eastern Canada. J.Fish. Res. Bd Can. 26: 1397-1399.
Nævdal, G. 1971. Serological studies on marine mammals. Rapp. Proc.-verb. Réun., Cons. Int. l’Explor. Mer 161: 136-138.
Nakken, O. 1988. Fangsthistorikk. Fiskets Gang 74(6/7): 14-15. (In Norwegian)
Øien, N. and Øritsland, T. 1995. Use of mark-recapture experiments to monitor seal populations subject to catching. Pp 35-45 in Blix, A.S., Walløe, L. and Ulltang, Ø. (eds). Whales, seals, fish and man. Elsevier Science B.V.
Øigård, T.A., Haug, T., Nilssen, K.T. and Salberg, A.B- 2010. Estimation of oup production of hooded and harp seals in the Greenland Sea in 2007: Reducing uncertainty using generalized additive models. J. Nrthw. Atl. Fish. Sci. 42: 103-123.
Øigård, T.A., Haug, T. & Nilssen, K.T. 2014a. From pup production to quotas: Current status of harp seals in the Greenland Sea. ICES J. Mar. Sci. 71: 537-545. Doi:10.1093/icesjms/fst155.
Øigård, T.A., Haug, T. & Nilssen, K.T. 2014b. Current status of hooded seals in the Greenland Sea. Victms of climate change and predation? Biol. Conserv.172: 29-36. Doi: 10.1016/j.biocon.2014.02.007.
Øritsland, T. 1959. Klappmyss. Fauna 12 (2): 70–90. (In Norwegian).
Øritsland, T. 1964. Klappmysshunnens forplantingsbiologi. – Fisken og Havet 1964 (1): 1–15. (In Norwegian).
Øritsland, T. and Øien, N. 1995. Aerial surveys of harp and hooded seal pups in the Greenland Sea pack ice. Pp 77-87 in Blix, A.S., Walløe, L. and Ulltang, Ø. (eds). Whales, seals, fish and man. Elsevier Science B.V.
Perry, E.A., Stenson, G.B., Bartlett, S.E., Davidson, W.S. and Carr, S.M. 2000. DNA sequence analysis identifies genetically distinguishable populations of harp seals ( Pagophilus groenlandicus ) in the northwest and northeast Atlantic. Mar. Biol. 137: 53-58.
Perry, E.A. and Terhune, J.M. 1999. Variations in harp seal underwater vocalisations among three breeding locations. J. Zool., London 249: 181-186.
Potelov, V.A., Golikov, A.P. and Bondarev, V.A. 2003. Estimated pup production of harp seals Pagophilus groenlandicus in the White Sea, Russia, in 2000. ICES J. Mar. Sci. 60: 1012-1017.
Rasmussen, B . 1957. Exploitation and protection of the east Greenland seal herds. Norsk Hvalfangsttid 46: 45–59.
Rasmussen, B. 1960. Om klappmyssbestanden i det nordlige Atlanterhav. Fisken og Havet 1960 (1): 1–23. (In Norwegian)
Salberg, A.-B., Haug, T., Nilssen, K.T. 2008. Estimation of hooded seal ( Cystophora cristata ) pup production in the Greenland Sea pack ice during the 2005 whelping season. Polar Biol 31: 867-878.
Sergeant, D.E. 1966. Exploitation and conservation of harp and hooded seals. Polar Record 12 (80): 541–551.
Sergeant, D.E. 1974. A rediscovered whelping population of hooded seals Cystophora cristata Erxleben, and its possible relationship with other populations. Polarforschung 44: 1–7.
S ergeant, D.E. 1991. Harp seals, man and ice. Can. Spec. Publ. Fish. Aquat. Sci. 114 : 1-153.
Skaug, H.J., Frimannslund, L. and Øien, N. 2007. Historical population assessment of Barents Sea harp seals ( Pagophilus groenlandicus ). ICES J. Mar. Sci. 64: 1356-1365.
Stenson, G.B., Hammill, M.O., Kingsley, M.C.S., Sjare, B., Warren, W.G. and Myers, R.A. 2002. Is there evidence of increased pup production in northwest Atlantic harp seals, Pagophilus groenlandicus ? ICES J. Mar. Sci. 59: 81-92.
Stenson, G.B., Hammill, M.O. and Lawson, J.W. 2010. How many harp seal pups are there? Aditditional results from the 2008 surveys. DFO Can. Sci. Advis. Sec. Res. Doc. 2010/137: 19 pp.
Stenson, G.B., Hammill, M.O., Lawson, J.W. and Gosselin, J.F. 2006. 2005 pup production of hooded seals, Cystophora cristata , in the Northwest Atlantic. DFO Can. Sci. Advis. Sec. Res. Doc. 2006/067: 40 pp.
Stenson, G.B., Hammill, M.O., Lawson, J.W, Gosselin, J.F. and Haug, T. 2005. 2004 pup production of harp seals, Pagophilus groenlandicus , in the Northwest Atlantic. DFO Can. Sci. Advis. Sec. Res. Doc. 2005/037: 47 pp.
Stenson, G.B. and Myers, R.A. 1988. Accuracy of pup clasifications and its effect on population estimates in the hooded seals ( Cystophora cristata ). Can. J. Fish. Aquat. Sci. 45: 715-719.
Stenson, G.B., Myers, R.A., Hammill, M.O., Ni, I.-H.,Warren, W.G. and Kingsley, M.C.S. 1993. Pup production of harp seals, Phoca groenlandica , in the northwest Atlantic. Can. J. Fish. Aquat. Sci. 50: 2429-2439.
Stenson, G.B., Myers, R.A., Ni, I.-H. and Warren, W.G. 1997. Pup production and population growth of hooded seals, Cystophora cristata , near Newfoundland, Canada. Can. J. Fish. Aquat. Sci. 54 (Supplement 1):209-216.
Stenson, G. B., Rivest, L.P., Hammill, M. O., Gosselin, J. F., and Sjare, B. 2003. Estimating pup production of harp seals, Pagophilus groenlandicus , in the Northwest Atlantic. Mar. Mamm. Sci. 19: 141-160.
Stewart, R.E.A. and Lavigne, D.M. 1980. Neonatal growth of northwest Atlantic harp seals ( Pagophilus groenlandicus ). J. Mammol. 61: 670-680.
Sundt, R.C., Dahle, G. and Nævdal, G. 1994. Genetic variation in the hooded seal, Cystophora cristata, based on enzyme polymophism and multi-locus DNA fingerprinting. Hereditas 121: 147-155.
Ulltang, Ø. and Øien, N. 1988. Bestandsutvikling og status for grønlandssel og klappmyss. Fiskets Gang 74: 8-10. (In Norwegian)
Yablokov, A.V. and Sergeant, D.E. 1963. Cranial variation in the harp seal ( Pagophilus groenlandicus Erxleben 1777). Zool. Zhurn. 42: 1857-1865. (In Russian, with English summary).
HAVFORSKNINGSINSTITUTTET
Postboks 1870 Nordnes
5817 Bergen
Tlf: 55 23 85 00
E-post: post@hi.no
www.hi.no