Stock Name: Northeast Arctic cod (ICES subareas 1 and 2)
Advice on fishing opportunities
The Joint Russian-Norwegian Working Group on Arctic Fisheries (JRN-AFWG) advises that when the Joint Norwegian-Russian Fisheries Commission management plan is applied, catches in 2023 should be no more than 566 784 tonnes.
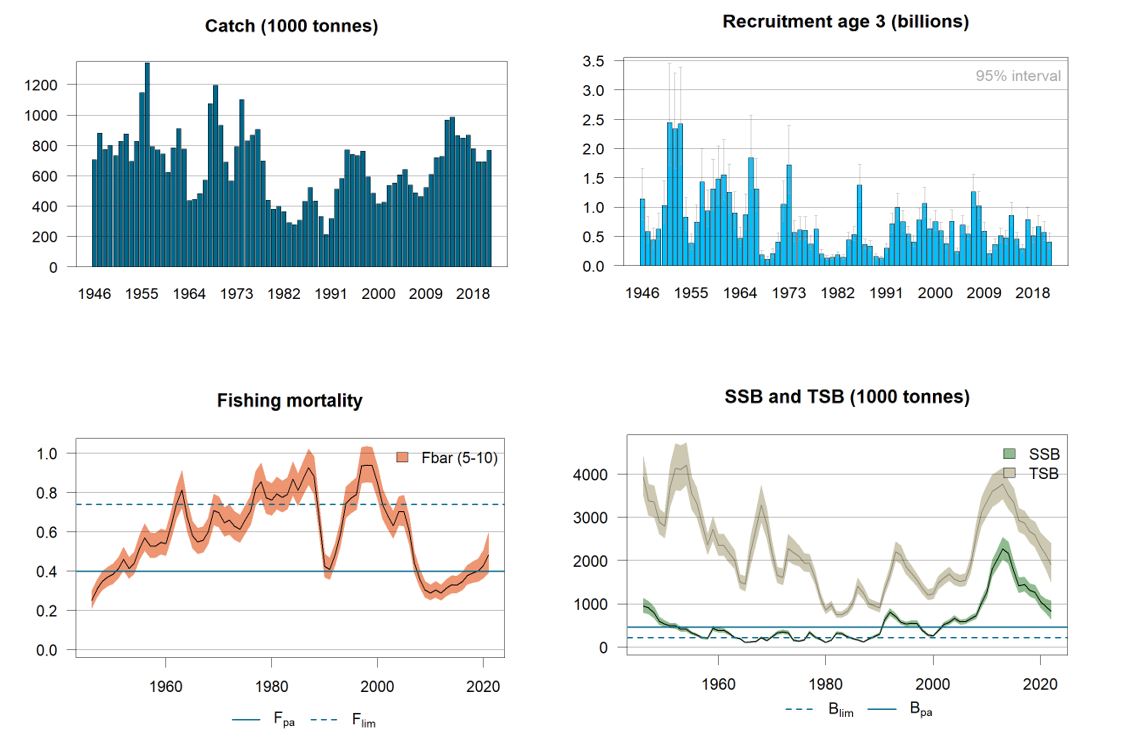
Stock development over time
Fishing pressure on the stock is between Fpa and Flim and within the FMGT range and spawning-stock size is above Bpa and Blim and between the lower and middle breakpoints (SSBMGT values) in the harvest control rule.
Catch scenarios
| Variable | Value | Notes |
|---|---|---|
| F ages 5–10 (2022) | 0.481 | Fsq = F2021. From assessment |
| SSB (2023) | 751 297 | From assessment |
| Rage 3 (2022) | 476 000 | From recruitment model |
| Rage 3 (2023) | 566 000 | From recruitment model |
| Rage 3 (2024) | 383 000 | From recruitment model |
| Total catch (2022) | 640 700 | Corresponding to Fsq |
| Basis | Total catch (2023) | Ftotal (2023) | SSB(2024) | % SSB change * | % TAC change ** | % Advice change *** |
|---|---|---|---|---|---|---|
| ICES advice basis | ||||||
| Management plan^ | 566 784 | 0.484 | 668 851 | -11 | -20 | -20 |
| Other options | ||||||
| MSY approach: FMSY | 487 049 | 0.40 | 731 342 | -3 | -31 | -31 |
| F = 0 | 0 | 0 | 1 134 101 | 51 | -100 | -100 |
| F = F2021 | 564 475 | 0.481 | 670 645 | -11 | -20 | -20 |
| F= Fpa | 487 049 | 0.40 | 731 342 | -3 | -31 | -31 |
| F= Flim | 775 883 | 0.74 | 510 976 | -32 | 10 | 10 |
* SSB 2024 relative to SSB 2023.
** Advice value for 2023 relative to TAC for 2022 (708 480 tonnes).
*** Advice value for 2023 relative to advice for 2022.
^ Since SSB in 2023 is between Bpa = 460 000 tonnes and 2 × Bpa = 920 000 tonnes, F = 0.40 is used in the 3-year prediction, giving catches of 487 049, 476 906 and 468 560 tonnes in 2023, 2024, and 2025, respectively. The average of this is 477 505 tonnes. According to the harvest control rule (HCR), the maximum decrease in TAC is limited by 20%, giving a catch of 566 784 tonnes, which corresponds to an F of 0.484 in 2023.
The advice for 2023 is 20 % lower than the advice for 2022 due to a declining stock trend and the application of the 20% TAC change constraint.
Basis of the advice
| Advice basis | Joint Norwegian-Russian Fisheries Commission management plan |
|---|---|
| Management plan |
At the 46th meeting of the Joint Norwegian-Russian Fisheries Commission (JNRFC) in October 2016, the previously used management plan was amended, and the current plan is as follows: The TAC is calculated as the average catch predicted for the coming 3 years, using the target level of exploitation (Ftr). The target level of exploitation is calculated according to the spawning-stock biomass (SSB) in the first year of the forecast as follows: - if SSB < Bpa , then Ftr = SSB / Bpa × FMSY ; - if Bpa ≤ SSB ≤ 2×Bpa , then Ftr = FMSY ; - if 2 × Bpa < SSB < 3 × Bpa , then Ftr = FMSY × (1 + 0.5 × (SSB – 2 × Bpa ) / Bpa ); - if SSB ≥ 3 × Bpa , then Ftr = 1.5 × FMSY ; where FMSY = 0.40 and Bpa = 460 000 tonnes. If the spawning-stock biomass in the present year, the previous year, and each of the three years of prediction is above Bpa , the TAC should not be changed by more than ±20% compared with the previous year’s TAC. In this case, Ftr should however not be below 0.30. In 2014, JNRFC decided that from 2015 onwards, Norway and Russia can transfer to or borrow from the following year up to 10% of the country's quota. In 2021, this was increased to 15% as an extraordinary measure for transfers between 2021 and 2022 only. ICES evaluated this harvest control rule in 2016 (ICES, 2016) and 2021 (ICES, 2021) and concluded that it is precautionary. |
Quality of the assessment
Issues relevant for the advice
Due to the temporary suspension of Russian scientists from ICES, this assessment was conducted by a Joint Russian-Norwegian working group on Arctic Fisheries (JRN-AFWG) consisting of scientists from VNIRO (Russia) and IMR (Norway) (Howell et al., 2022).
This advice has been conducted outside ICES and should not be considered as ICES advice. However, this assessment and advice has been produced following the methodology agreed at the ICES benchmark in 2021 (ICES, 2021).
Fisheries targeting Northeast Arctic (NEA) cod take as bycatch a considerable part of the total golden redfish (Sebastes norvegicus) catch, and the bycatch of the latter species is still above any sustainable catch level. Measures to minimize bycatch levels are essential.
Bycatch of coastal cod should be kept as low as possible in order to avoid overfishing of the coastal cod (Gadus morhua) stocks.
The advice this year is considerably lower than last year due to the declining trend in stock size which is confirmed by low survey indices and below average recruitment to the stock.
Reference points
| Framework | Reference point | Value | Technical basis | Source |
|---|---|---|---|---|
| MSY approach | MSY Btrigger | 460 000 t | Bpa , and trigger point in HCR | ICES (2003, 2021) |
| FMSY | 0.40 – 0.60 | Long-term simulations | ICES (2003, 2021) | |
| Precautionary approach | Blim | 220 000 t | Change point regression | ICES (2003, 2021) |
| Bpa | 460 000 t | The lowest SSB estimate having >90% probability of remaining above Blim | ICES (2003, 2021) | |
| Flim | 0.74 | F corresponding to an equilibrium stock = Blim | ICES (2003, 2021) | |
| Fpa | 0.40 | The highest F estimate having >90% probability of remaining below Flim | ICES (2003, 2021) | |
| Management plan | SSBMGT | 460 000 t | Two-step (double hockey-stick) HCR, see Table 3 | ICES (2017) |
| FMGT | 0.40 – 0.60 | Two-step (double hockey-stick) HCR, see Table 3 | ICES (2017) |
Basis of the assessment
| ICES stock data category | 1 |
|---|---|
| Assessment type | Age-based analytical assessment (SAM) that uses catches in the model and in the forecast. |
| Input data | Commercial catches (international landings, ages and length frequencies from catch sampling); four survey indices (Joint bottom trawl survey Barents Sea, Jan–Mar; Joint acoustic survey Barents Sea and Lofoten, Feb–Mar; Russian bottom trawl survey, October–December; Joint Ecosystem survey); annual maturity data from the four surveys; natural mortalities from annual stomach sampling. |
| Discards and bycatch | Discarding is considered negligible in recent years (below 5%). Bycatch is included. |
| Indicators | None. |
| Other information | The methodology of assessment adopted by the last ICES benchmark for the stock in February 2021 (ICES, 2021) was followed without exceptions. |
| Working group | Joint Russian-Norwegian working group on Arctic Fisheries (JRN-AFWG). |
History of the advice, catch, and management
| Year | ICES advice | Catch corresponding to advice | Agreed TAC | Official catches | Unreported landings (included in ICES catches) | ICES catches |
|---|---|---|---|---|---|---|
| 1987 | Gradual reduction in F | 595000 | 560000 | 552000 | 523071 | |
| 1988 | F = 0.51; TAC (Advice November 1987, revised advice May 1988) | 530000 (320000–360000) | 590000 (451000) | 459000 | 434939 | |
| 1989 | Large reduction in F | 335000 | 300000 | 348000 | 332481 | |
| 1990 | F at Flow; TAC | 172000 | 160000 | 210000 | 25000 | 212000 |
| 1991 | F at Flow; TAC | 215000 | 215000 | 294000 | 50000 | 319158 |
| 1992 | Within safe biological limits | 250000 | 356000 | 421000 | 130000 | 513234 |
| 1993 | Healthy stock | 256000 | 500000 | 575000 | 50000 | 581611 |
| 1994 | No long-term gains in increased F | 649000 | 700000 | 795000 | 25000 | 771086 |
| 1995 | No long-term gains in increased F | 681000 | 700000 | 763000 | 739999 | |
| 1996 | No long-term gains in increased F | 746000 | 700000 | 759000 | 732228 | |
| 1997 | Well below Fmed | < 993000 | 850000 | 792000 | 762403 | |
| 1998 | F less than Fmed | 514000 | 654000 | 615000 | 592624 | |
| 1999 | Reduce F to below Fpa | 360000 | 480000 | 506000 | 484910 | |
| 2000 | Increase B above Bpa in 2001 | 110000 | 390000 | 414870 | ||
| 2001 | High probability of SSB> Bpa in 2003 | 263000 | 395000 | 426471 | ||
| 2002 | Reduce F to well below 0.25 | 181000 | 395000 | 90000 | 535045 | |
| 2003 | Reduce F to below Fpa | 305000 | 395000 | 115000 | 551990 | |
| 2004 | Reduce F to below Fpa | 398000 | 486000 | 117000 | 606445 | |
| 2005 | Take into account coastal cod and redfish bycatches. Apply catch rule. | 485000 | 485000 | 166000 | 641276 | |
| 2006 | Take into account coastal cod and redfish bycatches. Apply amended catch rule. | 471000 | 471000 | 67100 | 537642 | |
| 2007 | Take into account coastal cod and redfish bycatches. Fpa | 309000 | 424000 | 41087 | 486883 | |
| 2008 | Take into account coastal cod and redfish bycatches. Apply catch rule. | 409000 | 430000 | 15000 | 464171 | |
| 2009 | Take into account coastal cod and redfish bycatches. Apply catch rule. | 473000 | 525000 | 0 | 523431 | |
| 2010 | Take into account coastal cod and redfish bycatches. Apply catch rule. | 577500 | 607000 | 0 | 609983 | |
| 2011 | Take into account coastal cod and redfish bycatches. Apply catch rule. | 703000 | 703000 | 0 | 719829 | |
| 2012 | Take into account coastal cod and redfish bycatches. Apply catch rule. | 751000 | 751000 | 0 | 727663 | |
| 2013 | Take into account coastal cod and S. marinus ^^ bycatches. Apply catch rule. | 940000 | 1000000 | 0 | 966209 | |
| 2014 | Take into account coastal cod and S. marinus^^ bycatches. Apply catch rule. | 993000 | 993000 | 0 | 986449 | |
| 2015 | Take into account coastal cod and S. norvegicus bycatches. Apply catch rule. | 894000 | 894000 | 0 | 864384 | |
| 2016 | Take into account coastal cod and S. norvegicus bycatches. Apply catch rule. | 805000 | 894000 | 0 | 849422 | |
| 2017 | Take into account coastal cod and S. norvegicus bycatches. Apply management plan. | ≤ 805000 | 890000 ^ | 0 | 868276 | |
| 2018 | Take into account coastal cod and S. norvegicus bycatches. Apply management plan. | 712000 | 775000 | 0 | 778627 | |
| 2019 | Take into account coastal cod and S. norvegicus bycatches. Apply management plan. | 674678 | 725000 | 0 | 692609 | |
| 2020 | Apply management plan | ≤ 689672 | 738000 | 0 | 692903 | |
| 2021 | Apply management plan | ≤ 885600 | 885600 | 0 | 767284^^^ | |
| 2022 | Apply management plan | ≤ 708480 | 708480 | |||
| 2023 | Apply management plan^^^ | ≤ 566784 |
^ The 2017 TAC was set according to the management plan agreed by JNRFC in October 2016.
^^ Until 2014 this species was named Sebastes marinus , thereafter Sebastes norvegicus .
^^^ In 2022 assessment and advice was carried out by the Joint Russian-Norwegian working group on Arctic Fisheries (JRN-AFWG) which compiled catches for 2021 and gave advice for 2023.
History of catch and landings
| Year | Faroe Islands | France | German Dem.Rep. | Fed.Rep. Germany | Greenland | Iceland | Norway | Poland | United Kingdom | Russia** | Spain | Others | Total |
|---|---|---|---|---|---|---|---|---|---|---|---|---|---|
| 1961 | 3934 | 13755 | 3921 | 8129 | 268377 | - | 158113 | 325780 | 1212 | 783221 | |||
| 1962 | 3109 | 20482 | 1532 | 6503 | 225615 | - | 175020 | 476760 | 245 | 909266 | |||
| 1963 | - | 18318 | 129 | 4223 | 205056 | 108 | 129779 | 417964 | - | 775577 | |||
| 1964 | - | 8634 | 297 | 3202 | 149878 | - | 94549 | 180550 | 585 | 437695 | |||
| 1965 | - | 526 | 91 | 3670 | 197085 | - | 89962 | 152780 | 816 | 444930 | |||
| 1966 | - | 2967 | 228 | 4284 | 203792 | - | 103012 | 169300 | 121 | 483704 | |||
| 1967 | - | 664 | 45 | 3632 | 218910 | - | 87008 | 262340 | 6 | 572605 | |||
| 1968 | - | - | 225 | 1073 | 255611 | - | 140387 | 676758 | - | 1074084 | |||
| 1969 | 29374 | - | 5907 | 5543 | 305241 | 7856 | 231066 | 612215 | 133 | 1197226 | |||
| 1970 | 26265 | 44245 | 12413 | 9451 | 377606 | 5153 | 181481 | 276632 | - | 933246 | |||
| 1971 | 5877 | 34772 | 4998 | 9726 | 407044 | 1512 | 80102 | 144802 | 215 | 689048 | |||
| 1972 | 1393 | 8915 | 1300 | 3405 | 394181 | 892 | 58382 | 96653 | 166 | 565287 | |||
| 1973 | 1916 | 17028 | 4684 | 16751 | 285184 | 843 | 78808 | 387196 | 276 | 792686 | |||
| 1974 | 5717 | 46028 | 4860 | 78507 | 287276 | 9898 | 90894 | 540801 | 38453 | 1102434 | |||
| 1975 | 11309 | 28734 | 9981 | 30037 | 277099 | 7435 | 101843 | 343580 | 19368 | 829377 | |||
| 1976 | 11511 | 20941 | 8946 | 24369 | 344502 | 6986 | 89061 | 343057 | 18090 | 867463 | |||
| 1977 | 9167 | 15414 | 3463 | 12763 | 388982 | 1084 | 86781 | 369876 | 17771 | 905301 | |||
| 1978 | 9092 | 9394 | 3029 | 5434 | 363088 | 566 | 35449 | 267138 | 5525 | 698715 | |||
| 1979 | 6320 | 3046 | 547 | 2513 | 294821 | 15 | 17991 | 105846 | 9439 | 440538 | |||
| 1980 | 9981 | 1705 | 233 | 1921 | 232242 | 3 | 10366 | 115194 | 8789 | 380434 | |||
| 1981 | 12825 | 3106 | 298 | 2228 | 277818 | 5262 | 83000 | 14500 | - | 399037 | |||
| 1982 | 11998 | 761 | 302 | 1717 | 287525 | 6601 | 40311 | 14515 | - | 363730 | |||
| 1983 | 11106 | 126 | 473 | 1243 | 234000 | 5840 | 22975 | 14229 | - | 289992 | |||
| 1984 | 10674 | 11 | 686 | 1010 | 230743 | 3663 | 22256 | 8608 | - | 277651 | |||
| 1985 | 13418 | 23 | 1019 | 4395 | 211065 | 3335 | 62489 | 7846 | 4330 | 307920 | |||
| 1986 | 18667 | 591 | 1543 | 10092 | 232096 | 7581 | 150541 | 5497 | 3505 | 430113 | |||
| 1987 | 15036 | 1 | 986 | 7035 | 268004 | 10957 | 202314 | 16223 | 2515 | 523071 | |||
| 1988 | 15329 | 2551 | 605 | 2803 | 223412 | 8107 | 169365 | 10905 | 1862 | 434939 | |||
| 1989 | 15625 | 3231 | 326 | 3291 | 158684 | 7056 | 134593 | 7802 | 1273 | 332481 | |||
| 1990 | 9584 | 592 | 169 | 1437 | 88737 | 3412 | 74609 | 7950 | 510 | 187000 | |||
| 1991 | 8981 | 975 | 2613 | 126226 | 3981 | 119427*** | 3677 | 3278 | 269158 | ||||
| 1992 | 11663 | 2 | 3911 | 3337 | 168460 | 6120 | 182315 | 6217 | 1209 | 383234 | |||
| 1993 | 17435 | 3572 | 5887 | 5389 | 9374 | 221051 | 11336 | 244860 | 8800 | 3907 | 531611 | ||
| 1994 | 22826 | 1962 | 8283 | 6882 | 36737 | 318395 | 15579 | 291925 | 14929 | 28568 | 746086 | ||
| 1995 | 22262 | 4912 | 7428 | 7462 | 34214 | 319987 | 16329 | 296158 | 15505 | 15742 | 739999 | ||
| 1996 | 17758 | 5352 | 8326 | 6529 | 23005 | 319158 | 16061 | 305317 | 15871 | 14851 | 732228 | ||
| 1997 | 20076 | 5353 | 6680 | 6426 | 4200 | 357825 | 18066 | 313344 | 17130 | 13303 | 762403 | ||
| 1998 | 14290 | 1197 | 3841 | 6388 | 1423 | 284647 | 14294 | 244115 | 14212 | 8217 | 592624 | ||
| 1999 | 13700 | 2137 | 3019 | 4093 | 1985 | 223390 | 11315 | 210379 | 8994 | 5898 | 484910 | ||
| 2000 | 13350 | 2621 | 3513 | 5787 | 7562 | 192860 | 9165 | 166202 | 8695 | 5115 | 414870 | ||
| 2001 | 12500 | 2681 | 4524 | 5727 | 5917 | 188431 | 8698 | 183572 | 9196 | 5225 | 426471 | ||
| 2002 | 15693 | 2934 | 4517 | 6419 | 5975 | 202559 | 8977 | 184072 | 8414 | 5484 | 445045 | ||
| 2003 | 19427 | 2921 | 4732 | 7026 | 5963 | 191977 | 8711 | 182160 | 7924 | 6149 | 436990 | ||
| 2004 | 19226 | 3621 | 6187 | 8196 | 7201 | 212117 | 14004 | 201525 | 11285 | 6082 | 489445 | ||
| 2005 | 16273 | 3491 | 5848 | 8135 | 5874 | 207825 | 10744 | 200077 | 9349 | 7660 | 475276 | ||
| 2006 | 16327 | 4376 | 3837 | 8164 | 5972 | 201987 | 10594 | 203782 | 9219 | 6271 | 470527 | ||
| 2007 | 14788 | 3190 | 4619 | 5951 | 7316 | 199809 | 9298 | 186229 | 9496 | 5101 | 445796 | ||
| 2008 | 15812 | 3149 | 4955 | 5617 | 7535 | 196598 | 8287 | 190225 | 9658 | 7336 | 449171 | ||
| 2009 | 16905 | 3908 | 8585 | 4977 | 7380 | 224298 | 8632 | 229291 | 12013 | 7442 | 523431 | ||
| 2010 | 15977 | 4499 | 8442 | 6584 | 11299 | 264701 | 9091 | 267547 | 12657 | 9185 | 609983 | ||
| 2011 | 13429 | 1173 | 4621 | 7155 | 12734 | 331535 | 8210 | 310326 | 13291 | 17354^ | 719829 | ||
| 2012 | 17523 | 2841 | 8500 | 8520 | 9536 | 315739 | 11166 | 329943 | 12814 | 11081 | 727663 | ||
| 2013 | 13833 | 7858 | 8010 | 7885 | 14734 | 438734 | 12536 | 432314 | 15042 | 15263 | 966209 | ||
| 2014 | 33298 | 8149 | 6225 | 10864 | 18205 | 431846 | 14762 | 433479 | 16378 | 13243 | 986449 | ||
| 2015 | 26568 | 7480 | 6427 | 7055 | 16120 | 377983 | 11778 | 381778 | 19905 | 9880 | 864384 | ||
| 2016 | 24084 | 7946 | 6336 | 8607 | 16031 | 348949 | 13583 | 394107 | 14640 | 15139 | 849422 | ||
| 2017 | 28637 | 9554 | 5977 | 13638 | 11925 | 357419 | 16731 | 396180 | 14414 | 13802 | 868276 | ||
| 2018 | 26152 | 6605 | 9768 | 12743 | 10708 | 333539 | 11533 | 340364 | 13143 | 14071 | 778627 | ||
| 2019 | 22270 | 6371 | 8470 | 7553 | 12294 | 282120 | 11214 | 316813 | 13939 | 11565 | 692609 | ||
| 2020 | 21679 | 5796 | 9725 | 7391 | 9734 | 289472 | 12113 | 312683 | 11403 | 12908 | 692903 | ||
| 2021* | 21767 | 4459 | 6190 | 8246 | 8933 | 337931 | 5426 | 352064 | 11080 | 11188 | 767284^^ |
* Provisional figures
** USSR prior to 1991.
*** Includes Baltic countries.
^ Includes unspecified EU catches.
^^ In 2022 assessment and advice was carried out by the Joint Russian-Norwegian working group on Arctic Fisheries (JRN-AFWG) which compiled catches for 2021 and gave advice for 2023.
Summary of the assessment
| Year | Recruitment | Spawning-stock biomass | Total catch | Fishing mortality | ||||||
|---|---|---|---|---|---|---|---|---|---|---|
| Recruitment (Age 3) | Low | High | SSB | Low | High | F (ages 5–10) | Low | High | ||
| thousands | tonnes | tonnes | ||||||||
| 1946 | 1138875 | 782138 | 1658322 | 952394 | 800278 | 1133424 | 706000 | 0.25 | 0.21 | 0.30 |
| 1947 | 583558 | 406249 | 838254 | 903494 | 767125 | 1064105 | 882017 | 0.31 | 0.27 | 0.36 |
| 1948 | 441494 | 304979 | 639116 | 785218 | 662089 | 931244 | 774295 | 0.35 | 0.30 | 0.40 |
| 1949 | 624817 | 438580 | 890135 | 595220 | 511235 | 693002 | 800122 | 0.37 | 0.32 | 0.42 |
| 1950 | 1024284 | 721555 | 1454022 | 536083 | 470910 | 610274 | 731982 | 0.38 | 0.34 | 0.44 |
| 1951 | 2440524 | 1722717 | 3457422 | 494974 | 439859 | 556994 | 827180 | 0.41 | 0.36 | 0.47 |
| 1952 | 2338131 | 1665575 | 3282265 | 488811 | 431155 | 554178 | 876795 | 0.46 | 0.40 | 0.52 |
| 1953 | 2420273 | 1727540 | 3390787 | 412127 | 361301 | 470104 | 695546 | 0.41 | 0.36 | 0.47 |
| 1954 | 830203 | 593342 | 1161619 | 408122 | 360653 | 461838 | 826021 | 0.44 | 0.39 | 0.50 |
| 1955 | 383411 | 273881 | 536744 | 328050 | 294286 | 365688 | 1147841 | 0.52 | 0.46 | 0.58 |
| 1956 | 747357 | 535098 | 1043812 | 281511 | 253752 | 312306 | 1343068 | 0.57 | 0.50 | 0.64 |
| 1957 | 1431849 | 1027632 | 1995065 | 212384 | 190996 | 236168 | 792557 | 0.53 | 0.47 | 0.60 |
| 1958 | 935015 | 673291 | 1298478 | 205396 | 182848 | 230723 | 769313 | 0.53 | 0.47 | 0.59 |
| 1959 | 1313367 | 949345 | 1816972 | 434343 | 384862 | 490185 | 744607 | 0.55 | 0.49 | 0.61 |
| 1960 | 1480277 | 1069849 | 2048160 | 384643 | 338373 | 437241 | 622042 | 0.54 | 0.48 | 0.61 |
| 1961 | 1552082 | 1120517 | 2149864 | 386423 | 342928 | 435434 | 783221 | 0.63 | 0.57 | 0.71 |
| 1962 | 1252752 | 903572 | 1736872 | 315358 | 283371 | 350956 | 909266 | 0.74 | 0.66 | 0.83 |
| 1963 | 902995 | 647619 | 1259074 | 216125 | 194637 | 239986 | 776337 | 0.81 | 0.72 | 0.91 |
| 1964 | 469311 | 334131 | 659181 | 200521 | 179765 | 223675 | 437695 | 0.68 | 0.61 | 0.76 |
| 1965 | 873429 | 623953 | 1222653 | 108075 | 96093 | 121551 | 444930 | 0.58 | 0.51 | 0.65 |
| 1966 | 1844528 | 1325158 | 2567455 | 120996 | 108786 | 134575 | 483711 | 0.55 | 0.49 | 0.62 |
| 1967 | 1313542 | 943608 | 1828505 | 128675 | 115600 | 143229 | 572605 | 0.56 | 0.50 | 0.63 |
| 1968 | 183211 | 131394 | 255461 | 222846 | 202698 | 244998 | 1074084 | 0.60 | 0.54 | 0.67 |
| 1969 | 110531 | 79203 | 154250 | 148914 | 134220 | 165216 | 1197226 | 0.71 | 0.63 | 0.79 |
| 1970 | 206006 | 147361 | 287991 | 242143 | 218024 | 268931 | 933246 | 0.70 | 0.62 | 0.78 |
| 1971 | 403526 | 289987 | 561519 | 330542 | 293662 | 372054 | 689048 | 0.65 | 0.58 | 0.72 |
| 1972 | 1047601 | 758424 | 1447038 | 353348 | 311488 | 400834 | 565254 | 0.66 | 0.59 | 0.74 |
| 1973 | 1724173 | 1242601 | 2392381 | 334063 | 290330 | 384383 | 792685 | 0.63 | 0.56 | 0.70 |
| 1974 | 566400 | 413586 | 775676 | 158939 | 135580 | 186324 | 1102433 | 0.61 | 0.55 | 0.69 |
| 1975 | 608427 | 443913 | 833908 | 133486 | 119429 | 149197 | 829377 | 0.66 | 0.59 | 0.73 |
| 1976 | 605952 | 439171 | 836069 | 167229 | 151573 | 184501 | 867463 | 0.71 | 0.63 | 0.78 |
| 1977 | 372123 | 272044 | 509019 | 336160 | 299571 | 377219 | 905301 | 0.82 | 0.74 | 0.91 |
| 1978 | 624267 | 454466 | 857510 | 227984 | 199625 | 260370 | 698715 | 0.85 | 0.77 | 0.95 |
| 1979 | 202902 | 147738 | 278663 | 180487 | 157496 | 206834 | 440538 | 0.77 | 0.69 | 0.86 |
| 1980 | 130635 | 97401 | 175208 | 108443 | 96722 | 121584 | 380434 | 0.76 | 0.68 | 0.85 |
| 1981 | 144064 | 109407 | 189700 | 161275 | 145980 | 178172 | 399038 | 0.79 | 0.71 | 0.88 |
| 1982 | 183023 | 141677 | 236435 | 321134 | 288135 | 357912 | 363730 | 0.77 | 0.70 | 0.86 |
| 1983 | 141058 | 109207 | 182199 | 311281 | 280024 | 346028 | 289992 | 0.79 | 0.72 | 0.88 |
| 1984 | 442631 | 346267 | 565813 | 243444 | 222178 | 266746 | 277651 | 0.87 | 0.79 | 0.96 |
| 1985 | 532740 | 426361 | 665662 | 195314 | 178305 | 213945 | 307920 | 0.81 | 0.73 | 0.90 |
| 1986 | 1374811 | 1088311 | 1736734 | 164104 | 150059 | 179463 | 430113 | 0.87 | 0.79 | 0.96 |
| 1987 | 359158 | 283816 | 454500 | 115090 | 104590 | 126643 | 523071 | 0.93 | 0.84 | 1.02 |
| 1988 | 335224 | 265442 | 423350 | 191447 | 172994 | 211869 | 434939 | 0.88 | 0.79 | 0.98 |
| 1989 | 158192 | 126445 | 197908 | 237375 | 212469 | 265201 | 332481 | 0.67 | 0.59 | 0.75 |
| 1990 | 131207 | 103152 | 166892 | 302447 | 265353 | 344727 | 212000 | 0.42 | 0.37 | 0.49 |
| 1991 | 297393 | 234942 | 376444 | 635130 | 563772 | 715520 | 319158 | 0.41 | 0.36 | 0.47 |
| 1992 | 716809 | 574041 | 895083 | 803817 | 721517 | 895506 | 513234 | 0.49 | 0.43 | 0.55 |
| 1993 | 990119 | 793107 | 1236070 | 702294 | 635110 | 776585 | 581611 | 0.59 | 0.53 | 0.65 |
| 1994 | 752658 | 602055 | 940934 | 572233 | 522081 | 627203 | 771086 | 0.74 | 0.67 | 0.83 |
| 1995 | 539812 | 432099 | 674374 | 534987 | 487262 | 587387 | 739999 | 0.77 | 0.69 | 0.85 |
| 1996 | 405894 | 323974 | 508530 | 551598 | 497542 | 611527 | 732228 | 0.79 | 0.71 | 0.88 |
| 1997 | 783453 | 625057 | 981989 | 545940 | 487868 | 610924 | 762403 | 0.94 | 0.85 | 1.03 |
| 1998 | 1059540 | 842440 | 1332586 | 386207 | 345734 | 431417 | 592624 | 0.94 | 0.85 | 1.03 |
| 1999 | 630159 | 500729 | 793044 | 281001 | 252563 | 312642 | 484910 | 0.94 | 0.85 | 1.03 |
| 2000 | 749764 | 598404 | 939410 | 255917 | 234261 | 279574 | 414868 | 0.85 | 0.77 | 0.93 |
| 2001 | 593562 | 474176 | 743007 | 383996 | 347249 | 424632 | 426471 | 0.74 | 0.66 | 0.82 |
| 2002 | 375075 | 300119 | 468751 | 521728 | 471558 | 577234 | 535045 | 0.68 | 0.61 | 0.75 |
| 2003 | 759779 | 609712 | 946781 | 572476 | 518740 | 631778 | 551990 | 0.63 | 0.57 | 0.70 |
| 2004 | 243027 | 197964 | 298347 | 666767 | 605279 | 734501 | 606445 | 0.70 | 0.63 | 0.78 |
| 2005 | 697364 | 566863 | 857907 | 580090 | 528005 | 637313 | 641276 | 0.70 | 0.63 | 0.79 |
| 2006 | 539345 | 438026 | 664101 | 584912 | 532896 | 642006 | 537642 | 0.60 | 0.54 | 0.68 |
| 2007 | 1259517 | 1017658 | 1558856 | 652597 | 590777 | 720887 | 486883 | 0.44 | 0.39 | 0.50 |
| 2008 | 1017985 | 817139 | 1268197 | 724270 | 655805 | 799883 | 464171 | 0.36 | 0.31 | 0.41 |
| 2009 | 590038 | 472546 | 736744 | 1016900 | 922564 | 1120883 | 523430 | 0.31 | 0.27 | 0.35 |
| 2010 | 204469 | 159393 | 262293 | 1250449 | 1132899 | 1380195 | 609983 | 0.29 | 0.25 | 0.33 |
| 2011 | 362283 | 284905 | 460676 | 1814926 | 1637923 | 2011058 | 719830 | 0.30 | 0.27 | 0.35 |
| 2012 | 509539 | 407251 | 637518 | 2037769 | 1832296 | 2266284 | 727663 | 0.29 | 0.25 | 0.33 |
| 2013 | 472255 | 373147 | 597686 | 2271239 | 2033274 | 2537056 | 966209 | 0.31 | 0.27 | 0.36 |
| 2014 | 860386 | 684467 | 1081519 | 2164925 | 1925998 | 2433493 | 986449 | 0.33 | 0.29 | 0.38 |
| 2015 | 457348 | 367001 | 569936 | 1761651 | 1555581 | 1995019 | 864384 | 0.33 | 0.29 | 0.37 |
| 2016 | 289567 | 229763 | 364936 | 1417485 | 1250256 | 1607082 | 849422 | 0.35 | 0.31 | 0.40 |
| 2017 | 788999 | 627885 | 991456 | 1446266 | 1293939 | 1616526 | 868276 | 0.38 | 0.33 | 0.43 |
| 2018 | 510445 | 395509 | 658782 | 1314594 | 1176049 | 1469459 | 778627 | 0.39 | 0.34 | 0.45 |
| 2019 | 666503 | 516961 | 859304 | 1267579 | 1122835 | 1430981 | 692609 | 0.40 | 0.35 | 0.46 |
| 2020 | 568171 | 429495 | 751622 | 1045938 | 910513 | 1201505 | 692903 | 0.43 | 0.36 | 0.51 |
| 2021 | 406025 | 293498 | 561694 | 936281 | 786002 | 1115291 | 767284 | 0.48 | 0.39 | 0.60 |
| 2022 | 476000* | 832958 | 642510 | 1075459 | ||||||
* Recruitment model estimate.
References
ICES. 2003. Report of the Study Group on Biological Reference Points for Northeast Arctic Cod, 13–17 January 2003,
Svanhovd, Norway. ICES CM 2003/ACFM:11. 39 pp.
ICES. 2016. Report of the second Workshop on Management Plan Evaluation on Northeast Arctic cod and haddock and Barents Sea capelin (WKNEAMP-2) , 25-28 January 2016, Kirkenes, Norway. ICES CM 2016/ACOM:47, 76 pp.
ICES. 2017. Report of the Arctic Fisheries Working Group (AFWG), 19–25 April 2017, ICES HQ, Copenhagen, Denmark. ICES CM 2017/ACOM:06. 493 pp.
ICES. 2021. Benchmark Workshop for Barents Sea and Faroese Stocks (WKBARFAR 2021).
ICES Scientific Reports. 2021. 3:21. 205 pp. https://doi.org/10.17895/ices.pub.7920