The Institute of Marine Research (IMR) and the Polytechnic University of Valencia (UPV) were invited by ICCAT Atlantic-Wide Research Program for Bluefin Tuna (GBYP) to carry out a feasibility study on the use of scientific multibeam sonar, Simrad MS70, to characterize the Atlantic Bluefin Tuna (BFT) spawning stock in the Balearic Sea. The study was carried out on board the research vessel B/O Ángeles Alvariño owned by the Spanish Institute of Oceanography. The aim was to map the distribution of BFT along a pre-defined track (part of an ictyoplankton survey) in the first part of the cruise and in the second part of the cruise do detailed measurements of BFT schools detected and measured by an aircraft. In the first part of the cruise 12 schools were detected with the MS70, but none of these were likely to be BFT schools. In the second part of the survey no BFT schools were detected by the aircraft in the coordinated search. There may be several reasons for the lack of BFT schools; too little time dedicated to school search, wrong area was covered or BFT avoided the research vessel. There was also a problem with electrical noise in the sonar, which reduced the effective range and made data processing more challenging. However, BFT were successfully measured with the MS70 sonar inside and near a transport cage. These data indicate that the MS70 is suitable for detailed measurements of BFT schools. However there is a need to validate estimates made with the sonar and there is a need for lateral target strength estimates of tuna at the frequency range of the MS70 sonar. We recommend that the project is continued, the experience from the current study used to improved survey design and focus is aimed at basic studies on the acoustic properties of tuna.
Feasibility study on the use of scientific multibeam sonar to characterize the Atlantic Bluefin Tuna spawning stock
Report series:
Rapport fra havforskningen 2019-34
ISSN: 1893-4536
Published: 06.09.2019
Updated: 24.11.2025
Project No.: 15543
On request by: The International Commission for the Conservation of Atlantic Tunas (ICCAT)
Research group(s):
Fish capture
,
Acoustics and Observation Methodologies
Program:
The Norwegian Sea
Approved by:
Research Director(s):
Geir Huse
Program leader(s):
Bjørn Erik Axelsen
Summary
1 - Background and Aims
The Institute of Marine Research (IMR) and the Polytechnic University of Valencia (UPV) were invited by ICCAT Atlantic-Wide Research Program for Bluefin Tuna (GBYP) to carry out a feasibility study on the use of scientific multibeam sonar, Simrad MS70, to characterize the Atlantic Bluefin Tuna spawning stock in the Balearic Sea. The study was to be carried out in June and July 2019 on board the research vessel B/O “Ángeles Alvariño” owned by the Spanish Institute of Oceanography while on an annual ichtyoplankton survey targeting BFT tuna larvae. The acoustic survey was also to be coordinated with an aerial survey focusing on intercalibrating aerial estimates of BFT school biomass and abundance in the same area and time. The aim was to measure the same BFT schools from the airplane and with the MS70, compare the measurements and if possible, use the sonar estimates to validate the aerial estimates. This project is a part of a longer-term goal of ICCAT to develop acoustic indices for Eastern BFT spawning stock biomass. The technical specifications of the current study were as follows:
1. The IMR researchers engaged in this activity shall elaborate a Power point presentation summarizing the field work carried out with the MS70 sonar and its results, which shall be provided by July 30th, 2019, at the latest.
2. The IMR researcher Maria Tenningen will participate in the scientific survey that will be carried out on board the Spanish Institute of Oceanography R/V Angeles Alvariño, joining the survey on 30 June and leaving on July 6 2019, as main responsible for the use of the MS70 sonar to characterize in detail BFT spawning schools
3. The IMR researchers engaged in this activity will advise the Polytechnic University of Valencia about the use of MS70 sonar prior to the starting date of the aforementioned survey, on 20th June 2019
4. The IMR researchers engaged in this activity shall process all the data generated by MS70 sonar within the aforementioned survey, elaborating, in close collaboration with the Polytechnic University of Valencia researchers engaged also in this study, a complete scientific report including:
a. Maps of the distribution of BFT schools over the entire surveyed area
b. Whenever possible, estimations of the total abundance biomass of BFT schools detected during the systematic sampling phase of the survey (from 20 to 30 June 2019)
c. Detailed characterization of the Bluefin tuna schools sampled during the adaptive phase of the survey (from 1st to 6th July), including fine scale spatial distribution (size and depth of the schools), estimated total abundance (number of fishes) and biomass (tons), estimations, if possible, of individual sizes of fishes within the analyzed schools
d. Recommendation for the future implementation of acoustic surveys for the characterization of BFT spawning aggregations
Survey planning and implementation was done in close cooperation between IMR and UPV and the preliminary results were presented to ICCAT in a power point presentation. In this report we present the complete results of the study and provide recommendations for future implementation of acoustic surveys for the characterization of BFT spawning aggregations (point 4 in the technical specifications).
2 - Methods
2.1 - Data collection
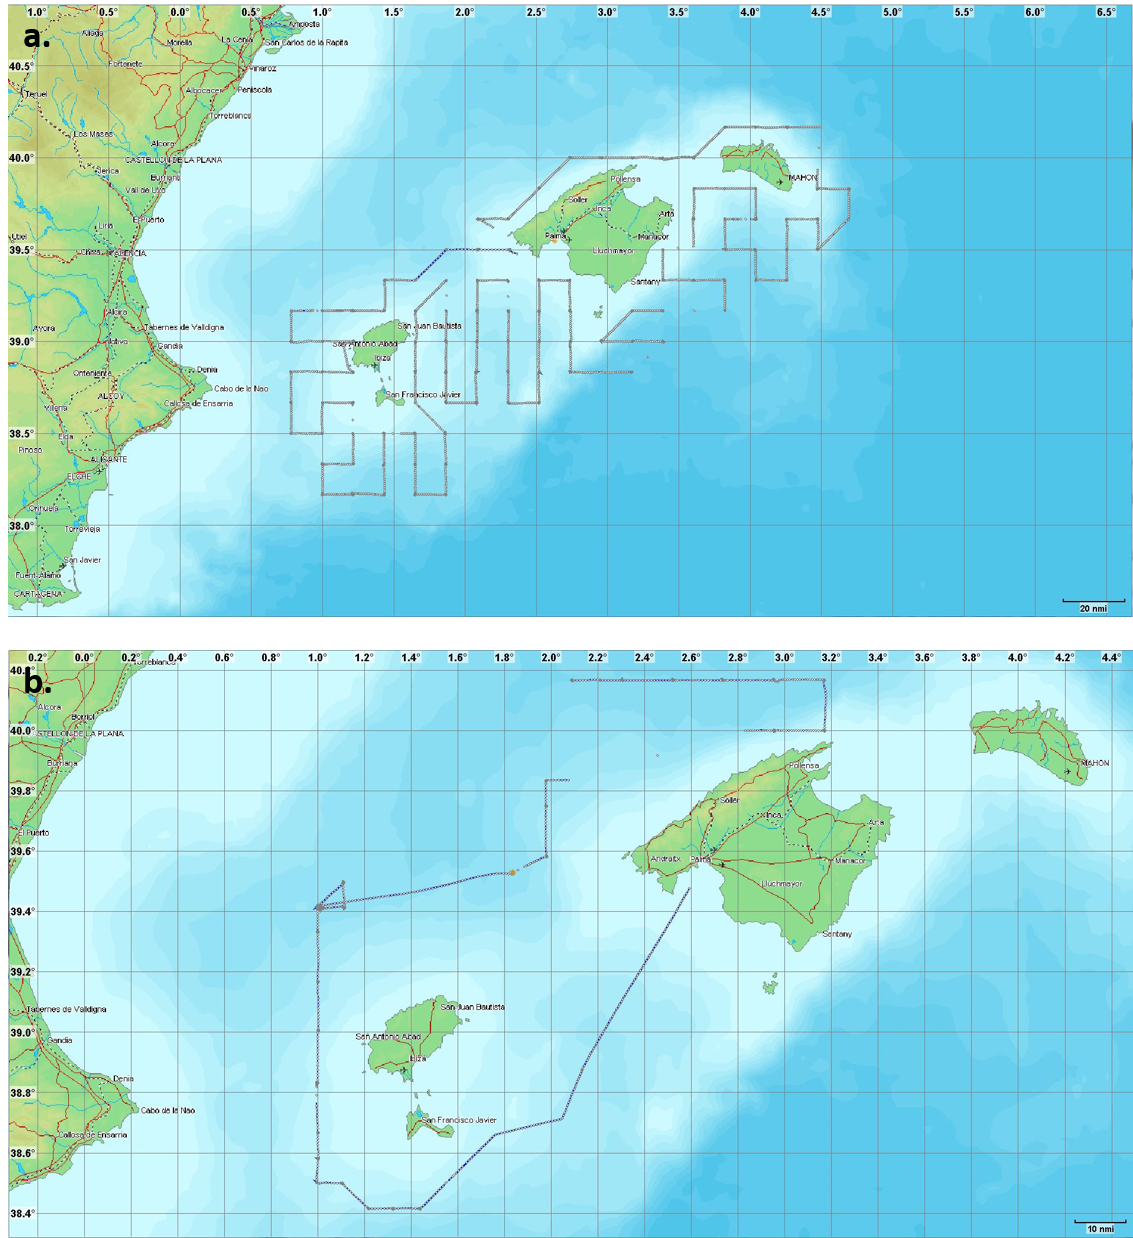
The study was carried out on board the Spanish Institute of Oceanography (IEO) research vessel B/O “Angeles Alvariño” that is equipped with a Simrad MS70 sonar. The acoustic survey was carried out alongside an annual Ichtyoplankton survey in the Balearic Sea in the Mediterranean. The survey was from the 19th of June to the 5th of July and divided into two legs (Figure 1).
During the first leg of the cruise (19-30.06) the vessel followed a pre-defined track covering about 140 stations for sampling larvae, plankton and water. The aim in this part of the cruise was to map BFT distribution by continuously logging MS70 data. Vicent Puig Pons from the Polytechnic University of Valencia together with the instrument personnel on board the vessel was responsible for operating the sonar.
In the second leg of the cruise (01-05.07) time was allocated to coordinated search for BFT schools with the aircraft that was carrying out an intercalibration survey in the same area. The main aim in this part of the cruise was to do detailed measurements, including biomass and abundance estimates, of BFT schools located by the airplane with the MS70 sonar. BFT were also sporadically searched from vessel by looking for fish at the surface. MS70 data was stored continuously. Maria Tenningen from IMR joined this leg.
2.2 - Sonar settings
The MS70 sonar was mounted on the drop keel looking horizontally towards port. The sonar operates in the 75 to 112 kHz frequency range. It provides an acoustic matrix containing 500 beams (25 horizontal and 20 vertical) that covers a 60° horizontal and 45° vertical operating sector. Each beam is 3° to 4° wide depending on its position in the matrix. The default settings for the sonar were used during the whole cruise (Table 2).
| Table 2. Sonar settings. Default settings were used throughout the cruise. Lower frequencies were used in the upper beams and higher frequencies in the lower beams to maintain about equal beam openings with increasing tilt. | |
| Upper frequency | 112 kHz |
| Lower frequency | 75 kHz |
| Pulse duration | 2048 µs |
| Pulse form | CW |
| # Beams in group | 4 |
| Range | 350 m |
| Pulse interval | 1000 ms |
| TVG | 20 log R |
2.3 - Sonar data processing
During the survey the MS70 generated 877 GB of data. The sonar data were processed using the PROMUS module (Processing System for Advanced Multibeam SONAR) in the Large Scale Survey System, LSSS (Korneliussen et al., 2006; Korneliussen and Heggelund, 2007). LSSS is the standard software used at IMR to process acoustic data collected on surveys and PROMUS is the module developed for processing MS70 data. The workflow was as follows:
- All data were pre-processed in LSSS to remove noise using the standard procedure but with some adjustments to take account of the high noise level in the data and strong backscattering of the BFT schools.
Potential schools were automatically detected by the software using a given set of criteria (Table 3)
The schools automatically detected by the software were manually checked and either accepted as real schools or discarded.
For the approved schools details were extracted including time and position of detection, estimated volume, average depth and average volume backscattering strength (Sv, dB re 1m-1) (MacLennan et al., 2002).
Table 3. Criteria for automatic school growing in PROMUS (LSSS). | |
| Parameter | Criteria |
| Max pings from seed | 20 |
| Max missing pings | 2 |
| Min Sv | -52 dB |
| Max Sv | -15 dB |
| Inner range | 30 m |
| Outer range | 250 m |
| Min depth | 10 m |
| Max depth | 150 m |
| Min fan number | 1 |
| Max fan number | 20 |
| Min vertical fan number | 1 |
| Max vertical fan number | 25 |
| Width of erode/dilate filter | 5 |
| Size of the grid cells of the gridded school | 2 |
| Minimum volume | 500 |
| Maximum height | 75 m |
| Maximum aspect ratio | 4 |
| Minimum number of pings in school | 5 |
| Minimum sv times volume | 0 |
| Maximum sv times volume | 9.9999999E14 |
3 - Results
3.1 - Electrical noise
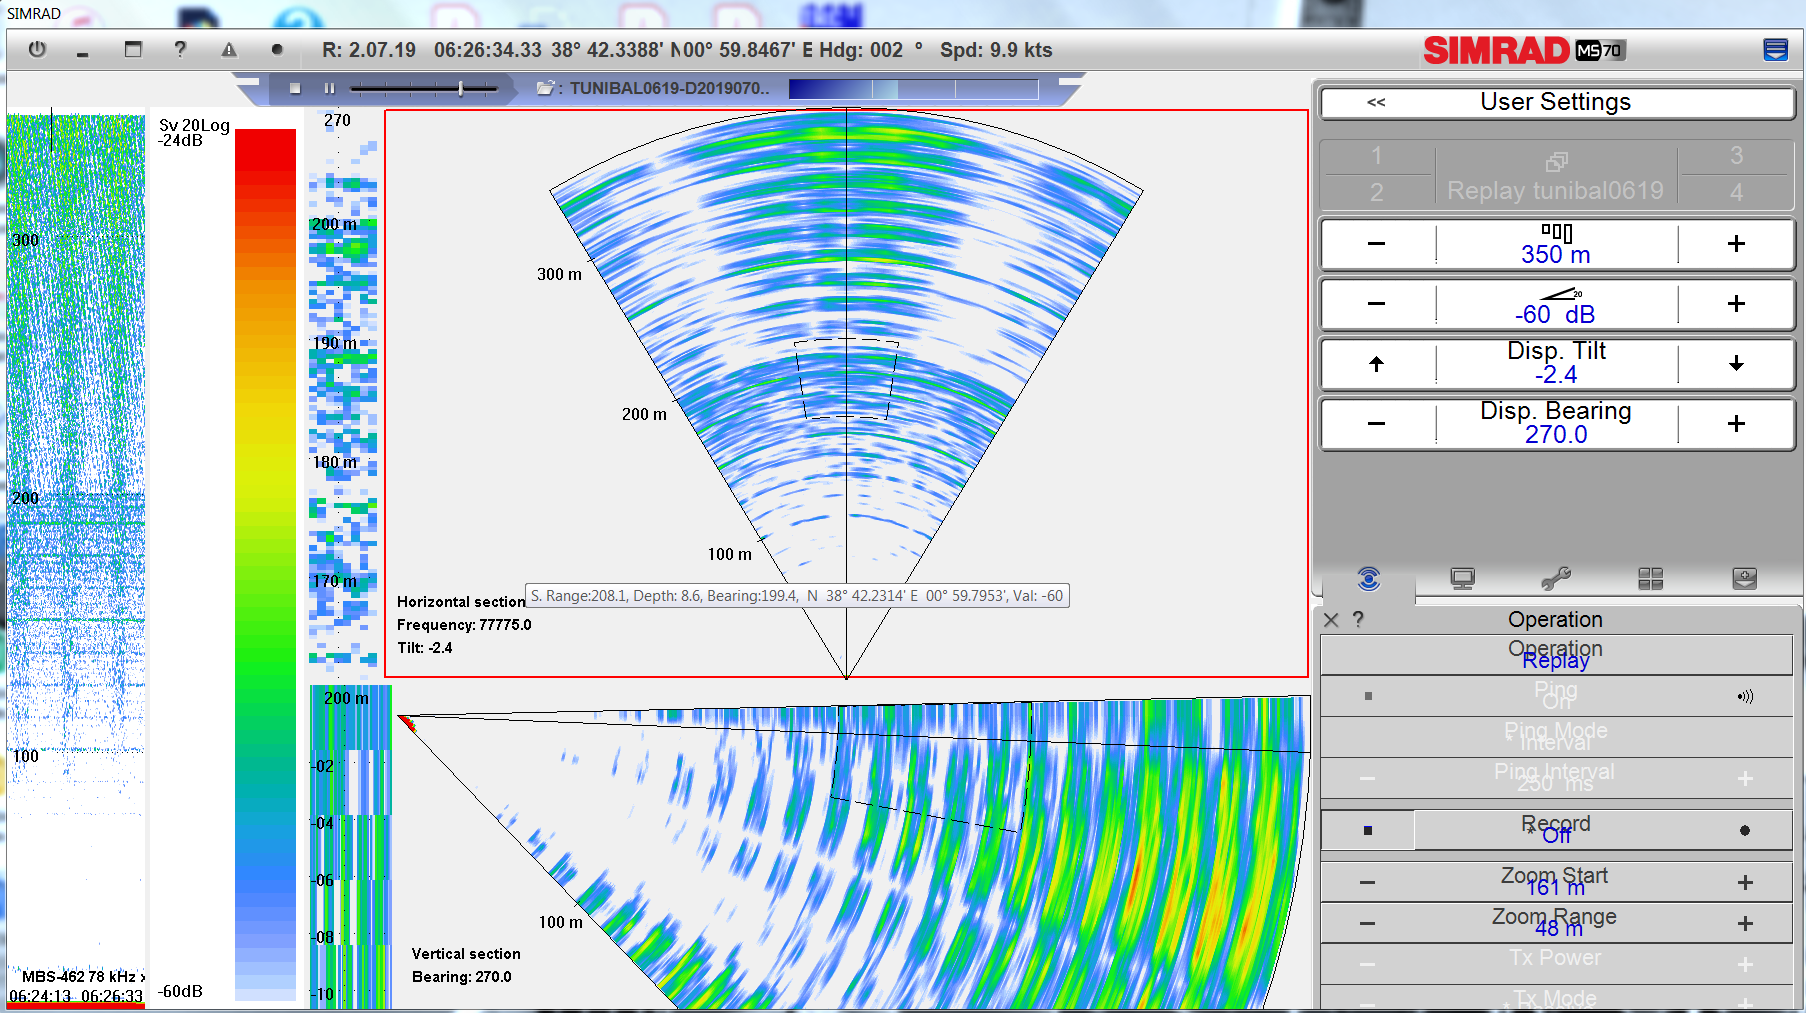
To our knowledge this was the first time the MS70 sonar on board B/O Ángeles Alvariño was in use. As the sonar was turned on in the beginning of the survey a high level of noise was detected in the sonar data (Figure 2). During the first part of the survey attempts were made to locate the source of the noise, e.g. interference from other instruments. Technicians from Simrad Spain came on board the vessel between the cruise legs while in harbor, but it was not possible to identify the source of the noise or solve the problem in such short time. It is believed that the problem is in the installation of the sonar.
The high noise level reduced the effective sonar range from about 350 m to about 250 m. The noise also made data processing more complicated and school detection was less sensitive. The noise was constant and strong (up to about –50 dB), but BFT schools are strong targets and we expected to detect BFT schools despite the noise.
3.2 - School detections with MS70
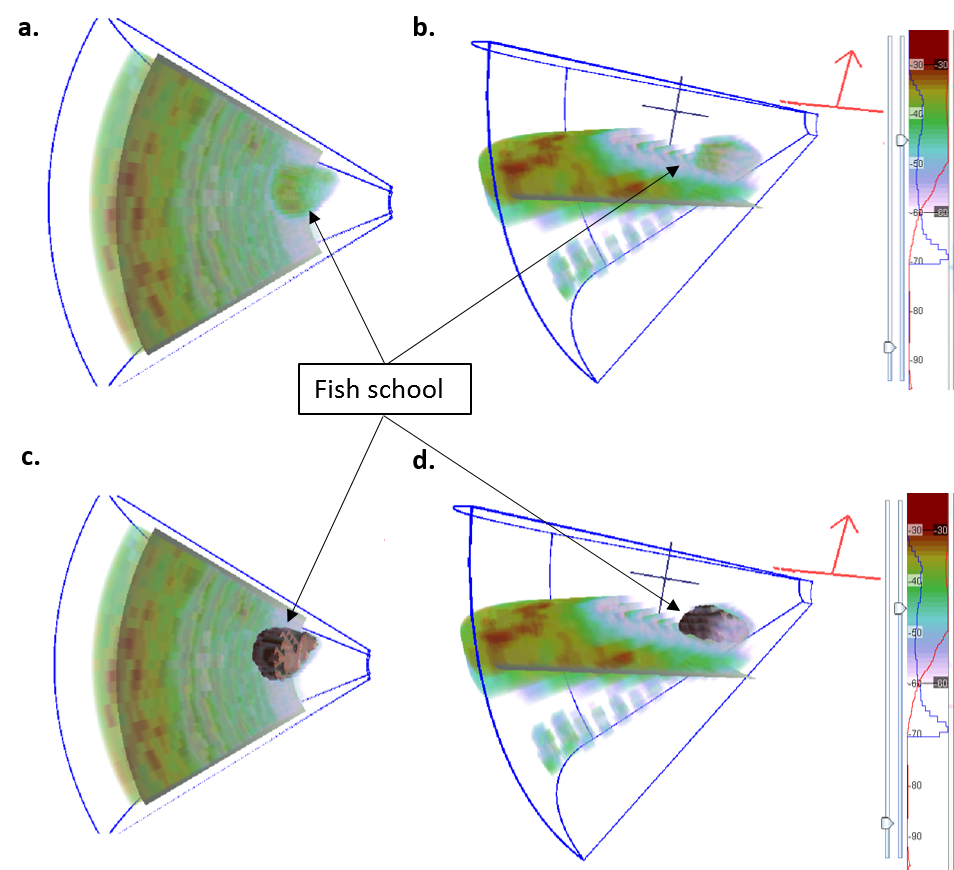
The automatic school detection in PROMUS made several false detections where noise was mistaken as schools. When the suggested schools were manually checked it was relatively easy to distinguish between real schools and noise. A fish school is expected to enter the acoustic beams from the front and pass through the beams as the vessel moves forward while the noise (including electric noise, bottom echoes and other noise) is more constant usually appearing in the same place continuously or at repeated intervals. The distribution of the backscattering strength and the shape of the detection also gives an indication of whether it is a school or noise, where the backscattering is commonly stronger in the in the center of the school and fish schools tend to be shaped as ellipsoids (Figure 3).
In total 12 of the schools automatically detected in PROMUS were considered to be real fish schools (Table 4). The size of the schools varied between 6 500 and 100 000 m3, the average upper depth of the schools varied between 10 and 100 m and the average Sv varied between -42 and -51 dB. It is not possible to determine the species of these detections without better knowledge of acoustic and biological characteristics of pelagic species in the area. It may be useful to compare the results from the MS70 sonar with those from the EK80 echosounder once these become available. Based on previous studies (Melvin, 2016) and the measurements of BFT in the transport cage (see section 3.4.) we would expect stronger backscattering from tuna schools than what was registered. However, we need measurements of BFT schools in this time and area with the MS70 sonar to be certain.
| Table 4. Summary of the schools detected during the survey. The table includes information about the date, time, position in latitude (Lat) and longitude (Lon), average volume backscattering strength (Avg. Sv ) in dB, estimated volume (m3), average height and upper depth of the school. The species of the detected schools are unknown. | ||||||||
| School | Date | Time | Lat | Lon | Avg. Sv | Volume | Height | Upper depth |
| 1 | 21.06 | 04:23:47 | 38.9375°N | 1.1590°E | -44.15 | 26324.5 | 36 | -96 |
| 2 | 21.06 | 04:24:29 | 38.9358°N | 1.1595°E | -44.40 | 73077.0 | 44 | -88 |
| 3 | 23.06 | 05:14:53 | 39.0714°N | 1.6595°E | -51.46 | 6427.1 | 16 | -54 |
| 4 | 25.06 | 04:10:01 | 39.3083°N | 2.7329°E | -50.13 | 2770.2 | 10 | -36 |
| 5 | 28.06 | 14:16:17 | 40.1665°N | 4.0590°E | -47.56 | 14643.9 | 20 | -82 |
| 6 | 28.06 | 15:07:11 | 40.1672°N | 4.0263°E | -43.34 | 107001.1 | 44 | -40 |
| 7 | 28.06 | 15:15:16 | 40.1666°N | 3.9995°E | -44.32 | 77317.9 | 44 | -40 |
| 8 | 28.06 | 19:19:47 | 40.0019°N | 3.5978°E | -46.16 | 7271.5 | 24 | -10 |
| 9 | 01.07 | 11:05:25 | 39.4403°N | 2.5642°E | -43.62 | 7644.2 | 20 | -24 |
| 10 | 01.07 | 11:07:06 | 39.4365°N | 2.5614°E | -47.54 | 84305.2 | 22 | -18 |
| 11 | 01.07 | 11:14:06 | 39.4205°N | 2.5493°E | -39.86 | 32638.1 | 26 | -32 |
| 12 | 01.07 | 11:23:39 | 39.3988°N | 2.5342°E | -52.06 | 11867.5 | 14 | -8 |
3.3 - Aerial and from ship school detections
The aircraft did not detect BFT schools near the research vessel and consequently no detailed measurements of free-swimming BFT could be made. One of the reasons for the lack of school detections may be the limited time spent on coordinated search with the aircraft (Table 5). The aircraft made some BFT detections further away (about 40 nm from the vessel), but due to other cruise activities it was not possible to follow the aircraft. It is also uncertain whether the school could still be located when arriving to the given location several hours later. It was a challenge to coordinate the aerial search. The search area was large, the airplane had a relatively short flight time and the acoustic part of the survey needed to be coordinated with other activities related to the ichtyoplankton survey. Whenever the sea was calm BFT at the surface were sporadically searched for visually, but no definite BFT detections were made (Table 5).
| Table 5. Summary of the aircraft search and detection and visual detections from the vessel | ||
| Date | Aircraft search | From ship detections |
| 01.07 | < 20 min search. No detection | No detection |
| 02.07 | Two 5 nm radius searches around the vessel (morning and afternoon). No detection | No detection |
| 03.07 | One 5 nm radius search around vessel. No detection | No detection |
| 04.07 | One 5 nm and one 10 nm radius search around the vessel. No detection | Cage with tuna and fish outside the cage |
| 05.07 | One 5 nm radius search around the vessel. No detection. | Some possible detections of tuna but lost before we arrived close enough to confirm |
3.4 - BFT sonar measurements inside and near a transport cage
An agreement was made with a BFT cage transport vessel that we could approach and make sonar measurements of the BFT in the cage. The tuna in the cage may not be represnetative of a free-swimming tuna school, where fish may be organized in a different way and less densely packed. Still, the data provide highly useful first measurements of BFT with the MS70 sonar.
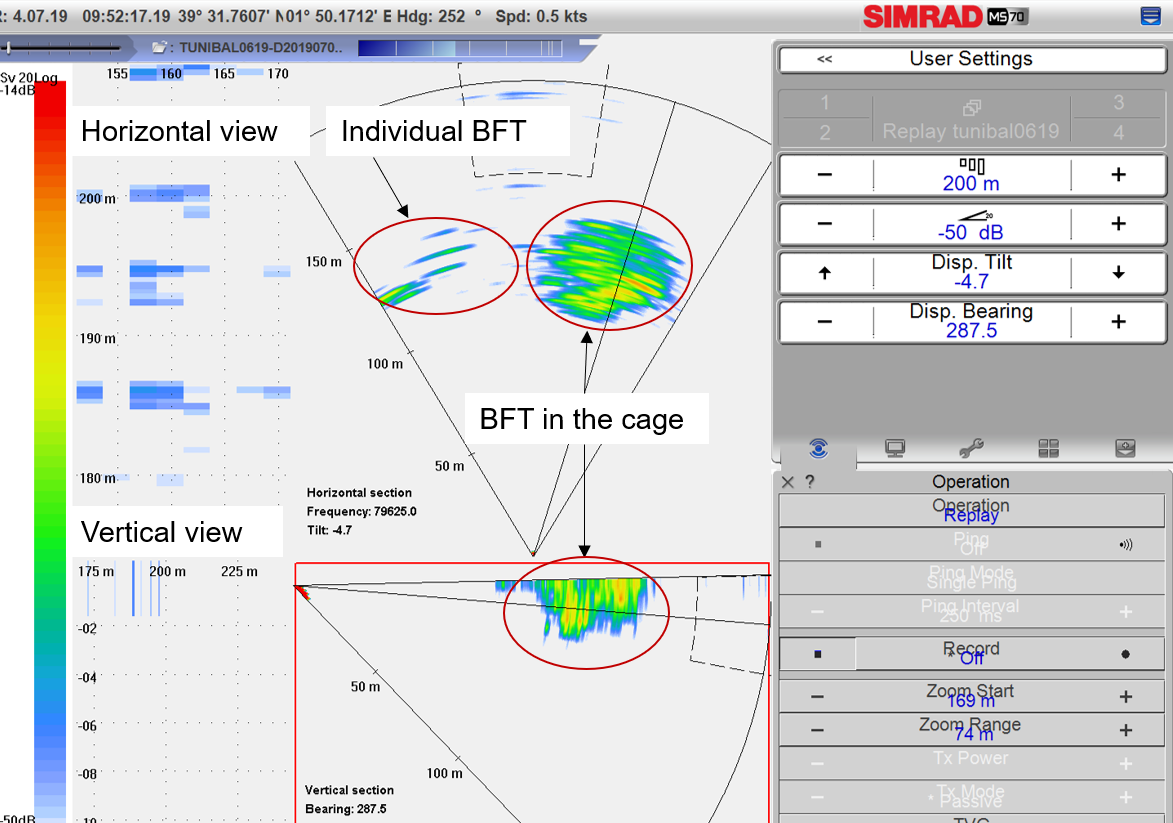
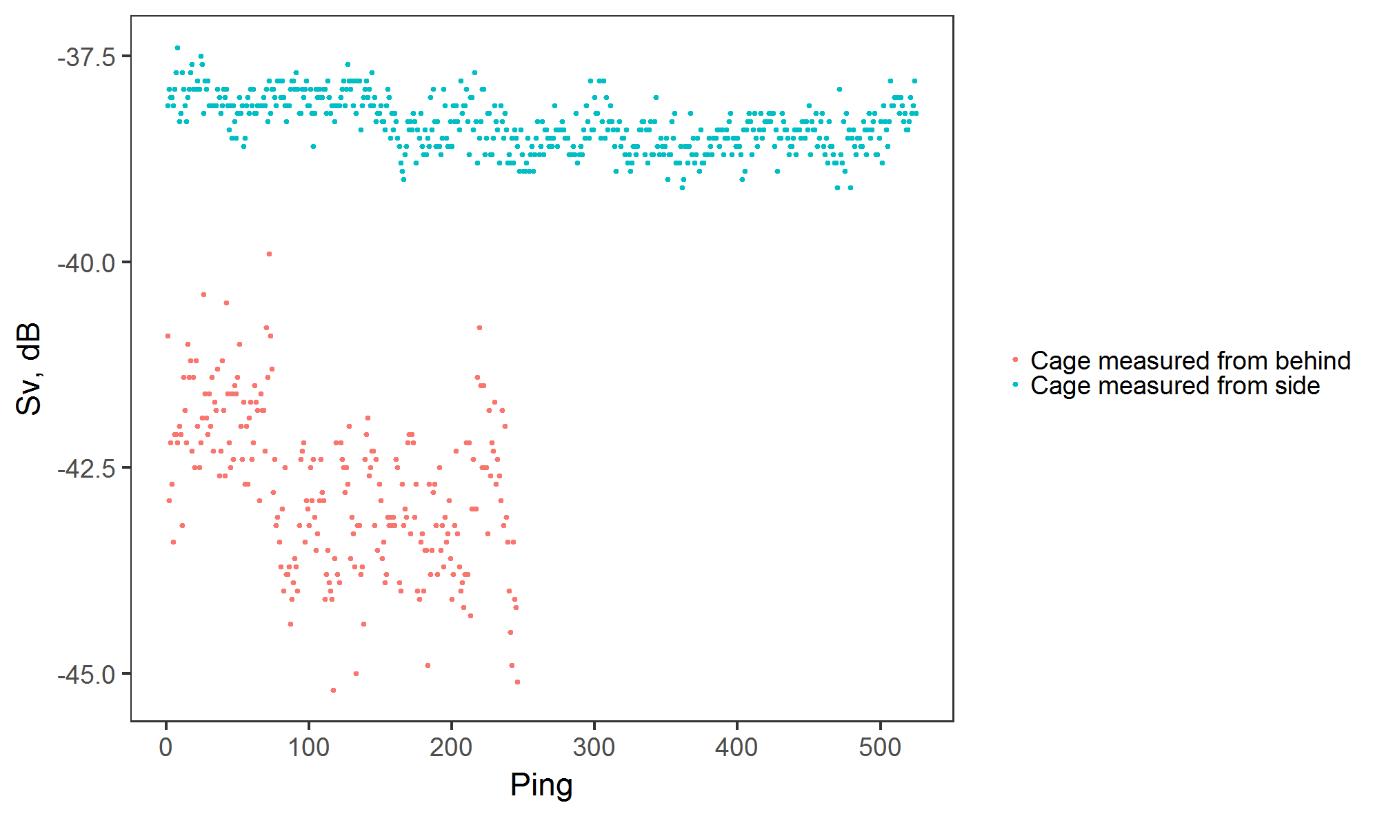
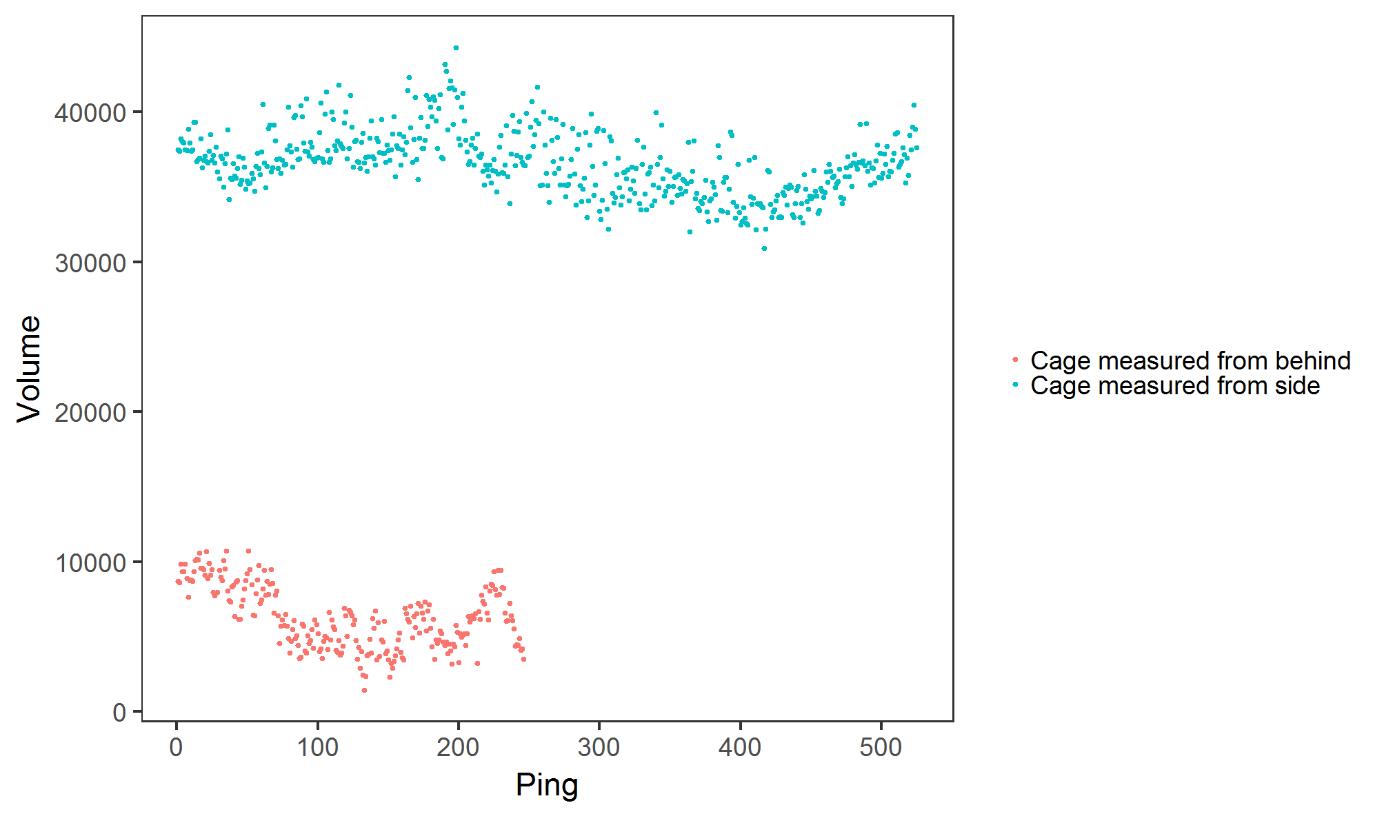
We remained at about 150 m from the cage and monitored it from the side (perpendicular to vessel heading) and from behind (along vessel heading) (Figure 4). The average backscattering strength was -35.46 dB from the side and -41.80 dB from behind (Figure 5). The volume was on 52292 m3 when estimated from the side and 1000 m3 when estimated from behind (Figure 6). Backscatter from fish is strongly dependent on the incidence angle of the acoustic beam, being strongest when approximately perpendicular to the sagittal axis (Cutter and Demer, 2007; Holmin et al., 2012). The results therefore indicate that the BFT orientation inside the cage was mainly the same as or the opposite of the vessel heading. Professional observers and divers report that the fish are milling in the cage and that the cage is deformed as it is towed. This was also observed in the acoustic data where the horizontal dimensions were 114 x 65 m. The elongated shape of the cage where a larger proportion of the milling fish would be swimming along the longer sides of the cage at all time could explain the stronger backscattering when the cage was measured from the side compared to from the behind.
Individual BFT were detected at the surface near the cage. These were captured by the sonar and an attempt was made to use the split beam functionality of the sonar to detect single targets. This caused the sonar to stop working and no data was collected with split beam mode.
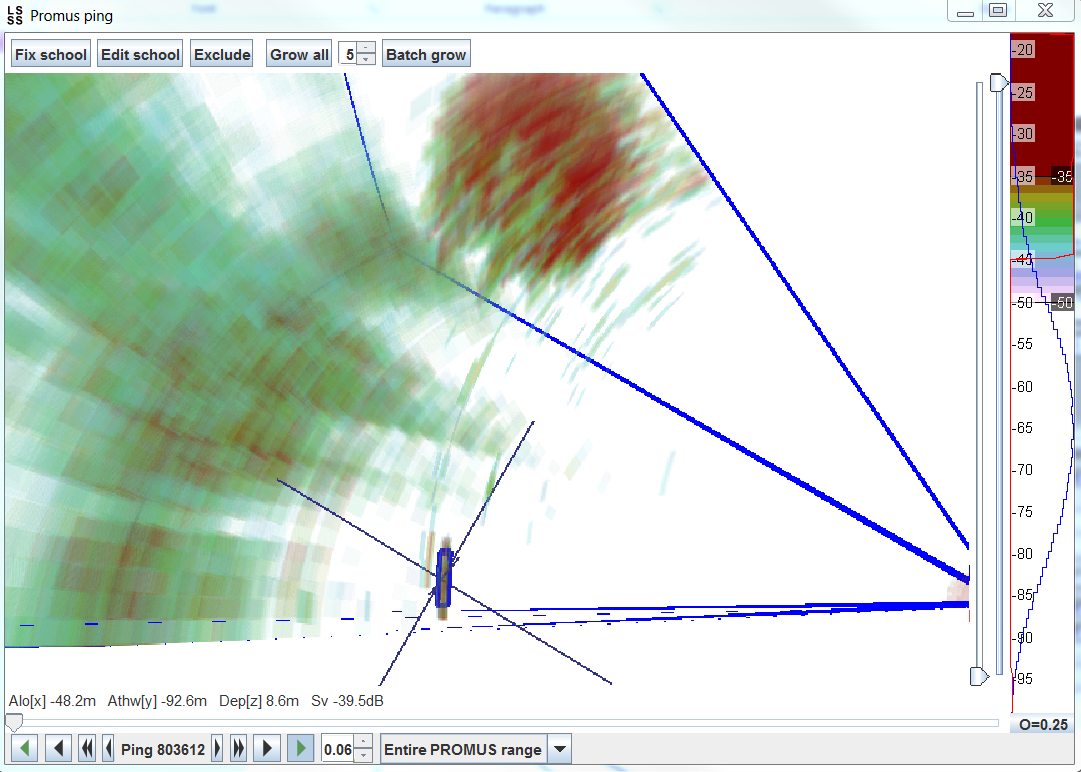
LSSS is made for school detection and the individual tuna were not picked up by the automatic school detection. An attempt was made to extract data from the single detections by changing the school criteria and growing them as small schools (Figure 7). The aim was to try and only extract the scattering from the tuna. The Sv values obtained varied between -32.38 and -32.22 dB, which are lower than expected. The explanation may be that the extracted data included weak echoes from the water surrounding the BFT. It is also possible to get Sv in the MS70 software using the pointer. The values obtained with this method were between -21 and -25 Sv in dB. These are closer to previous measurements of dorsal target strength of BFT (Melvin, 2016).
3.5 - Estimating school abundance and biomass
The number of fish in a school can be estimated from 3D sonar data by counting individual detections. This was successfully done for small Atlantic BFT schools in Nova Scotia using a 500 kHz multibeam sonar on (Melvin, 2016). The advantage of counting individual detections is that there is no need for a calibrated sonar or knowledge of the variation in target strength with insonification angle. However, often the number of fish in a school is large and the spatial density too high for individual detections. Then, the number of fish in a school can be estimated by multiplying school volume with spatial fish density. If the average individual fish weight is known school biomass can then be estimated by multiplying the number of fish by average individual weight.
PROMUS provides an estimate of school volume. The advantage of the MS70 sonar compared with fisheries sonars is that the individual beam opening angles are narrower and they form a 3D matrix. This allows for measurements of the whole school in each transmission providing more accurate estimates.
Fish spatial density can be estimated as:
Fish density (n/m3) = volume backscattering coefficient (sv, m-1)/ backscattering cross section (σbs, m2).
where sv is the volume backscattering coefficient, i.e. the sum of all discrete targets in a volume. Promus estimates the mean volume backscattering strength, Sv (dB re 1 m-1), which is sv in the logarithmic scale. σbs is the backscattering cross-section, i.e the acoustic reflectivity of a target, measured in units of area. σbs expressed in the logarithmic scale is the target strength, TS (dB re m-1).
Therefore, to estimate fish density with the sonar we need to know the target strength of the fish in addition to Sv (provided by the sonar).
No free-swimming BFT schools were detected and measured and we do therefore not know whether it is possible to detect and count individuals in the MS70 sonar data. It was not possible to identify single targets inside the cage (where we also would expect the density to be higher than in free-swimming schools), while outside the cage individual BFT were detected.
To demonstrate the method for estimating school biomass and number of fish in the school, we can make an estimation of the number of fish in the cage based on available data. The “school” volume was estimated to be 52292 m3 and average Sv -35.46 dB. It was not possible to obtain reliable target strength measurements of the individual tuna measured near the cage. Dorsal target strength of BFT between 220 and 313 cm at 120 kHz has previously been estimated to -20.4 dB (Melvin, 2016). UPV have obtained similar values for dorsal target strength at 120 kHz of 225 cm BFT (-19.8 dB). Ventral target strength, which may be more similar to lateral target strength, was measured to near -10 dB. The upper beams of the MS70 sonar, where the tuna in the cage were measured, were 75 kHz and TS may be quite different at this frequency compared with 120 kHz. Below are estimates of fish density and abundance in the cage using the ventral TS of -10dB and dorsal TS of -20 dB estimated at 120 kHz.
TS = -10 dB:
Fish density = (10(-35.46/10)) / (10(-10/10)) = 0.000284 / 0.1 = 0.0028 n/m3
Number of fish = 0.0028 fish m-3 * 52292 m3 = 149 fish
TS = -20 dB:
Fish density = (10(-35.4610)) / (10(-20/10)) = 0.000284 / 0.01 = 0.0284 n/m3
Number of fish = 0.0284 fish m-3 * 52292 m3 = 1487 fish
Professional observers estimated that the cages contained about 170 t, 1000 individuals between 110 and 250 kg each. The acoustic estimate using the ventral TS is 149 fish and using the dorsal TS is 1487. However, before any meaningful estimates of school density, abundance or biomass can be made we need measurements of lateral target strength of BFT at the frequencies of the MS70 sonar. These can either be obtain in situ using the split beam function - on the sonar or in controlled experiments. In addition, the volume estimates and Sv values obtained from PROMUS need to be validated.
3.6 - Other detections
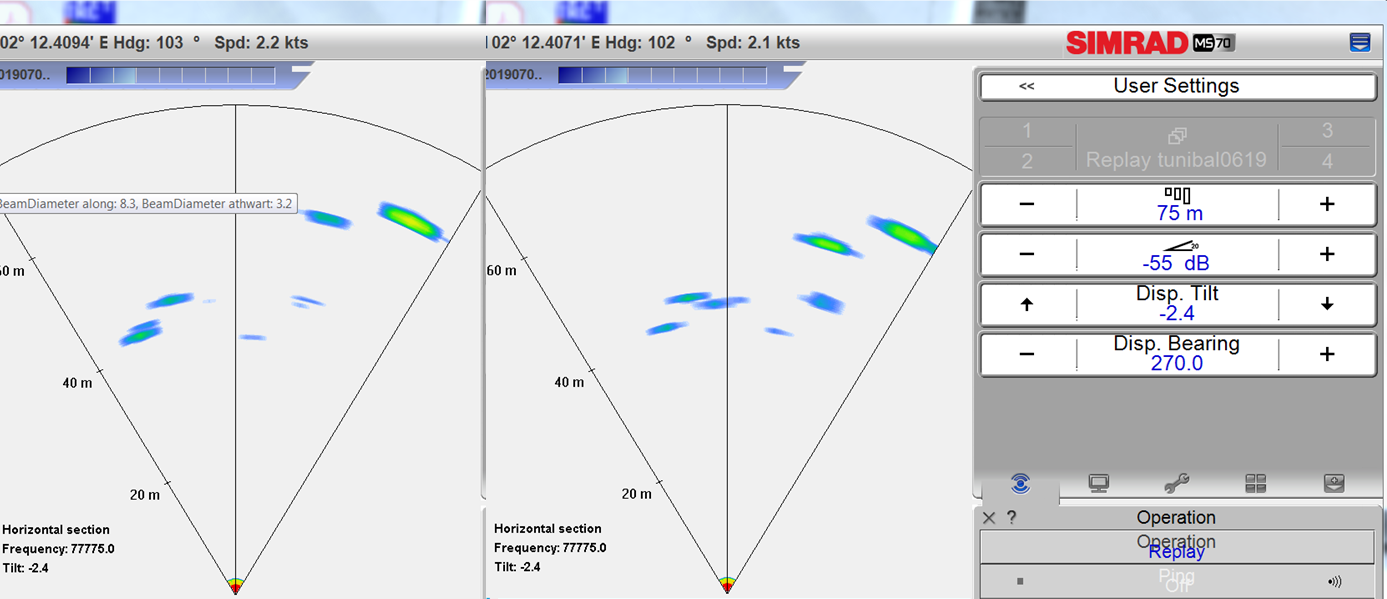
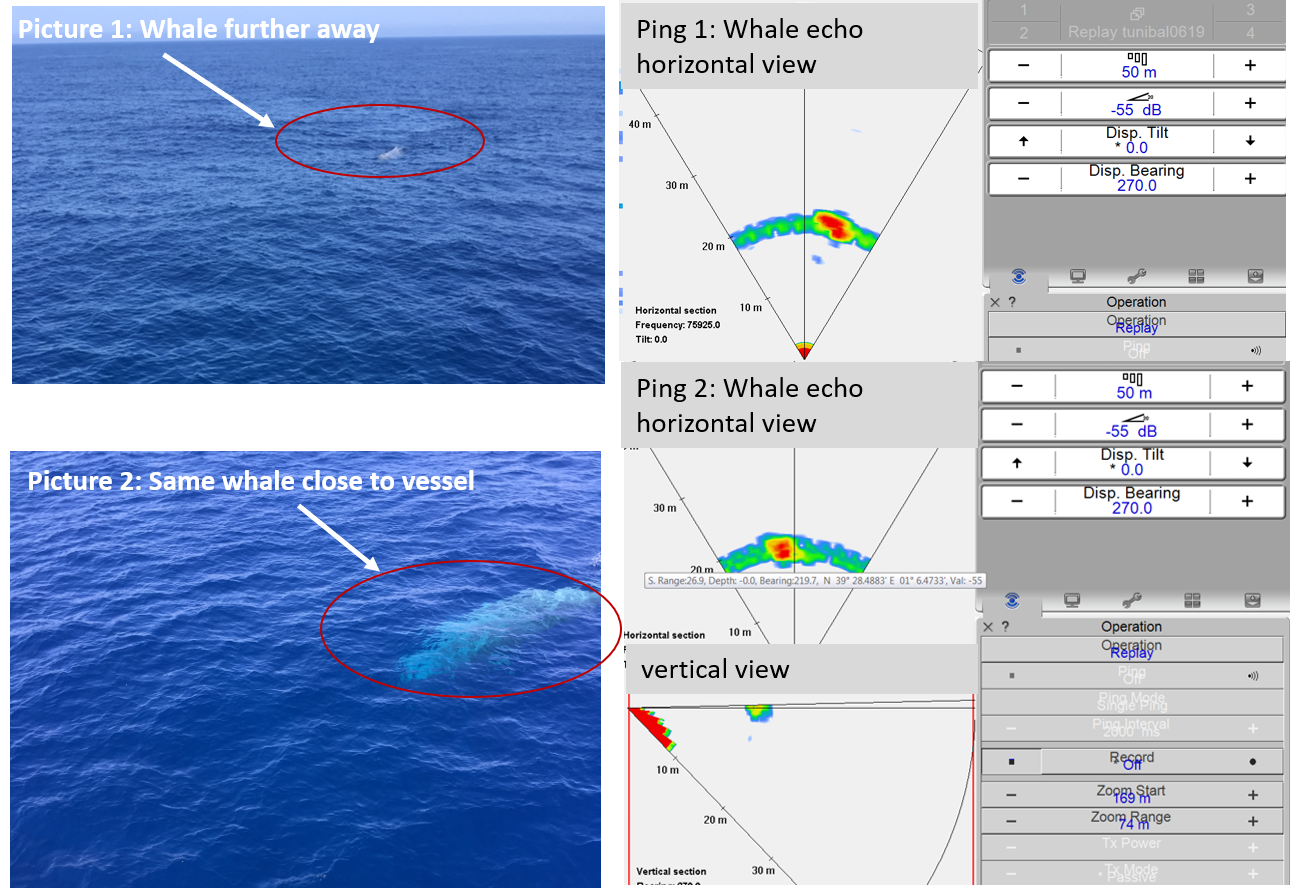
During the cruise we made some measurements of dolphins (Figure 8) and a whale (Ziphius cavitostros) (Figure 9) with the MS70 sonar. These are strong targets (maximum Sv measured in the MS70 software was about -20 dB for the whale and about -27 dB for the dolphins). In both cases the animals were first visually detected on the surface. Despite the strong backscattering the targets are small and may only be present in the sonar beams for a few pings and can therefore be difficult to detect when processing the data. However, these data illustrate the potential for using the ms70 sonar for observing marine mammal behaviour and distribution.
4 - Conclusions and future recommendations
4.1 - Feasibility of using the MS70 sonar for detailed studies of BFT schools
The few measurements of BFT in and near the transport cage indicate that the MS70 sonar is suitable for characterizing BFT schools. The 3D matrix of beams and high resolution of the sonar provides detailed information about the schools. However, for accurate estimates of school biomass and abundance we need more information about the acoustic properties of BFT, schooling behaviour and how it may affect the acoustic measurements. It is also important to validate estimates made acoustically.
PROMUS, the module in LSSS used for scrutinizing MS70 sonar data, has not been extensively used and the Sv and volume estimates need to be quality controlled before reliable results can be obtained. In this report we suggest a method for estimating school biomass and abundance, but the data on Sv volume and TS used in the calculation are uncertain.
To monitor and measure the schools it is necessary to be at relatively close range (<300 m) and keep the whole school in the acoustic beams for some time to obtain good data. As no free-swimming schools were detected it remains uncertain how feasible this is. It will depend on the swimming speed of the BFT and how reactive they are to the research vessel, which again may depend on the current activity of the BFT.
4.2 - Feasibility of the MS70 sonar for mapping the distribution of BFT schools
In the first part of the survey 12 schools were detected along the survey track with the MS70 sonar. It is not possible to determine the species without more information of the acoustic and biological characteristics of pelagic species in the area. It seems unlikely that they were BFT due to the relatively weak backscattering. It was surprising that no BFT schools were detected despite the large area covered by the survey and this may question the feasibility of using the MS70 sonar for mapping BFT distribution. However, before a conclusion can be made more research is needed and as a start some improvements to the current survey should be considered:
- Identify the source and reduce electrical noise in the MS70 sonar on board B/O Ángeles Alvariño. Removing the noise will increase effective range and improve the sensitivity of detecting schools in the data.
- Carefully evaluate the distribution of BFT schools in this time of the year based available information and plan the survey area accordingly.
- Obtain information about how the BFT react to the research vessel. At what range do BFT avoid the vessel and will this have an influence on stock estimation with the MS70 sonar?
- Obtain more information about the acoustic properties and behaviour of BFT schools to ensure that BFT are correctly identified in the sonar.
4.3 - Future recommendations
We recommend that the study on using the MS70 sonar for describing BFT schools is continued. The lack of results from this survey was not due to the operation of the MS70 sonar. Contrary the few measurements of BFT made during this survey were promising. We suggest that the project is continued first by carrying out basic studies on the acoustic properties and behaviour of BFT in a controlled environment and in the field before moving into the development of acoustic methods for estimating BFT spawning stock biomass. Below are some recommendations for further work:
- Solve the electrical noise problem in the sonar
- Introduce calibration procedures. Ideally calibrate the sonar before the next survey. It is possible that IMR can contribute with that.
- Dedicated more time to coordinated search between the aircraft and research vessel for BFT schools. In addition, it should be considered to carry out this survey in coordination with the BFT fishing fleet. The initial aim should be to obtain information about the school behaviour and validate the sonar estimates of school biomass, abundance and behaviour.
- In cooperation with the Polytechnic University of Valencia obtain target strength estimates of BFT at different angles at the frequencies the MS70 operates at (75 - 112 kHz). These may be obtained by measuring BFT in cages or by using the split beam function in the MS70 sonar on individual targets in open sea.
- Quality control data output from LSSS Promus software
5 - Acknowledgements
We would like to thank the skipper and crew on board B/O Ángeles Alvariño and the scientific crew from the Spanish Institute of Oceanography. We would also like to thank Lars Nonboe Andersen and Simrad Spain for guidance along the way. Finally, Francisco Alemany in ICCAT for inviting us to participate in the project and for coordinating the study.
6 - References
Cutter, G. R., and Demer, D. A. 2007. Accounting for scattering directivity and fish behaviour in multibeam-echosounder surveys. Ices Journal of Marine Science, 64: 1664-1674.
Holmin, A. J., Handegard, N. O., Korneliussen, R. J., and Tjostheim, D. 2012. Simulations of multi-beam sonar echos from schooling individual fish in a quiet environment. Journal of the Acoustical Society of America, 132: 3720-3734.
Korneliussen, R., and Heggelund, Y. 2007. Processing 4-D acoustic data from the Worlds most advanced multi-beam fisheries sonar. In Proceedings of the 30th Scandinavian Symposium on Physical Acoustics. Geilo.
Korneliussen, R., Ona, E., Eliassen, I. K., Heggelund, Y., Patel, R., Godo, O. R., and Giertsen, C. 2006. The Large Scale Survey System—LSSS. In Proceedings of the 29th Scandinavian Symposium on Physical Acoustics. Ustaoset.
MacLennan, D. N., Fernandes, P. G., and Dalen, J. 2002. A consistent approach to definitions and symbols in fisheries acoustics. Ices Journal of Marine Science, 59: 365-369.
Melvin, G. D. 2016. Observations of in situ Atlantic bluefin tuna (Thunnus thynnus) with 500-kHz multibeam sonar. Ices Journal of Marine Science, 73: 1975-1986.
