Opprettelsen av marine verneområder er identifisert som et av de mest effektive verktøyene for å stanse den pågående utryddingen av arter og vil være sentralt for å oppnå målet om å beskytte eller verne 30% av våre havområder innen 2030, fordelt jevnt over representative naturtyper, en ambisjon som Norge gjennom naturavtalen og som partsnasjon i konvensjonen om biologisk mangfold (CBD) har sluttet seg til (se Kunming-Montreal Global Biodiversity Framework, COP15). I denne rapport har vi brukt romlige analyser for å undersøke hvordan et nettverk av marine verneområder i de dype delene av det Nordiske hav, som på en best mulig måte beskytter diversiteten av bunndyr og samtidig bidrar til å opprettholde de økosystemtjenester som bunndyrene yter, kunne sett ut. Nettverkskriterier som CBD har satt opp1,2 ligger til grunn for analysene, som kortfattet innebærer gjentatt (i.e. replikert) beskyttelse av alle eksisterende naturtyper og landskapstyper til total minst 30 %, og 100 % beskyttelse av alle viktige naturtyper i studieområdet. Nevnte studieområde strekker ser fra kontinentalskråningen og ned til de dypeste abyssale slettene i de Nordiske hav. De romlige analysene baserer seg på eksisterende geologisk og økologisk informasjon om 1) havbunnstopografi, geomorfologi og marine landskap, 2) tetthet og mangfold av bunnlevende arter, samt 3) utbredelsen av særlig viktige eller sårbare økosystemer, som korallskog og varme havkilder. Tre forskjellige scenarier for vernenettverk, som møter ambisjonen om å beskytte 30 % av studieområdet, blir presentert. I tillegg presenterer vi et senario som vil gi vern til 40 % av studieområdet samt et som vil gir vern til 50 % av studieområdet. De er inkludert fordi flere globale vitenskapelige studier har vist at 40–50 % er det minste arealet som fullt ut vil gi beskyttelse av de forskjellige typene av diversitet og truede arter som havet huser3. Vi presenterer også noen kart hvor vi har inkludert buffersoner rundt verneområdene som vil beskytte verneområdene fra utslipp fra menneskelig aktivitet i nærliggende områder som vil kunne drive inn i verneområdene med vannstrømmer. Vi beskriver i større detalj nettverkssenariet med 30 % vernemål som på best måte møter CBDs kriterier for områdeutvelgelse. Det nettverket dekker 407 968 km², består av 22 MPA-enheter (som varierer i størrelse fra 85 til 77 242 km²) og dekker totalt 33 % av studieområdet. Det gir beskyttelse av 100 % av alle kjente varme havkilder (aktive og inaktive) og kalde havkilder og 100 % av de områder som i denne studie blitt definert som korall og svamp «hotspots». Det gir beskyttelse til mellom 30 og 39 % av den totale areal av de individuelle landskapstypene som forekommer i studieområdet. Det er vårt håp at denne kunnskapssammenstilling og de romlige analysene som blir presentert i rapporten vil bli et viktig bidrag til diskusjonen om hvordan naturavtalen kan følges opp i Norge gjennom styrking av vern og beskyttelse, i en prosess som følger internasjonale normer og som vil styrke Norges omdømme som havnasjon som legger stor vekt på kunnskapsbasert bærekraftig forvaltning.
Identifying priorities for the protection of deep-sea species and habitats in the Nordic Seas
Report series:
Rapport fra havforskningen 2024-5
ISSN: 1893-4536
Published: 28.02.2024
Project No.: 14855
On request by: Miljødirektoratet
Approved by:
Research Director(s):
Geir Huse
Program leader(s):
Frode Vikebø
Norsk sammendrag
Preface
The work presented in this report was commissioned to the Institute of Marine Research, Norway by the Norwegian Environment Agency in response to increased human activities in the Nordic Seas, triggering a need for a knowledge status review and recommendations for how to achieve the best possible protection of benthic ecosystems, including ecologically important species and habitats, in deeper parts of the Nordic Seas. The study area extends from the upper part of the continental break, down to the abyss of the Nordic Seas. This area has not been thoroughly reviewed in earlier work with the Norwegian sea´s management plans. Specific objectives of the Norwegian Environment Agency were to identify relevant factors for the evaluation of protection needs through addressing the following questions: 1) is it more important to protect rare species and habitats or to protect functionally important ecosystems and 2) do some species or habitats need greater protection than others? The evaluations made and recommendations proposed in this report follow principles established in the 1992 UN Convention of Biological Diversity (CBD). The UN CBD is an international agreement to preserve global biodiversity that Norway has committed to follow through ratifying the COP15 Kunming-Montreal Global Biodiversity Framework in 2022. The principles are internationally aligned and applied both in the marine and terrestrial realms. It is, in our opinion, not possible to lean against other principles when answering the questions asked.
Forord:
Denne rapport er en leveranse til bestillingen «rapport om behovet for vern eller beskyttelse av særegne og sjeldne naturverdier i dyphavet» fra Miljødirektoratet til Havforskningsinstituttet. Studien er bestilt i anledning av en økende menneskelig aktivitet i de Nordiske hav, hvor MD har sett et behov for en grundig gjennomgang og vurdering av hvordan man kan oppnå best mulig beskyttelse eller vern av både særegne og sjeldne naturverdier og de bentiske økosystemene i sin helhet, i dype områder av de Nordiske hav. Dette området har ikke vært grundig gjennomgått i tidligere arbeid med forvaltningsplanene. Området som er blitt gjennomgått i denne rapporten strekker seg fra den øvre del av kontinentalskråningen og ned i de dypeste undervannsslettene i de Nordiske hav. Spørsmål som MD ønsker å få besvart er hvilke faktorer er viktig å hensynta i en vurdering av vernebehov, om kun sjeldne eller også økosystem med viktig økologisk funksjon har behov for vern og beskyttelse, og om noen naturtyper har et større behov for vern enn andre? De vurderinger og anbefalinger som blir presentert i rapporten følger prinsipper etablert i FN konvensjonen om biologisk mangfold, en global avtale hvis strategiske plan for bevaring av planetens biologiske mangfold Norge har forpliktet seg til å følge, gjennom ratifisering av Naturavtalen – COP15 (desember 2022). Prinsippene er internasjonalt grundig etablert og brukt både i vann og på land. Det er, etter vår mening, ikke mulig å støtte seg til andre enn disse for å svare på bestillingen.
Summary
Marine Protected Areas (MPAs) are recognized as a key instrument to reverse global biodiversity loss and for Norway to meet its commitment to conserve 30% of its marine area by 2030, based on targets established within the Convention of Biological Diversity (CBD) and the recently ratified COP15 Kunming-Montreal Global Biodiversity Framework1. Specifically, MPA network criteria advanced by the CBD1,2 entail protection of at least 30% of all habitats and marine landscapes occurring in a given study area, as well as 100% protection of all important habitats in the same area. In pursuit of these targets, we have conducted spatial analyses to elucidate, based on the current knowledge, the optimal MPA network design ensuring both maximal biodiversity protection and the continued provisioning of deep-sea benthic ecosystem services in the Nordic Seas. The scope of the analyses included geological and ecological data available for the study area (from the upper part of shelf beak down to the deepest abyssal plains) comprising information on 1) seabed topography, geomorphic characteristics and marine landscapes, 2) the distribution, abundance and diversity of species and 3) the distribution of vulnerable and important ecosystems. Due to the limited knowledge of species occurrences in the area, this analysis heavily relies on topography, geomorphology, and sea-scape classifications, which are known to be strongly correlated with species distributions. Three different MPA network scenarios were generated with a protection target of 30% of the study area. In addition, scenarios representing 40% and 50% protection were produced, based on empirical evidence that this is the minimum size needed to fully protect the range of different aspects of biodiversity components, as well as threatened species. Several scenarios of buffer zones were also proposed to shield the core MPA units from effluents from human activities in the surrounding areas that may drift into the units with water currents. From these scenarios, we described in more detail one of the 30% protection MPA network scenarios that meets the COP15 30x30 protection targets in the best possible way. This network covers 407 968 km², representing 33% of the study area in total, and is composed of 22 MPA units ranging from 85 to 77 242 km². It protects 100% of all known active and inactive hydrothermal vents and cold seeps, as well as 100% of the areas defined as coral and sponge hotspots. Spatially, it protects between 30-39% of all occurring marine landscape types (as defined by the Geological Survey of Norway). We expect that this knowledge review and the spatial analysis presented will serve as a meaningful contribution to the discussion on how Norway should approach meeting its COP15 30x30 conservation commitments. Timely discussion of the conservation and protection needs of deep-sea ecosystems of the Nordic Seas would significantly strengthen Norway’s reputation as a nation driving both the development and the implementation of knowledge-based management of marine resources and ecosystems.
1 - Introduction
1.1 - The history of deep-sea exploration and research
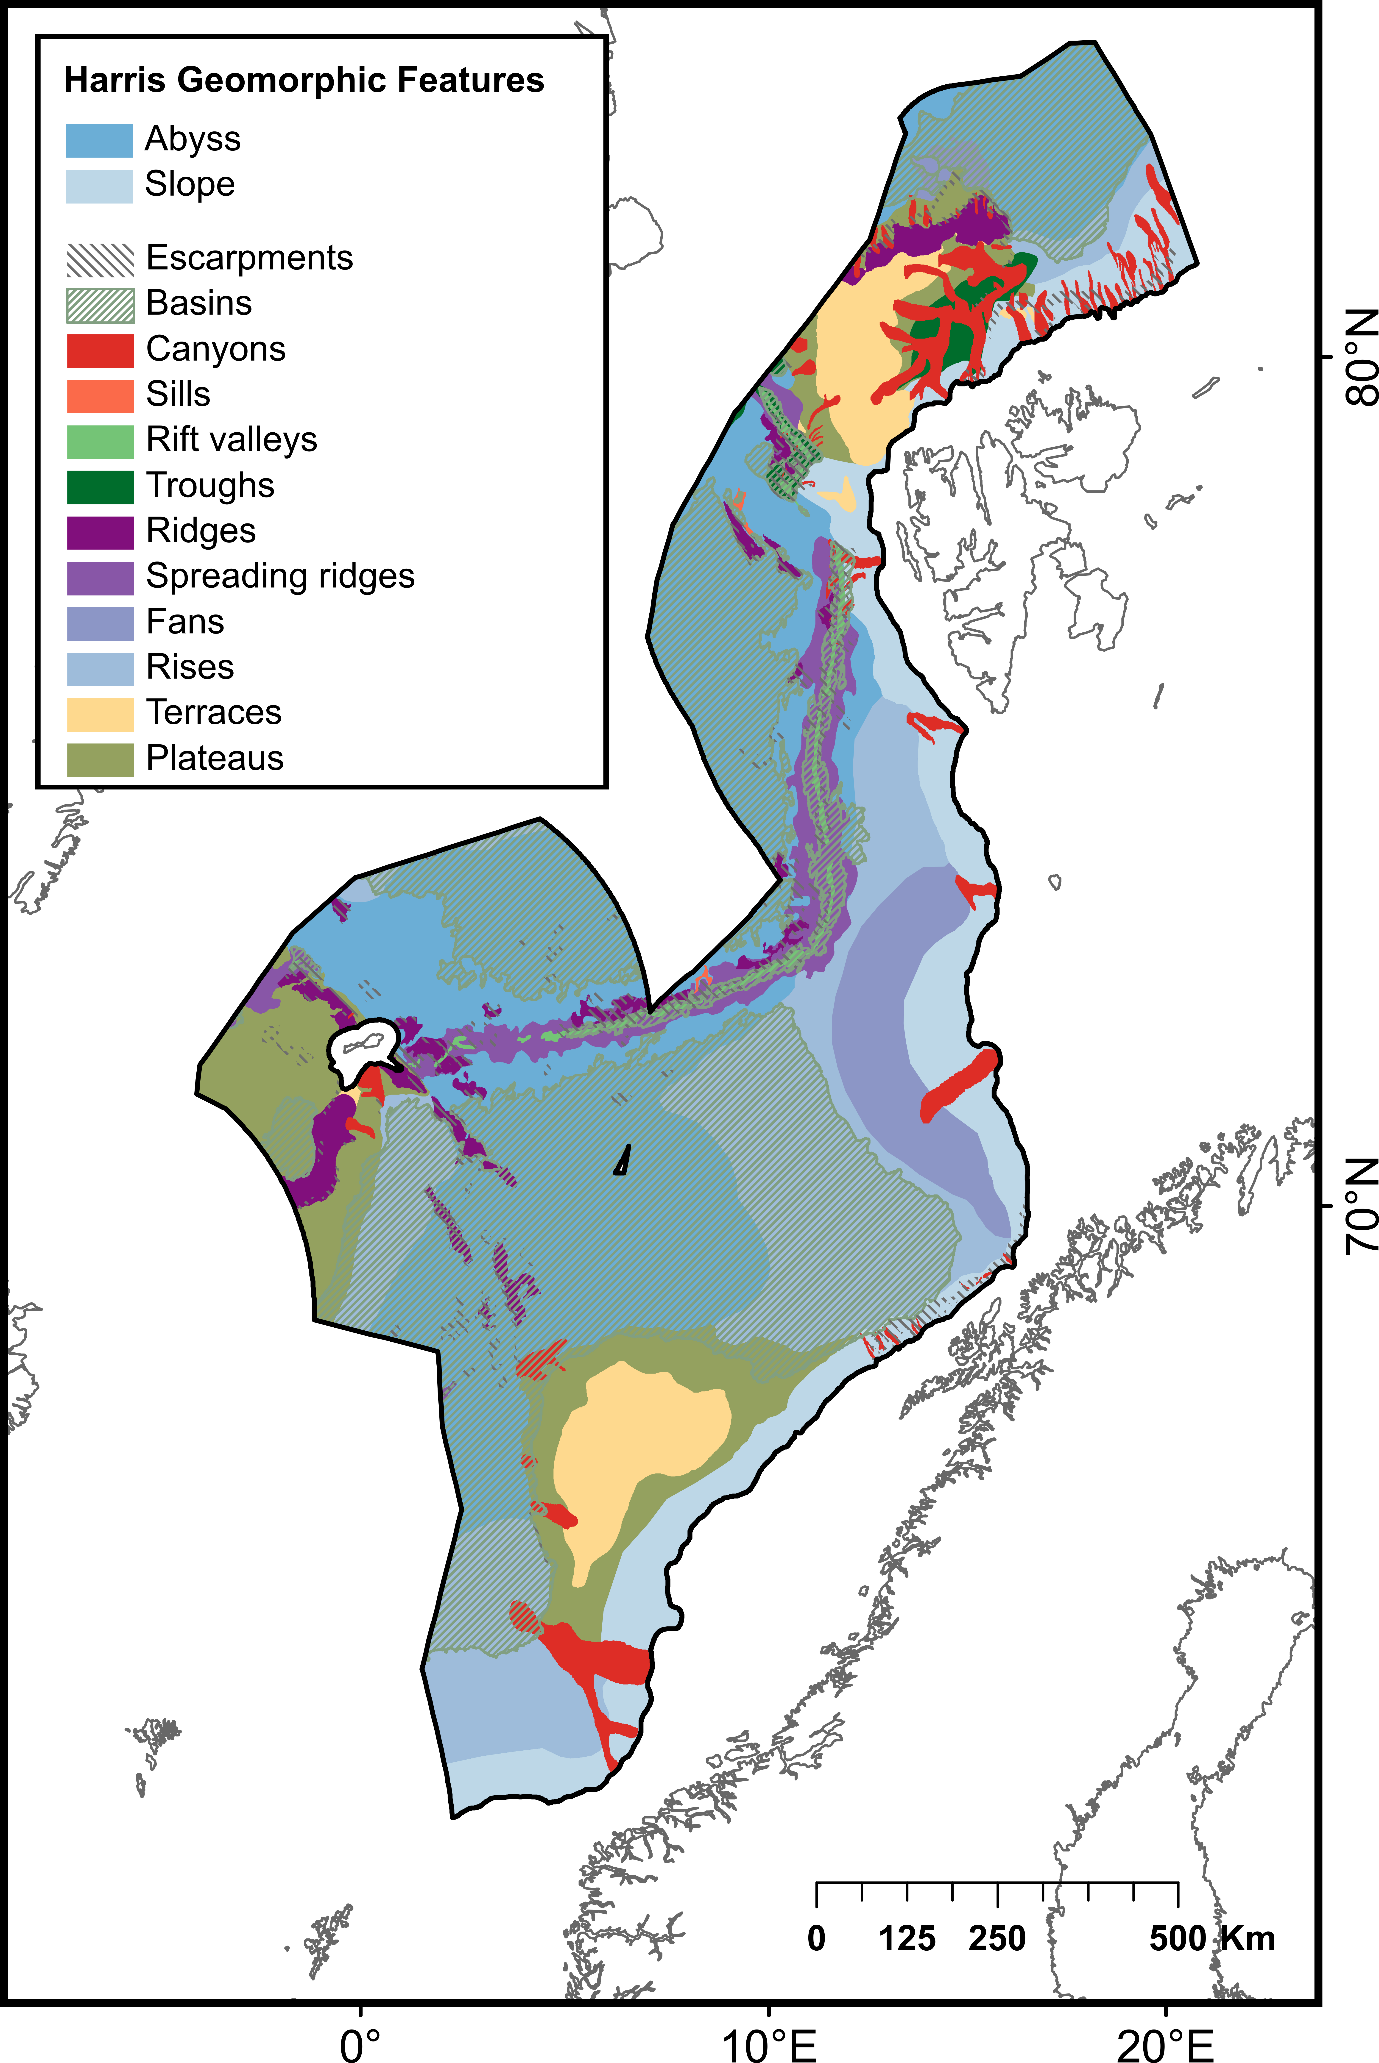
The deep sea represents the most extensive biome on Earth, with about 95% of the planet covered by waters deeper than 200 m4,5 . Although most seas surrounding Norway are shallow continental shelf seas (e.g., the Barents Sea with average depth of 230 m, the North Sea and Skagerrak both with average depth of 90 m), the Norwegian Sea has an average depth of 1800 m and holds a vast area (>260 000 km2 ) that hosts deep-sea ecosystems6–8. In 1876-1878 the Norwegian North-Sea expedition inaugurated the exploration of the Norwegian Sea (a previously uncharted ocean area between Norway, the Faroe Islands, Island, Jan Mayen and Spitsbergen) and described for the first time the seabed topography, oceanographic conditions and pelagic and bottom dwelling marine fauna at these vast ocean depths9 . A century later, efforts to map benthic fauna in the Nordic Seas (i.e., Norwegian Sea, Greenland Sea and Iceland Sea) were continued through the BIOFAR10 , BIOICE11 and the IceAge12 programs. The emergence of more advanced technologies, such as Remotely Operated Vehicles (ROVs) in the 2000s, considerably enhanced the degree of detail to which deep-sea habitats could be studied. These technologies revealed highly diverse and productive, nutritionally interconnected systems associated with ridges, seamounts and hydrothermal vent systems in the Northeast Atlantic Deep Sea8,13–18. Recent ship-mounted multibeam mapping efforts have revealed the Norwegian Sea as much more topographically complex than previously assumed (Dybdedata, Geonorge) hosting a great variety of geological formations; seamounts, canyons, terraces, plateaus, etc., that generate unique environmental conditions and generally foster high biodiversity19–23. Despite these technological advancements, the deep sea remains widely understudied, and many gaps persist in our understanding of its biodiversity and ecosystems. Predictive modelling efforts have demonstrated the high suitability of these complex areas for settlement and growth of habitat-forming corals and sponges24, which are known to be highly sensitive to physical or mechanical pressures induced by human activities24–28.
1.2 - Human activities in the global deep sea
Until recently, the relative inaccessibility of the deep sea has limited the direct impacts of human activities on deep benthic species and habitats compared to most other ecosystems4. Therefore, the deep sea is often considered the last frontier of the Earth. However, technological advancements since the mid-2000s have enabled the expansion of deep-sea industries such as deep-sea fishing (>400 m), deep-sea oil and gas exploration and production, and deep-sea mineral exploration29,30. Since the 1950s, it is unequivocal that the practice of deep-sea bottom trawling has severely or even irreparably damaged countless deep-sea coral reefs, coral gardens and sponge aggregations inhabiting the mid-ocean ridges and seamounts at a global scale29,31. The impacts of deep-sea bottom trawling extend beyond benthic species and habitats, often targeting spawning or feeding aggregations of long-lived, slow growing, late maturing species. Consequently, this practice has led to the depletion of numerous fish populations such as the Orange roughy (Hoplostethus atlanticus) and the Slender armorhead (Pentaceros wheeleri)29.
The hydrocarbon industry has targeted deep-sea oil and gas reservoirs since the mid-1990s. Since the beginning of the 21st century the majority of new major oil and gas discoveries globally have been made in either deep (>500 m) or ultradeep (>1500 m) waters32. Environmental impacts from oil and gas exploration and production occur mainly in the drilling phase when large amounts of drill mud and cuttings are released into the near seabed environment33. The majority of suspended particles tend to settle within a few hundred meters from the wellhead, usually resulting in spatially restricted impacts on benthic communities33. Low concentrations of the drill mud may disperse several kilometers away from the wellhead31. Recent studies demonstrated that impacts of suspended sediment plumes on long-lived structure-forming corals may be severe39. Furthermore, studies have shown much longer recovery times of deep-water benthic communities after being impacted from settling drilling mud as compared to more shallow water benthic communities34. The 2010 Deepwater Horizon oil spill in the Gulf of Mexico also demonstrated that accidental releases of hydrocarbons in near the seabed severely impacts deep-sea corals35.
Marine mining has not yet been realized in the high seas or in any nation’s Exclusive Economic Zone (EEZ), primarily due to a general lack of environmental and biological baseline data, as well as a limited understanding of potential environmental impacts36,37. Consequently, the industry currently lacks societal legitimacy38.
1.3 - Human activities in deep waters of the Nordic Seas
Currently, there is only limited human activities in the deeper parts of the Nordic Seas. Oil and gas extraction occur mainly in shallow waters with the exception of Ormen Lange (at 850-1100 m) and Aasta Hansteen and IRPA (at 1300 m) gas fields. There is only limited bottom fishing taking place below 500 m. Additionally, in Norwegian EEZ (including the fisheries zones around Svalbard and Jan Mayen), all bottom fishing has been prohibited to protect vulnerable marine ecosystems from severe harm (regulation from 2011, Forskrift om endring i forskrift om regulering av fiske med bunnredskap i Norges økonomiske sone, fiskerisonen rundt Jan Mayen og i fiskevernsonen ved Svalbard - Lovdata). This area can therefore be considered protected under Other Effective Area-based Conservation Measures (OECMs) against bottom fishing. However, this protection is limited to threatening activities identified at the time of implementation and will not include other unregulated human activities40,41. In June 2023, a request to open the Norwegian continental shelf for commercial mineral exploration and extraction was proposed by the government to parliament42 . This raises concerns of the potential impacts of the development of this new industry on deep-sea ecosystems where minimal previous economic activity has occured8,43, as this activity is considered among the most invasive and destructive of human activities. Norwegian parlament granted exploration for minerals in the area, on January 9th 2024 (Regjeringen.no). If extraction is permitted, deep waters of the Nordic Seas will not be considered protected under OECMs against mineral excavation, and therefore will be vulnerable to complete habitat removal44 .
1.4 - MPAs and marine spatial planning
The establishment of Marine Protected Areas (MPAs), wherein human activities are restricted or entirely prohibited, has proven to be a key management and regulatory tool in mitigating biodiversity loss, especially by providing refuges for populations of vulnerable species45–49. The implementation of MPA networks, composed of a collection of individual areas that are ecologically connected, also represents an important conceptual approach for the management of marine species and ecosystems45,50. Within well-designed networks, MPAs can be managed to reach specific objectives, while complementing each other and cumulatively ensuring ecosystem connectivity and sustained provision of functions and services across large spatial scales51 . Not only can this approach produce superior conservation benefits to single, isolated MPAs, but also may be more adaptable to minimize socioeconomic impacts without compromising these benefits. As stated in the white paper “Stortingsmelding 20 - Norway´s integrated ocean management plan” the government’s objectives are oriented towards the establishment of representative MPAs in Norway´s coastal and marine waters and provide a representative network that maintains the full range of habitat types found42. The COP15 Kunming-Montreal Global Biodiversity Framework (ratified by Norway in December 2022) targets that at least 30% of land and sea areas, especially areas of particular importance for biodiversity, are conserved through effectively and equitably managed, ecologically representative and well-connected systems of protected areas and OECMs, and integrated into the wider landscapes and seascapes1. Currently, about 8.2% of the world’s oceans (www.protectedplanet.net/marine) and approximately 5% of Norwegian waters are covered by MPAs. Norway’s existing MPA inventory was implemented as part of a marine protection plan drafted in 2004, and comprises 36 representative MPAs placed exclusively in coastal waters. In addition, a large part of the Norwegian seabed is protected though OECMs in fisheries legislation.
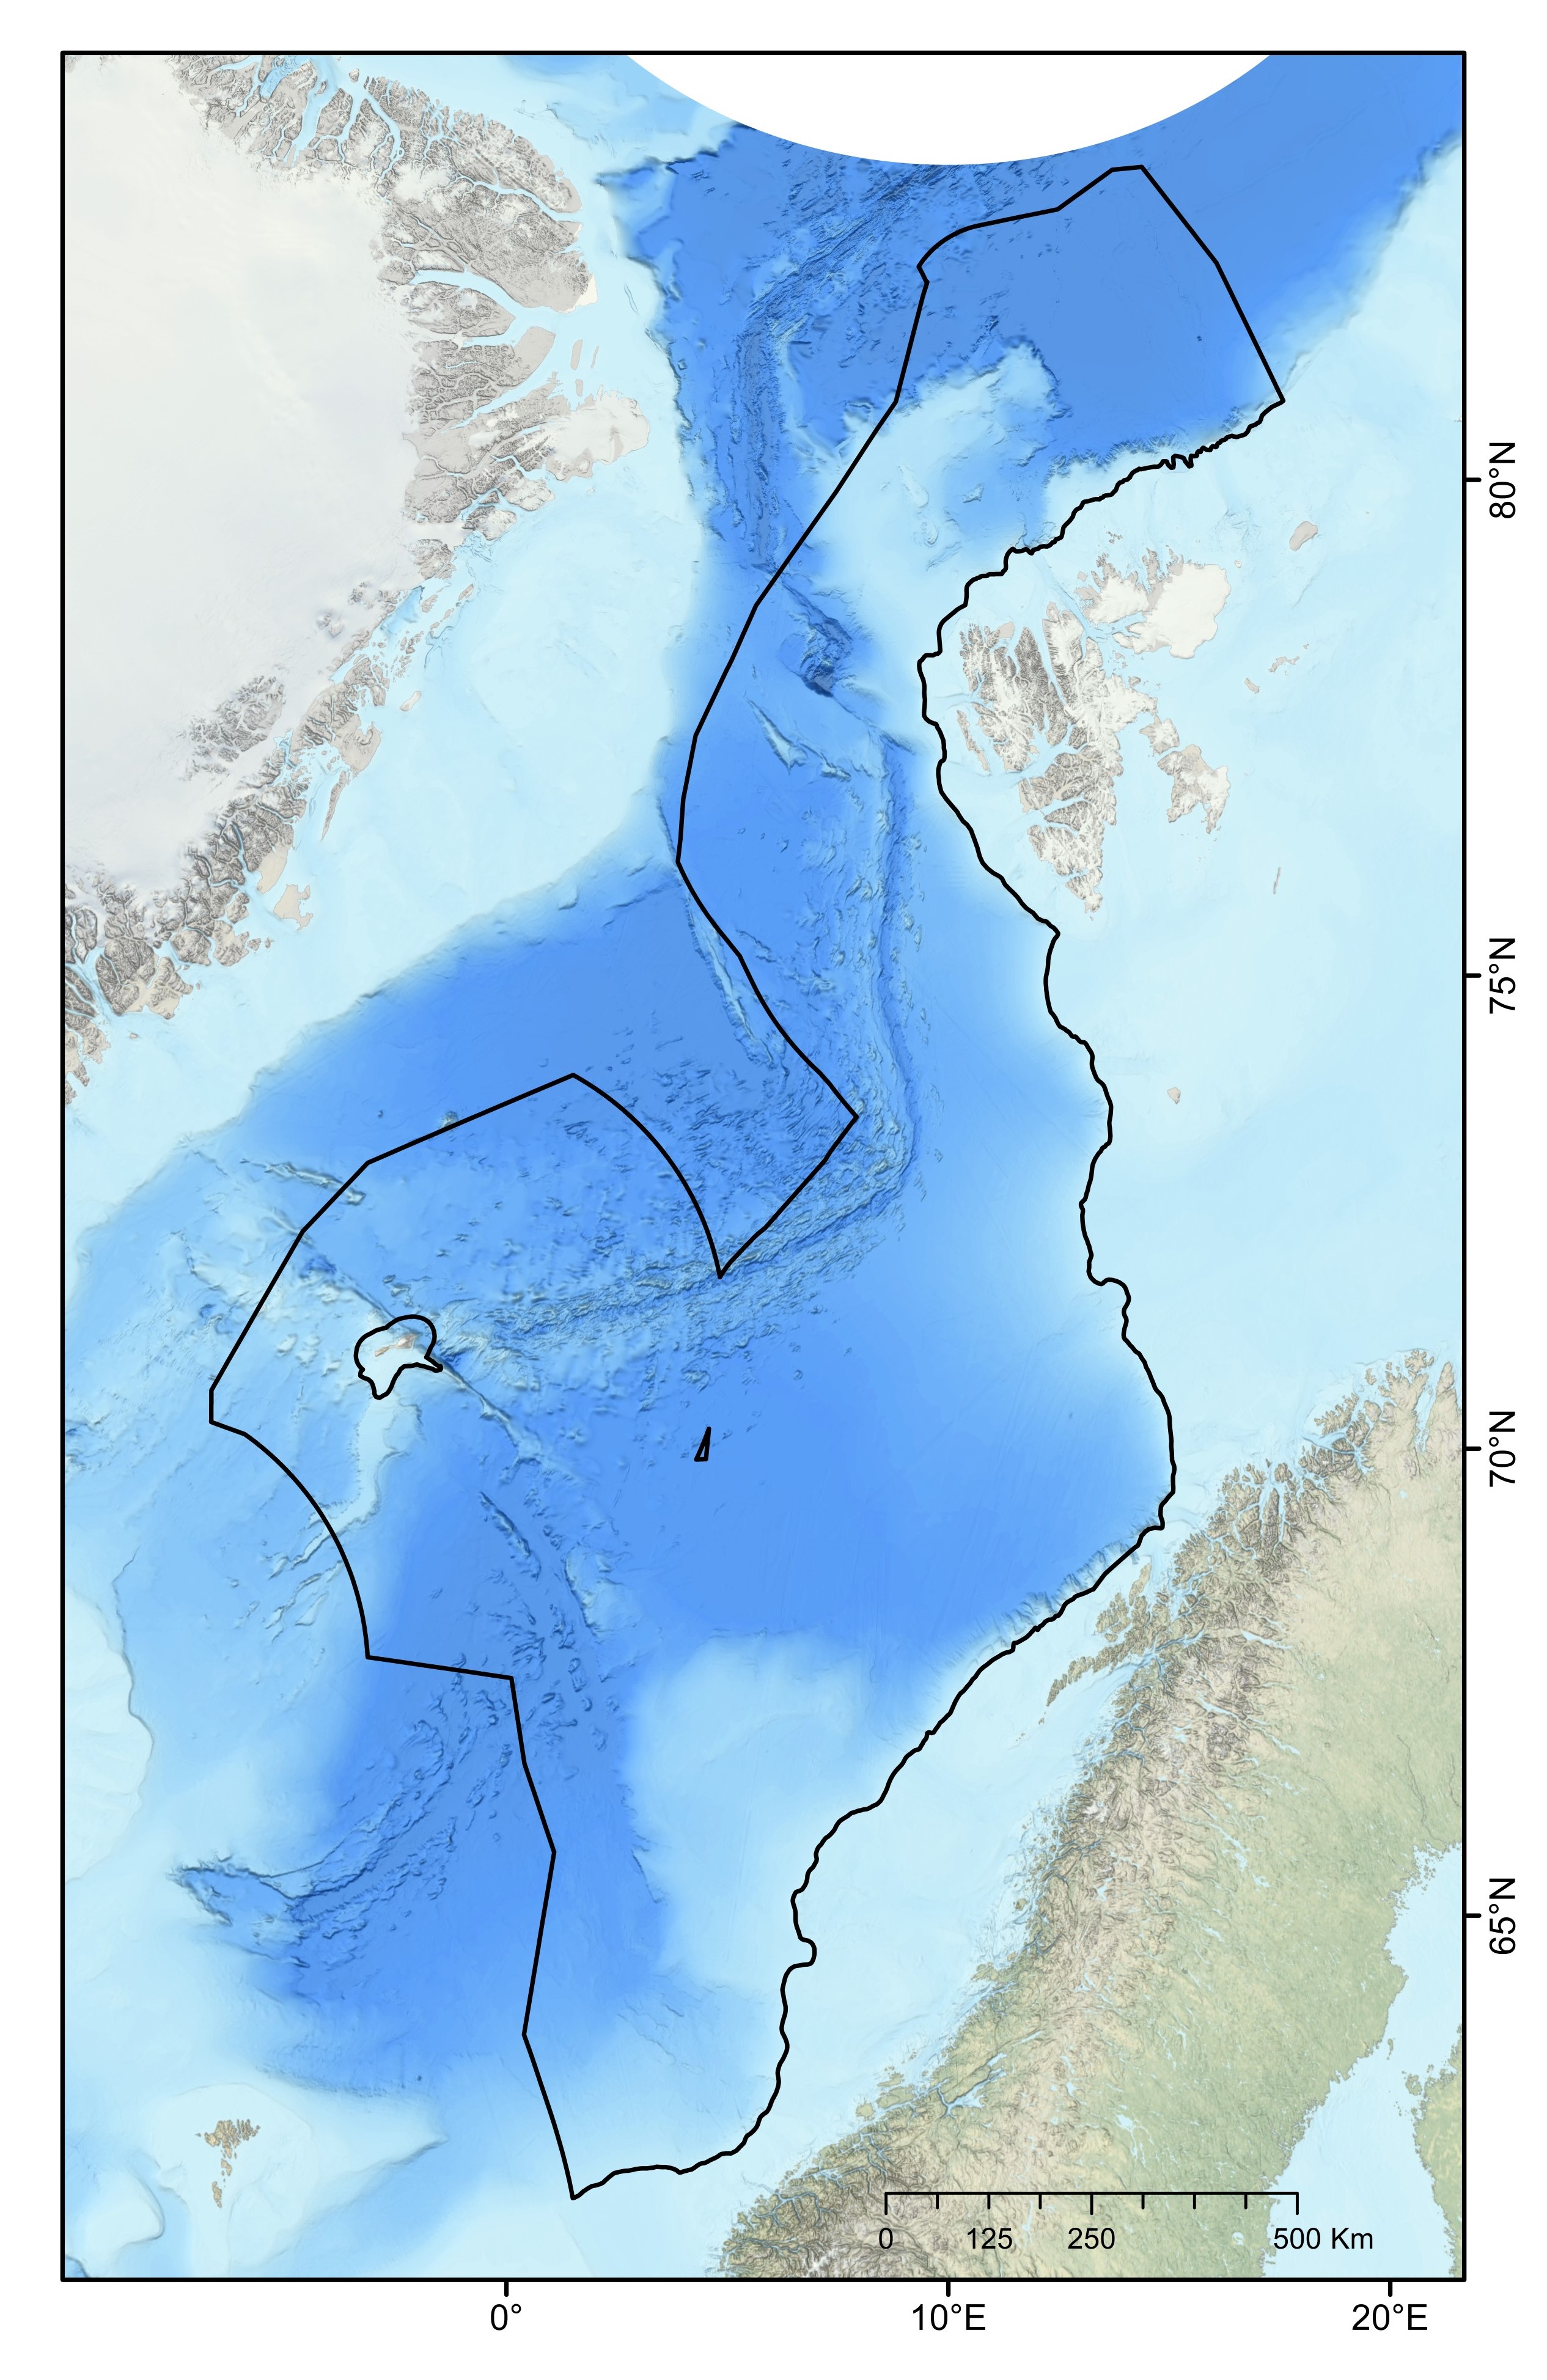
In this context, the primary objective of this report is to propose a representative network of MPAs within the NECS (Norwegian Extended Continental Shelf), based on the available knowledge as of the time of this report’s writing, aiming to mitigate potential future anthropogenic impacts on deep-sea benthic ecosystems. This has been actualized with the government’s recent proposal to the parliament to open the continental shelf for mineral exploration and exploitation42. The deep-sea area of interest (i.e., our study area) was defined as all the seabed of the continental slope and the abyss belonging to the NECS (Figure 1). Here, we aimed 1) to identify priority areas for the protection of geomorphic and biological features and 2) to propose a representative network of MPAs, following the principles for MPA network design provided by CBD and Oslo-Paris Convention (OSPAR)2,52. The principles are internationally established and are used by the International Seabed Authority to establish no-mining areas in ocean regions where licenses for deep-sea mineral exploration have been commissioned (e.g., in the Clarion-Clipperton Fracture Zone).
2 - Methodological approach for MPA network design
All publicly available scientific data were collected for the area of interest. This comprised biogeographic regions and provinces55, geomorphic features and marine landscapes22 (e.g., canyons, ridges, seamounts, hydrothermal vents) and biogenic habitats (e.g., abundance and diversity of cold-water coral communities and sponge aggregations). The description, definitions and sources of all the layers and data used in this study are given in Appendix.
2.1 - Study area
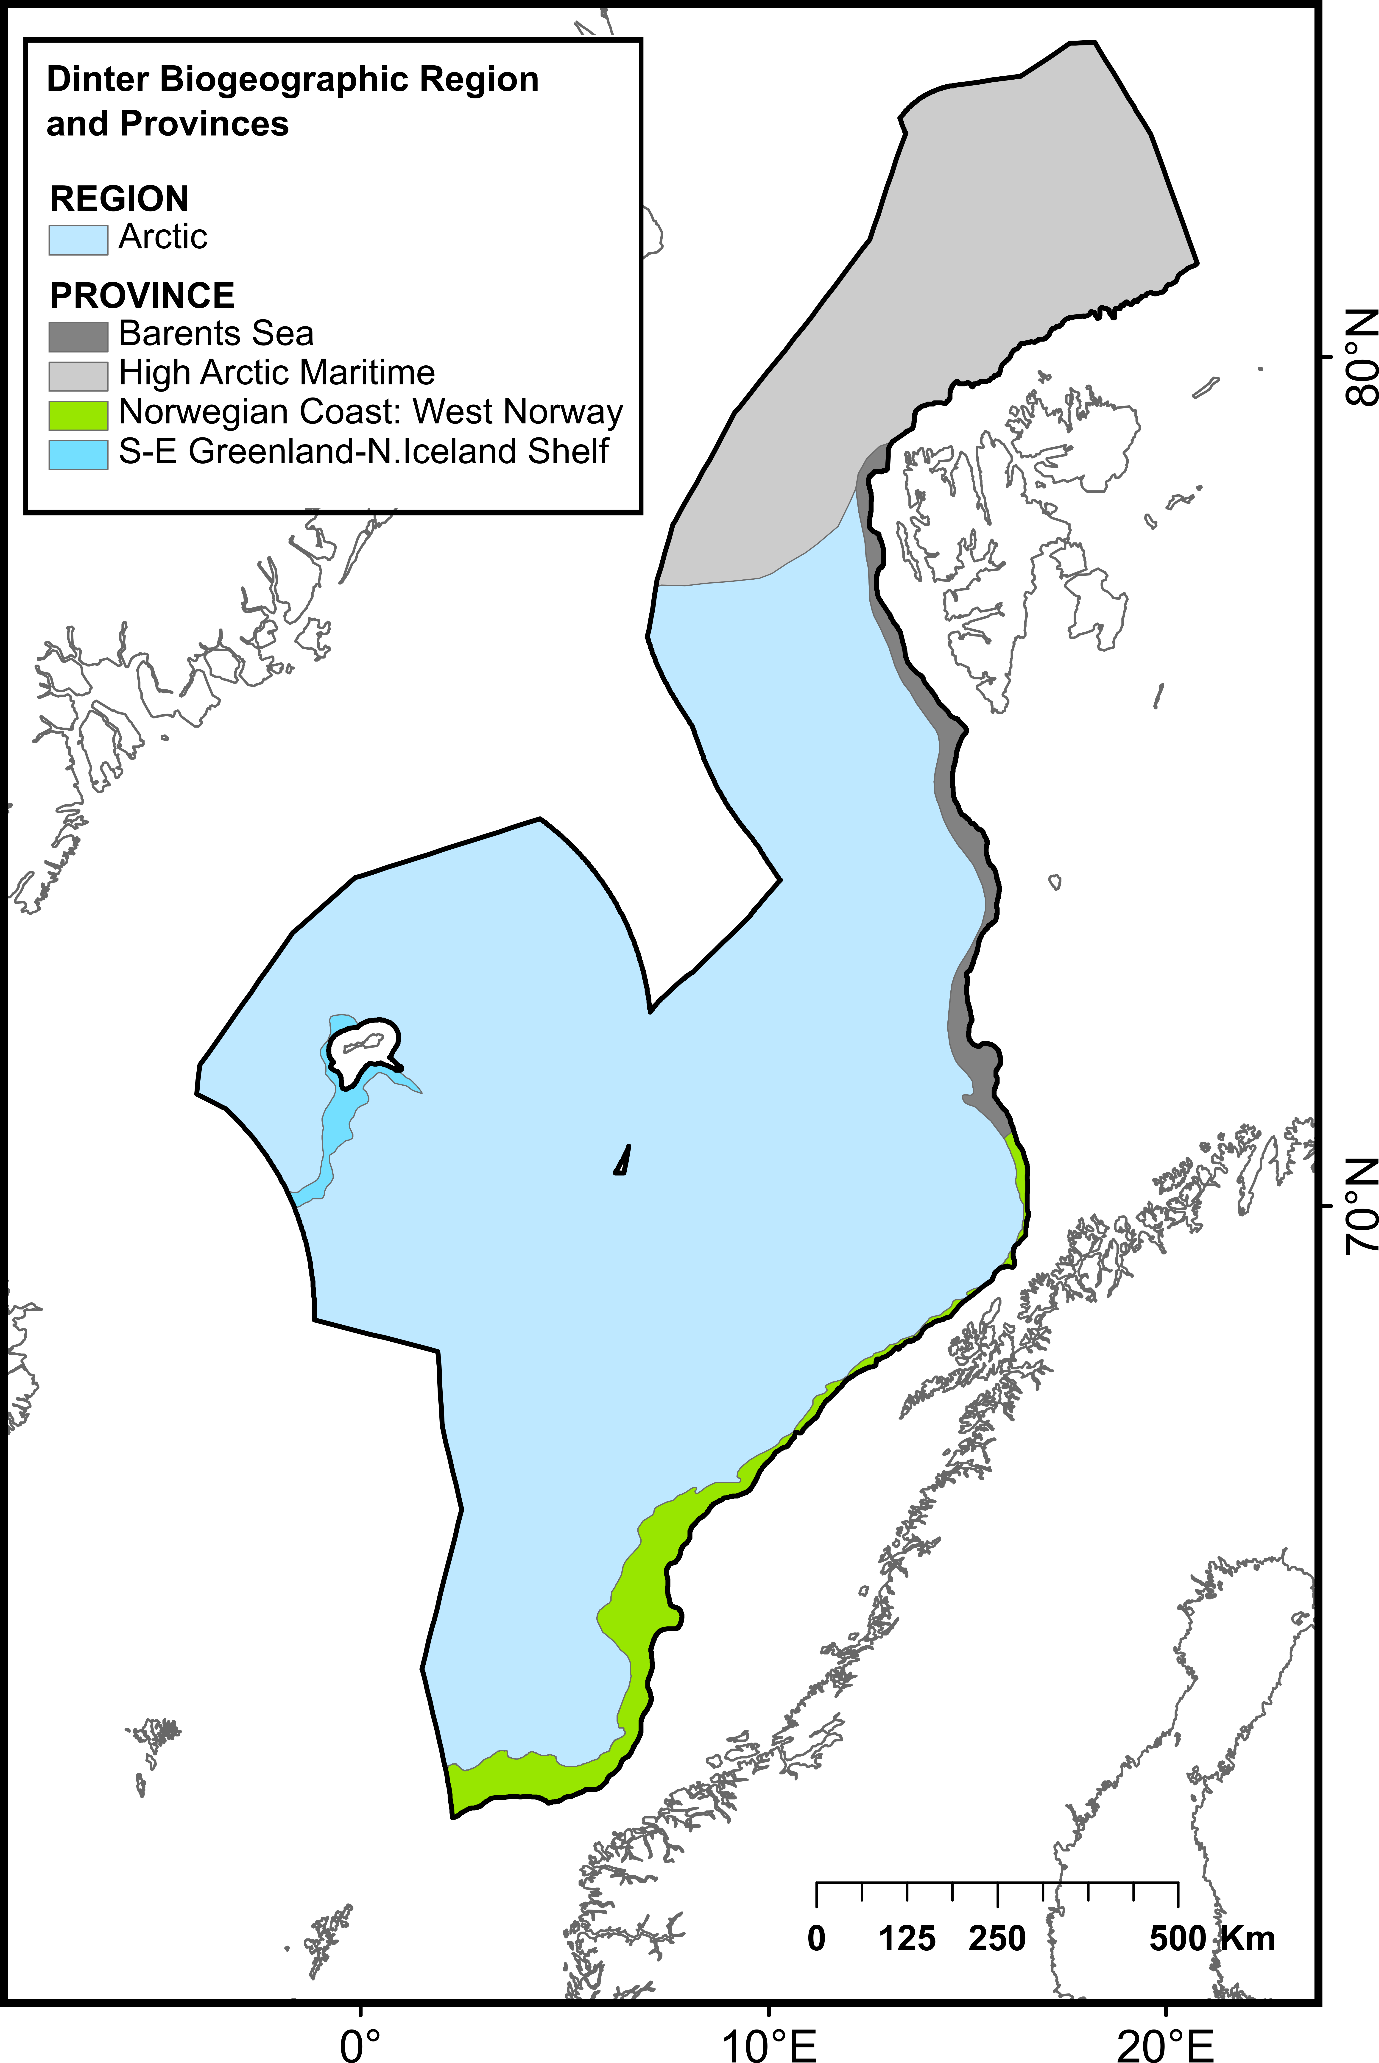
The ocean area north of the Greenland-Scotland ridge, south of the Fram Straight and Spitsbergen Island, and west of the continental slope to the shallow Barents Sea is generally referred to as the Nordic Seas. This region comprises the Norwegian Sea, Iceland Sea and Greenland Sea, covering approximately 2.6 million km². It has an average depth of 1600 mn with its deepest point, Molloy Dypet, reaching a depth of 5569 m. The area is characterized by remarkable heterogeneity, with shallow continental shelfs and slopes, vast abyssal plains (i.e., Boreasbassenget, Grønlandsbassenget, Lofotenbassenget and Norskehavsbassenget), the Arctic Mid Ocean Ridge (Kolbeinsey Ridge, Mohn´s Ridge and the Knipovich Ridge), seamounts (>1000 m elevation), plateaus, canyons and ravines. Here, the deep-sea area under consideration was defined as all the seabed of the continental slope and the abyss belonging to the NECS and represents a total surface of 1 231 981 km² (Figure 1).
2.2 - Identification of priority areas for protection
2.2.1 - Conservation targets for priority areas
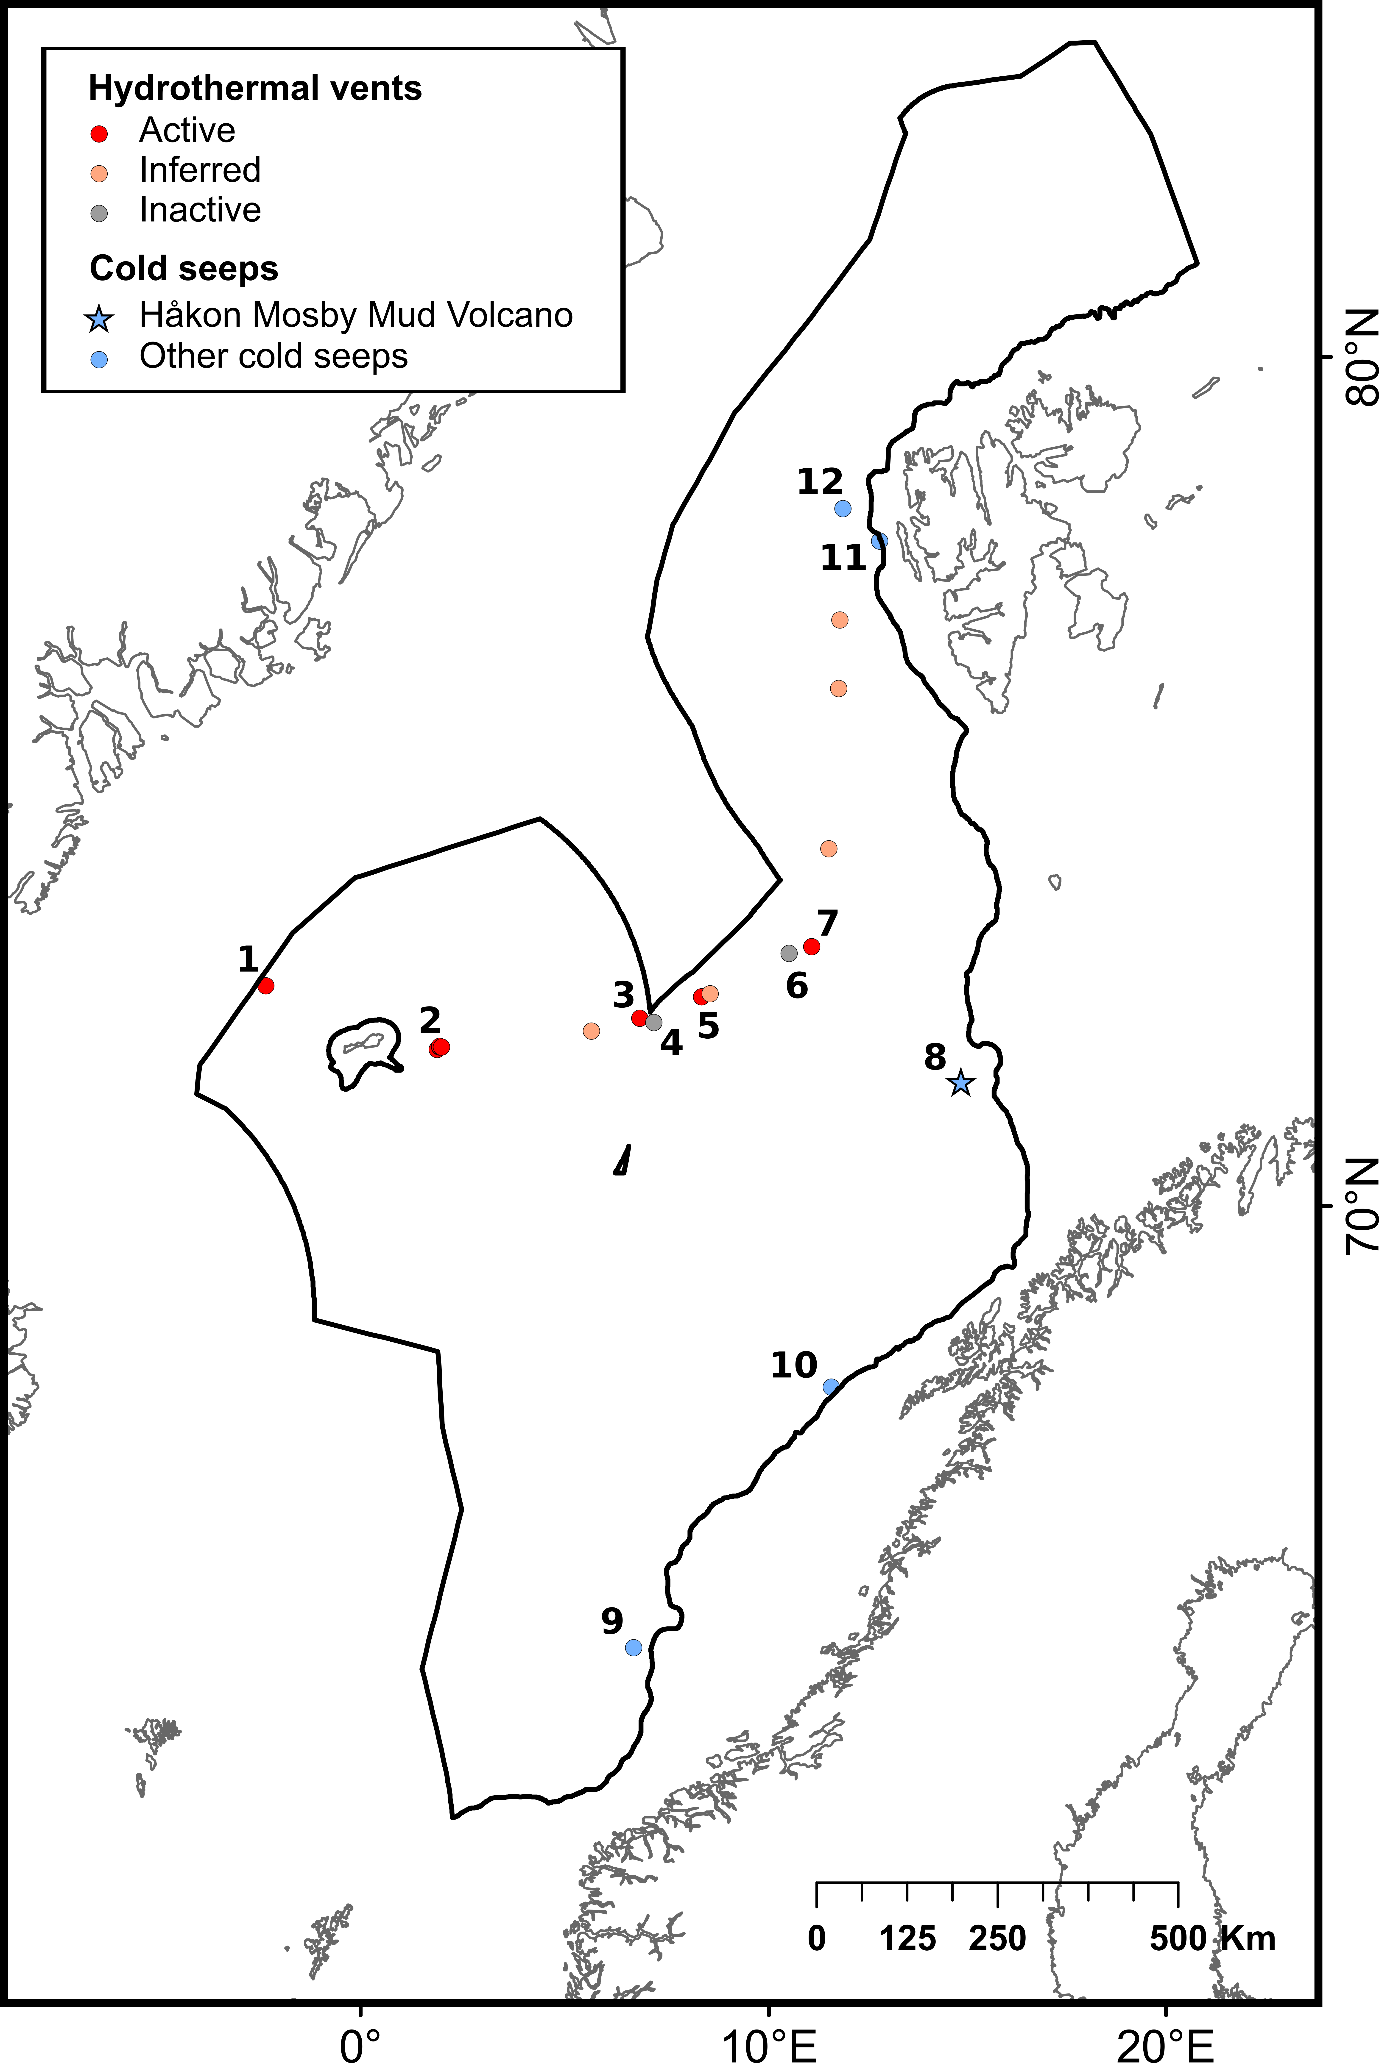
The selection of priority areas was based on different characteristics, such as their uniqueness or rarity; special importance for life-history stages of species; importance for threatened, endangered or declining species and/or habitats; vulnerability, fragility, sensitivity or slow recovery, structural complexity; biological productivity; and diversity. The MPA network was designed to capture 100% of priority areas for protection, in this case comprising all known hydrothermal vents and cold seeps, hotspot communities of cold-water corals (CWC) and sponge aggregations, as well as one species of Siboglinidae worm (Sclerolinum consortum) assessed as vulnerable on the Norwegian Red List of Species. Cold-water corals and deep-sea sponges are generally characterized by long lives, slow growth and irregular recruitment, all of which contribute to slow recovery of damaged habitats. They form habitats that are utilized by other species, thereby contributing to increased biodiversity and productivity within the ecosystem7,8. Cold seeps and hydrothermal vents both host rare and unique communities of chemo-synthesizing microorganisms and invertebrates. All of these habitats are considered fragile and highly sensitive to physical disturbance7,8 .
2.2.2 - High Diversity or Abundance Areas (HDAA)
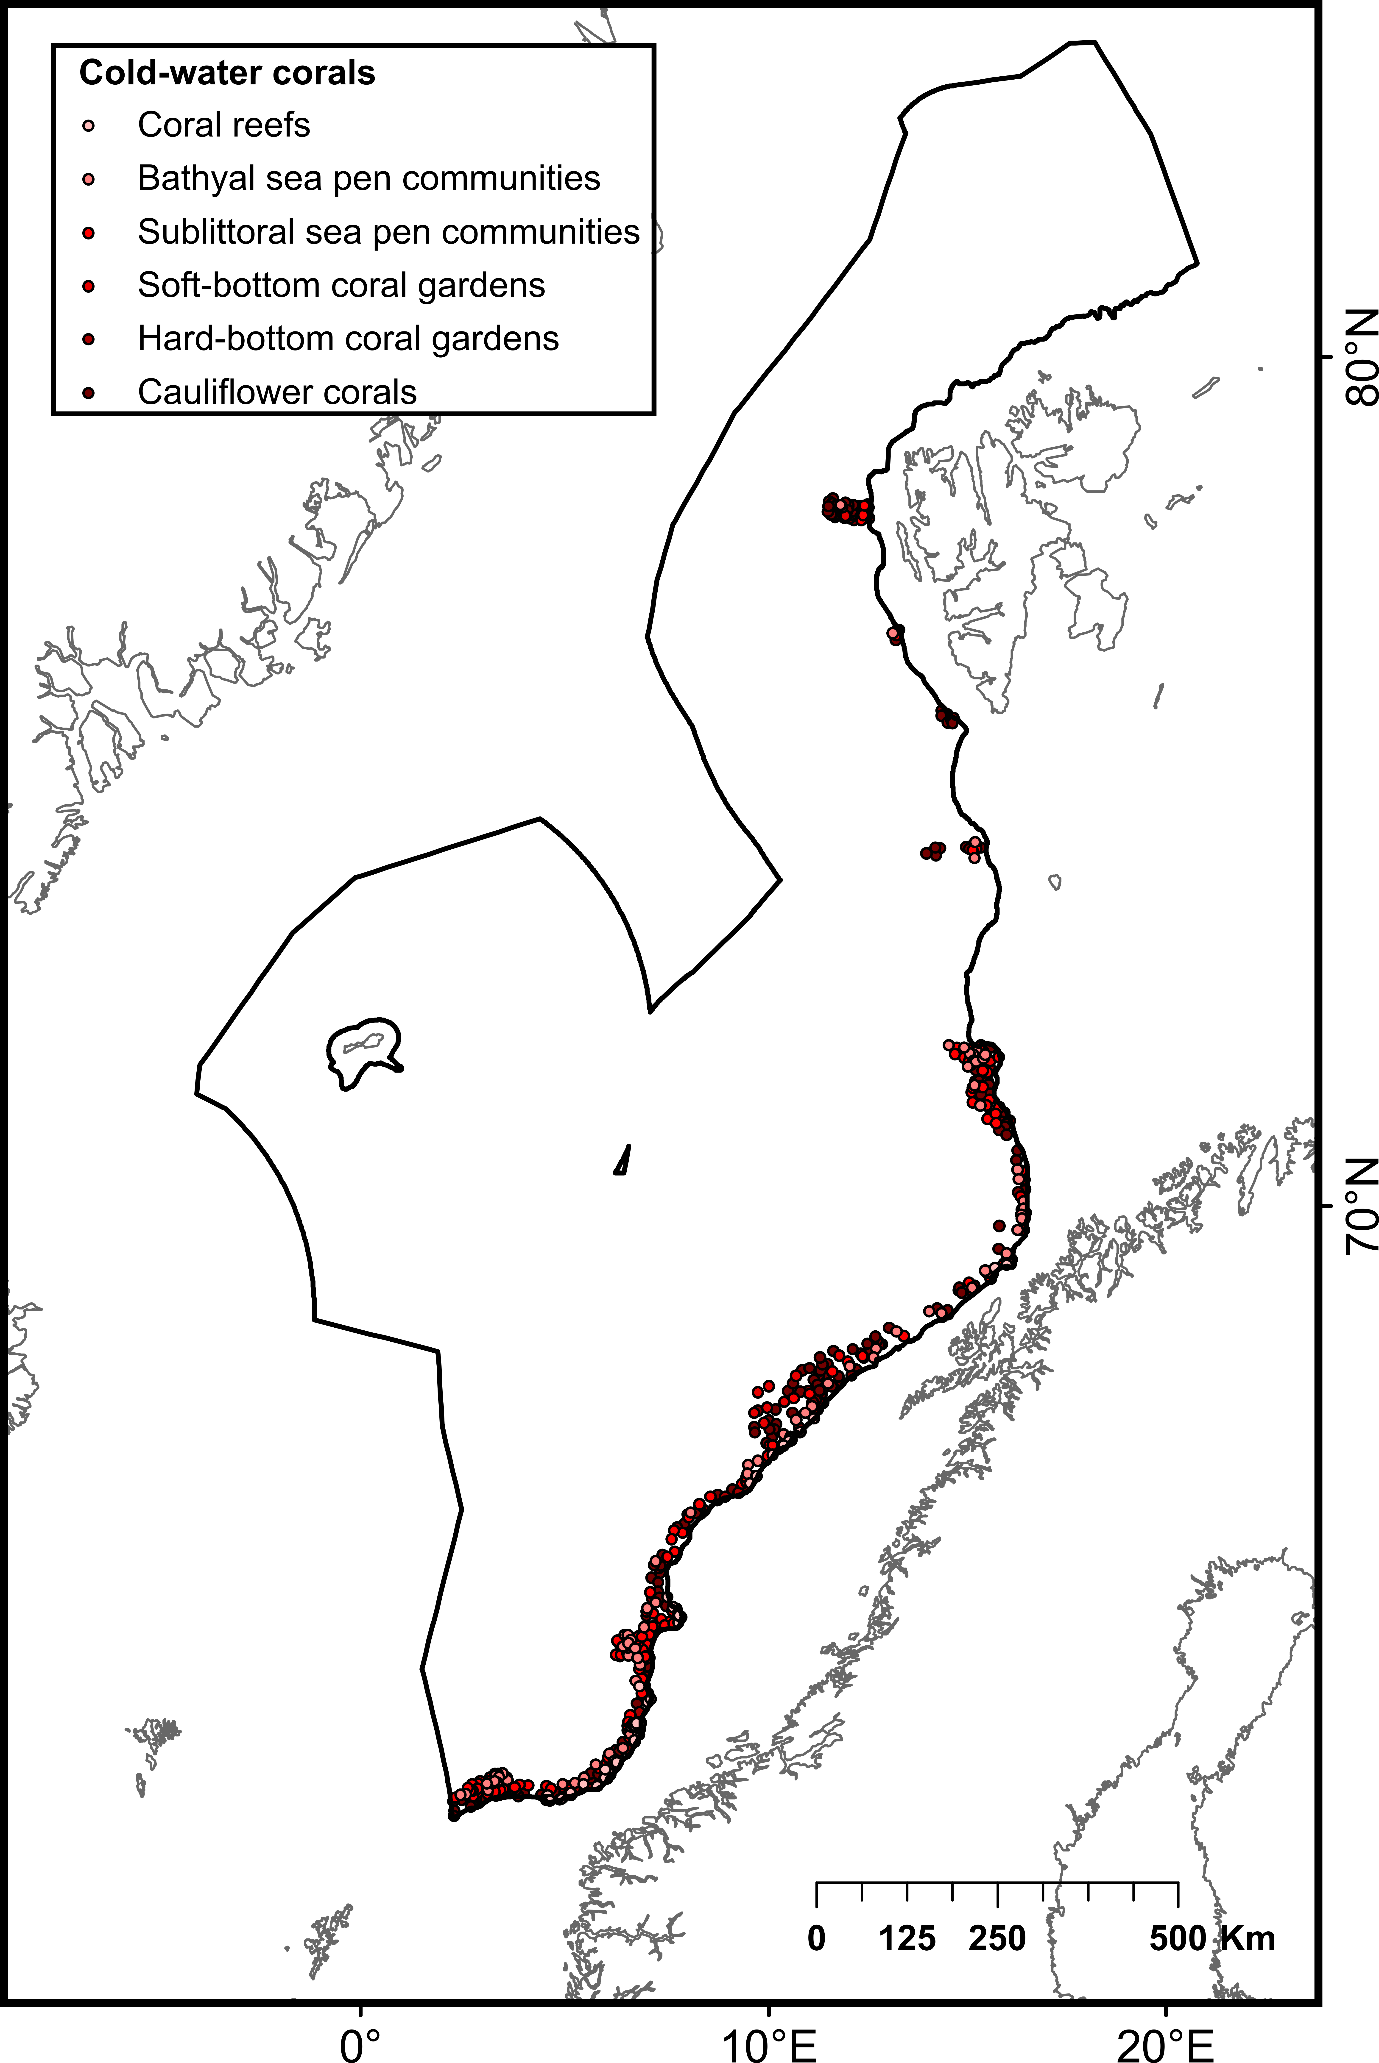
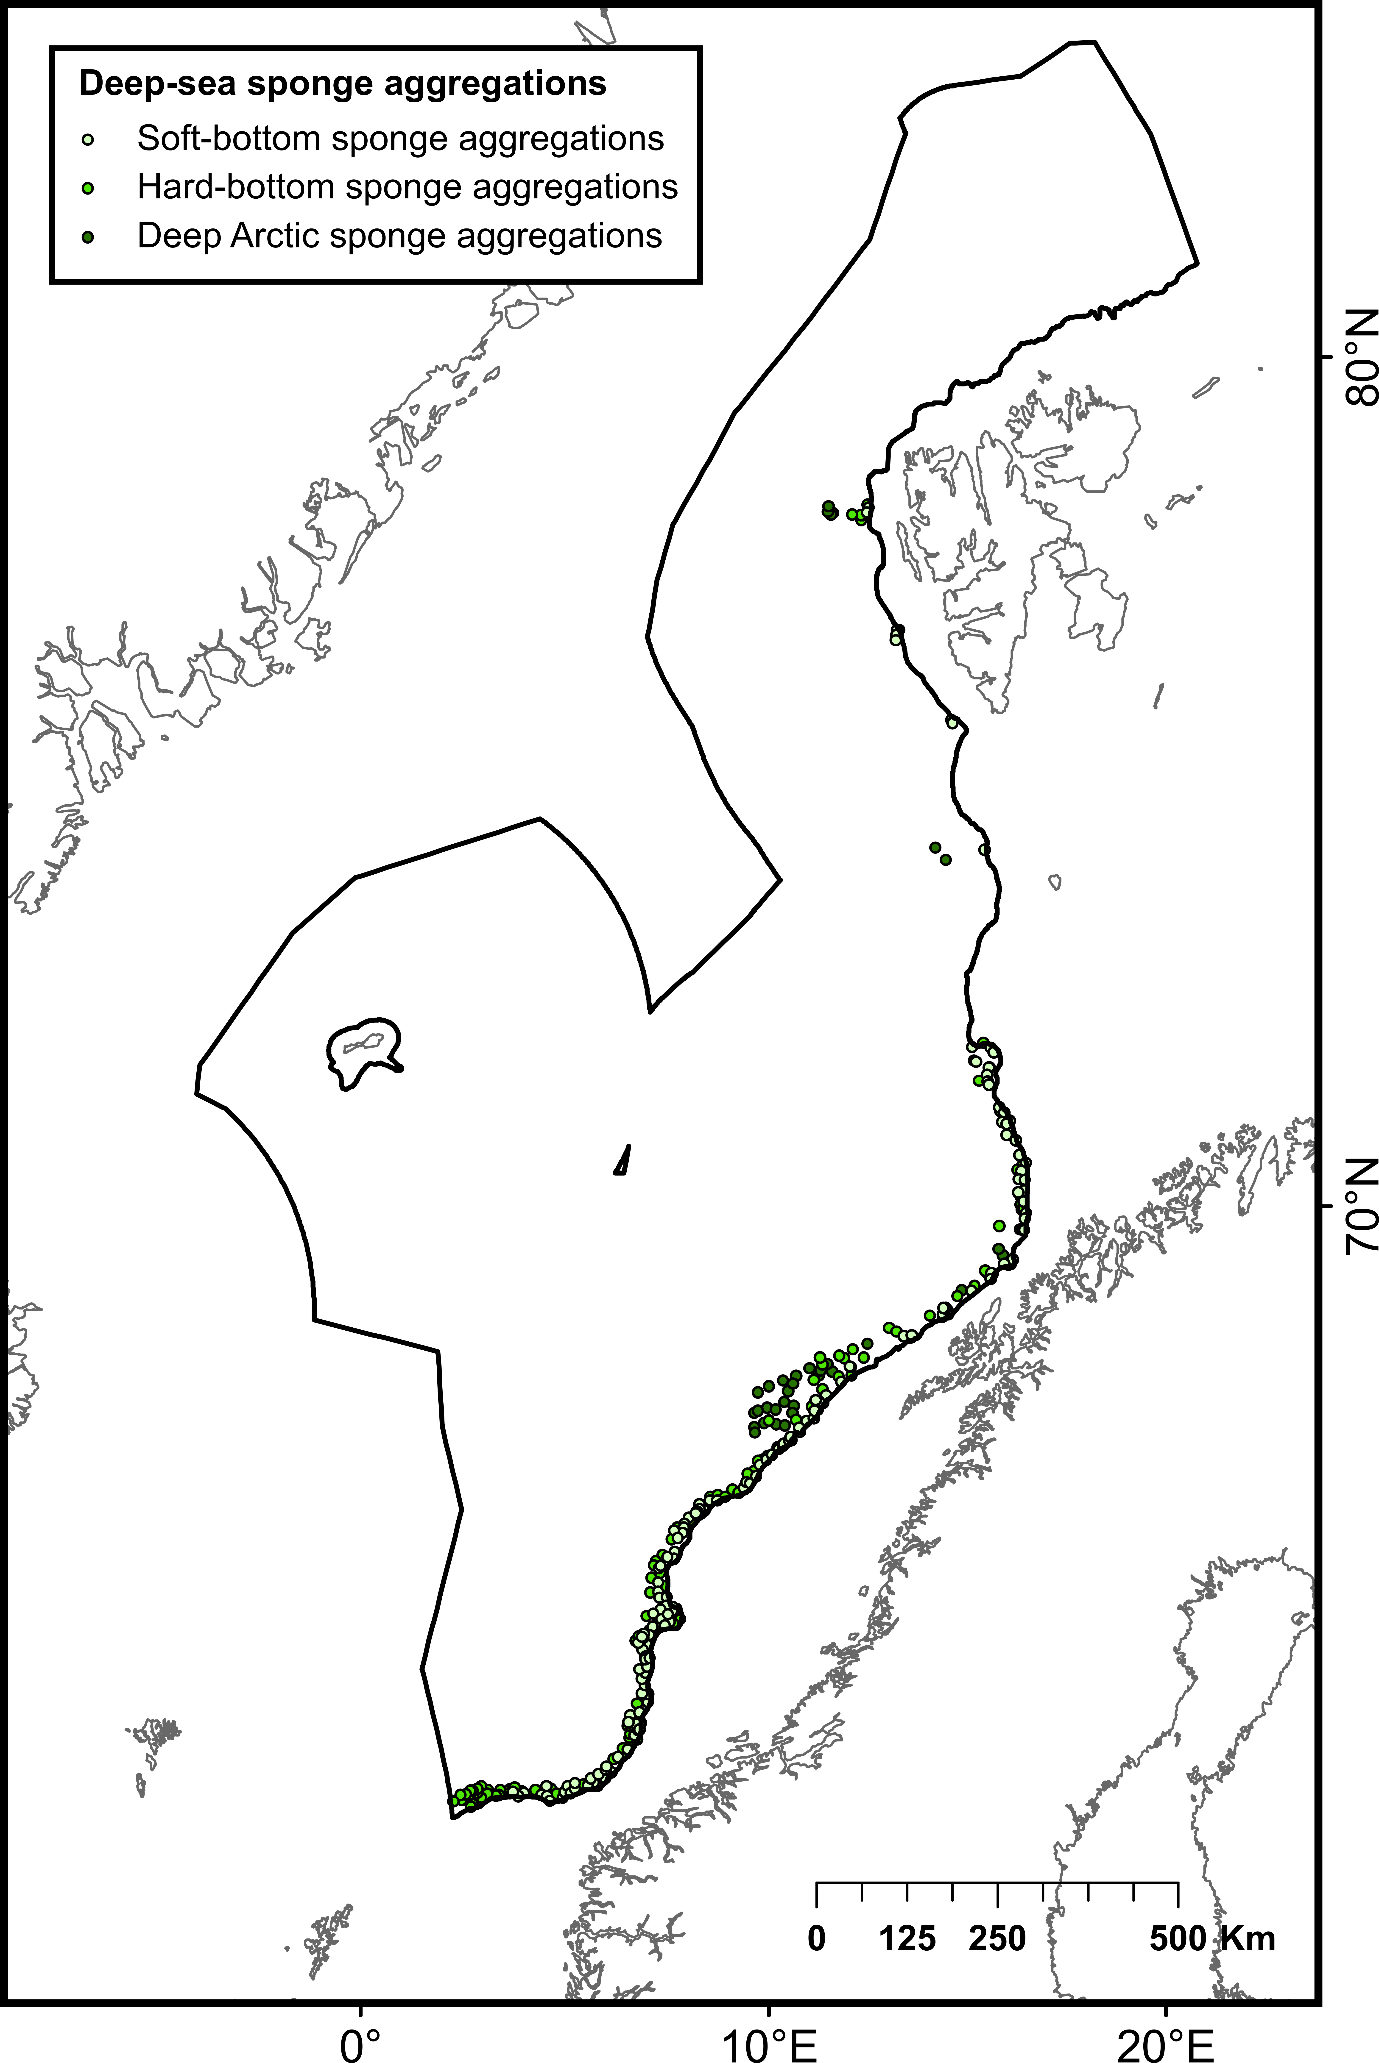
During the network design process, the protection of 100% of CWC and sponge aggregations challenged the representativity of the network due to the uneven distribution of these aggregations that may be partly compounded by uneven habitat mapping effort within the study area. Within Norwegian waters, some areas exhibited a high number of CWC and sponge observations, particularly in the southern part of the continental slope. Comparatively, fewer observations have been made in other locations, including deep-sea areas below the continental slope and the northernmost part of the continental slope (Figure 2). To date, most of research efforts to map CWC and sponges have focused on Norway’s continental slope (through the MAREANO program), leaving their distribution in the deep-sea areas below the continental slope and the northernmost part of the study area uncertain. Therefore, fewer CWC and sponge observations in these areas do not necessarily imply the absence of these habitats but may, in fact, be attributed to insufficient mapping data. Ensuring 100% protection of all recorded observations of CWC and sponges could lead to representativity and connectivity issues within the network, as data deficiencies in certain areas of the NECS will inevitably bias the results of conservation planning models.
To address this issue, diversity (number of coral and sponge habitat types) and abundance (number of CWC and sponge observations) criteria were used to define high-diversity or abundance areas (HDAAs) of CWC and sponge aggregations. High-diversity areas were defined as locations containing four or more CWC and sponge aggregation types per 100 km² (Figure 2A), while high-abundance areas are locations with more than 40 observations of CWC and sponge aggregations per 100 km² (Figure 2B). Consequently, CWC and sponge HDAAs received full protection when designing the MPA network. CWC and sponges not included in HDAAs were considered as part of low-diversity and abundance areas (LDAAs) and were protected according to general conservation targets (30%, 40% or 50%, depending on the chosen scenario). Finally, CWC and sponges not included in the MPA network were subjected to specific conservation rules, presented below (cf. §3.3).
2.3 - Identification of features and areas not classified as priorities
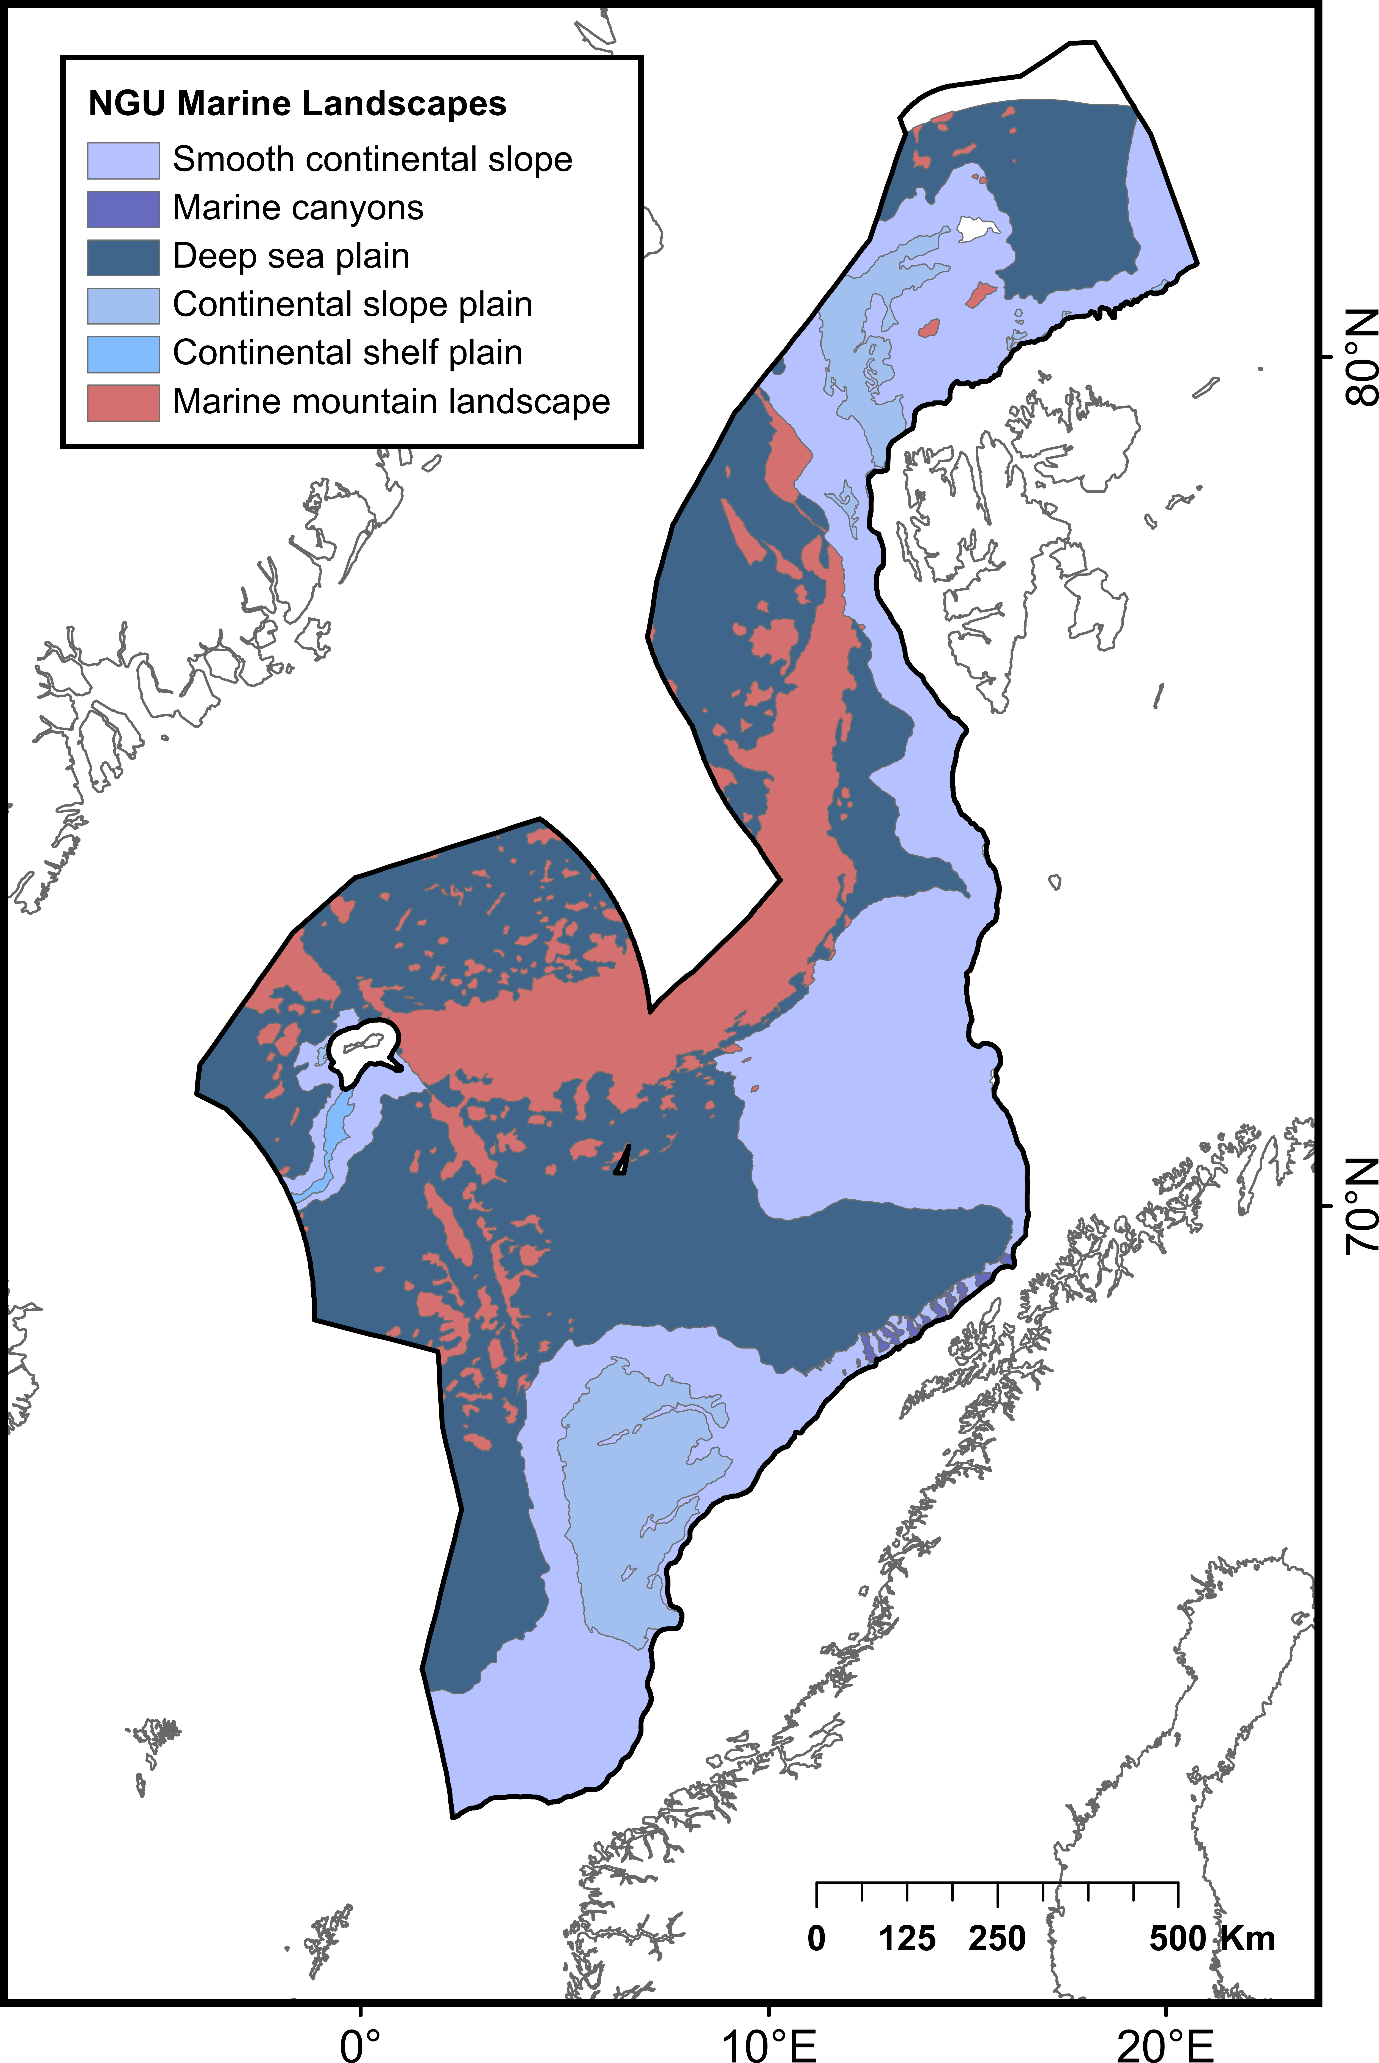
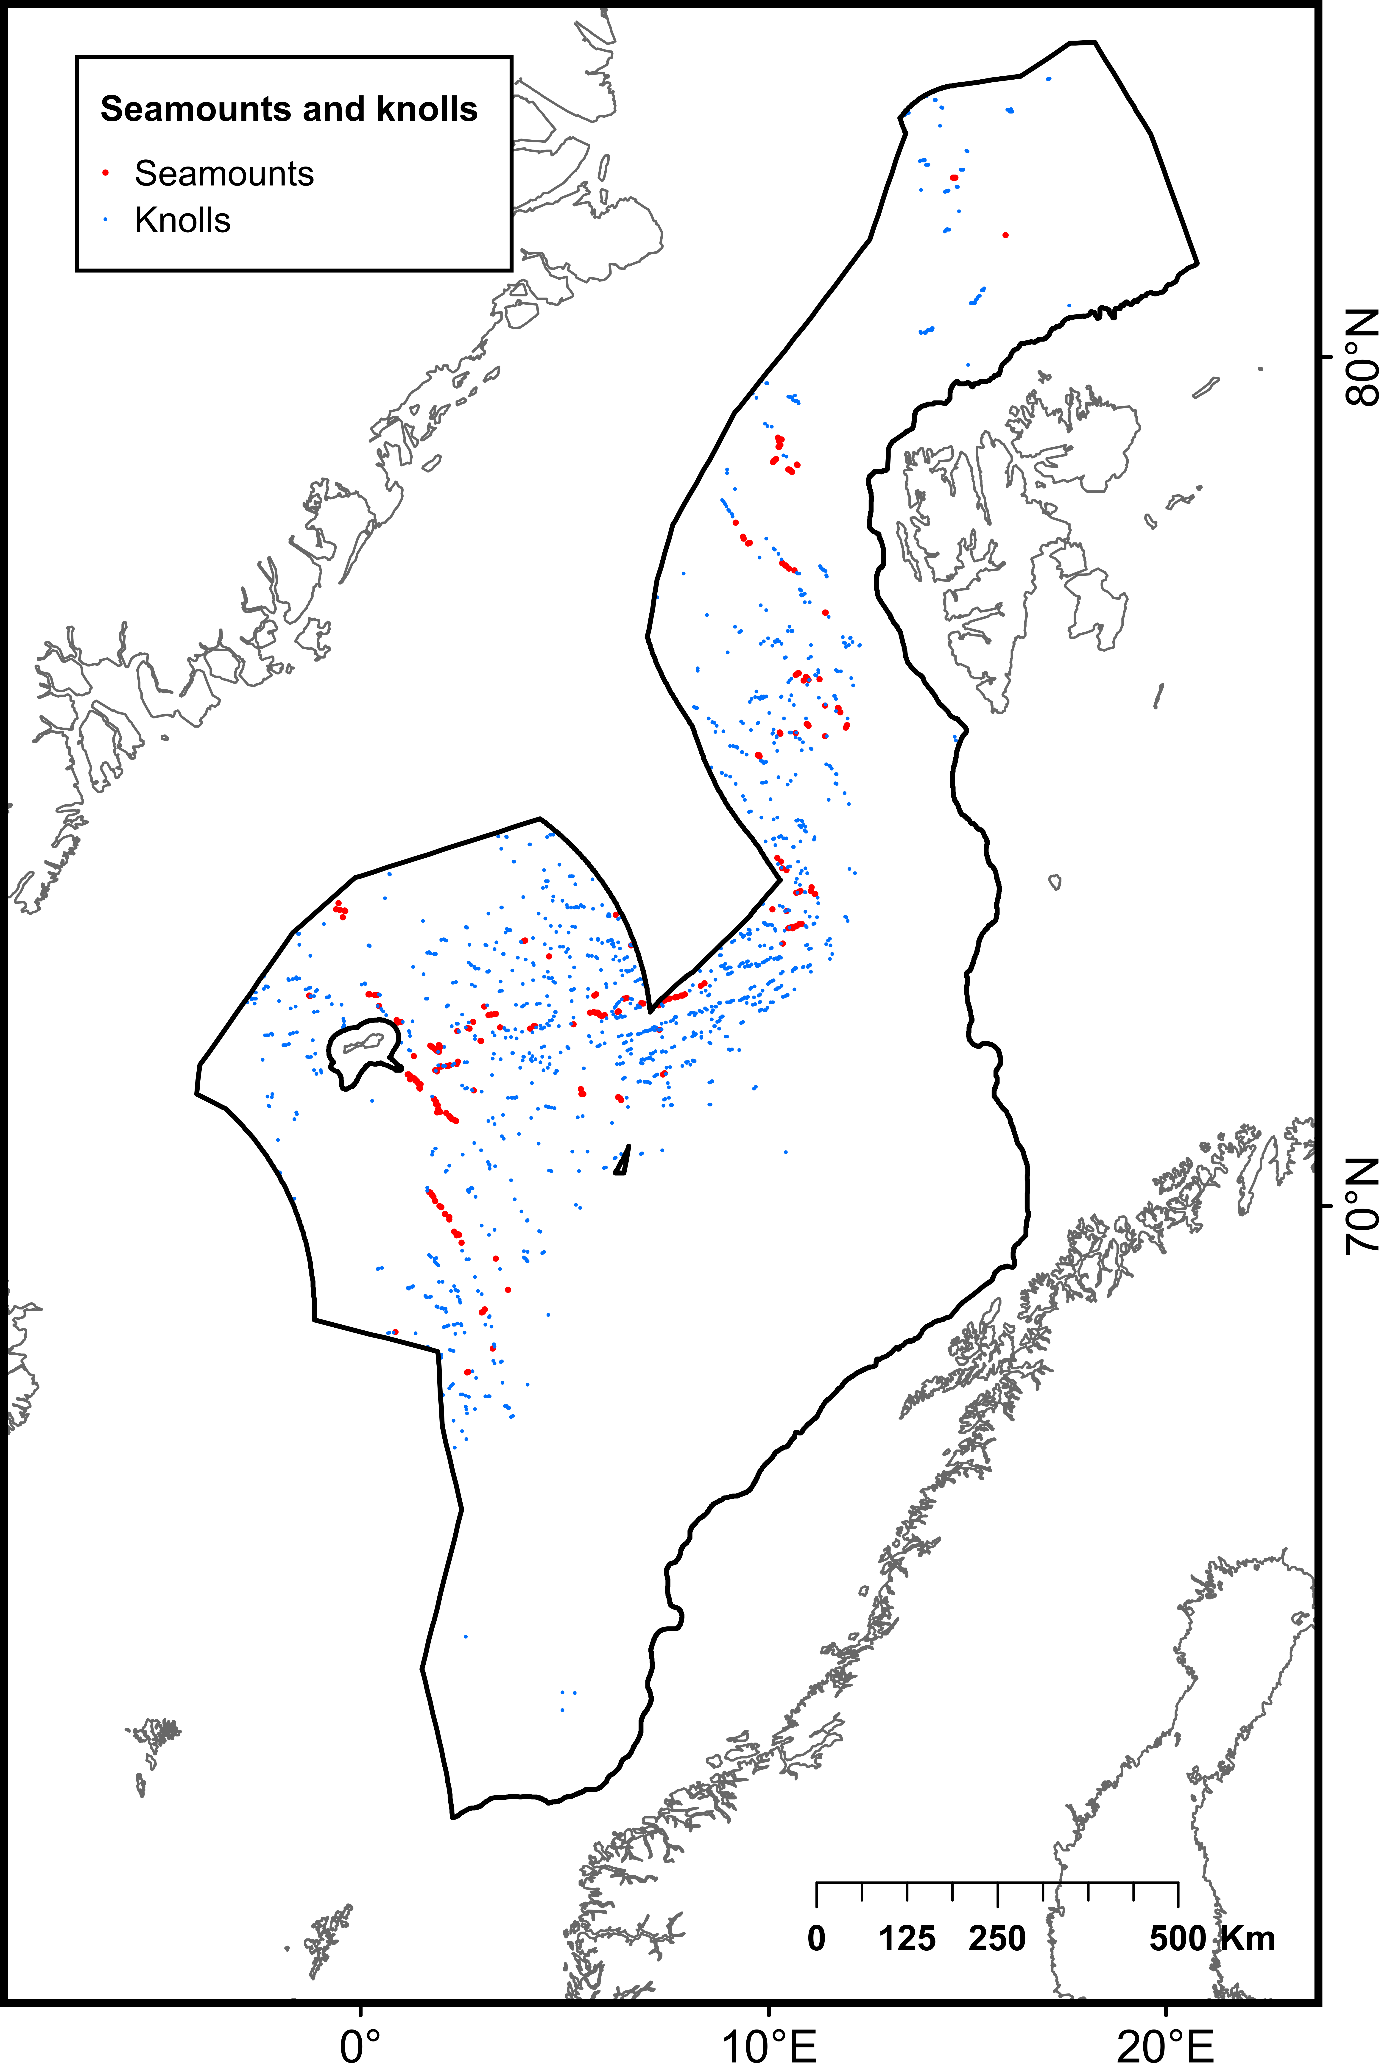
The NECS encompasses several biogeographic provinces55, marine landscapes (as defined by the Geological Survey of Norway; NGU), and geomorphic features22, which are not considered here as priority areas for protection (Appendix). These areas and features are characterized by different environmental conditions (temperature, substrate, depth, etc.) that interact and affect species distribution. The fundamental niche represents all the environmental conditions under which a species can establish, survive and reproduce. Collecting information on the fundamental niche therefore informs on the potential distribution area of a species, which may be close to the actual species distribution.
Hence, protecting known fundamental niches is recognized as a useful strategy to ensure that representative habitats are protected in areas lacking data56. During the network design process, features and areas not classified as priorities were protected according to general conservation targets (30%, 40% or 50%, depending on the chosen scenario).
2.4 - MPA network design
The MPA network was designed using the conservation planning software Marxan53,54. The design process relied on the consideration of five network criteria, identified by the CBD1,2. Priority Areas for Protection, Representativity, Replication, Connectivity, and Adequacy and Viability (Table 1). In accordance with these criteria, we evaluated different scenarios of MPA networks, protecting 50%, 40% and 30% of the study area. For each scenario, the model tested a predefined number of potential solutions in each run (set at 100 by default), then used a scoring system to propose an optimized solution. It is important to emphasize that Marxan operates as a highly effective decision support tool, and its role is to assist in the decision-making process rather than make definitive decisions. In order to accommodate the complexities inherent in both the socioeconomic and ecological dimensions of the planning area, it is considered best practice to subject Marxan outputs to human oversight and to make adjustments when necessary.
|
Network properties and components |
Conservation targets for the MPA network |
|
Priority areas for protection |
The MPA network must protect 100% of identified priority areas, including hydrothermal vents, cold seeps, HDAAs of CWC and sponge aggregations and species assessed as vulnerable on the Norwegian Red List of Species.
Priority areas for protection are selected according to their:
|
|
Representativity |
The MPA network must consider the full range of features that occur in the study area.
30 to 50% protection is given to all features and areas not classified as Priority areas for protection (biogeographic provinces, geomorphic features, marine landscapes, seamounts, knolls, CWC and sponges not part of the HDAAs).
MPA units must be broadly distributed across the study area. |
|
Replication |
The MPA network must ensure that more than one example of each feature is protected to safeguard against unexpected, localized catastrophes. |
|
Connectivity |
The MPA network must ensure the exchange of individuals and genes between ecosystems and across the whole network. |
|
Adequacy & viability |
The MPA network must protect 30 to 50% of the study area.
MPA units must be big enough to sustain a viable population or community. The minimum targeted size is 100 km², as described in the NEOLI framework46.
The selection and protection of features should conform to scientific literature.
All MPA units must possess a buffer zone in their vicinity to protect core areas from indirect effects from human activities. |
3 - Proposition of a MPA network
3.1 - Selection of a network
A number of different MPA network scenarios were assessed protecting 50%, 40% and 30% of the study area. The 40% and 50 % scenarios were chosen following empirical evidence that 40-50% protection is the minimum coverage needed to fully protect the range of biodiversity3 and threatened species within a given area. The 30% protection scenarios were assessed as, in ratifying the COP15 Kunming-Montreal Global Biodiversity Framework1, Norway has committed to ecologically-coherent conservation of 30% of its ocean area by 2030 which will serve to mitigate further biodiversity loss in alignment with CBD objectives. The specific percentages of protection assigned to the different features in these scenarios are detailed in Table 2.
The first scenario presents an MPA network with a protection target of 50%. It covers 670 567 km², which represents 54% of the study area (Figure 3A). This network comprises 10 MPA units that range from 88 to 253 499 km² in size. The second MPA network was designed with a protection target of 40% (Figure 3B). This scenario is composed of 16 MPA units, ranging from 85 to 98 819 km², covering a total of 524 583 km², which represents 43 % of the study area.
Three different MPA network scenarios were generated to achieve a 30 % protection target within the study area (Figure 4):
-
The scenario 30%A (Figure 4A) consists of 16 MPA units ranging from 100 to 97 061 km². This scenario covers 467 721 km², which corresponds to 38% of the study area.
-
The scenario 30%B (Figure 4B) comprises 11 MPA units ranging from 100 to 160 828 km², covering a total of 509 351 km², which represents 41% of the study area.
-
The scenario 30%C (Figure 4C) encompasses 22 MPA units with sizes ranging from 85 to 77 242 km². These MPAs collectively cover 407 968 km², representing 33% of the study area.
While all three scenarios successfully achieved the minimum conservation targets for all features, scenario 30%B notably exceeded the required protection levels for several of them (e.g., fans +35%, rift valleys +44%, troughs +52%) (Table 2). Scenario 30%A also conferred substantial protection to numerous features, up to +30% for rift valleys (Table 2). Among these scenarios, the 30%C MPA network emerged as the most favorable, as it met the minimum conservation targets for nearly all features (except for the Barents Sea: -12%), and exhibited only a few features exceeding the conservation targets by more than 20% (Norwegian Coast: West Norway, sill, fans) (Table 2). All MPA scenarios presented herein were designed to represent the range of species, habitats and geomorphic features occurring in the study area in the best possible way. A primary objective was to prevent degradation and damage to species, habitats and ecological processes, adhering to the precautionary principle. Consequently, the implementation of MPA network scenario 30%C emerges as a suitable management strategy to curtail anthropogenic impacts on deep-sea benthic ecosystems. Further work using bio-physical modelling and network analysis to fully assess the connectivity between the suggested MPA network scenarios are, however, recommended before steps are taken for the implementation of an MPA network.
3.2 - Implementation of buffer zones
The drilling of offshore oil and gas wells and deep-sea mining are likely to generate high-turbidity, far-reaching and potentially toxic sediment plumes that can alter the structure and function of marine ecosystems33,36,57–59. In this context, buffer zones aiming to shield the core MPAs from the effects of sediment plumes generated by deep-sea industries in adjacent areas are commonly applied. This report introduces four different sizes of buffer areas: 1 km, 5 km, 10 km and 20 km surrounding each core MPA unit (Figure 5). The proposed buffer zones are based on the expected degree of impact from sediment plumes generated by deep-sea industries. The intent is to provide alternatives based on the current state of knowledge to facilitate informed decision-making in the implementation of these zones.
For the 30% C scenario, the inclusion of 1 km, 5 km, 10 km and 20 km buffer zones around each core MPA unit increased the coverage of the overall network area by 2%, 5%, 8% and 16%, respectively. Existing literature suggests that a 1 km buffer zone may be insufficient to adequately shield MPA core units from sediment plumes generated by deep-sea industries60,61. Conversely, 20 km buffer zones afford substantial protection to core areas, presenting a notably low risk of impact from sediment plumes. However, it is noteworthy that these buffer zones considerably increase the size of the MPA network beyond what has been determined necessary to mitigate impacts from sediment plumes on ecosystems within each MPA unit, and thus may not significantly increase the conservation value of the network compared to 10 km buffers. Uncertainty remains due to the lack of data regarding the impact of sediment plumes generated by deep-sea industries on benthic species and habitats. In light of these considerations, buffer zones between 5-10 km may represent an optimal alternative for mitigating most of the sedimentation risk without significantly increasing the size of MPA units. Pending further investigations into the behavior of sediment plumes generated by deep-sea industries and their impact on marine ecosystems, the implementation of a 10 km buffer zone around each MPA unit is recommended as a precautionary measure. This would expand the MPA network coverage to 528 128 km², with 510 199 km² situated within the study area (covering 41% of the study area). Notably, since some MPA core units are situated along the perimeter of the NECS, 17 929 km² of buffer zones extend beyond the study area (for the 10 km buffer zone). In these instances, Norwegian sovereignty would not apply. Nonetheless, their consideration is deemed essential to ensure that deep-sea activities conducted outside of the study area (including those on the continental shelf of other sovereign nations, in ABNJ or within the Norwegian shelf) do not impact the MPA core units situated within the NECS.
|
Classification |
Feature name |
Percentage protected per scenario (within core MPA units) |
||||
|
50% |
40% |
30%A |
30%B |
30%C |
||
|
Area of interest |
NECS |
54 |
43 |
38 |
41 |
33 |
|
Abyss |
54 |
42 |
37 |
40 |
32 |
|
|
Slope |
56 |
47 |
45 |
52 |
39 |
|
|
Biogeographic zones |
Arctic biogeographic region >1000m |
54 |
41 |
36 |
40 |
32 |
|
Norwegian Coast: West Norway |
36 |
84 |
82 |
70 |
75 |
|
|
Barents Sea |
38 |
21 |
35 |
42 |
18 |
|
|
S-E Greenland-N. Iceland Shelf |
55 |
83 |
26 |
33 |
25 |
|
|
High Arctic Maritime |
52 |
31 |
35 |
45 |
43 |
|
|
Geomorphic features |
Basins |
50 |
40 |
30 |
31 |
31 |
|
Submarine canyons |
59 |
59 |
42 |
43 |
38 |
|
|
Escarpments |
62 |
47 |
40 |
42 |
34 |
|
|
Fans |
75 |
40 |
30 |
65 |
54 |
|
|
Plateaus |
59 |
54 |
37 |
51 |
31 |
|
|
Ridges |
54 |
55 |
41 |
30 |
38 |
|
|
Rift valleys |
74 |
58 |
60 |
74 |
30 |
|
|
Rises |
66 |
43 |
41 |
37 |
34 |
|
|
Sills |
67 |
41 |
50 |
67 |
57 |
|
|
Mid-ocean spreading ridges |
70 |
61 |
48 |
54 |
31 |
|
|
Terraces on the continental slope |
62 |
52 |
50 |
63 |
30 |
|
|
Troughs |
86 |
63 |
30 |
82 |
33 |
|
|
Smooth continental slope |
58 |
42 |
43 |
51 |
39 |
|
|
Marine canyons |
83 |
71 |
34 |
61 |
33 |
|
|
Deep sea plain |
50 |
40 |
31 |
30 |
30 |
|
|
Continental slope plain |
61 |
54 |
54 |
61 |
30 |
|
|
Continental shelf plain |
76 |
83 |
30 |
36 |
32 |
|
|
Marine mountain landscape |
60 |
46 |
42 |
46 |
30 |
|
|
Seamounts |
62 |
52 |
55 |
32 |
37 |
|
|
Knolls |
57 |
48 |
39 |
49 |
30 |
|
|
Hydrothermal vents |
100 |
100 |
100 |
100 |
100 |
|
|
Cold seeps |
100 |
100 |
100 |
100 |
100 |
|
|
Biogenic habitats |
CWC and sponge HDAAs |
100 |
100 |
100 |
100 |
100 |
|
CWC and sponge LDAAs |
90 |
84 |
87 |
90 |
87 |
|
|
Deep arctic sponge aggregation |
97 |
50 |
74 |
91 |
94 |
|
|
Hard-bottom sponge garden |
90 |
88 |
89 |
93 |
90 |
|
|
Soft-bottom sponge garden |
89 |
88 |
87 |
83 |
88 |
|
|
Deep-sea sea pen communities |
95 |
88 |
88 |
93 |
87 |
|
|
Sublittoral sea pen communities |
95 |
93 |
93 |
89 |
91 |
|
|
Hard-bottom coral garden |
99 |
100 |
99 |
100 |
100 |
|
|
Soft-bottom coral garden |
100 |
51 |
75 |
100 |
75 |
|
|
Cold-water coral reefs |
99 |
99 |
99 |
99 |
99 |
|
|
Nephtheidae meadow |
87 |
78 |
84 |
89 |
81 |
|
|
Vulnerable species on the Norwegian Red List of Species (Sclerolinum contortum) |
100 |
100 |
100 |
100 |
100 |
|
3.3 - Considerations for features outside the MPA network
3.3.1 - CWC and sponge aggregations
In the 30%C scenario, all CWC and sponge aggregations encompassed within HDAAs were included in the MPA network. Additionally, the MPA network and its 10 km buffer zone comprise 92% of CWC and sponge aggregations not classified as HDAAs, with the remaining 8% of these located outside of the MPA network. Though excluded from the network by the model, we argue that these aggregations are nonetheless ecologically important and recommend that no activity that could result in their total or partial destruction should be permitted near their location. The management approach will require in-depth investigations conducted on a case-by-case basis to evaluate the potential risks of impact from deep-sea industries on CWC and sponge aggregations.
3.3.2 - New discoveries
The present MPA network proposal is grounded in the available knowledge as of the time of this report’s writing. It is essential to acknowledge that the diversity of deep-sea species and ecosystems in the Nordic Seas remains only superficially surveyed, with the majority of these lacking detailed mapping of the seafloor. The application of predictive models to forecast the distribution of unique benthic species and habitats can contribute to the identification of areas where they are likely to be found and guide targeted sampling and conservation efforts24 . Both ongoing and forthcoming research initiatives are expected to enhance our knowledge of the distribution and ecological functioning of deep-sea benthic species and habitats within the study area. Therefore, the implementation of adaptive management practices will be essential. During exploration activities, conducted by research programs or by deep-sea industries alike, the discovery of new deep-sea species or ecosystems that fall within the realm of priority areas for protection (e.g., hydrothermal vents, cold seeps, HDAAs for CWC and sponge aggregations) may warrant adjustments of the management plan or MPA design. The discovery of CWC and sponge aggregations of low diversity and abundance should be assessed on a case-by-case basis. In the event of a significant discovery of species or ecosystems classified as priority areas for protection due to their rarity, a reevaluation of their status will be necessary. New discoveries of high significance may necessitate a reassessment of the MPA network design to optimize its efficiency to conserve deep-sea benthic biodiversity and ecosystem functions. Local discoveries made outside the proposed network could be integrated as small MPA units in the network.
4 - Implications of network implementation
Here, we presented the outline for a network of MPAs serving to conserve unique and representative deep-sea benthic species and habitats in the NECS, following internationally-aligned and applied principles. The call for the implementation of such a network is timely. The recent ratification of the 2022 Global Biodiversity Framework, calling on nations to halt biodiversity losses by accelerating the establishment of MPAs and implementing OECMs in their waters, has catalyzed the need for Norway to scrutinize available knowledge to identify priority areas for protection. Furthermore, the existing request from the government to parliament to open the Norwegian shelf for deep-sea mining has raised significant concern regarding its potential impacts on deep-sea benthic habitats. The establishment of an MPA network would serve as a precautionary approach to environmental management in the face of the many uncertainties attached to deep sea mining development. This is a critical and responsible step as the deep-sea mining industry is still in the early stages of development, and knowledge of the severity and spatial extent of mining impacts (i.e., dispersal of sediment plumes, sensitivity of ecologically relevant species) remains limited.
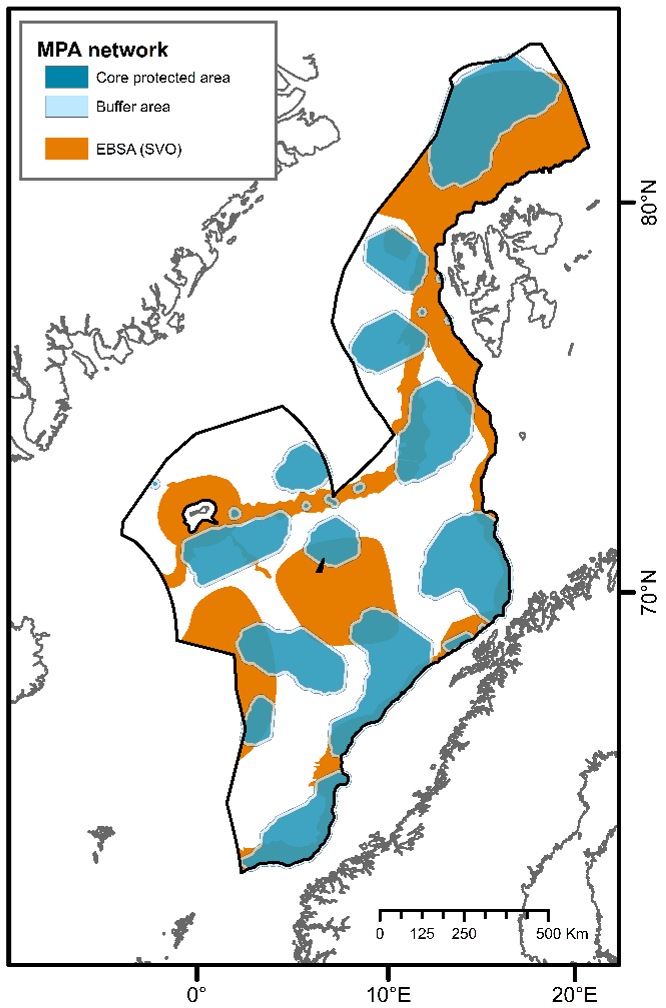
A recent report has identified Ecologically and Biologically Significant Areas (EBSAs; referred to as “Særlig Verdifulle og Sårbare Områder” (SVOs) in Norwegian) for Norway’s management plan areas7. EBSAs represent special areas in the ocean that serve important purposes, in one way or another, to support the healthy functioning of oceans and the many services that it provides2. EBSAs and MPAs have similar selection criteria, defined by the CBD7, but differ in terms of their legal protection framework. While EBSAs are mainly strategic and advisory, highlighting the importance of showing particular care in these areas7, MPAs represent a regulatory tool that restricts or prohibits human activities2. Together they represent valuable and complementary management tools aimed at ensuring the maintenance of ecosystems diversity and functioning. For instance, the selection of EBSA in deep-sea habitats can guide the identification of marine areas in need of protection2. In their report, Eriksen et al. (2021) identified EBSAs by considering benthic and pelagic species and ecosystems, as well as observed and predicted species/habitats distributions. Here, the MPA network was designed solely based on observed and/or measured data of benthic species and habitats, falling under Norway’s jurisdiction. Considering only EBSAs that serve important purposes to support the healthy functioning and services of benthic communities (NH1 and NH2 excluded) and lie within the study area of the present report, these areas cover approximately 540,000 km² (Figure 6). Our aim is for the proposed MPA network to complement the previous EBSA work and contribute to more efficient conservation of biodiversity and ecological functioning in the deep Nordic Seas.
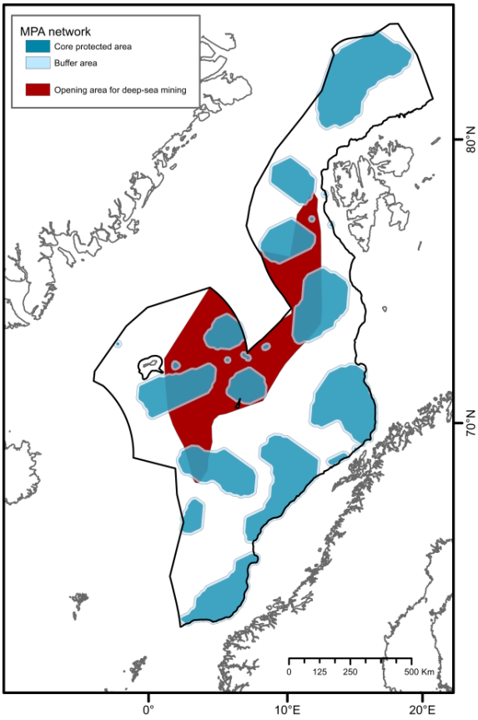
The design of the proposed MPA network is based on the reported importance of known species and habitats (identifying priority areas for protection) as well as representativity, replication, adequacy and viability criteria. Through a comparative assessment of different MPA network scenarios, one is recommended (30%C; Figure 4C) comprising 22 MPA units and covering 33% of the study area. This scenario encompasses 35% of EBSAs that serve important purposes to support the healthy functioning and services of benthic communities in the study area. This network meets the conservation targets for all specified geomorphic features, seascapes, and biogenic habitats identified in deep waters of the Nordic Seas, without significant overrepresentation (see Table 2). It protects 100% of all known active and inactive hydrothermal vents and cold seeps, and 100% of the areas defined as coral and sponge hotspots. Further, the implementation of 10 km buffer zones is recommended to minimize the impacts of particulate matter and contaminants on core areas, placing restrictions for industrial activities. With 10 km buffer zones, the 30%C scenario covers 41% of the study area, and approximately 33% of the proposed area for commercial mineral exploration and extraction42 (Figure 6). Comparatively, about 44% of the planning area of the Clarion-Clipperton Zone (CCZ) in the Pacific Ocean, where hydrocarbon mining is expected to take place, has been reserved through a network of 13 protected areas (i.e., Areas of Particular Environmental Interest) by the International Seabed Authority as part of their spatial management plan for the CCZ66. The 30%C scenario and its 10 km buffer zones also encompasses 43% of EBSAs that serve important purposes to support the healthy functioning and services of benthic communities in the study area.
Studies from the CCZ have demonstrated that it is vital that MPAs are established before licenses for industrial activities are granted in order to afford sufficient protection to all targeted habitat types within the study area. If not, there is a risk that MPAs may not sufficiently protect all targeted habitats representatively67,68,69 or that some habitats may not be protected at all, increasing the probability of biodiversity loss and species extinctions44. Without careful consideration and reevaluation of the spatial management plan of deep waters of the Nordic Seas, Norway may well fail to meet key goals in the COP15 Kunming-Montreal Global Biodiversity Framework. These goals include halting human induced extinction of known threatened species, reducing the global species extinction rate tenfold by 2050, restoring the abundance of native species to healthy and resilient levels, and ensuring the sustainable use and management of marine natural resources so that humans can continue to rely on ecosystem functions for generations to come.
Beyond the already mentioned benefits, the establishment of this deep-sea MPA network would also ensure that Norway meets its commitment to assist the OSPAR Commission in reaching its conservation target for the Arctic Waters (OSPAR region I). The Northeast Atlantic Environment Strategy (NEAES) goal for OSPAR member states (which includes Norway) is to further develop the OSPAR MPA network in the northeast Atlantic so that representative MPAs and OECMs cover at least 30% of the OSPAR maritime area by 2030. As of October 2021, the OSPAR Network of MPAs included 583 MPAs, covering 11% of the OSPAR Maritime Area, with a total surface area of 1 490 552 km². Arctic Waters (Region I) have the lowest protection rates by far with just 2% MPA coverage. The acceptance of the network proposed herein would substantially contribute to the NEAES objective of increasing the MPA network cover of the OSPAR maritime area to a total of 1 898 520 km2 (i.e., 14% of the OSPAR maritime waters) and to 515 814 km2 (i.e., 9%) for Arctic Waters (OSPAR region I).
We expect that this knowledge review and the spatial analysis presented here will serve as a meaningful contribution to the discussion on how Norway should approach meeting its COP15 30x30 conservation commitments. Timely discussion of the conservation and protection needs of deep waters of the Nordic Sea would significantly strengthen Norway’s reputation as a nation driving both the development and the implementation of knowledge-based management of marine resources and ecosystems. Still, given the current lack of knowledge regarding the distribution, structure and functioning of deep-sea benthic ecosystems of the NECS8, we strongly recommend an intensified research and mapping effort over the next decade. This initiative should align closely with the government's plans to develop a comprehensive strategy for establishing a MPA network. This would improve the ability for informed management decisions in the NECS to be made, both in terms of conservation and development planning.
5 - References
1. CBD. COP 15 Decision 15/4. Kunming-Montreal Global Biodiversity Framework. 15 https://www.cbd.int/decisions/cop/?m=cop-15 (2022).
2. CBD. COP 9 Decision IX/20. Marine and coastal biodiversity. 12 https://www.cbd.int/decision/cop/?id=11663 (2008).
3. Jefferson, T., Costello, M. J., Zhao, Q. & Lundquist, C. J. Conserving threatened marine species and biodiversity requires 40% ocean protection. Biological Conservation 264, 109368 (2021).
4. Glover, A. G. & Smith, C. R. The deep-sea floor ecosystem: current status and prospects of anthropogenic change by the year 2025. Envir. Conserv. 30, 219–241 (2003).
5. Roberts, C. M. Deep impact: the rising toll of fishing in the deep sea. Trends in Ecology & Evolution 17, 242–245 (2002).
6. Kutti, T. et al. Pelagiske økosystem i De nordiske hav | Havforskningsinstituttet: grunnlagsstudie knyttet til åpningsprosess for utforskning og utvinning av havbunnsmineraler på norsk kontinentalsokkel. 129 (2021).
7. Eriksen, E., van der Meeren, G. I., Nilsen, B. M., von Quillfeldt, C. H. & Johnsen, H. Particularly valuable and vulnerable areas (SVO) in Norwegian seas - Environmental values. (2021).
8. Pedersen, R. B. et al. Fagutredning mineralressurser i Norskehavet landskapstrekk, naturtyper og bentiske økosystemer. https://www.npd.no/globalassets/1-npd/fakta/havbunnsmineraler/fagutredning-mineralressurser-norskehavet-naturforhold-uib.pdf (2021).
9. Anonymous. The Norwegian North-Sea expedition. Nature 28, 348–350 (1883).
10. Nørrevang, A., Brattegard, T., Josefson, A. B., Sneli, J. A. & Tendal, O. S. List of BIOFAR stations. Sarsia 79, 165–180 (1994).
11. Steingrímsson, S. A., Guðmundsson, G. & Helgasson, G. V. Contribution from the BIOICE programme: Benthic invertebrates of Icelandic Waters. 1–5 (2020).
12. Meißner, K., Brix, S., Halanych, K. M. & Jażdżewska, A. M. Preface—biodiversity of Icelandic waters. Marine Biodiversity 48, 715–718 (2018).
13. Fossum, T. O. et al. Information-driven robotic sampling in the coastal ocean. J Field Robotics 35, 1101–1121 (2018).
14. Ramirez-Llodra, E. et al. Benthic communities on the Mohn’s Treasure mound: Implications for management of seabed mining in the Arctic Mid-Ocean Ridge. Front. Mar. Sci. 7, 490 (2020).
15. Meyer, H. K., Roberts, E. M., Rapp, H. T. & Davies, A. J. Spatial patterns of arctic sponge ground fauna and demersal fish are detectable in autonomous underwater vehicle (AUV) imagery. Deep Sea Research Part I: Oceanographic Research Papers 153, 103137 (2019).
16. Ludvigsen, M. et al. Network of heterogeneous autonomous vehicles for marine research and management. in 1–7 (2016). doi:doi: 10.1109/OCEANS.2016.7761494.
17. Meyer, H. K. et al. Beyond the tip of the seamount: Distinct megabenthic communities found beyond the charismatic summit sponge ground on an arctic seamount (Schulz Bank, Arctic Mid-Ocean Ridge). Deep Sea Research Part I: Oceanographic Research Papers 191, 103920 (2023).
18. Buhl-Mortensen, L., Buhl-Mortensen, P., Dolan, M. F. J. & Holte, B. The MAREANO programme – A full coverage mapping of the Norwegian off-shore benthic environment and fauna. Marine Biology Research 11, 4–17 (2015).
19. Brix, S. et al. Habitat variability and faunal zonation at the Ægir Ridge, a canyon-like structure in the deep Norwegian Sea. PeerJ 10, e13394 (2022).
20. Clark, M. R. et al. The ecology of seamounts: Structure, function, and human impacts. Annu. Rev. Mar. Sci. 2, 253–278 (2010).
21. De Leo, F. C., Smith, C. R., Rowden, A. A., Bowden, D. A. & Clark, M. R. Submarine canyons: hotspots of benthic biomass and productivity in the deep sea. Proc. R. Soc. B. 277, 2783–2792 (2010).
22. Harris, P. T., Macmillan-Lawler, M., Rupp, J. & Baker, E. K. Geomorphology of the oceans. Marine Geology 352, 4–24 (2014).
23. Schlacher, T. et al. Richness and distribution of sponge megabenthos in continental margin canyons off southeastern Australia. Mar. Ecol. Prog. Ser. 340, 73–88 (2007).
24. Burgos, J. M. et al. Predicting the distribution of indicator taxa of Vulnerable Marine Ecosystems in the Arctic and Sub-arctic waters of the Nordic Seas. Front. Mar. Sci. 7, 131 (2020).
25. Morrison, K. M. et al. The first cut is the deepest: trawl effects on a deep-sea sponge ground are pronounced four years on. Front. Mar. Sci. 7, 605281 (2020).
26. Buhl-Mortensen, L. et al. Vulnerable marine ecosystems (VMEs). Coral and sponge VMEs in Arctic and sub-Arctic waters - Distribution and threats. (Nordic Council of Ministers, 2019). doi:10.6027/TN2019-519.
27. International guidelines for the management of deep-sea fisheries in the high seas. (FAO, 2009).
28. ICES. Report of the Workshop on Vulnerable Marine Ecosystem Database (WKVME), 10–11 December 2015. 42 (2016).
29. Victorero, L., Robert, K., Robinson, L. F., Taylor, M. L. & Huvenne, V. A. I. Species replacement dominates megabenthos beta diversity in a remote seamount setting. Scientific Reports 8, 4152 (2018).
30. Bravo, M. E. et al. Insights from the management of offshore energy resources: Toward an ecosystem-services based management approach for deep-ocean industries. Front. Mar. Sci. 9, 994632 (2023).
31. Ragnarsson, S. Á. et al. The impact of anthropogenic activity on cold-water corals. in Marine Animal Forests (eds. Rossi, S., Bramanti, L., Gori, A. & Orejas, C.) 1–35 (Springer International Publishing, 2017). doi:10.1007/978-3-319-17001-5_27-1.
32. Zhang, G. et al. Giant discoveries of oil and gas fields in global deepwaters in the past 40 years and the prospect of exploration. Journal of Natural Gas Geoscience 4, 1–28 (2019).
33. Marappan, S., Stokke, R., Malinovsky, M. P. & Taylor, A. Assessment of impacts of the offshore oil and gas industry on the marine environment. in OSPAR, 2023: The 2023 quality status report for the North-East Atlantic. 58 (OSPAR Commission, 2022).
34. Cordes, E. E. et al. Environmental impacts of the deep-water oil and gas industry: a review to guide management strategies. Front. Environ. Sci. 4, 58 (2016).
35. Fisher, C. R. et al. Coral communities as indicators of ecosystem-level impacts of the Deepwater Horizon spill. BioScience 64, 796–807 (2014).
36. Miller, K. A., Thompson, K. F., Johnston, P. & Santillo, D. An overview of seabed mining including the current state of development, environmental impacts, and knowledge gaps. Front. Mar. Sci. 4, 418 (2018).
37. Amon, D. J. et al. Climate change to drive increasing overlap between Pacific tuna fisheries and emerging deep-sea mining industry. npj Ocean Sustainability 2, 9 (2023).
38. Jaeckel, A. et al. Deep seabed mining lacks social legitimacy. npj Ocean Sustainability 2, 1 (2023).
39. Carreiro-Silva, M. et al. Mechanical and toxicological effects of deep-sea mining sediment plumes on a habitat-forming cold-water octocoral. Front. Mar. Sci. 9, 915650 (2022).
40. Hoel, A. H. et al. Other Effective Area-based Conservation Measures – OECMs: Andre effektive arealbaserte bevaringstiltak. 121 (2023).
41. Skern-Mauritzen, M. et al. Vurdering av fiskerireguleringer opp mot kriteriene for ‘Andre effektive områdebaserte bevaringstiltak’ som definert i Konvensjonen for biologisk mangfold. (2020).
42. Det Kongelege Olje- og Energidepartementet. Meld. St. 25 (2022–2023). Mineralverksemd på norsk kontinentalsokkel – opning av areal og strategi for forvaltning av ressursane. 82 (2023).
43. Brekke, H. et al. Deep sea minerals on the Norwegian continental shelf– Developments in exploration. (2021).
44. Niner, H. J. et al. Deep-sea mining with no net loss of biodiversity—an impossible aim. Frontiers in Marine Science 5, 1–12 (2018).
45. Dudley, N. Guidelines for applying protected area management categories. (IUCN, 2008). doi:10.2305/IUCN.CH.2008.PAPS.2.en.
46. Edgar, G. J. et al. Global conservation outcomes depend on marine protected areas with five key features. Nature 506, 216–220 (2014).
47. Gell, F. R. & Roberts, C. M. Benefits beyond boundaries: the fishery effects of marine reserves. Trends in Ecology & Evolution 18, 448–455 (2003).
48. Huvenne, V. A. I., Bett, B. J., Masson, D. G., Le Bas, T. P. & Wheeler, A. J. Effectiveness of a deep-sea cold-water coral Marine Protected Area, following eight years of fisheries closure. Biological Conservation 200, 60–69 (2016).
49. Johnson, D. et al. When is a marine protected area network ecologically coherent? A case study from the North-east Atlantic: OSPAR MPA NETWORK ECOLOGICAL COHERENCE CASE STUDY. Aquatic Conserv: Mar. Freshw. Ecosyst. 24, 44–58 (2014).
50. Agardy, T., di Sciara, G. N. & Christie, P. Mind the gap: Addressing the shortcomings of marine protected areas through large scale marine spatial planning. Marine Policy 35, 226–232 (2011).
51. Lausche, B. Guidelines for protected areas legislation. IUCN Environmental Policy and Law Paper No. 81. Gland, Switzerland. 370 (2011).
52. OSPAR Commission. Background document to support the assessment of whether the OSPAR Network of Marine Protected Areas is ecologically coherent. 54 (2007).
53. Ball, I. R., Possingham, H. P. & Watts, M. E. Marxan and relatives: Software for spatial conservation prioritization. in Spatial conservation prioritisation: Quantitative methods and computational tools 185–195 (Oxford Univ. Press, 2009).
54. Watts, M. E. et al. Marxan with zones: Software for optimal conservation based land- and sea-use zoning. Environmental Modelling & Software 24, 1513–1521 (2009).
55. Dinter, W. P. Biogeography of the OSPAR maritime area: a synopsis and synthesis of biogeographical distribution patterns described for the North East Atlantic. (Federal Agency for Nature Conservation, 2001).
56. McQuaid, K.A., Attrill, M.J., Clark, M.R., Cobley, A., Glover, A.G., Smith, C.R. & Howell, K.L. Using Habitat Classification to Assess Representativity of a Protected Area Network in a Large, Data-Poor Area Targeted for Deep-Sea Mining. Frontiers in Marine Science 7 (2020).
57. Boschen, R. E., Rowden, A. A., Clark, M. R. & Gardner, J. P. A. Mining of deep-sea seafloor massive sulfides: A review of the deposits, their benthic communities, impacts from mining, regulatory frameworks and management strategies. Ocean & Coastal Management 84, 54–67 (2013).
58. Helmons, R., de Wit, L., de Stigter, H. & Spearman, J. Dispersion of benthic plumes in deep-sea mining: What lessons can be learned from dredging? Front. Earth Sci. 10, 868701 (2022).
59. Oebius, H. U., Becker, H. J., Rolinski, S. & Jankowski, J. A. Parametrization and evaluation of marine environmental impacts produced by deep-sea manganese nodule mining. Deep Sea Research Part II: Topical Studies in Oceanography 48, 3453–3467 (2001).
60. Gwyther, D. Environmental impact statement. Solwara 1 project. Nautilus Minerals Niugini Limited, Executive summary Coffey Natural Systems, Brisbane. 50 (2008).
61. Morato, T. et al. Modelling the dispersion of seafloor massive sulphide mining plumes in the Mid Atlantic Ridge around the Azores. Front. Mar. Sci. 9, 910940 (2022).
62. IHO. Standardization of undersea feature names. Bathymetric Publication (2008).
63. German, C. R. & Seyfried, W. E. Hydrothermal processes. in Treatise on Geochemistry 191–233 (Elsevier, 2014). doi:10.1016/B978-0-08-095975-7.00607-0.
64. Åström, E. K. L., Sen, A., Carroll, M. L. & Carroll, J. Cold Seeps in a Warming Arctic: Insights for Benthic Ecology. Front. Mar. Sci. 7, 244 (2020).
65. Yesson, C., Clark, M. R., Taylor, M. L. & Rogers, A. D. The global distribution of seamounts based on 30 arc seconds bathymetry data. Deep Sea Research Part I: Oceanographic Research Papers 58, 442–453 (2011).
66. ISA 2021. Environmental management plan for the Clarion-Clipperton Zone - International Seabed Authority (isa.org.jm)
67. Washburn, T.W., Jones, D.O.B., Wei C-L. & Smith, C.R. Environmental Heterogeneity Throughout the Clarion-Clipperton Zone and the Potential Representativity of the APEI Network. Frontiers in Marine Science 8, doi:10.3389/fmars.2021.661685 (2021).
68. Jones D.O.B. et al. Environment, ecology, and potential effectiveness of an area protected from deep-sea mining (Clarion Clipperton Zone, abyssal Pacific). Progress in Oceanography 197, doi:10.1016/j.pocean.2021.102653 (2021)
69. Bonifácio, P., Martinez-Arbizu, P.P. & Menot, L. Alpha and beta diversity patterns of polychaete assemblages across the nodule province of the eastern Clarion-Clipperton Fracture Zone (equatorial Pacific), Biogeosciences 4, 865-886 (2020).
6 - Appendix
| Classification | Layer | Definition | OSPAR status assessment for region I | Area (km²); Occurrence | Data source |
| Area of interest | All the seabed of the continental slope1 and the abyss2 belonging to the Norwegian extended continental shelf3. | 1 231 981 | Kartverket – Geonorge & Harris et al . (2014)22 | ||
| 1 Deepening seafloor out from the shelf edge to the upper limit of the continental rise, or the point where there is a general decrease in steepness | |||||
| 2 Area of seafloor located at depths below the foot of the continental slope and above the depth of the hadal zone (defined as deeper than 6000 m) 3Outer limits of the Norwegian continental shelf and areas of the extended continental shelf extending beyond 200 nautical miles from the baselines | |||||
| Biogeographic zones | Arctic biogeographic region >1000m | 1 121 266 | Dinter (2001)55 | ||
| Norwegian Coast: West Norway | 40 751 | ||||
| Barents Sea | 24 602 | ||||
| S-E Greenland-N. Iceland Shelf | 8 145 | ||||
| High Arctic Maritime | 224 138 | ||||
| Geomorphic features | Basins | Depression, in the seafloor, more or less equidimensional in plan and of variable extent | 560 975 | Harris et al . (2014)22 | |
| Submarine canyons | Steep-walled, sinuous valleys with V-shaped cross sections, axes sloping outwards as continuously as river-cut land canyons and relief comparable to even the largest of land canyons | 53 402 | |||
| Escarpments | Elongated, characteristically linear, steep slope separating horizontal or gently sloping sectors of the sea floor in non-shelf areas | 53 593 | |||
| Fans | Relatively smooth, fan-like, depositional feature normally sloping away from the outer termination of a canyon or canyon system | 57 566 | |||
| Plateaus | Flat or nearly flat elevations of considerable areal extent, dropping off abruptly on one or more sides | 236 419 | |||
| Ridges | Isolated (or group of) elongated narrow elevation(s) of varying complexity having steep sides, often separating basin features | 39 581 | |||
| Rift valleys | Elongated, local depressions flanked generally on both sides by ridges | 8 755 | |||
| Rises | Features that abut continental margins and do not include the mid-ocean ridge | 300 462 | |||
| Sills | Sea floor barrier of relatively shallow depth restricting water movement between basins | 806 | |||
| Mid-ocean spreading ridges | The linked major mid-oceanic mountain systems of global extent | 72 274 | |||
| Terraces on the continental slope | Isolated (or group of) relatively flat horizontal or gently inclined surface(s), sometimes long and narrow, which is (are) bounded by a steeper ascending slope on one side and by a steeper descending slope on the opposite side | 80 100 | |||
| Troughs | Long depression of the seafloor characteristically flat bottomed and steep sided and normally shallower than a trench | 20 373 | |||
| Smooth continental slope | Areas of continental slope between canyons and between the continental shelf break and the deep-sea plain | 393 453 | Norges Geologiske Undersøkelse (NGU) and MAREANO | ||
| Marine canyons | Deep gorge with steep margins incised into the continental slope | 3 169 | |||
| Deep sea plain | Deep ocean floor below continental slope comprising both abyssal plain and continental rise. Relative relief is typically low (<50 m) | 541 068 | |||
| Continental slope plain | Plateau on the continental slope where the seabed has minor relief variations (relative relief <50 m) and usually a thick sediment cover | 80 732 | |||
| Continental shelf plain | Plain on the continental shelf forming a relatively flat (relative relief <50 m) platform between the continental slope and the strandflat/coast | 4 276 | |||
| Marine mountain landscape | Area of the seabed with relative relief >50 m within a square of 1 km2, but without well-defined valleys | 192 247 | |||
| Hydrothermal vents | Underwater hot seeps that usually occur in tectonically active settings such as mid-ocean ridges. When seawater percolates into fissures in the ocean crust, the high-pressure and high-temperature conditions induce emissions of hot fluids rich in dissolved components such as metals and gases 63 | Good condition | 14 | InterRidge Vents database Ver. 3.4 | |
| Cold seeps | Areas of the deep sea where hydrocarbon-rich fluids escape from cracks in the seafloor. The seawater expelled from the seafloor at cold seeps has a temperature close to the surrounding waters 64 | Not assessed | 5 | Åström et al. (2020)64 | |
| Seamounts | Isolated geological features with an elevation greater than 1000 m above the surrounding seafloor | Poor condition | 253 | Yesson et al. (2011)65 | |
| Knolls | Isolated geological features with an elevation between 100 and 1000 m above the surrounding seafloor | Not assessed | 1384 | Yesson et al. (2011)65 | |
| Biogenic habitats | Deep arctic sponge aggregations | Habitat formed by several species of hexactinellid sponges occurring in high densities in deep cold waters | Poor condition (OSPAR Deep-sea Sponge Aggregations) | 121 | Institute of Marine Research (MAREANO) |
| Hard-bottom sponge gardens | Habitat formed by a range of medium- to large-sized sponges that colonize hard substrates such as bedrock, lithified crust, and rocks | Poor condition (OSPAR Deep-sea Sponge Aggregations) | 988 | ||
| Soft-bottom sponge gardens | Habitat formed by dense aggregations of a variety of large sponge species occurring on gravel and coarse-sand bottoms | Poor condition (OSPAR Deep-sea Sponge Aggregations) | 675 | ||
| Deep-sea sea pen communities | Patches of the deep-sea sea pen species Umbellula spp. occurring in deep waters (below 700 m) | Not assessed | 202 | ||
| Sublittoral sea pen communities | Areas of bioturbated fine sediments with relatively high densities of sea pens (Funiculina quadrangularis, Virgularia mirabilis, Pennatula phosforea and Kophobelemnon stelliferum) occurring at depths shallower than 700 m | Unknown (OSPAR Sea-pen and Burrowing Megafauna Communities) | 884 | ||
| Hard-bottom coral gardens | Habitat formed by sea fan populations colonizing hard substrate in locations with strong currents | Poor condition (OSPAR Coral Gardens) | 232 | ||
| Soft-bottom coral gardens | Dense aggregations of corals (usually gorgonians of the families Isididae and Chrysogorgiidae) on sandy mud substrates | Poor condition (OSPAR Coral Gardens) | 69 | ||
| Cold-water coral reefs | Complex structural habitats formed by scleractinean corals. Desmophylum pertusum (syn: Lophelia pertusa) can build individual reefs or reef areas that can be composed of >100 individual reefs | Poor condition (OSPAR Lophelia pertusa reefs) | 153 | ||
| Nephtheidae meadows | Dense aggregations of cauliflower corals of the family Nephtheidae (Duva florida, Drifa glomerata, and Gersemia sp.) | Poor condition (OSPAR Coral Gardens) | 2 457 | ||
| Siboglinidae | Family of annelid tubeworms inhabiting deep-sea reducing habitats such as anoxic mud-bottom substrates, hydrocarbon seeps and hydrothermal vents | Not assessed | 33 (Sclerolinum consortum) 3692 (other species) | Artsdatabanken |