Forsøkene som ble gjennomført på dette toktet viste at fangstbegrensningssystemet med hell kan begrense fangstene i det pelagiske trålfisket etter kolmule, med ubetydelig tap under fiskeoperasjonen, samtidig som det effektivt slipper ut overflødig fisk når trålposen er full (avsnitt 3 og 6). Den løsningen som ble prøvd kan redusere risikoen for sprengning av trålposer og utkast av overflødig fisk betydelig, og dermed gjøre kolmulefisket mer bærekraftig og potensielt mer lønnsomt, med forbehold om passende sertifisering. Det er imidlertid behov for ytterligere arbeid med et effektivt fiskelåsdesign (avsnitt 4). Et «bifangstfrigjøringssystem» for å unngå fangst av større fisk, som hai og tunfisk ble også tested (avsnitt 6). Det systemet krever videreutvikling for å unngå tap av målarten. Trykkbaserte utløsere ble testet i forbindelse med fangstbegrensningsløsningen. Utløserene krever også videre utvikling og testing. Det videre arbeidet bør inkludere å definere den optimale utløsningsdybden (avsnitt 5 og 9). I tillegg til fangstbegrensning ble det foretatt undersøkelser i forbindelse med den potensielle risikoen for fartøyets- og mannskapets sikkerhet, under haling og pumping, ved å estimere fangstens vekt i sjøvann med totalt tap av svømmeblæregass (avsnitt 10). Det ble også testet en metode for å redusere denne risikoen under pumping, ved å automatisere frigjøring av trålsekken fra pumpen med en trykkbasert utløser (avsnitt 7).
Catch Control in the Blue Whiting Pelagic Trawl Fishery
— Research Cruise Report [2022825]: FV “Vikingbank”
Report series:
Toktrapport 2023-1
ISSN: 1503-6294
Published: 09.03.2023
Updated: 12.04.2023
Cruise no.: 2022825
Project No.: 15478
On request by: Norwegian Fisheries Directorate (Fiskeridirektoratet), the Norwegian Seafood Research Fund [Fiskeri- og havbruksnæringens forskningsfinansiering; FHF]
Reference: FHF 901542
Research group(s):
Fangst
Subject:
Kolmule
Program:
Norskehavet
Approved by:
Research Director(s):
Geir Huse
Program leader(s):
Bjørn Erik Axelsen
External:
Dagfinn Lilleng (Norwegian Fisheries Directorate).
Norsk sammendrag
Summary
This cruise has demonstrated that the catch limitation system can successfully limit catches in the blue whiting pelagic trawl fishery, with negligible loss during the fishing operation while effectively releasing excessive fish when the codend is full (sections 3 & 6),. This solution can significantly reduce the risk of burst codends and discarding of excess fish, thereby making the blue whiting fishery more sustainable and potentially more profitable, through appropriate certification. However, further work is needed on an effective fish lock design (section 4) and a bycatch release system that does not release excessive target catch (section 6). The depth triggered releasers for reliable release of the codend choker also require further development and testing, which should include defining the optimal release depth (sections 5 & 9). In addition to catch limitation, this cruise also investigated the potential risk to the safety of the vessel and crew, during haul-back and pumping, by estimating the weight in water of the catch with total loss of swimbladder gas buoyancy (section 10). Also tested was a prototype method to mitigate this risk during pumping, by automating the release of the pump by a depth triggered releaser (section 7).
1 - Background
In 2017, the Norwegian Seafood Research Fund (Fiskeri- og havbruksnæringens forskningsfinansiering; FHF) received input from blue whiting fishermen recommending that research should be conducted to investigate challenges regarding catch control and health and safety in the blue whiting fishery. The Institute of Marine Research (IMR), the Directorate of Fisheries (FDir) and FHF contributed to a feasibility study, with the aim of investigating the likely causes of bursting and sinking cod-ends in the blue whiting fishery in the north-east Atlantic. This preliminary study revealed four main challenges:
-
A danger of bursting and sinking trawl cod-ends bags at the surface, following explosive decompression of the captured blue whiting (and their swimming bladder gases) due to a rapid ascent from fishing depths of >400m;
-
The wastage of large quantities (often hundreds of tonnes) of fish in the event of a bursting cod-end;
-
The risk to the safety of the vessel and crew in the event of a bursting cod-end following an explosive ascent or during the retrieval of a sinking cod-end; and
-
The need to regulate catch volumes more effectively; specifically limiting catch sizes to manageable quantities that remain within individual vessel capacity and quota limits.
The preliminary results were used as a justification for a project to specifically address these challenges, Catch Control in the Blue Whiting Fishery [Fangstkontroll i fisket etter kolmule, FHF-prosjekt nr 901542], which commenced in 2019. The project's goal is to find methods that reduce the risk of bursting and sinking cod-ends in the blue whiting fishery, as well as regulate the catch based on the remaining load capacity of the vessel.
The project has conducted two research cruises to date, the first was conducted in March, 2019 (Kvalvik & Lilleng, 2019) and a second in March 2021 (Breen et al, 2021). These cruises primarily investigated the effectiveness of several fish release section (FRS) designs, as well as the cod-end choking unit (CCU). Both of these were based on principles used in the Norwegian demersal seine net fishery for cod (Ingólfsson et al, 2021). Observations of the catch limitation and release mechanisms were made using underwater camera systems, capable of enduring the hydrostatic pressures at fishing depths >400m. During the 2021 cruise, observations were made of a consistent behaviour pattern in the target fish, namely that blue whiting generally swam upwards when passing through the FRS. This behaviour was utilised to improve the design of the FRS and develop a new prototype, which was a hybrid of two previous prototypes, with escape resistant panels on the tops and sides and a large hexagonal mesh opening on the bottom panel, to facilitate the discharge of excessively large catches. In addition, on both cruises the geometry and dynamics of the trawl and cod-end, particularly during haul-back, were monitored using depth sensors mounted on the entire trawl. The work did not specifically focus on vessel and crew safety because mitigation of risks due to bursting and sinking cod-ends will be a direct benefit of achieving effective catch control.
1.1 - Cruise Aim and Objectives
The aim of this research cruise was to further develop the catch control methods and technologies initially investigated in cruise 1 and 2, by addressing the following objectives:
-
Monitor the effectiveness of the protype Catch Limitation System (CLS), as first developed in 2021, with regards to the following characteristics:
-
Retention of the target catch (blue whiting) during fishing;
-
Release of excess catch during ascent (haul-back); and
-
Behaviour and relative densities of the target catch near top & bottom panels during fishing and haul-back.
-
-
Monitor the effectiveness of a cylindrical fish-lock design, as a sub-component of the CLS, with respect to:
-
unrestricted passage of target catch into the cod-end during fishing; and
-
Retention of catch in the cod-end during haul-back (ascent).
-
-
Investigate the effectiveness of a prototype cod-end choking unit (CCU) to control catch size and cod-end ascent rate by:
-
monitoring the relationship between CCU position on the cod-end and target catch size;
-
monitoring the actual release depth, compared to target release depth; and
-
with objective 7, determine the effect of release depth (120m vs 200m) on ascent rate and dynamics.
-
-
Investigate the effectiveness of different catch monitoring technologies for determining when the cod-end is full:
-
Marport catch sensors;
-
Marport Catch Explorer Sensor; and
-
Marport Trawl Explorer Sensors.
-
-
Test a prototype mechanism for remotely releasing the cod-end from the fish-pump at a pre-determined “safety” depth.
-
Monitor the effectiveness of a protype Bycatch Release Section (BRS) during fishing and haul-back to:
-
release large bycatch animals (i.e. porbeagle and blue fin tuna);
-
with minimal unwanted release of the target catch (blue whiting).
-
-
Monitor Trawl and Cod-end Geometry during fishing operations, particularly during ascent, with depth sensors at set positions and using trawl geometry instrumentation (MarPort).
-
Estimate the weight in seawater water of decompressed blue whiting.
2 - Cruise Narrative
The research cruise began on 23rd March, 2022, at Nykirkekaien, Bergen, where the vessel (MF Vikingbank, R-11-K) was loaded and prepared. To reduce the risk of infections from COVID-19 during the cruise, all members of the scientific crew confirmed they had been vaccinated and details of the vaccination certificates were given to the vessel’s skipper (Anders Kløvning).
The vessel left Bergen harbour at 1315 (UTC) on 23rd March, 2022 and sailed to Manger to collect fishing gear (Arr: 14:45). After leaving Manger at 15:45, we sailed directly to deep water off the coast of Norway to conduct the first test haul, before proceeding to the UK sector. The vessel entered UK waters on 24th March at 04:09 [60.16N 2.02E].
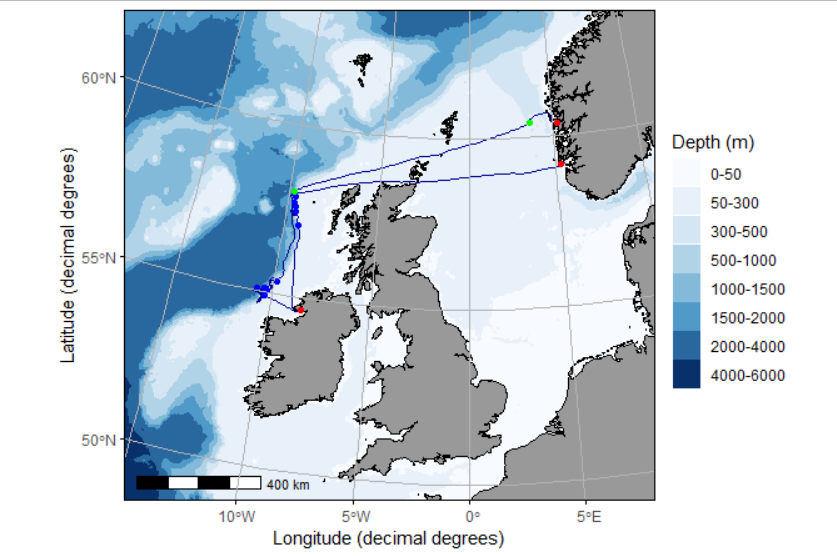
There were thirteen hauls taken during the cruise: 2 test-hauls (without targeting catch) and 11 specifically targeting blue whiting (Figure 2.1 and Table 2.1). The first test-haul was conducted in deep water off the Norwegian coast [60.43N, 3.24E at 20:00], with the aim of checking the trawl and catch control and bycatch release sections were correctly rigged, as well as fitting depth sensors (section 9) and testing the cod-end choking unit (section 5). A second test haul was conducted in deep water at the continental shelf edge, WNW of St. Kilda [58.02N, -9.72W at 1335], to further practice camera fitting methods and positioning, in preparation for “live hauls” targeting blue whiting schools. We then sailed south towards the Porcupine Bank fishing grounds, entering the Irish/EU zone at 04:30 [56.69N -9.32W] on 26th March.
Fishing hauls commenced on 26th March, at Porcupine Bank, with a trial haul including the bycatch release section (Table 2.1). But unfortunately, this released too many blue whiting so was removed to allow adjustments to be made. A total of 6 hauls were taken between 26-28th March, with catches ranging from 92 to 412 tonnes (total reported catch approximately 1463 tonnes), as well as a bycatch of two porbeagles [in hauls 2 and 5]. The vessel then sailed to Killybegs to deliver the catch; arriving in harbour at 0730 on 30th March. Due to many waiting vessels, there was a considerable delay before delivering a total of 1460.8 tonnes on 4th and 5th April.
The vessel then returned to Porcupine Bank on 5th April, but there were reports of poor catches in the area, so we proceeded searching along the shelf edge while making our way towards the St Kilda fishing grounds where there were better catch reports. Fishing recommenced on 6th April, with a further test of the bycatch release section. But this was still releasing too many blue whiting, so was again removed. From 6th to 7th April there were a total of five hauls, with catches ranging from 81 to 352 tonnes (total reported catch approximately 1114 tonnes), as well as bycatch of two porbeagles (hauls 8 and 10) and mackerel (100 kg, haul 11) and greater argentine (100 kg, haul 11). There was a short (12 hour) break in fishing because of poor weather (wind speeds >30 m.s -1 ) during the night and morning of 6-7th April.
The return journey started at ~03:30 of 08th April, after the final catch had been pumped aboard. We proceeded via the Pentland Firth towards Norway, leaving UK waters at 13:42 on 09th April [58.97N 1.62E] and arriving at Skudeneshamn at 02:00 UTC on 10th April. The scientific crew returned to Bergen on the afternoon of 10th April. After offloading the scientific equipment, MF Vikingbank then proceeded to Karmsund to deliver the catch on 11th April [blue whiting: 1052.3 tonnes; mackerel: 100 kg; greater argentine: 100 kg].
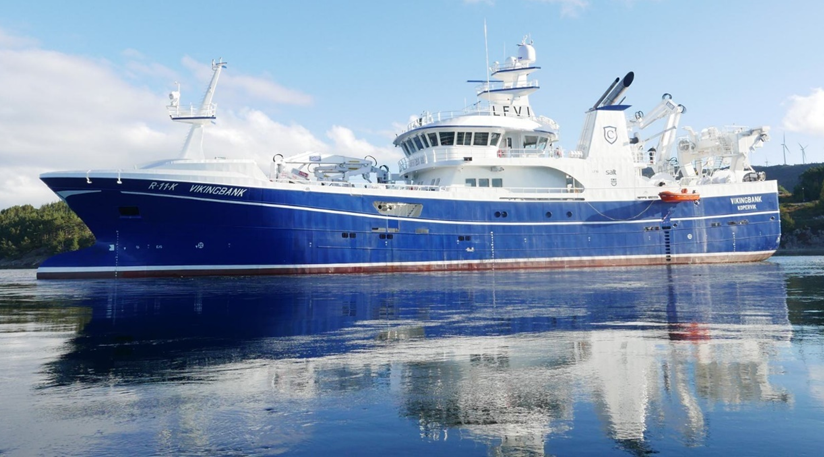
2.1 - Fishing Vessel and Gear
MF Vikingbank (R-11-K; call-sign LFVI; IMO number: 9874313) [owned by Cetus AS] was built in 2021 has a length of 68 metres long and beam of 13 metres, with a gross tonnage of 2144 tonnes. She is a combination vessel, capable of fishing with either pelagic trawl or purse-seine. For fish location and characterisation, the vessel is equipped with Furuno FSS-3BB and FCV-1900 echosounders and a Furuno DSV-25S low frequency (20 kHz) sonar.
For this cruise, the vessel was equipped with a pelagic trawl from Vonin, Capto 2016, (2016 metres stretched circumference), fitted with a ~1300m3 capacity cod-end (Appendix B). The total length from trawl doors to cod-end was approx. 875 meters. Stretched lengths of the trawl and cod-end were 571 and 73.5 m, respectively. Thyborøn 3.5 tonne (13.11m3) trawl doors were fitted to the upper bridles 220m long), while the lower sweeps were fitted with ~1.5 tonne chain bundles and 11m of chain setback. The trawl winches were operated and monitored using a Karmøy winch control system.
The geometry of the trawl was monitored in real-time using Furuno TS-331A Trawl Sonar and depth sensor, fitted to the headline, and Marport door spread and depth sensors. The cod-end contents were monitored using a combination of Marport Net Fill Sensors and Simrad PI 32 catch sensors, a Marport Catch Explorer (with echosounder) and two Marport Trawl Explorer echosounders (see section 6 for more details).
Additional instrumentation on the bridge included: a Furuno GP-170 DGPS and GLONASS navigation system, Furuno TECDIS 2139 navigation plotting system; a Furuno CI-88 ADCP for monitoring water current; and Deif Malling anemometer for wind speed and direction.
| Haul Details | Catch | Doors Deployed | Heaving Start | Doors Recovered | Codend on surface | |||||||||
|---|---|---|---|---|---|---|---|---|---|---|---|---|---|---|
| Haul No. | Catch Control Rig | Date | Target catch (Tonnes) | Bycatch | Time (UTC) | Position - Decimal | Time (UTC) | Position - Decimal | Time (UTC) | Position - Decimal | Time (UTC) | |||
| Lat | Long | Lat | Long | Lat | Long | |||||||||
| TestHaul_01 | Camera obs of BRS & CLS | 23.03.2022 | 250 | NA | 21:06:15 | 60.4583 | 3.6342 | 21:33:00 | 0.0000 | 0.0000 | 21:44:00 | 60.4222 | 3.6410 | NA |
| TestHaul_02 | Camera & trawleye obs of BRS & CLS | 25.03.2022 | 100 | NA | 17:36:45 | 58.0233 | -9.7193 | 19:01:35 | 57.9530 | -9.8517 | 19:26:00 | NA | NA | NA |
| Haul_01 | Camera obs of BRS with fish | 26.03.2022 | 250 | None | 18:15:55 | 54.9000 | -10.3437 | 22:39:40 | 0.0000 | 0.0000 | NA | NA | NA | NA |
| Haul_02 | Standard CLS trial - Aborted | 27.03.2022 | 250 | 1 porbeagle (male) length 185cm | 6:52:20 | 55.0365 | -10.2872 | 14:12:40 | 54.9832 | -10.7097 | 14:36:55 | 54.9950 | -10.7233 | NA |
| Haul_03 | Standard CLS trial - Aborted | 27.03.2022 | 250 | None | 17:49:35 | 55.1020 | -10.4195 | 20:33:00 | 0.0000 | 0.0000 | 20:49:35 | 55.1238 | -10.1033 | NA |
| Haul_04 | Standard CLS trial - Aborted | 28.03.2022 | 400 | None | 0:11:40 | 55.3556 | -9.8275 | 11:04:25 | 54.8800 | -10.3437 | 11:23:20 | 54.8695 | -10.3442 | 11:41:00 |
| Haul_05 | Standard CLS trial | 28.03.2022 | 250 | porbeagle (male) length 189cm | 16:00:45 | 55.0705 | -10.2732 | 22:24:00 | 55.0512 | -10.5293 | 22:43:30 | 55.0440 | -10.5478 | 23:00:01 |
| Haul_06 | Check for leakage at Releaser unit | 29.03.2022 | 100 | None | 2:09:55 | 55.0595 | -10.7923 | 9:24:00 | 55.0317 | -10.8612 | 9:45:50 | 55.0357 | -10.8875 | 9:56:20 |
| Haul_07 | Camera obs of BRS with fish | 06.04.2022 | !(400) | None | 2:51:26 | 57.0702 | -9.2515 | 5:00:00 | 57.2208 | -9.3590 | 5:19:20 | 57.2400 | -9.3715 | 5:34:00 |
| Haul_08 | Standard CLS trial | 06.04.2022 | 400 | poorbeagle est. length ~1m | 9:32:45 | 57.5908 | -9.5105 | 11:33:00 | 57.4657 | -9.4775 | 11:47:55 | 57.3748 | -9.4805 | 11:59:15 |
| Haul_09 | Standard CLS trial - Aborted | 06.04.2022 | 400 | None | 14:47:30 | 57.4620 | -9.4887 | 20:48:00 | 57.4692 | -9.6043 | 21:04:15 | 57.4648 | -9.5982 | 21:22:30 |
| Haul_10 | Standard CLS trial with torn/cut fish lock | 07.04.2022 | 400 | porbeagle est. length <2,5 m | 14:10:20 | 57.8825 | -9.5848 | 18:07:00 | 57.6193 | -9.5518 | 18:25:45 | 57.6080 | -9.5505 | 18:35:00 |
| Haul_11 | Standard CLS trial - CLS repaired | 07.04.2022 | 100 | Mackerel (~100kg) & greater argentine (~100kg) | 21:34:45 | 57.7228 | -9.6332 | 1:39:15 | 58.0067 | -9.5588 | 1:54:40 | 58.0183 | -9.5503 | NA |
| Haul No. |
Fishing Operations (Towing) | |||||||||||||||||
|---|---|---|---|---|---|---|---|---|---|---|---|---|---|---|---|---|---|---|
| Towing Speed (knots) | Trawl Wire Length (m) | Headline Depth (m) | Door (port) Depth (m) | Door (Stbd) Depth (m) | Door Spread (m) | TrawlEye #2 Opening (m) | TrawlEye #1 - Opening (m) | Wind Speed (m/s) | ||||||||||
| Mean ± CI | Range | Mean ± CI | Range | Mean ± CI | Range | Mean ± CI | Range | Mean ± CI | Range | Mean ± CI | Range | Mean ± CI | Range | Mean ± CI | Range | Mean ± CI | Range | |
| TestHaul_01 | 4.1 ±3.2 | 3.8 - 4.3 | 489 ±889.4 | 419 - 559 | 101.5 ±146.1 | 90 - 113 | 125.5 ±57.2 | 121 - 130 | 142.5 ±7 | 141.9 - 143 | NA | NA | NA | NA | 0 ±0 | 0 - 0 | 10.6 ±5.1 | 10.2 - 11 |
| TestHaul_02 | 3.8 ±0.3 | 1.9 - 4.6 | 1444.7 ±25.5 | 1390 - 1535 | 514.7 ±20.2 | 450 - 584 | 536.5 ±26.1 | 463 - 632 | 559.7 ±27.2 | 482 - 653 | 368.2 ±6.7 | 344 - 387 | 1.9 ±0.1 | 1.6 - 2.4 | 3.2 ±0.1 | 3.0 - 3.5 | NA | NA |
| Haul_01 | 4 ±0.1 | 3.3 - 4.9 | 1024.9 ±10.9 | 950 - 1060 | 319.1 ±10.5 | 233 - 361 | 343.3 ±12.5 | 300 - 409 | 353.7 ±13.8 | 298 - 433 | 311.2 ±16.7 | 165 - 342 | 2.1 ±0.2 | 1.5 - 4.2 | 3.0 ±0.1 | 2.6 - 3.3 | 4.2 ±2.3 | 2.6 - 5.6 |
| Haul_02 | 4.1 ±0.1 | 3.3 - 4.5 | 1114. 9±22 | 1055 - 1265 | 369.8 ±7.2 | 335 - 425 | 389.5 ±9.4 | 346 - 452 | 394.7 ±9.5 | 352 - 455 | 333.6 ±3.9 | 298 - 349 | 2.4 ±0.1 | 1.9 - 2.8 | 2.8 ±0.1 | 2.5 - 3.1 | 4.8 ±2 | 1.7 - 7.3 |
| Haul_03 | 4.1 ±0.2 | 3.6 - 4.7 | 1091.2 ±13 | 1070 - 1130 | 372.2 ±11.5 | 331 - 395 | 402.5 ±24 | 351 - 497 | 397.8 ±18.8 | 353 - 470 | 304.3 ±28.4 | 182 - 341 | 2.6 ±0.1 | 2.4 - 2.9 | 3.0 ±0.1 | 2.7 - 3.2 | NA | 2.7 - 2.7 |
| Haul_04 | 3.9 ±0.1 | 3.4 - 4.4 | 1108.4 ±16.3 | 1030 - 1201 | 360.2 ±10.5 | 320 - 423 | 378 ±14.2 | 314 - 465 | 386.5 ±14.2 | 335 - 487 | 319.2 ±9.6 | 208 - 348 | 2.4 ±0.1 | 2.1 - 2.8 | 2.8 ±0.1 | 2.5 - 3.3 | 3.6 ±0.6 | 2.1 - 5.5 |
| Haul_05 | 4.1 ±0.2 | 3.5 - 5 | 1141.8 ±19 | 1075 - 1200 | 366.5 ±11.9 | 323 - 416 | 366.1 ±16.4 | 308 - 421 | 395.5 ±14 | 356 - 448 | 333.1 ±8 | 291 - 358 | 2.7 ±0.4 | 1.9 - 5.5 | 2.8 ±0.1 | 2.4 - 3.2 | 4.4 ±1.8 | 2.5 - 7.3 |
| Haul_06 | 4.1 ±0.1 | 3.8 - 4.4 | 1129.9 ±28.6 | 1032 - 1217 | 376.2 ±9.5 | 342 - 420 | 378.3 ±12.8 | 330 - 438 | 394.8 ±11.6 | 355 - 458 | 333.5 ±2.7 | 321 - 344 | 2.4 ±0.1 | 2.1 - 2.6 | 2.8 ±0.1 | 2.2 - 3.0 | 5.7 ±1 | 4.7 - 7.3 |
| Haul_07 | 4.8 ±0.2 | 4.6 - 5.2 | 822.5 ±31.2 | 763 - 839 | 254.7 ±8.1 | 243 - 263 | 272 ±11.9 | 253 - 287 | 284.7 ±28.6 | 243 - 327 | 275.5 ±26 | 233 - 299 | 2.0 ±0.2 | 1.7 - 2.2 | NA | NA | 15.9 ±11.4 | 15 - 16.8 |
| Haul_08 | 3.9 ±0.1 | 3.9 - 4.1 | 870.2 ±21.7 | 851 - 895 | 185.4 ±12.4 | 176 - 197 | 192 ±21.1 | 167 - 214 | 205 ±9.4 | 193 - 213 | 365.2 ±49.9 | 311 - 406 | 2.7 ±0.2 | 2.6 - 2.8 | 2.7 ±0.7 | 2.1 - 3.1 | 10.1 ±17.8 | 8.7 - 11.5 |
| Haul_09 | 4 ±0.2 | 3.2 - 4.8 | 1059.3 ±65.4 | 820 - 1196 | 289.4 ±24.7 | 193 - 367 | 293.8 ±26.4 | 183 - 388 | 318.7 ±30.8 | 209 - 424 | 325.6 ±6.7 | 299 - 344 | 2.3 ±0.1 | 1.8 - 2.7 | 2.6 ±0.1 | 1.7 - 3.0 | 9.2 ±6.1 | 4.2 - 20.6 |
| Haul_10 | 4 ±0.1 | 3.6 - 4.2 | 1052.3 ±25.7 | 952 - 1080 | 296.6 ±10.2 | 269 - 319 | 305.7 ±12.2 | 278 - 332 | 307.5 ±13.2 | 261 - 339 | 341.6 ±14.2 | 318 - 388 | 2.7 ±0.5 | 1.8 - 4.8 | 2.6 ±0.2 | 1.6 - 3.1 | 14.2 ±2.3 | 11.4 - 15.9 |
| Haul_11 | 4.3 ±0.2 | 4 - 5.1 | 901.5 ±27.6 | 801 - 950 | 282.1 ±7.1 | 264 - 297 | 301 ±13.5 | 258 - 332 | 303.4 ±9.9 | 276 - 324 | 295 ±12.5 | 247 - 320 | 2.3 ±0.2 | 1.8 - 2.6 | 2.7 ±0.1 | 2.5 - 2.9 | 10.5 ±1.6 | 9.6 - 11.9 |
| Haul No. |
Fishing Operations (Haul-back) | |||||||||||||||
|---|---|---|---|---|---|---|---|---|---|---|---|---|---|---|---|---|
| Towing Speed (knots) | Trawl Wire Length (m) | Headline Depth (m) | Door (port) Depth (m) | Door (Stbd) Depth (m) | Door Spread (m) | TrawlEye A (FRS) - Opening (m) | TrawlEye B - Opening (m) | |||||||||
| Mean ± CI | Range | Mean ± CI | Range | Mean ± CI | Range | Mean ± CI | Range | Mean ± CI | Range | Mean ± CI | Range | Mean ± CI | Range | Mean ± CI | Range | |
| TestHaul_01 | 2.8 ±1.9 | 2.3 - 3.7 | 250 ±3176.6 | 0 - 500 | 48.7 ±158.7 | 0 - 121 | NA | 102 - 102 | NA | NA | NA | NA | NA | NA | NA | NA |
| TestHaul_02 | 2.4 ±0.2 | 1.4 - 3.7 | 556.5 ±265.2 | 0 - 1250 | 183.1 ±71.2 | 25 - 495 | 290.9 ±119.6 | 0 - 503 | 295.8 ±120.3 | 0 - 513 | 208.3 ±79.2 | 0 - 368 | 1.6 ±0.1 | 0.8 - 2.0 | 2.6 ±0.2 | 1.7 - 3.3 |
| Haul_01 | 1.5 ±0.2 | 0.1 - 2.3 | 448 ±251.4 | 0 - 990 | 159.7 ±57.9 | 25 - 305 | 188.7 ±86.2 | 0 - 316 | 198.1 ±93.9 | 0 - 341 | 179.3 ±82.1 | 0 - 308 | 3.1 ±0.9 | 0.3 - 5.2 | 1.7 ±0.4 | 0.4 - 2.5 |
| Haul_02 | 1.8 ±0.3 | 0.8 - 2.7 | 540.6 ±363.2 | 10 - 1255 | 176.3 ±79.8 | 25 - 417 | 240.1 ±140.1 | 0 - 439 | 243 ±146.5 | 0 - 456 | 170.3 ±95.5 | 0 - 325 | 1.8 ±0.4 | 0.6 - 2.5 | 1.9 ±0.3 | 0.7 - 2.5 |
| Haul_03 | 2.0 ±0.3 | 0.7 - 3.4 | 352.9 ±246.6 | 0 - 850 | 141.3 ±59.5 | 25 - 341 | 164 ±102.6 | 0 - 338 | 168.6 ±110.2 | 0 - 350 | 161.9 ±95.5 | 26 - 312 | 2.3 ±0.1 | 1.9 - 2.6 | 2.5 ±0.2 | 2.0 - 2.8 |
| Haul_04 | 1.5 ±0.3 | 0.2 - 2.3 | 442 ±280.1 | 0 - 1040 | 147.4 ±57.6 | 25 - 320 | 164.3 ±96.2 | 0 - 310 | 167.1 ±99.6 | 0 - 328 | 158.3 ±88.9 | 0 - 306 | 2.2 ±0.2 | 1.9 - 2.9 | 2.3 ±0.1 | 1.9 - 2.4 |
| Haul_05 | 2.1 ±0.3 | 0.6 - 3.4 | 419.4 ±221 | 50 - 940 | 145.3 ±48.8 | 25 - 351 | 188.6 ±92 | 15 - 366 | 186.8 ±90 | 18 - 362 | 155.9 ±69.5 | 22 - 294 | 2.4 ±0.6 | 0.5 - 5.7 | 2.0 ±0.1 | 1.5 - 2.7 |
| Haul_06 | 2.3 ±0.3 | 0.8 - 3.6 | 508.2 ±205.2 | 0 - 1090 | 208.4 ±63.3 | 25 - 403 | 240.9 ±94.6 | 0 - 445 | 243.8 ±93.8 | 0 - 448 | 169.4 ±56.1 | 0 - 320 | 2.0 ±0.2 | 0.7 - 2.4 | 2.4 ±0.1 | 1.7 - 2.7 |
| Haul_07 | 2.9 ±0.4 | 0.4 - 5 | 419.3 ±168 | 0 - 763 | 106.7 ±32.8 | 25 - 232 | 158.7 ±54.8 | 0 - 256 | 147.8 ±53.5 | 0 - 240 | 166.3 ±60.3 | 0 - 265 | 1.5 ±0.3 | 0.4 - 2.2 | NA | NA |
| Haul_08 | 1.4 ±0.3 | 0.6 - 2.4 | 315.1 ±203.3 | 0 - 620 | 89.9 ±36.6 | 25 - 195 | 104.1 ±65.2 | 0 - 198 | 108.1 ±68.2 | 0 - 210 | 145.1 ±84.9 | 0 - 253 | 3.3 ±0.9 | 1.0 - 6.0 | 2.1 ±0.2 | 1.8 - 2.6 |
| Haul_09 | 1.6 ±0.4 | 0.7 - 3.4 | 359.4 ±307.5 | 0 - 926 | 126.1 ±57.2 | 25 - 315 | 296.3 ±146.3 | 161 - 355 | 248.8 ±162.6 | 74 - 377 | 214.8 ±276 | 81 - 457 | 3.6 ±1.4 | 2.2 - 4.4 | 5.5 ±8.5 | 2.0 - 2.2 |
| Haul_10 | 2.1 ±0.3 | 0.8 - 3.1 | 433.5 ±226.4 | 0 - 945 | 180.2 ±51.5 | 66 - 269 | 150.5 ±75.3 | 0 - 285 | 160.8 ±73.4 | 0 - 274 | 189.9 ±77.9 | 0 - 319 | 6.1 ±0.8 | 4.8 - 9.3 | 2.3 ±0.1 | 1.8 - 2.6 |
| Haul_11 | 2.0 ±0.3 | 0.8 - 4.1 | 276.9 ±185.2 | 0 - 600 | 77.1 ±29.4 | 25 - 257 | 108.6 ±66.3 | 0 - 243 | 114.7 ±71.8 | 0 - 265 | 143.9 ±76.9 | 0 - 280 | 2.9 ±0.3 | 2.4 - 4.9 | 2.2 ±0.1 | 1.7 - 2.5 |
3 - Effectiveness of prototype Fish Release Section (FRS)
Objective 1: Monitor the effectiveness of the protype Fish Release Section (FRS), as first developed in 2021, with regards to the following characteristics:
a. Behaviour and relative densities of the target catch near top & bottom panels during fishing and haul-back;
b. Retention of the target catch (blue whiting) during fishing; and
c. Release of excess catch during ascent (haul-back).
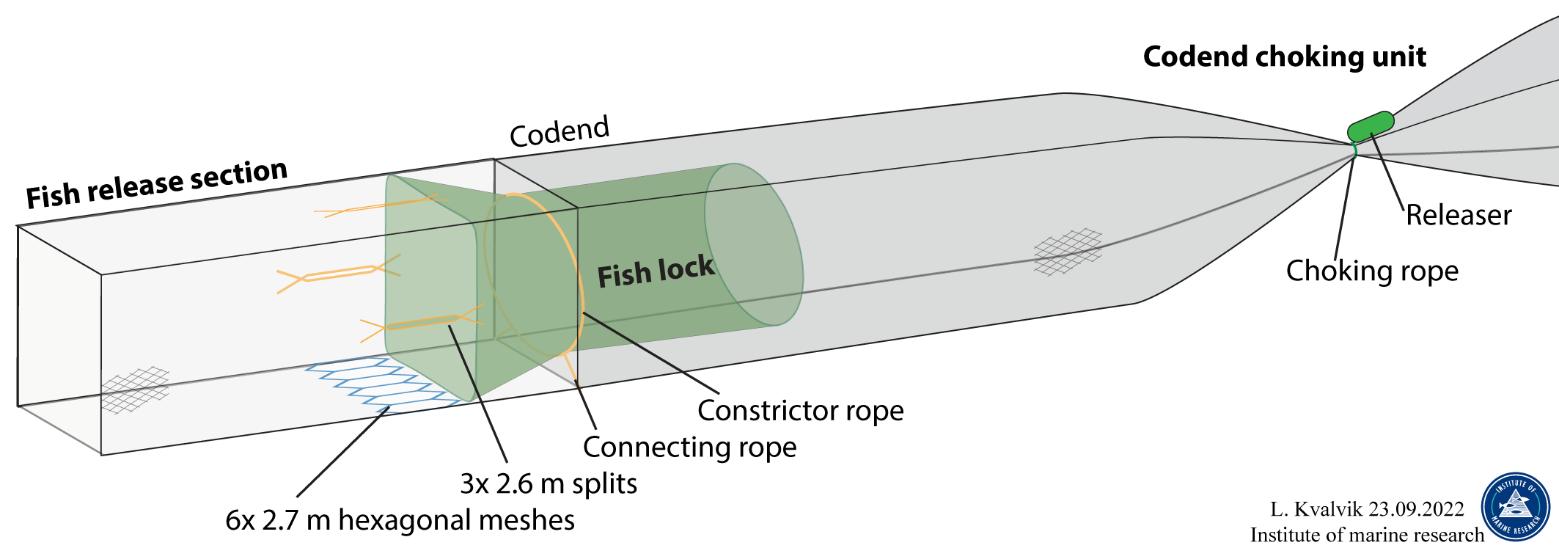
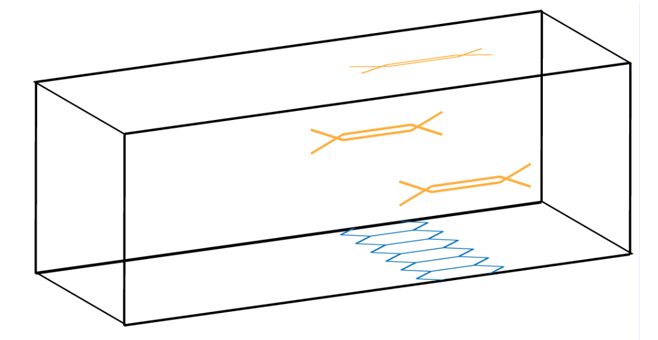
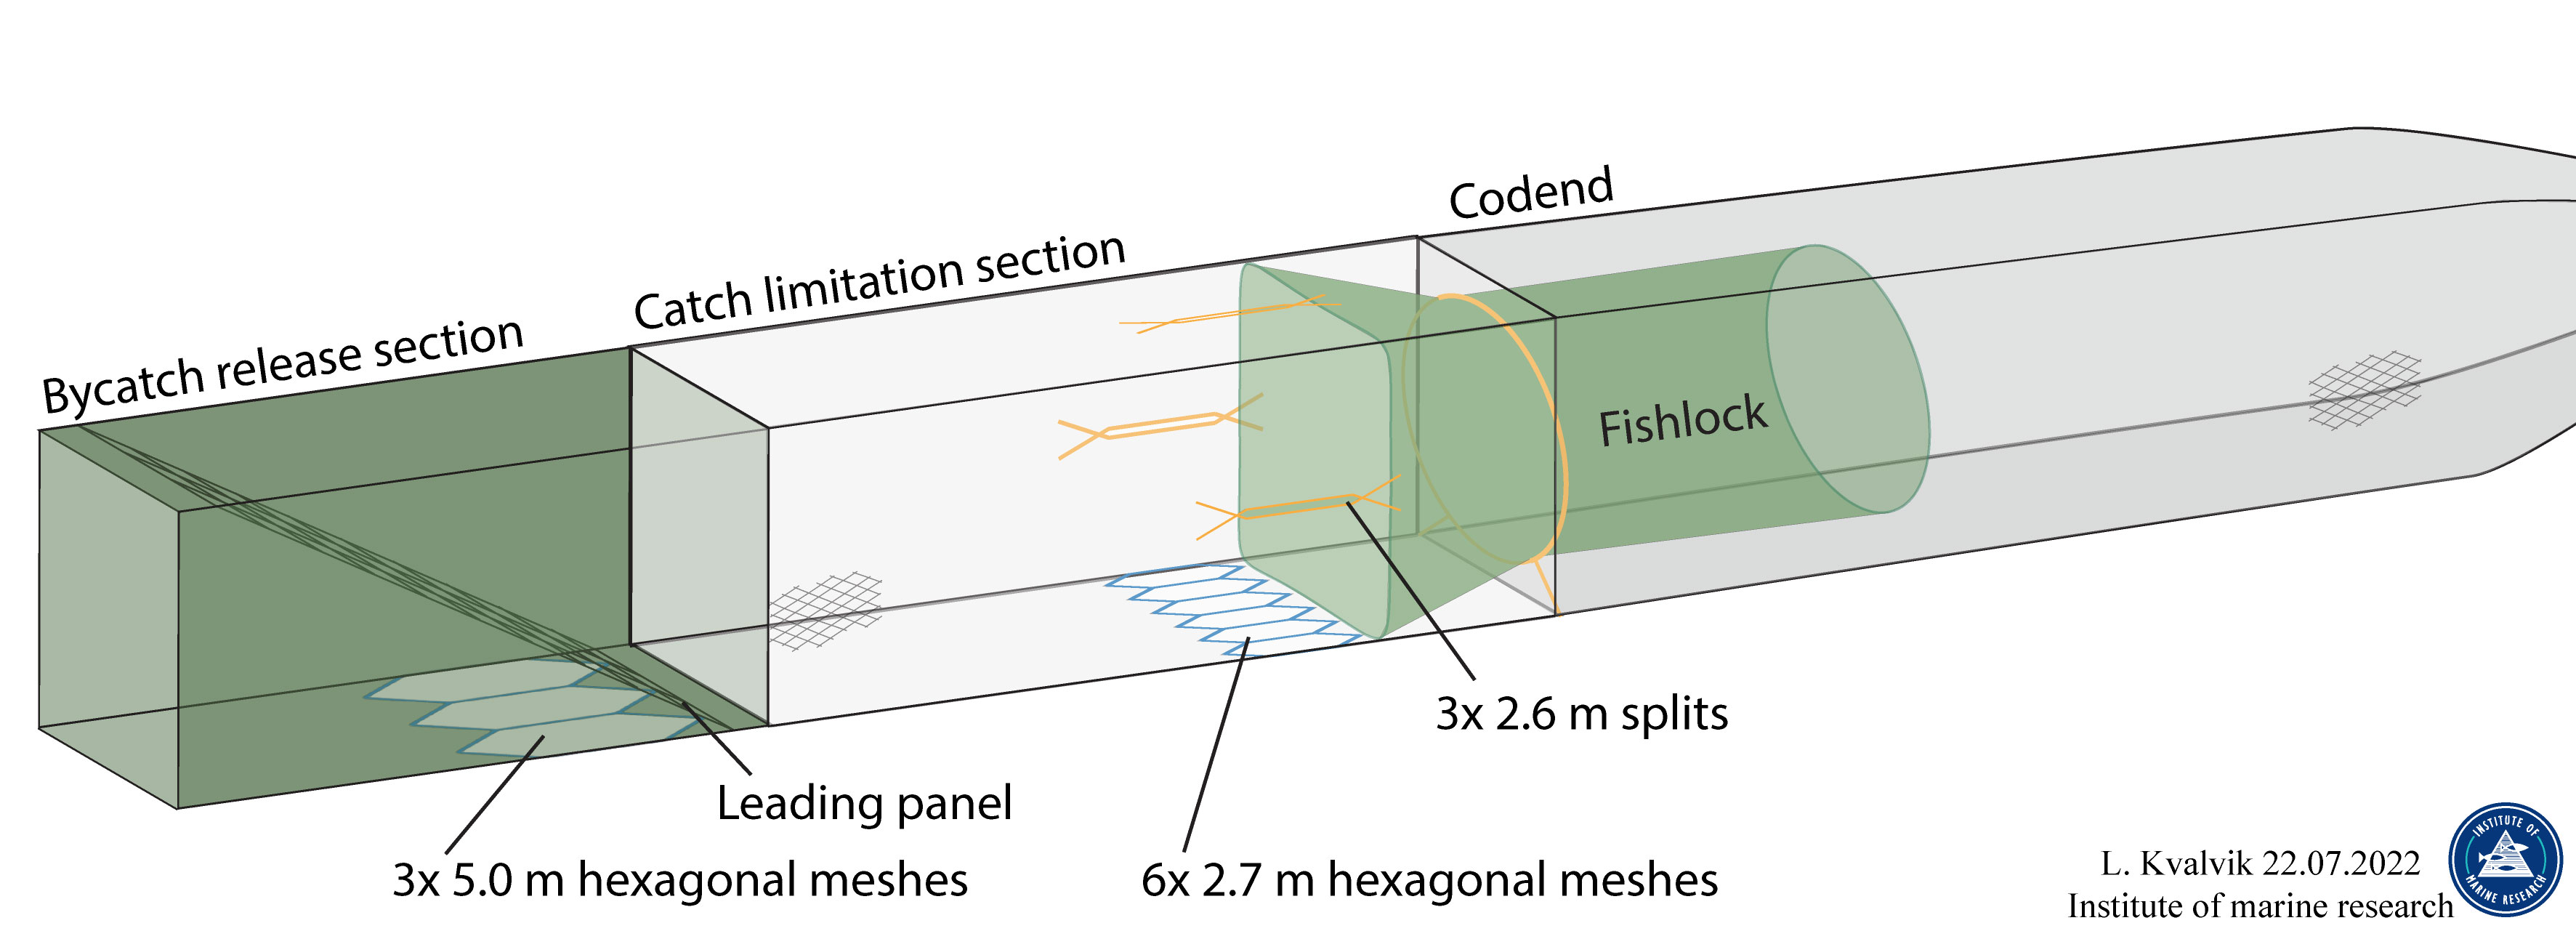
The catch limitation system (CLS; figure 3.1) consists of several key components: fish release section (FRS), fish lock, cod-end choking unit (CCU), catch sensors (CS) and cod-end echo-sounders (CE-ES). Together, these comprise a method to limit the maximum size of catches, inform the skipper when the cod-end is full and then safely release excess catch during haul-back through purposely designed openings (figure 3.1). The fish release section (FRS) and fish lock should permit free passage of the catch into the cod-end during the normal fishing operation (see sections 3 and 4). But, once the cod-end is full and/or during haul-back, the catch on the cod-end side of the fish-lock should press against the fish-lock netting, closing it, and preventing any loss of the catch retained in the cod-end (see section 4). Meanwhile, the FRS should release any excess catch ahead of the cod-end through purposely designed openings (see section 3). Also fitted are catch sensors and echo-sounders that inform the skipper of when the cod-end is full of catch (see section 6). During haul-back, the cod-end choking unit (CCU) releases the retained catch into the residual cod-end, at a predetermine depth, to ensure any build-up of gas from the decompressing fish is released, in order to avoid an uncontrolled cod-end ascent (see section 5).
This section will report on investigations to determine the effectiveness of the fish release section (FRS) component of the CLS. A consistent and usable behaviour in blue whiting passing through the FRS had been identified in the 2021 cruise; where blue whiting generally swam upwards and concentrated in the upper part of the FRS (Breen et al, 2021; Ingólfsson et al, 2022). This manifested as very low escape rates from the bottom escape openings, but with continuous and unacceptably high escape rate from the top escape openings of the FRS, if they were of an open design. Based on these observations, it was decided to construct a new FRS (figure 3.2) using a hybrid design of Rigs 1 and 3; where Rig 3 formed the top and side panels, with the large hexagonal mesh escape opening from Rig 1 inserted in the bottom panel (Breen et al, 2021). Preliminary observations suggested that this prototype FRS may be suitable for further development and testing (Breen et al, 2021).
3.1 - Materials and Methods
The fish release section (FRS) used during this cruise consisted of a four-panel cylinder of netting, approximately 16m long, inserted between the trawl and cod-end, that incorporated two types of escape openings: 2.5m long slots on each of top and side panels and 2.7m Hexagonal Meshes in the bottom panel (figures 3.1 & 3.2). The distance from the openings to the cod-end was 6 m. The theoretical area of release openings: 18.9 m2. The rig should allow free passage of the catch from the trawl into the cod-end during the fishing process, until the cod-end is full. The escape openings therefore should prevent escape during the normal fishing process, but once the cod-end is full should then enable fish to escape freely with minimal risk of crowding and abrasive injury.
The effectiveness of the catch limitation system (CLS) to retain and release catch was assessed using underwater camera systems placed in various positions on the trawl and catch control section. Appendix A gives a detailed description of these camera systems, and their deployments and positioning.
In addition to the camera systems, the trawl and CLS was monitored using: a trawl sonar and depth sensor on the trawl headline; door spread and depth sensors; catch monitoring echo-sounders on the FRS; and four catch sensors along the length of the cod-end (see sections 2.1 and 6 for further details).
3.2 - FRS escape openings – preliminary observations and developments
When fitted to the trawl, the FRS appeared to be stable and adopt its designed geometry. The only exception was during the test hauls and hauls 01 and 07, when the bycatch release section (BRS) was attached. During these hauls it was noted that the vertical opening of the CLS during fishing was reduced by ~20% from ~2.5m to ~2.0m (table 2.2b).
In this cruise, nine fishing hauls (02 to 06 and 08 to 11) were partly dedicated to monitoring the behaviour of blue whiting in the FRS, including the relative distribution been the top and bottom, as well as escapes during the fishing and ascent phases.
a. Behaviour and relative density distribution of the target catch in the FRS
Throughout all of the reviewed video observations, there was a consistent behaviour pattern in the target species, blue whiting; they generally congregated in the upper part of the FRS as they passed through. For the majority of time, densities in the upper part of the FRS were low to medium, with only very low densities of fish seen passing over the large hexagonal opening in the bottom panel (e.g. figure 3.3). However, when high densities were observed in the upper part of the FRS, there was a proportional increase in density in the lower part (e.g. figures 3.4 & 3.5).
b. Retention of the target catch (blue whiting) during fishing
While fishing, the FRS allowed fish to pass easily into the cod-end. Furthermore, the observed behaviour pattern of blue whiting, i.e. fish predominantly congregating in the upper part of the FRS, facilitated minimal escape of this target species through the release opening in the bottom panel. At low to medium densities in the upper part of the FRS, which were the most prominent catch densities observed, the typical escape rate was 0 to 15 fish per minute (figure 3.3). While at high densities, escape rates of between 23 and 65 fish per minute were observed (figures 3.4 & 3.5).
Note, at times the catch was mixed, with a small bycatch of greater Argentine and/or mackerel, and it was sometimes difficult to differentiate species from the fast-moving images in the video. However, assuming all counted fish were the target species, and their mean weight was ~150g, this would account for a loss of catch of up to 117 kg.hr -1 , for medium density catches, up to 585 kg.hr -1 , for high density catches. This represents a loss of approximately 0.2 % of the catch, assuming catch rates of 57.2 tonnes.h -1 (mean observed catch rate) for medium density catches, and 234.6 tonnes.h -1 (maximum observed catch rate) for high density catches.
With regards to escapes from the slots in the upper and side panels, these usually remained closed for most of the haul, only opening during the haul-back phase when there was a reduced flow in the FRS and there was increased tension applied on the fish-lock. Therefore, no attempt to estimate escape rate through the release slots was attempted.
c. Release of excess catch during ascent (haul-back)
At the end of the normal fishing operations, when the cod-end is full and the vessel is preparing to heave the trawl, the FRS should allow any excess catch in and ahead of the FRS to easily escape. There are two features in the FRS design that facilitated this: release opening in the bottom panel and release slots in the top and side panels.
During the 2021 cruise, it was observed that as the catch in the cod-end began to approach the catch limit, the slots in the top panel of opened to form almost circular escape openings (Breen et al, 2021). This facilitated a substantial increase in escapes from the top panel, and presumably the side panels, when fish density increased inside the FRS. The same was observed on this cruise. However, the main route of release was confirmed to be via the large hexagonal meshes in the bottom panel (figure 3.5). No catches with substantial excess catches were observed in either cruise, however unrestricted releases of large numbers of fish were observed during haul-back, when the fish-lock failed to function correctly (see section 4).
In summary, this cruise confirmed that there was a consistent behaviour pattern in blue whiting as they passed through the FRS; where they generally congregated in the upper part of the FRS at all observed fished densities. It was also demonstrated that the fish release section (FRS) used in this cruise functioned as per design. It permitted free passage of the catch into the cod-end during the normal fishing operation, while releasing any excess catch ahead of the cod-end through the purposely designed openings, once the codend was full.
![Figure 3.3 – Images from video taken during haul 11 at 01:38, just before the start of haul-back at 01:39. Top: from position 5iB looking aft toward the fish-lock and cod-end, showing medium densities of fish in the top of the FRS. Bottom: from position 4iB, looking aft over the escape opening. toward the fish-lock and cod-end, with three fish escaping. Note – the escape rate was approximately 12 fish/minute [01:38-01:39].](/resources/images/nettrapporter/65908/file_html_6647d5cb6c9680ea.png)
![Figure 3.4 – Images from video taken during haul 05 at 21:19, approximately 1 hour before the start of haul-back at 22:24. Top: from position 5iB looking aft toward the fish-lock and cod-end, showing high densities of fish in the top of the FRS. Bottom from position 2oF, looking forward below the escape opening, with relatively few fish escaping, despite the high densities above. Note – the escape rate at this time was approximately 38 fish/minute [21:19-21:20].](/resources/images/nettrapporter/65908/file_html_fd780032fdc8db98.png)
![Figure 3.5 – Images from video taken during haul 03 at 20:17, 16 minutes before the start of haul-back at 20:33. Top: from position 5iB looking aft toward the fish-lock and cod-end, showing high densities of fish in the top of the FRS. Bottom: from position 2iF, looking forward over the escape opening, with medium densities of fish passing over the escaping open. Note – the escape rate was approximately 65 fish/minute [20:17 - 20:18].](/resources/images/nettrapporter/65908/file_html_e10b2ce7e8cb8394.png)
4 - Effectiveness of fish-lock design
Objective 2: Monitor the effectiveness of a cylindrical fish-lock design, as a sub-component of the CLS, with respect to:
a. unrestricted passage of target catch into the cod-end during fishing; and
b. Retention of catch in the cod-end during haul-back (ascent).
Two different “fish-lock” designs were tested during cruises 1 and 2. Type 1 was constructed of a netting panel 80 mm mesh size with 210/96 nylon (PA) twine, 74.5 meshes long (6 m). This was fixed to the top panel, approximately 0.3 m to the aft of the escape opening, and then fixed on a diagonal line down to about halfway down the side panels (and toward the cod-end). The operation of this design (type 1) was observed during cruise 1 and is described in Breen et al (2021). In summary, when water flow in the codend reduced during haulback, the lower/aft portion of the panel dropped to the bottom side of the codend preventing fish from escaping forward.
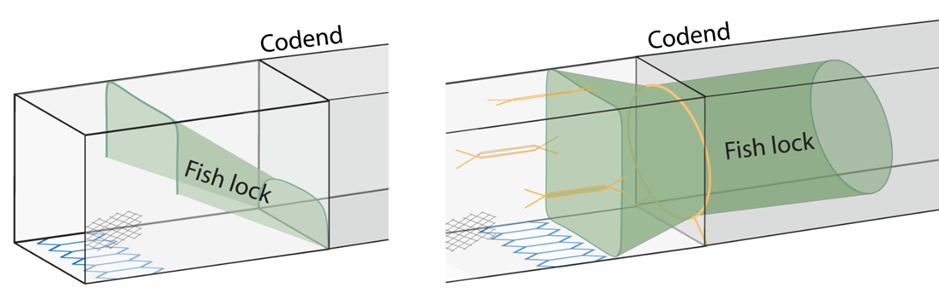
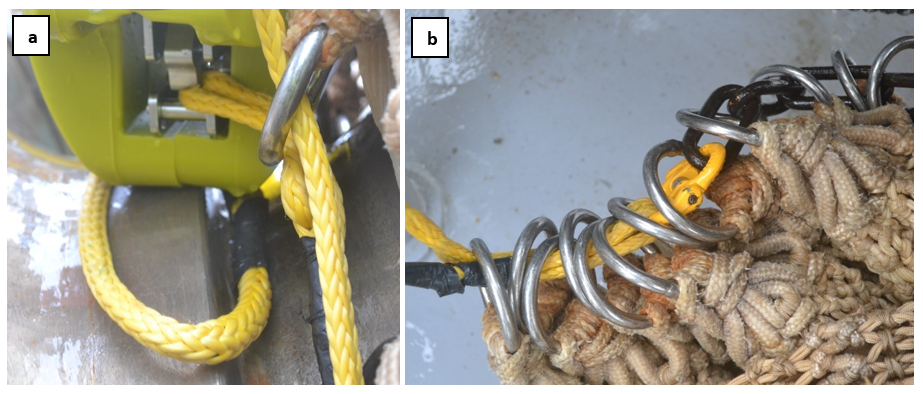
The second design of fish-lock (type 2) consisted of a netting cylinder of 60 mm mesh size and a total length of 8.6 m; 5.6 m twisted 210/96 PA forward end and 3 m of braided polyethylene (PE) in the aft. The leading edge of the cylinder was fixed to the top, bottom and side panels of the CRR, 0.1m behind the escape opening panels. A constrictor rope (11.0 m circumference circular strop of 18 mm diameter ultra-high molecular weight polyethylene rope) was fitted around the cylinder. It moved freely through plastic rings attached to the outside of the netting, at the join between the PA and PE nettings. The circumference of the constrictor rope (11m) was 25% of the stretched circumference of the outer fish release section (44m), so as the codend filled and expanded the FRS, the constrictor rope choked off the fish lock cylinder. Thus, the fish lock was designed to close when the codend was full, rather than when waterflow inside the trawl was reduced, during haulback (as in type 1). To prevent the fish lock from extending forward into the fish release section, the two bottom “corners” of the constrictor rope passed were attached to the lower selvedges, at the join between the FRS and codend meet using 2 m long connecting ropes in 10 mm braided nylon (Figure 4.1).
During this cruise 2, the type 2 (cylindrical) fish lock appeared to be stable during normal fishing operations. However, whenever the codend was known to be full (i.e. hauls 02-1, 02-5, 02-8, 02-10 and 02-11; see section 6) the ropes connecting the constrictor rope of the fish lock to the selvedges of the fish release section broke, and the fish lock spilled forward and at least partially extruded through the bottom escape opening in the FRS.
5 - Prototype Cod-end Choking Unit (CCU)
Objective 3 : Investigate the effectiveness of a prototype cod-end choking unit (CCU) to control catch size and cod-end ascent rate by:
a. monitoring the relationship between CCU position on the cod-end and target catch size;
b. monitoring the actual release depth, compared to target release depth; and
c. with objective 7, determine the effect of release depth (120m vs 200m) on ascent rate and dynamics.
The cod-end choking unit (CCU) is a protype device (developed by FossTech AS) that can be placed at different locations along the length of the cod-end, to limit the effective volume of the cod-end and thus the volume of the retained catch (Ingolfsson et al, 2018; Breen et al, 2021). At a pre-determined depth (between 50 and 150m) during haul-back, the release mechanism opens allowing the restrictor-rope wrapped around the cod-end to release, which results in the retained catch moving (with the towing induced flow inside the trawl) into the residual cod-end (figure 5.1). If timed correctly, this transfer of the catch from the retaining cod-end into the residual cod-end should dissipate the catch over a larger volume within the cod-end. This will prevent the catch concentrating at the terminal end of the cod-end, which provides two key benefits: i) fish can freely decompress, evolving expanding gas from ruptured swim-bladders and body cavities during ascent; and ii) dissipate buoyant lift from the catch over a larger surface area in the ascending cod-end, thus increasing drag and reducing acceleration during ascent.
![Figure 5.1 – Schematic diagram of the Cod-end choking unit in operation. 1: catch is retained in the cod-end ahead of the closed CCU; 2: the trigger depth is reached and the CCU opens; and 3: the retained catch dissipates into the residual component of the cod-end [Source: Ingolfsson et al, 2022].](/resources/images/nettrapporter/65908/file_html_5227005646f35b59.gif)
5.1 - Materials and Methods
Two variants of the CCU were tested during this cruise 2: Version 1, a mechanically activated model, first tested on cruise 1 (Breen et al, 2021); and Version 2, an electronically activated model. Version 1 used hydrostatic pressure, generated by the water depth, to trigger a release at a pre-set depth. The release depth was between approx. 30-120 metres and was pre-selected by factory adjustment of a tensioning spring. Version 2 had an electronic pressure sensor which triggered an actuator and could be programmed through a built-in Bluetooth interface. During this cruise version 2 was set to have a release depth of 120m, although it could be set to a maximum of 700m, with the system depth-rated to 750m.
A version of the CCU was fitted to the cod-end on all hauls, and its successful operation (i.e. opening and release of the restrictor line) was confirmed visually each time the cod-end was recovered. During this cruise, a GoPro Hero 5 camera (with a depth sensor fitted to the camera frame) was used to film the CCU during each haul (figure 5.2). This data was used to estimate the time and depth of release of the CCU (table 5.1). Video of the CCU opening was also obtained during cruise 1 (Test haul 02 and Haul 09), but these CCU positions were not close enough to a depth sensor for sufficiently accurate estimates of depth of release.
![Figure 5.2: Haul A01, depth triggered cod-end choking unit (CCU) with a choking rope set at the 25m (~200t) position. Also shown is the camera and depth sensor assembly, in a protective steel frame, for monitoring the release depth of the CCU [Source: Ingolfsson et al, 2022].](/resources/images/nettrapporter/65908/file_html_15b957d41e316cfd.gif)
The positions of the CCU on the cod-end was varied on each cruise with the intentions of determining catch size. On cruise 1, the positions were determined by the vessel’s skipper (Breen et al, 2021). The results from these were then used to predict pre-set positions on the same cod-end in cruise 2, namely at 25m 35m and 45m from the forward end of the cod-end, to obtain pre-determined catch sizes of approximately 100, 200 and 400 tonnes, respectively (figure 5.3).
In addition to the CCU units, on haul A09 in cruise 1, a 10mm nylon constrictor rope (breaking strength ~2080 kg) was added to the cod-end at 23.22 m from the leading edge of the cod-end (between round-strops 1 and 2). This same method was used to reduce the risk of leakage through the choke point formed by the CCU restrictor line during cruise 2, in hauls B07 to B11, after a known leakage event in haul B06.
![Figure 5.3 - positions on the cod-end of the Cod-end choking unit (CCU) and other instruments for cruise 1 (top) and cruise 2 (bottom). Releaser positions for each haul in both cruises are shown in green (see also table 5.2). Also shown are the relative positions of the “Trawl-Eye” echo-sounders (yellow), Catch Sensor units (orange) and depth-sensors (blue). [Source: Ingolfsson et al, 2022].](/resources/images/nettrapporter/65908/file_html_f8daeb10c0fe7144.gif)
5.2 - Preliminary Results and Discussion
The mechanical CCU appeared to operate successfully on all 13 hauls during cruise 1. However, during cruise 2, there were several failures of both the electronic and mechanical prototype CCU units (table 5.1). During haul B02, the electronic prototype CCU prematurely opened at depth (461.5m). This was not confirmed until after the haul from the video and depth sensor data, but was suspected during the haul from the early triggering of catch sensor #1 (see section 6). Preliminary analysis of the release depth for the same CCU on haul B03 indicated there had been another premature release, so this unit was removed from service and replaced with one of the “Old” mechanical units. However, later analysis revealed there was an error in the video time-stamp and it had in fact opened 6 minutes and 6 seconds later at the approximately correct depth of 114.3 m. All deployments of the “Old” mechanical protype releasers (version #1 and #2) failed to open at the correct target depths (150m and 100m, respectively). Instead, they all had a delayed opening at a range of 23.2 – 85.1m. During haul B06, in addition to releasing late, there was a leakage through the choke point formed by the CCU restrictor line, that led to an excessively large catch of 267 tonnes, compared to the target of 100 tonnes. During haul-back on hauls B05 and B11, the releaser again failed to open at its target depth and the restrictor rope broke at depths of 69.3m and 34.9m respectively, presumably due to the force of the expanding swim-bladder gases in the catch. Finally, no record of the release depth and time were made in haul 04, because the camera battery failed during this long haul (>11 hours).
An investigation by FossTech, after the research cruise, revealed that the premature release during haul B02 was caused by a mechanical failure inside the releaser. Further investigation showed that the late release of both version 1 units was due to lack of maintenance. Subsequent servicing and testing demonstrated that these units are now fully functional.
| Haul | Date | Catch Limitation Releaer | Status | Release Depth | |||
|---|---|---|---|---|---|---|---|
| Unit ID | additional rope | Target | Actual | Time (UTC) | |||
| TestHaul_01 | 23.03.2022 | #1 (A4:29) | No | OK | 120m | 118.2 | 21:53:54 |
| TestHaul_02 | 25.03.2022 | #1 (A4:29) | No | OK | 120m | 119.8 | 19:39:19 |
| Haul_01 | 26.03.2022 | #1 (A4:29) | No | OK | 200m | 202.1 | 23:07:22 |
| Haul_02 | 27.03.2022 | #1 (A4:29) | No | Premature release | 120m | 461.5 | 08:00:57 |
| Haul_03 | 27.03.2022 | #1 (A4:29) | No | OK | 120m | 114.3 | 21:01:27 |
| Haul_04 | 28.03.2022 | OLD #1 | No | No video | 150m | NA | NA |
| Haul_05 | 28.03.2022 | OLD #1 | No | Late & rope broken | 150m | 69.3 | 22:56:40 |
| Haul_06 | 29.03.2022 | OLD #1 | No | Leakage & late release | 150m | 23.2 | 09:56:31 |
| Haul_07 | 06.04.2022 | OLD #2 | 2 x 10mm nylon | Late release | 100m | 52.2 | 05:32:09 |
| Haul_08 | 06.04.2022 | OLD #1 | 2 x 10mm nylon | Late release | 150m | 39.1 | 11:58:26 |
| Haul_09 | 06.04.2022 | OLD #1 | 1 x 10mm nylon | Late release | 150m | 44.1 | 21:20:34 |
| Haul_10 | 07.04.2022 | OLD #1 | 1 x 10mm nylon | Late release | 150m | 85.1 | 18:33:52 |
| Haul_11 | 08.04.2022 | OLD #1 | 1 x 10mm nylon | Late & rope broken | 150m | 34.9 | 02:11:02 |
From cruises 1 and 2, there were 15 hauls that provided informative data on the relationship between catch size (volume and weight) and CCU position (table 5.1; figures 5.4 – 6). However, during cruise 2 there were six hauls that could not be used in analysis comparing CCU position with catch size. Four hauls were aborted because of CCU problems (hauls 2 and 3), poor catch rate (haul 4) or bad weather (haul 9). Unfortunately, haul 3 was aborted unnecessarily, because it was suspected that the CCU may have prematurely opened again. Haul 07 was deliberately time limited, for observations on the Bycatch Release Section (BRS; see section 8). Finally, haul 6 was known to have excess catch due a leak through the CCU choke point, so was also excluded from the analysis.
| Haul | Cruise | Position | Volume (m 3 ) | Catch Weight (tonnes) | ||||
|---|---|---|---|---|---|---|---|---|
| m from CE front | theoretical | actual | proportion | actual | target | Notes | ||
| A01 | 1 | 13.6 | 468.1 | 48.9 | 0.104 | 45.0 | - | |
| A02 | 1 | 25.1 | 747.5 | 217.4 | 0.291 | 200.0 | - | |
| A03 | 1 | 19.3 | 618.2 | 68.5 | 0.111 | 63.0 | - | |
| A04 | 1 | 25.1 | 747.5 | 135.9 | 0.182 | 125.0 | - | |
| A05 | 1 | 34.7 | 915.7 | 152.2 | 0.166 | 140.0 | - | |
| A06 | 1 | 34.7 | 915.7 | 87.0 | 0.095 | 80.0 | - | |
| A07 | 1 | 38.1 | 964.6 | 347.8 | 0.361 | 320.0 | - | |
| A08 | 1 | 45.9 | 1060.2 | 402.2 | 0.379 | 370.0 | - | |
| A09 | 1 | 25.7 | 758.2 | 54.3 | 0.072 | 50.0 | - | |
| A10 | 1 | 45.9 | 1060.2 | 358.7 | 0.338 | 270.0 | - | |
| B11 | 2 | 25.0 | 744.9 | 95.0 | 0.128 | 80.8 | 100 | |
| B01 | 2 | 35.0 | 920.7 | 241.0 | 0.262 | 190.4 | 250 | |
| B05 | 2 | 35.0 | 920.7 | 270.0 | 0.293 | 229.5 | 250 | |
| B10 | 2 | 45.0 | 1050.3 | 350.0 | 0.333 | 297.5 | 400 | |
| B08 | 2 | 45.0 | 1050.3 | 414.0 | 0.394 | 351.9 | 400 | |
| Unusable Data - known to be under/over limit | ||||||||
| B02 | 2 | 35.0 | 920.7 | 522.0 | 0.567 | 412.4 | 250 | ABORTED - premature release |
| B03 | 2 | 35.0 | 920.7 | 108.0 | 0.117 | 91.8 | 250 | ABORTED - suspected premature release |
| B04 | 2 | 45.0 | 1050.3 | 320.0 | 0.305 | 272.0 | 400 | ABORTED - too little catch |
| B06 | 2 | 25.0 | 744.9 | 314.0 | 0.422 | 266.9 | 100 | Leaking Choke Point |
| B07 | 2 | 45.0 | 1050.3 | 128.0 | 0.122 | 108.8 | !(400) | Time limited - BRS observation |
| B09 | 2 | 45.0 | 1050.3 | 324.0 | 0.308 | 275.4 | 400 | ABORTED - storm |
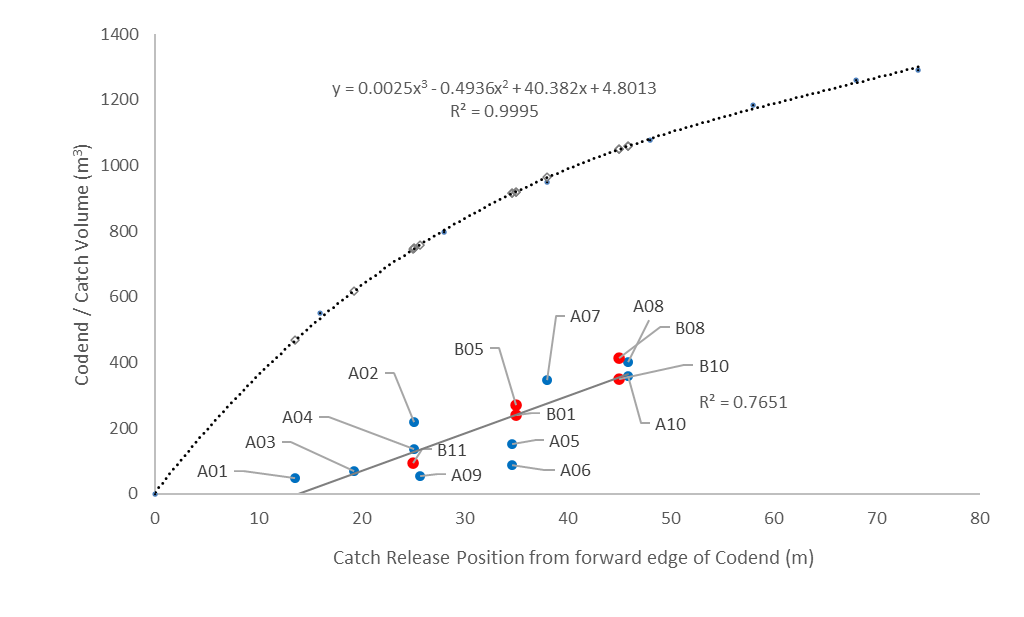
There was a significant relationship between CCU position on the cod-end and the actual catch (in tonnes) (t = 5.41; p < 0.001) (figure 5.4). Furthermore, there was no significant difference in the relationship for either cruise (t = -0.40; p = 0.6990). The relationship for the valid hauls from cruise 2 was far more consistent than for the cruise 1 data (R2: 0.9467 and 0.6415, respectively), likely because known problems with catch control were deliberately removed from the dataset. Indeed, the spread of the invalid hauls (open circles in figure 5.4) are at least as variable as the cruise 1 data. This suggests that the higher variation in cruise 1 may be the result of catch leakage and prematurely terminated hauls, which were not appreciated at the time.
![Figure 5.4 – The relationship between targeted catch size (tonnes) and the position (metres) of the CCU relative to the forward edge of the cod-end. Multiple linear regression analysis determined that catch size increased significantly the further aft the catch limitation releaser was positioned on the cod-end (t = 5.41; p < 0.001), while there was no significant difference between the relationships for either cruise (t = -0.40; p = 0.699). Blue dots show results from cruise 1 and red dots cruise 2. Open circles show hauls where problems with the releasers were experienced and are not included in the regression analysis. [Source: Ingolfsson et al, 2022].](/resources/images/nettrapporter/65908/file_html_57622ea0abe0b00.gif)
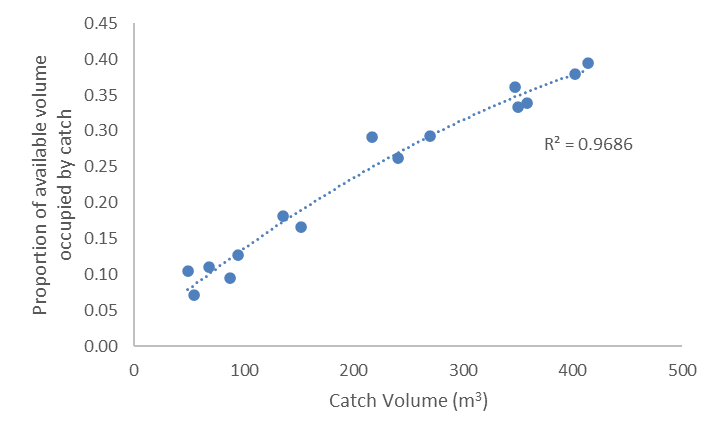
Finally, as anticipated, the resultant catch volume (and weight, see above), generally increased the further aft the CCU was positioned on the cod-end, as the theoretical volume of the receiving cod-end increased (figure 5.5). However, the resultant valid catch volumes only represented a small proportion of the corresponding theoretical cod-end volumes (range 0.072 – 0.394)(table 5.2). In addition, larger catch volumes generally occupied a higher proportion of the corresponding theoretical cod-end volume (figure 5.6), suggesting catch density increased with increasing catch size. One possible explanation for this observation is that larger cod-end volumes may allow higher densities of catch to accumulate before “excess catch” begins escaping from the openings in the FRS. This could be related to the increased time required to collect larger catches, which may increase the probability of fish becoming exhausted and falling back to the rear of the cod-end, as time progresses. This process could be verified by appropriate positioning of cameras and/or Trawl-Eye units along the cod-end. The increased density of catch may also have implications for the swim-bladder gases retained in the catch volume. Higher packing densities may make the fishes’ swim-bladders less likely to rupture during ascent, as well as increasing the likelihood of released gas retention within the interstitial spaces in the catch. In combination with the increased potential gas volume within large catches, this could increase the likelihood of excessively rapid cod-end ascent rates during haul-back.
6 - Catch monitoring technologies for determining when the cod-end is full
Objective 4 : Investigate the effectiveness of different catch monitoring technologies for determining when the cod-end is full:
i) Marport catch sensors;
ii) Marport Catch Explorer Sensor; and
iii) Marport Trawl Explorer Sensors.
This section presents the methods and observations from cruise 2 and then discusses these along with results from cruise 1 (Breen et al, 2021) to assess the effectiveness of these technologies for indicating when the codend is full. Note – in this section, hauls from cruise 1 and 2 are given the prefixes A and B, respectively.
6.1 - Materials & Methods
In addition to visual observations (sections 3, 4 and 5), the cod-end was equipped with several cod-end echosounders (CE-ES) (two Marport Trawl Explorer echosounders and one Marport Catch Explorer, with echosounder) on and around the FRS to indicate its dimensions and the distribution and density of the catch within it. In addition, four “catch sensors” (3 Marport Net Fill Sensors and a Marport Catch Explorer, with echosounder) to estimate what volume of catch contained inside the cod-end. In principle, as the cod-end filled, it would trigger each catch sensor in turn, starting with the sensor furthest aft (ahead of the CCU). When the catch sensor that was furthest forward was triggered (i.e. CS #4) this would indicate the cod-end was full, and any excess catch should now be exiting via the escape openings in the FRS. Alternatively, the CE-ES gives information about the density of the catch immediately beneath it, in this case in and below the FRS. A full cod-end should be indicated by high densities inside the FRS (i.e. red shading on the echogram image), and escaping fish should be seen as marks below the FRS (figure 6.1).
6.2 - Results & Discussion
With respect to determining when the catch limit had been reached, and excess catch was likely escaping via the openings in the Fish Release Section (FRS)(section 3), the combination of both the catch-sensors and the cod-end echosounders (CE-ES) proved informative.
In general, the catch sensors triggered as expected (in reverse order, ahead of the CCU position)(table 6.1). Therefore, a positive and constant signal from catch sensor #4, along with indications from the CE-ES images that catch was accumulating in and possibly escaping from the FRS, was taken as a definitive signal that the catch limit had been reached.
Catch sensor #1 was always positioned aft of the CCU, so should never trigger before the CCU had opened (i.e. typically >20 minutes after haul-back). However, early triggering events for CS#1 were observed on six hauls (i.e. A06, B01, B03, B04, B05 and B06; table 6.1), suggesting some catch was leaking past the choke-point formed by the CCU restrictor rope and accumulating at the end of the cod-end. This was confirmed during haul B06, when a camera was positioned to view CS#1 to assess its functionality (which was suspected at this stage) and observed catch collecting at that position, as well as the CS#1 unit being tensioned at 04:01, when the trigger signal was received by the vessel. A premature release of the CCU was known to have occurred during haul B02 (see section 5), however the CS#1 did not trigger. On examination after the haul, it was observed that this sensor was attached too loosely to the cod-end and its battery charge was very low. After these events, greater care was made to ensure the CS units were correctly attached to the cod-end and in a good state of charge, and close attention was paid to all trigger signals, particularly premature signals from CS#1.
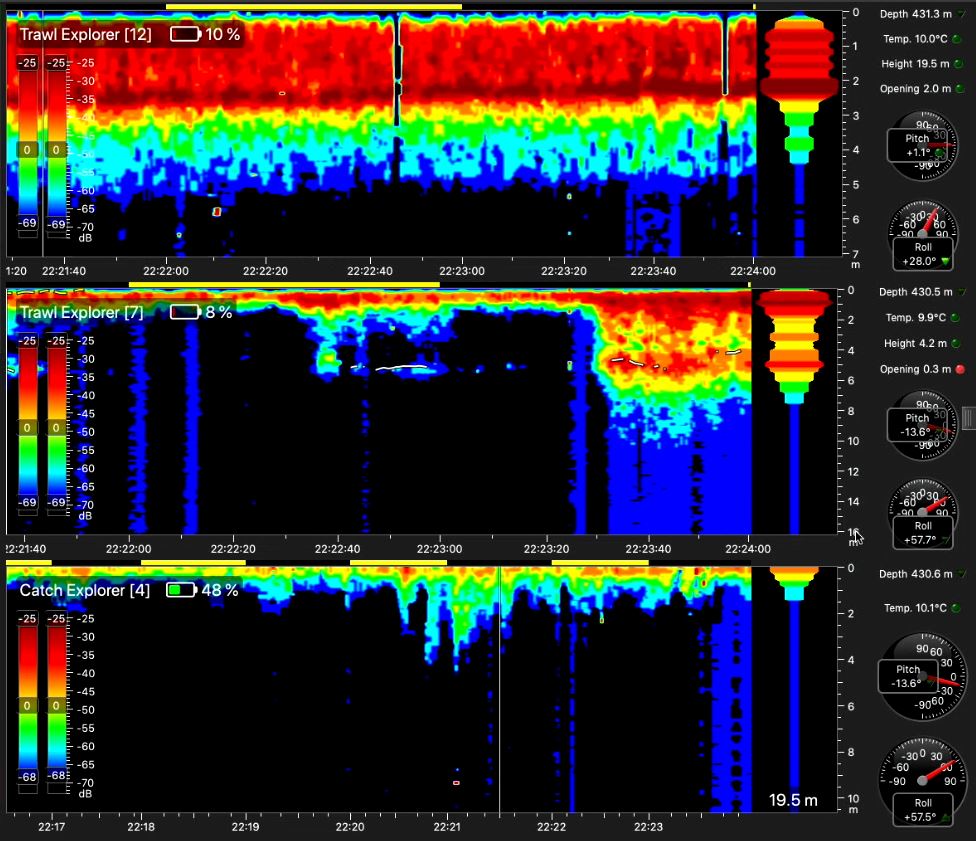
The CE-ESs consistently provided interpretable information on the density of catch in the FRS and when excess catch appeared to be escaping beneath the FRS, as well as the height of the FRS itself. During cruise 1, it was realised that this information was potentially very informative about when the catch limit had been reached, but the information was not systematically recorded at that time. However, in cruise 2, it was systematically recorded and demonstrated that information about the height of the FRS was particularly informative and reliable (table 6.1). In all catches that reached their end point (i.e. the catch limitation limit), the height of the FRS was substantially greater than the baseline height range (2.0-2.7m), with heights before hauling ranging from 2.9 to 5.0m. The other consistent signal from the CE_ES systems was an occluded signal from the CS#4 unit, because of the very high density of catch behind the FRS (figures 6.1 & 6.2). Indications that excess catch was passing out of the FRS were less consistent and reliable. Although camera observations indicated that escape rates had increased just prior to haul-back, in association with high catch densities inside the FRS (e.g. Haul B05 39-42 fish/minute compared to 14 fish/minute at periods of lower catch density earlier in the haul; figure 6.2), it was difficult to differentiate these signals as a definitive increase on the CE-ES echogram. Finally, the strength of the echogram density signal at the FRS was also inconsistent across the five hauls that did reach endpoint. However, it is notable that the two hauls with high density (i.e. B05 and B08) did have catches closer to their target (table 6.1), suggesting that maybe waiting a little longer for the catch density in the FRS to increase before beginning to haul-back would have increased the catch in hauls B01, B10 and B11.
In summary, the catch monitoring technologies were effective at determining when the codend was full, particularly when used in combination. Individually, each system had its limitations, for example the catch sensors failing to trigger and difficulty in interpreting some output from the CE-ES units. When combined, these multiple sources of information worked synergistically to give a less ambiguous signal that the codend was full. Furthermore, the potentially hazardous pre-mature release of the CCU in haul B02 (see section 5), highlighted the importance of having at least one correctly fitted and maintained CS unit positioned aft of the CCU to monitor for leakage and avoid excessively large catches.
| Haul | Fished to end point | Catch Weight (tonnes) | CCU position (m) | Catch Sensor (CS) Trigger Time | Heave Start Time | Cod-end Echosounder | Notes | ||||||||
|---|---|---|---|---|---|---|---|---|---|---|---|---|---|---|---|
| Target | Actual | #1 | #2 | #3 | #4 | Image Density | FRS Height | Fish under | |||||||
| at #4 | at FRS | Towing | As haul | ||||||||||||
| A01 | Y | 23 | 45 | 13.6 | NA | NA | NA | 13:26 | 13:40 | - | - | - | - | - | |
| A02 | Y | 130 | 200 | 25.1 | NA | NA | 19:15 | 22:28 | 22:28 | - | - | - | - | - | |
| A03 | Y | 76 | 63 | 19.3 | NA | 11:36 | NA | 11:23 | 11:39 | - | - | - | - | - | |
| A04 | Y | 130 | 125 | 25.1 | NA | NA | 19:33 | no | 22:43 | - | - | - | - | - | |
| A05 | Y | 218 | 140 | 34.7 | NA | 9:23 | no | 12:19 | 12:02 | - | - | - | - | - | |
| A06 | Y | 218 | 80 | 34.7 | 18:12 | 16:51 | no | 17:39 | 18:06 | - | - | - | - | - | |
| A07 | Y | 250 | 320 | 38.1 | NA | no | 22:14 | 0:48 | 0:39 | - | - | - | - | - | |
| A08 | Y | 322 | 370 | 45.9 | NA | 3:12 | 4:51 | 7:15 | 7:29 | - | - | - | - | - | |
| A09 | Y | 135 | 50 | 25.7 | 17:23 | 16:30 | 17:21 | 16:50 | 16:55 | - | - | - | - | - | |
| A10 | Y | 322 | 270 | 45.9 | 7:23 | 4:45 | 5:27 | 6:32 | 6:59 | - | - | - | - | - | |
| B01 | Y | 250 | 190.4 | 35.0 | 19:25 | 19:34 | 20:06 | 22:10 | 22:39 | Occl. | Med. | 2.1 ±0.2 | 4.6 | Y? | |
| B02 | N | 250 | 412.4 | 35.0 | NA | no | no | no | 14:12 | Low | Med. | 2.4 ±0.1 | 2.2 | Y? | ABORTED - premature release; CS#1 malfunction |
| B03 | N | 250 | 91.8 | 35.0 | 19:31 | 19:19 | no | no | 20:33 | Low | Low | 2.6 ±0.1 | 2.5 | N | ABORTED - suspected premature release |
| B04 | N | 400 | 272.0 | 45.0 | 1:40 | 5:26 | 5:09 | no | 11:04 | Low | Med. | 2.4 ±0.1 | 2.1 | Y? | ABORTED - too little catch |
| B05 | Y | 250 | 229.5 | 35.0 | 17:20 | 17:01 | 18:10 | 21:15 | 22:24 | Occl. | High | 2.7 ±0.4 | 4.2 | Y | |
| B06 | N | 100 | 266.9 | 25.0 | 4:01 | no | 4:12 | no | 9:24 | Low | Med. | 2.4 ±0.1 | 2.0 | Y? | Leaking Choke Point |
| B07 | N | na | 108.8 | 45.0 | 5:34 | no | no | no | 5:00 | na | Med. | 2.0 ±0.2 | 2.2 | Y? | Time limited - BRS observation |
| B08 | Y | 400 | 351.9 | 45.0 | no | 10:34 | 10:50 | 11:13 | 11:33 | Occl. | High | 2.7 ±0.2 | 5.0 | Y | |
| B09 | N | 400 | 275.4 | 45.0 | no | 15:58 | 16:23 | no | 20:48 | Med. | Med. | 2.3 ±0.1 | 2.2 | Y? | ABORTED - storm |
| B10 | Y | 400 | 297.5 | 45.0 | no | 15:26 | 15:42 | 17:36 | 18:07 | Occl. | Med. | 2.7 ±0.5 | 4.8 | Y | |
| B11 | Y | 100 | 80.8 | 25.0 | 2:13 | 2:12 | 22:25 | 0:59 | 1:39 | Occl. | Low | 2.3 ±0.2 | 2.9 | Y? | |
![Figure 6.2 – Images from video taken at 22:22 during haul B05, just before the start of haul-back at 22:24. Top: from position 5B look aft toward the fish-lock and cod-end, showing high densities of fish in the top of the FRS. Bottom: from position 4F, looking forward below the escape opening, with three fish escaping. Note – the escape rate at this time was approximately 42 fish/minute [22:22-22:23] and 39 fish/minute [22:24-22:25].](/resources/images/nettrapporter/65908/file_html_62cf683d8e073f46.png)
7 - Prototype Cod-end Pump Release mechanism
Objective 5 : Test a prototype mechanism for remotely releasing the cod-end from the fish-pump at a pre-determined “safety” depth.
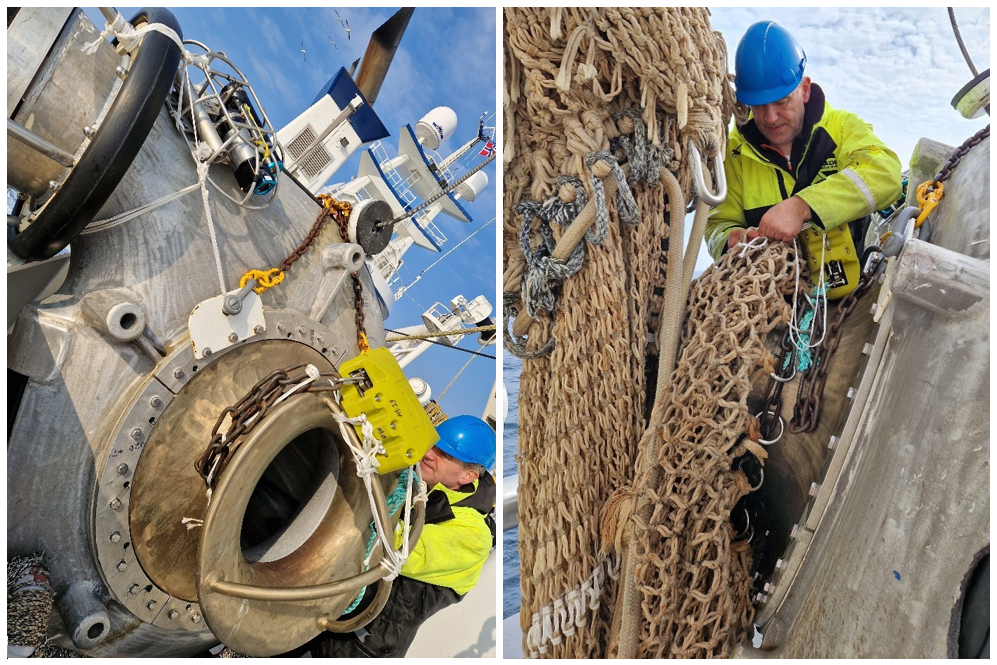
The most commonly used fish pumps by Norwegian fishing vessels are manufactured by Karm, Rapp Hydema and Seaquest. Current practice for coupling a pump-head to a cod-end is to use a chain (thickness 10mm; breaking strength 12 tonnes) wrapped around the cod-end skirt and pump-head funnel, and then locked with a shackle (figure 7.1). As a result, releasing the trawl cod-end from the fish pump on board the vessel can be time consuming, and can risk injury to the crew and damage to equipment. Unforeseen events during the pumping process can mean it takes a long time to empty the trawl cod-end. In the worst case, this can result in the catch losing buoyancy and the trawl cod-end sinking, with several hundred tonnes of fish inside. Such events can be extremely hazardous to the vessel and crew, as the safe working loads of deck equipment and cables can quickly be exceeded. To improve safety, as well as simplify the operation, the development of a quick-release coupling between the cod-end and pump has been proposed. This device should enable the remote release of the pump head from the cod-end skirt and should incorporate an auto-release function to ensure a safe-release when safe working loads are exceeded.
![Figure 7.1 - Left: the pump-head funnel; and Right: pump with pump skirt connected [Source: J. Saltskår].](/resources/images/nettrapporter/65908/file_html_10f0594b221f50b0.png)
7.1 - Materials and Methods
Normal pumping operations on Vikingbank to empty the catch from the trawl cod-end were as follows. When the trawl had been hauled in and the cod-end was at the stern of the vessel, the cod-end skirt (aft end) was hauled (using a dedicate dog-rope) to the port side of the stern, where the pump head was located. Here skirt was attached to the pump head and then they were both lowered back into the water. The fish pump used on "Vikingbank" was a Karm 18 inch pump, with a maximum capacity of >1800 m3 per hour, depending pumping depth and number of hydraulic pumps in operation.
While en route from Norway to the fishing grounds west of Ireland (24th & 25th March 2022), several preliminary trials were conducted to assess the effectiveness a FossTech prototype release mechanism. The Fosstech prototype pump releaser was based on the same electronic model (version 2) used on the trawl cod-end (see section 5), but was programmed to release if the pump-head exceed a pre-set maximum depth (in this case set to 30m). Additionally, the releaser could be initiated by use of the Bluetooth interface when the fish-pump was out of the water (although this was not functional during this cruise). There was minimum load for opening the releaser claw of 5-10Kg.
Seven separate tests were conducted, using two different releasers (#1: A4:29; and #2: 9E:27) (table 7.1), with four different configurations of rigging securing the cod-end skirt to the pump-head (figure 7.2). During each test, the releaser and securing line/rig assembly was attached to the pump head and then lowered by crane into the water to a depth exceeding the target releaser trigger depth of 30m. Each test was observed underwater using a camera (Tests A1, A2 & B1: GoPro 7; and all other tests: GoPro 5) paired with a Star-Oddi Starmon TD sensor (depth & temperature; D-0145), to determine when and at what depth the release occurred. A Marport depth sensor was also attached to the pump-head to give real-time depth readings during all tests (except test A1).
7.2 - Preliminary Results and Discussion
| Test | Rig | Test Description | Releaser | Release | Depth (m) | Notes | ||||
|---|---|---|---|---|---|---|---|---|---|---|
| Unit ID | Time | Release | Target | Max | ||||||
| A1 | 1 | Releaser on pump, without CE | A4:29 | NA | No release | 30 | 41.1 | GoPro 7 failed; triggered but failed to open | ||
| A2 | 1 | as above, with added weight | A4:29 | ? | ? | 30 | 40.4 | GoPro 7 failed - no observation of release | ||
| B1 | 1 | As above, with CE attached | A4:29 | ? | ? | 30 | 45.7 | GoPro 7 failed - no observation of release | ||
| B2 | 1a | As above, with ring for setting | A4:29 | 15:04:09 | 45.53 ? | 30 | 46.0 | Possibly triggered at 15:04:09; released at 15:06:12 | ||
| C1 | 2 | With Dynaema/ chain CE strop | 9E:27 | 09:41:29 | 20.93 | 30 | 43.0 | Premature release during descent. | ||
| C2 | 2 | With Dynaema/ chain CE strop | 9E:27 | NA | No release | 30 | 42.3 | Snagged on hammerlock in ring; soft eye caught in hook? | ||
| C3 | 3 | Dynaema only, with shackle | 9E:27 | NA | No release | 30 | 41.9 | Releaser did not fully open; release arm partially up. | ||
Test A1: 24th March 2022. The releaser and securing chain were fitted to the pump, without the cod-end skirt attached (figures 7.2 & 7.3a). The assembly was deployed to a maximum depth of 41.1m but failed to release. It was suspected that there was insufficient force on the locking jaw of the releaser to open it.
Test A2: again, the release mechanism and securing chain were fitted to the pump, without the cod-end skirt attached. But this time, the securing chain was manually tensioned (force unknown), and a weight (<5 kg) was attached. The assembly was deployed to a maximum depth of 40.4m and did release, but the time and depth of release were unknown because the GoPro 7 camera fitted to the pump-head failed to record. It was suspected that there was insufficient force on the locking jaw of the releaser to open it.
Test B1: this was the first trial with the cod-end skirt attached to the pump using the releaser and securing line/rig (figure 7.2a, rig 1; & 7.3b). The assembly was deployed to a maximum depth of 46.0m and again released, but the time and depth of release were unknown because the GoPro 7 camera fitted to the pump-head failed to record.
Test B2: the rig test in B1 was adapted to make it easier to tension the securing chain, by leading it through a ring fixed to a lug of the side of the release, and the same side as the releasing jaw (figure 7.2b). It was deployed to a maximum depth of 45.7m. From the video observations, the releaser appears to open at a 15:04:09, at a depth of 45.53m, just after being lifted from maximum depth. The cod-end skirt then released from the pump-head at 15:06:12 (depth 3.03m). It was suspected that there was still insufficient force on the releaser locking jaw to open at the target depth (30m). The required force was likely only achieved when the crane began to lift the assembly back to the surface. Once open, the securing chain appears to have failed to pass through the cod-end skirt rings and so the release from the pump-head was further delayed.
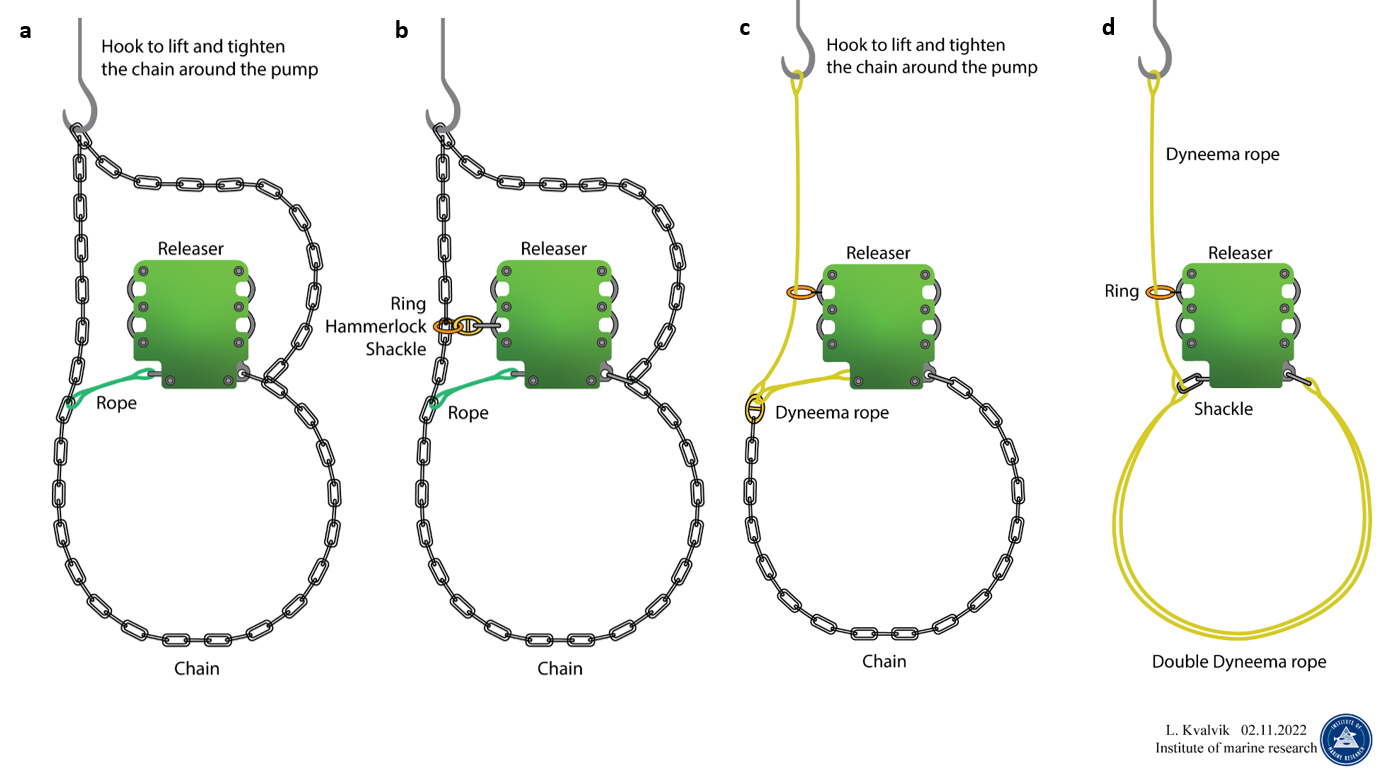
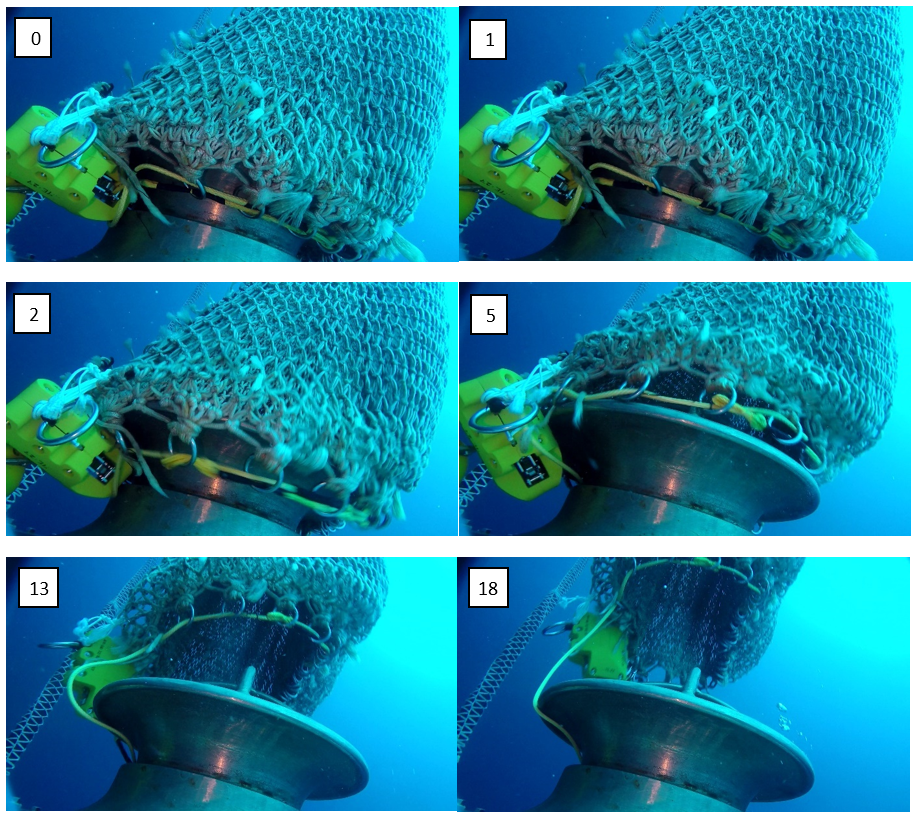
Test C1: 25th March 2022. Changed to releaser #2, because #1 had a poor blue-tooth connection during setup. To enable the end of the securing line that was fixed in the releaser jaw to pass more easily through the rings of the cod-end skirt, the rope with a shackle at the end (figure 7.2b; rig 1a) was replaced with Dynaema twine with a soft eye secured into the releaser jaw (figure 7.2c; rig 2). This appeared to work well on its first test, with the releaser opening at 09:41:29 (20.93m) during its ascent from a maximum depth of 43.0m (table 7.1). Note, the cod-end skirt was clear of the pump-head in <1 second (figure 7.4).
Test C2: this was a repeat trial with the same rig as test C1 (rig 2). The pump-head was deployed to a maximum depth of 42.3m but unfortunately the releaser failed to open (table 7.1). When the pump-releaser assembly was recovered and examined, it was observed that the soft eye was partially released from the releaser jaw (figure 7.5a). Moreover, the hammerlock linking the Dynaema twine to the securing chain was jammed in one of the rings around the cod-end skirt (figure 7.5b). In combination, these observations suggest that, because the securing line was not free to pass through the rings, there was insufficient force to fully open the releaser jaw when it was triggered to release. It was also suspected that the soft-eye in the Dynaema may have contributed to this lack of force by being to slip partially out of the releaser jaw.
Test C3: In this test, the securing chain was completely replaced with a doubled length of Dynaema twine, with a shackle at one end forming a hard-eye for inserting into the releaser jaw (figure 7.2d). It was conducted at the end of a test-haul 02. After the test-haul, the cod-skirt was attached to the pump-head, as would be done during normal fishing operations (see above). The pump-head was deployed to a maximum depth of 41.9m but unfortunately the releaser failed to open (table 7.1). When the pump-releaser assembly was recovered and examined, it was observed that the releaser jaw had not fully opened, with the releaser arm partially up. Detailed mechanical examination of the releaser unit provided no explanation for this failure, and again it was presumed there was insufficient force to open the releaser jaw fully.
------------------------------------------------------------------------
In summary, these trials have demonstrated that, in principle, it is possible to automatically release a trawl cod-end from the pump-head in less than 1 second (see test C1). This would be of great benefit to the fishing industry in situations where large catches rapidly lose buoyancy and present a hazard to the safety of the vessel and its crew. However, clearly it will be necessary to further develop the technologies incorporated in this release mechanism to ensure fail-safe reliability. Of the seven tests (five with cod-end attached), only four (three with cod-end attached) successfully released. Of the two releases where the depth of release was observed, one occurred prematurely at 21m during descent (test C1), while the other occurred after the target trigger depth of 30m and during the ascent, as the pump-head was hauled back towards the surface (test B2).
It was suspected that this delayed release and several of the failed releases were due to insufficient force being applied to the releaser jaw to enable it to open. It is recommended that a minimum load on the securing line/rig should not be assumed, because this load is likely to be dynamic and unpredictable due to variations in sea-state and the volume and state of buoyancy of the catch. Furthermore, while this mechanism has been developed specifically to address the problem of sinking cod-ends, we cannot fully appreciate the applications to which this technology may be applied before it is implemented in the industry. If a minimum load is an absolute requirement for the mechanics of the release mechanism, then a method for pre-setting the required tension in the securing line/rig should be devised and implemented. To facilitate this. a fail-safe securing line/rig that releases and passes unimpeded through the rings on the cod-end skirt should be developed. Based on the preliminary observations made during these trials, this should include an eye at the end of the securing line that is ridged enough to be securely held in the locking jaw of the releaser but is sufficiently flexible to pass unimpeded through the rings of the cod-end skirt. A dedicated wire with a tapered and whipped splice at the terminal end would likely satisfy these criteria. Alternatively, other methods of securing the cod-end skirt to the pump-head could be explored.
Based on the observations made during this cruise, Fosstech has made modifications to the shape of the releaser for better fit to the pump. They have also changed the opening of the hook attachment allowing a wider range of angles between the releaser and attached shackle reducing the risk of the rope/shackle getting stuck after release. It is recommended that this and other alternative prototypes should be fully tested and refined ashore before further trials are attempted on a research cruise.
8 - Effectiveness of a protype Bycatch Release Section (BRS)
Objective 6: Monitor the effectiveness of a protype Bycatch Release Section (BRS) during fishing and haul-back to:
a. release large bycatch animals (i.e. porbeagle and blue fin tuna);
b. with minimal unwanted release of the target catch (blue whiting).
During cruise 1, there were bycatches of two porbeagle (Lamna nasus) (IUCN status [NE Atlantic]: critically endangered) and/or four bluefin tuna (Thunnus thynnus) (IUCN status [Europe]: near threatened) in 40% (4 of 10) of hauls targeting blue whiting on the Porcupine Bank fishing grounds (Breen et al, 2021). In haul 05 of cruise 1, a bluefin tuna were observed to be caught in the trawl ahead of the fish release section (FRS), as it was heaved to the boat. The tuna remained in the water and was successfully released alive from the trawl by slipping it out of the escape opening in the FRS (Rig 2), suggesting that a FRS with large bottom openings could be further developed to reduce the bycatch of unwanted large species in the catch. To this end, a Bycatch Release Section (BRS) was designed and constructed by Årkrehamn Trawls, in collaboration with IMR, to be tested on this cruise.
8.1 - Materials and Methods
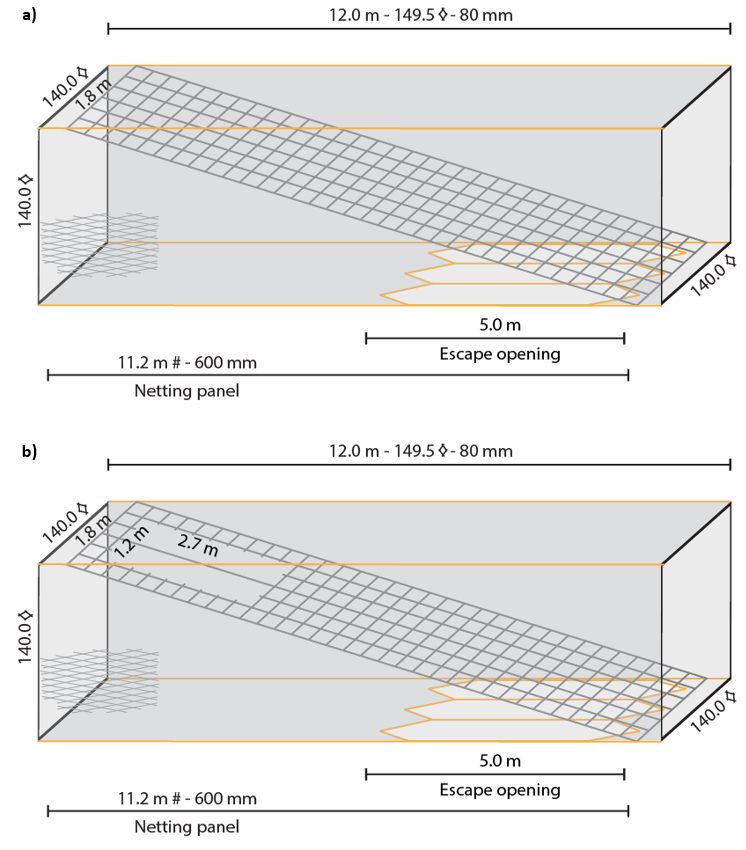
The Bycatch Release Section (BRS) was fitted immediately forward of the Fish Release Section (FRS) of the Catch Limitation System (figure 8.1). It consisted of a 12.0m long four-panel cylindrical section of 80mm diamond mesh netting, in the bottom panel of which were cut three 5.0m long hexagonal escape openings (figure 8.2a). Inside the FRS was an 11.2 long diagonal leading panel of 600mm (300 by 300mm) square mesh netting, set at an angle of approximately 16o (figure 8.2a). The BRS was fitted to the trawl during four hauls (table 2.1). Test hauls 1 and 2 were used to make video and trawl sonar observations of the FRS and BRS sections, to ensure they were fitted correctly. Haul 01 was the first behavioural observations with a live catch. Based on these observations modifications were made to the BRS, by cutting away a 1.2 by 2.7 m opening at the top end of the leading panel (figure 8.2b). This version was tested in haul 07.
8.2 - Preliminary Results and Discussion
When fitted to the trawl, the BRS appeared to be stable and adopt its designed geometry. However, it did appear to affect the vertical opening of the Catch Limitation Catch (CLS). During the test hauls and hauls 01 and 07, the vertical opening of the CLS during fishing was reduced by ~20% from ~2.5m to ~2.0m (table 2.2a; Trawl-eye #2), in comparison to other hauls. The vertical open of the BRS was typically ~3.1m during towing (table 2.2a; Trawl-eye #1).
Haul 01 demonstrated that a substantial proportion of blue whiting encountering the leading panel in the BRS was exiting via the escape openings (figures 8.4 & 8.5). Although the mesh openings in the leading panel were relatively large (300 by 300mm square), at the shallow angle (~16o) they were presented to the fish approaching the leading panel they would have had a projected vertical opening of only ~63mm. Based on this and the knowledge that blue whiting entering the cod-end tend to accumulate higher up, while the porbeagle observed in cruise 1 swam along the bottom of the cod-end (Breen et al, 2021), it was decided to cut a hole in the upper part of leading panel in an attempt to reduce the excessive loss of blue whiting from the BRS (figure 8.2b).
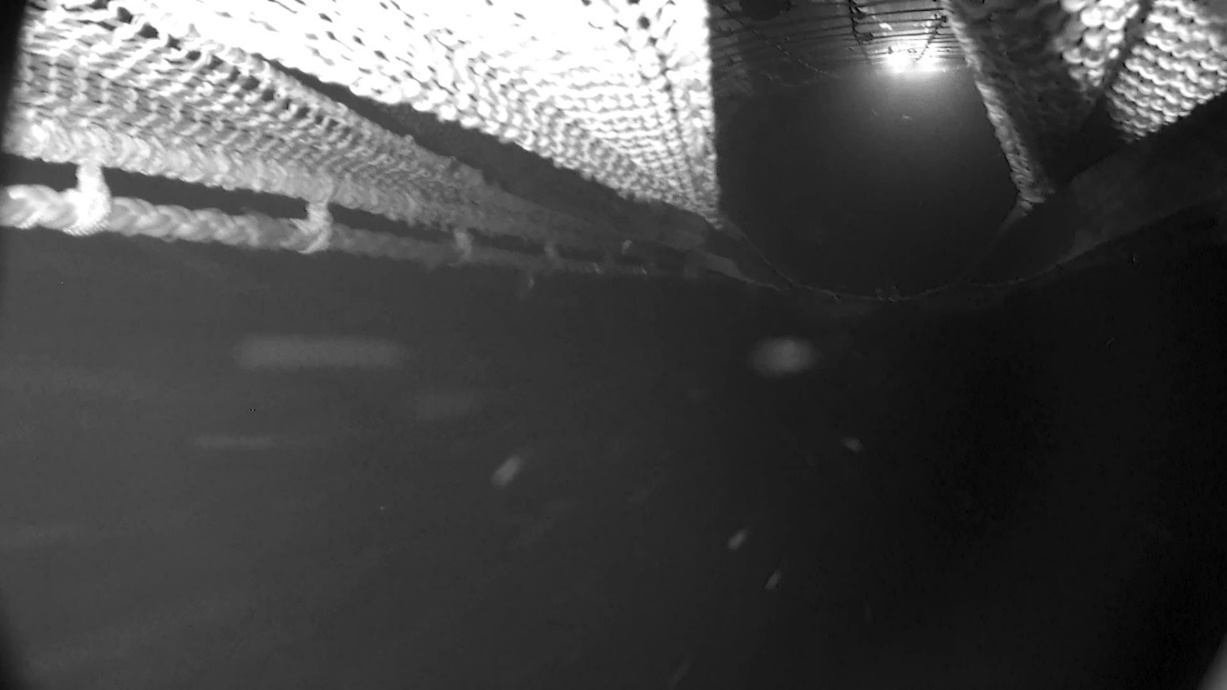
![Figure 8.4 – images from video early in haul 01 [18:46:02]: a) position 6oF, below the BRS escape opening, shows a substantial number of blue whiting escaping; while b) position 9iB, inside the BRS aft of the leading panel, shows few blue whiting passing through panel. For comparison, at this same time, escapes from the bottom opening in the FRS were only 7 fish per minute, but it was difficult to differentiate between fish exiting via the BRS and FRS, so this estimate could be less (position 2oF, not shown).](/resources/images/nettrapporter/65908/file_html_7dde860984ea5d75.png)
![Figure 8.5 – images from video later in haul 01 at higher catch densities [19:50:21]: a) position 6oF, below the BRS escape opening, shows a very substantial number of blue whiting escaping; while b) position 2oF, outside the bottom opening in the FRS, shows fewer blue whiting escapes. For comparison, the escape rate from the bottom opening in the FRS (position 2oF) at this time was approximately 30 fish per minute, but it was difficult to differentiate between fish exiting via the BRS and FRS, so this estimate could be less. Unfortunately, there was no video available inside the BRS at this time, because the camera at position 9iB stop recording at 18:46:10.](/resources/images/nettrapporter/65908/file_html_55dc7f2ed1fd6ee0.png)
Version 2 of the BRS, with the hole in the leading panel, was tested in haul 07. Video from the camera in position 7iF showed that there was a steady passage of fish through the opening in the leading panel (figures 8.6a-8.10a). However, from the available video of the escape opening (at position 6iF), it was not clear whether this modification had effectively reduced escape rates, because the view of the opening was often obscured during periods of high fish density. Although, it was clear at low and moderate fish densities, that fish were being guided into the lower half of BRS and towards the escape openings, with frequent escapes (figures 8.6b, 8.7b & 8.10b). At higher fish densities, sufficient numbers of fish were deflected by the panel onto the lower panel behind the escape openings to cause a blockage (figure 8.8b & 8.9b), presumably resulting in substantial escapes of fish ahead of the blockage. During their passage through the netting of the leading panel, most fish contacted the netting with sufficient force to cause the netting panel to deform at higher fish densities (e.g. figure 8.8b).
![Figure 8.6 - images from video inside the BRS early in haul 07 [03:10:47]: a) position 7iF, looking forward towards hole in leading panel; b) position 6iF (DarkVision camera), looking forward from behind the leading panel, with escape holes in bottom panel visible in the foreground. DarkVision camera operating without its own light during this period.](/resources/images/nettrapporter/65908/file_html_57bc8b30995ce736.png)
![Figure 8.7 - images from video inside the BRS early in haul 07 [03:36:25]: a) position 7iF, hole in leading panel allowing fish through in upper part of BRS; b) position 6iF (DarkVision camera), moderate fish density in front of panel with some fish passing through the lower panel, while a substantial proportion is deflected down and out of the escape openings. DarkVision camera operating without its own light during this period.](/resources/images/nettrapporter/65908/file_html_20bad5d70d39c188.png)
![Figure 8.8 - images from video inside the BRS early in haul 07 [03:51:42]: a) position 7iF, hole in leading panel allowing fish through in upper BRS; b) position 6iF, in contrast at higher fish densities the deflection of fish down the leading panel causes a blockage. DarkVision camera operating without its own light during this period.](/resources/images/nettrapporter/65908/file_html_b7321ecfa7a8ec23.png)
![Figure 8.9 - images from video inside the BRS early in haul 07 [04:02:32]: a) a) position 7iF, hole in leading panel allowing fish through in upper BRS; b) position 6iF, in contrast at higher fish densities the deflection of fish down the leading panel causes a blockage. DarkVision camera operating without its own light during this period.](/resources/images/nettrapporter/65908/file_html_77aaea1a25ef5cd.png)
![Figure 8.10 - images from video inside the BRS early in haul 07 [04:11:31]: a) position 7iF, hole in leading panel allowing fish through in upper BRS; b) position 6iF, moderately high fish density in front of panel with some fish passing through and frequently contacting the panel, while a substantial proportion is deflected down and out of the escape openings.](/resources/images/nettrapporter/65908/file_html_82925765bce56e4a.png)
At the end of haul 07, during hauling, there was an unexplained crowding event observed by camera positions 6iF and 7iF (figure 8.11). At 05:29, there was an accumulation of fish ahead of the upper part of the leading panel in the BRS (figure 8.11a & b). At this time there was a reduced water flow in the trawl, and it is assumed that these fish had been ahead of BRS at the end of the fishing tow. Within less than 30 seconds the view at camera position 6iF was obstructed by a mass of fish trapped inside a netting fold. If is unclear what part of the trawl is forming this netting fold, but it is thought unlikely to be the fish lock in the CLS (which did invert during this haul; see section 4) because this was 16m aft of this position, and the fish-lock netting panel has a maximum length of 11.64m. This type of event was not observed in haul 01.
No large bycatch species were observed escaping via the BRS during hauls 01 or 07.
![Figure 8.11 - images from video inside the BRS during hauling haul 07 [05:29:13]: a) position 7iF [05:29:13], fish accumulating at top of the leading panel; b) position 6iF [05:29:13], accumulation of fish at the top of the leading panel visible as speckles in the background; c) position 7iF [05:29:21], fish accumulating at top of the leading panel; and d) position 6iF [05:29:21], mass of fish trapped in netting behind the leading panel.](/resources/images/nettrapporter/65908/file_html_4cdbe531d347a00a.png)
In summary, the Bycatch Reduction Section (BRS) has the potential to release large bycatch species before they enter the cod-end, but none were observed escaping via the BRS during these observations. However, the BRS was observed releasing substantial proportions of the target catch, blue whiting, which would not be acceptable in commercial fishing operations. Attempts to improve the passage of fish in the upper part of the BRS by cutting a hole in the leading panel did work, but did not reduce the release of target catch through the escape openings to an acceptable level. Furthermore, the inclusion of the BRS reduced the vertical opening of the Catch Limitation System, which may have affected its functionality.
It is recommended that work continue with the development of the BRS for use in the blue whiting fishery. This work should consider increasing the size of the projected openings through the leading panel by increasing the mesh and/or angle of attack. The addition of a second, small mesh leading panel ahead of the escape openings, to guide the target catch over the escape openings should be considered.
9 - Monitoring trawl and cod-end geometry
Objective 7: Monitor Trawl and Cod-end Geometry during fishing operations, particularly during ascent, with depth sensors at set positions and using trawl geometry instrumentation (MarPort).
To improve our understanding of the causes of rapid and explosive cod-end ascents, and develop methods to avoid them, this project will be monitoring the geometry of several different trawls during fishing operations. This will inform us about ascent rates under different conditions, catch sizes and haul-back practices, from which mitigation measures, monitoring technologies and best practice can be developed.
9.1 - Materials and Methods
On this research cruise, the trawl was fitted with eight Star-Oddi Starmon TD (depth & temperature; D-#) and six Star-Oddi Starmon Tilt (depth, temperature & 3D-tilt; SXL-#) sensors (see figure 9.1 and table 9.1 for position details). Each sensor was protected inside a cylindrical steel housing, inside a webbing sheath (figure 9.2), with the exception of D-0137 which was housed inside the Furuno TS-331A Trawl Sonar housing. Details of trawl and trawl doors are provided in section 2.1.
In addition, a Star-Oddi Starmon TD (depth & temperature; D-0145) was fitted to the camera system used to observed the Cod-end Choker Release system, which was placed in one of three positions on the cod-end (see section 5).
| Sensor_ID | Position | Status | Down--loaded | Positions (with BRS) | Hauls T1, T2, 01 & 07 | Positions (no BRS) | Hauls 02-06 & 08-11 | ||||
|---|---|---|---|---|---|---|---|---|---|---|---|
| Separation (m) from | Distance (m) from | Separation (m) from | Distance (m) from | ||||||||
| CE_end | door | CE_end | door | CE_end | door | CE_end | door | ||||
| - | Codend_End | - | - | 0 | 2.4 | 0.0 | 934.4 | 2.4 | 0 | 922.4 | 0.0 |
| D-0145 | Choking Releaser | OK | var | var | var | var | var | var | var | var | var |
| SXL-0146 | CE1_Upper | OK | 11.apr.22 | 2.4 | 66.8 | 2.4 | 932.0 | 66.8 | 2.4 | 920.0 | 2.4 |
| SXL-0156 | CE1_Lower | OK | 11.apr.22 | 2.4 | 66.8 | 2.4 | 932.0 | 66.8 | 2.4 | 920.0 | 2.4 |
| D-0140 | CE2_Upper | Flooded | NA | 66.8 | 35 | 69.2 | 865.2 | 35 | 66.8 | 853.2 | 69.2 |
| D-0142 | CE2_Lower | Flooded | NA | 66.8 | 35 | 69.2 | 865.2 | 35 | 66.8 | 853.2 | 69.2 |
| SXL-0154 | CE3_Upper | OK | 11.apr.22 | 35 | 28 | 104.2 | 830.2 | 16 | 35 | 818.2 | 104.2 |
| SXL-0155 | CE3_Lower | OK | 11.apr.22 | 35 | 28 | 104.2 | 830.2 | 16 | 35 | 818.2 | 104.2 |
| SXL-0147 | CE4_Upper | OK | 11.apr.22 | 28 | 175.2 | 132.2 | 802.2 | 175.2 | 16 | 802.2 | 120.2 |
| SXL-0145 | CE4_Lower | OK | 11.apr.22 | 28 | 175.2 | 132.2 | 802.2 | 175.2 | 16 | 802.2 | 120.2 |
| D-0134 | MidTrawl_Upper | OK | 12.apr.22 | 175.2 | 204 | 307.4 | 627.0 | 204 | 175.2 | 627.0 | 295.4 |
| D-0138 | MidTrawl_Lower | OK | 12.apr.22 | 175.2 | 204 | 307.4 | 627.0 | 204 | 175.2 | 627.0 | 295.4 |
| D-0137 | Headline | Flooded | NA | 204 | 423 | 511.4 | 423.0 | 423 | 204 | 423.0 | 499.4 |
| D-0139 | FishingLine | OK | 12.apr.22 | 204 | 423 | 511.4 | 423.0 | 423 | 204 | 423.0 | 499.4 |
| D-0122 | Door | OK | 12.apr.22 | 423 | 0 | 934.4 | 0.0 | 0 | 423 | 0.0 | 922.4 |
![Figure 9.1 - Positions and Identity Code for depth sensors on the trawl. Detailed positions for the cod-end depth sensors are detailed in table 9.1. [Source: Liz Kvalvik].](/resources/images/nettrapporter/65908/file_html_7ef2be7bb6e91a46.png)
To support the depth profile data, supplementary data was collected from instruments on the bridge, including: milestone events times and positions during the fishing process (table 2.1); course and towing speed (Furuno GP-170 DGPS and GLONASS navigation system); trawl wire length and winch speed (Karmøy winch control system); trawl door spread and depth (Marport door spread and depth sensors); trawl mouth opening dimensions and shape (Furuno TS-331A Trawl Sonar); headline depth (Furuno TS-331A Trawl Sonar depth sensor); water depth (Furuno FSS-3BB and FCV-1900 echosounders); water current and direction (Furuno CI-88 ADCP); wind-speed and direction (Deif Malling anemometer); and wave height (visual estimate).
9.2 - Preliminary Results and Discussion
All sensors were recovered and data successfully downloaded from 13 out of the 16 fixed sensors. Sensors D-0140, D-0142 and D-0137 were all flooded. Analysis of this data is ongoing and will be reported later.
Depth data from the Cod-end Choke Releaser depth sensor (D-0145) is reported in section 5.
10 - Estimate blue whiting weight in seawater
Objective 8: Estimate the weight in seawater water of decompressed blue whiting.
When handling the catch at the surface and during pumping, it is an advantage if the fish in catch retain gas in their swim-bladders and/or abdomen. This ensures that the cod-end remains positively buoyant. However, there are anecdotal reports in the blue whiting fishery of catches losing buoyancy and cod-ends rapidly sinking, resulting in damage to pump and winch equipment and risk of injury to the crew on deck. To estimate the likely forces involves in such cod-end sinking events, we measured the weight of non-buoyant blue whiting in water.
10.1 - Materials & Methods
Samples of approximately 25 kg of blue whiting were taken from three RSW tanks (3.3, 1.3 and 2.1) on 30th and 31st March 2022, while the vessel was waiting to deliver catch in Killybegs. Each sample was then put into a net bag, supported on a metal hoop (figure 10.1) and weighted in air and in seawater using a Kern 50K50 electronic scale (Max: 50kg; resolution: ±0.05kg). Fish within the samples were individually measured for length and then had their abdomen was cut open and swim-bladder punctured, ensuring all gases were vented. The sample was then reweighed in air and seawater, as described previously.
Sample weights were corrected for the weight of the weighing bag in air (mean & 95% confidence interval: 4.43 ± 0.46kg) and in seawater (3.76 ± 0.25kg) and are summarised, with the mean individual fish length and weight, in table 10.1. Note – mean fish weights were not measured individually, but were estimated from the total weight in air divided by the sample size.
10.2 - Results & Discussion
On average, the sample weights in seawater were 3.3 ± 4.0% and 5.7 ± 4.6% of their weights in air, for non-vented and vented fish respectively (table 10.1). This implies that in a worse case, with a total loss of swim-bladder buoyancy, catch weights in water could be as high as 10.3% of their weight in air. For a large (1000 tonne) catch, this implies that an additional 103 tonnes (table 10.2) on top of the weight of the fishing gear in water. The safe working load (SWL) of the crane used to operate the pump on Vikingbank was 3.5 tonnes and the SWL for the trawl net drum and trawl winch was 90 and 2 x 61 tonnes respectively. Therefore, complete loss of swim-bladder gas buoyancy in the catch may present a substantial risk to the safety of the vessel during haul-back, and particularly during pumping.
However, the methods used to estimate these values were imprecise and prone to error. The samples “unvented fish” included fish that had been dead for several days, and in some cases clearly had ruptured abdominal cavities, implying they were already “vented”. Furthermore, while every effort was made to vent residual gases from the bodies of fish in the “vented” samples, it is very likely that there was residual gas in the bodies and interstitial spaces within the samples. This is reflected in the relatively wide confidence intervals for the weights in water.
| Tank | Fish Length (cm) | Weight (g) | Sample | Non-vented total weights (kg) | Vented total weights (kg) | |||||
|---|---|---|---|---|---|---|---|---|---|---|
| ID # | Mean | 95% CI | Mean | size | Air | Seawater | % in air | Air | Seawater | % in air |
| 3.3 | 28.54 | 0.69 | 202 | 121 | 24.45 | 1.01 | 4.14 | 25.10 | 1.96 | 7.82 |
| 1.3 | 28.00 | 0.54 | 190 | 131 | 24.90 | 0.31 | 1.26 | 26.35 | 1.21 | 4.60 |
| 2.1 | 28.74 | 0.57 | 206 | 124 | 25.50 | 1.01 | 3.97 | 24.00 | 1.11 | 4.64 |
| Mean | 28.43 | 199 | 24.95 | 0.78 | 3.12 | 25.15 | 1.43 | 5.69 | ||
| sd | 0.38 | 8 | 0.53 | 0.40 | 1.62 | 1.18 | 0.46 | 1.85 | ||
| 95%CI | 0.95 | 20 | 1.31 | 1.00 | 4.02 | 2.92 | 1.15 | 4.59 | ||
| Catch | Non-vented | Vented | ||||
|---|---|---|---|---|---|---|
| (tonnes) | Lower | Mean | Upper | Lower | Mean | Upper |
| 100 | -0.90 | 3.12 | 7.14 | 1.10 | 5.69 | 10.28 |
| 250 | -2.25 | 7.81 | 17.86 | 2.74 | 14.21 | 25.69 |
| 400 | -3.60 | 12.49 | 28.58 | 4.38 | 22.74 | 41.10 |
| 500 | -4.50 | 15.61 | 35.72 | 5.48 | 28.43 | 51.38 |
| 750 | -6.75 | 23.42 | 53.59 | 8.21 | 42.64 | 77.06 |
| 1000 | -9.00 | 31.22 | 71.45 | 10.95 | 56.85 | 102.75 |
In summary, this study has provided coarse estimates of the possible weight in water of blue whiting catches, if there was a complete loss of buoyancy from swim-bladder gases. In the worst case, weights in water could be as much as 10.3% of the catch weight in air. This additional weight could be hazardous to the vessel and its crew during haul-back and pumping phases of the fishing, if the safe-working load of winches, cranes and other lifting equipment is exceeded. However, the methods used to establish these estimates were imprecise and prone to error, so it is recommended that this work should be repeated to improve estimate accuracy and precision. An alternative method could estimate total body density for individual fish, which could then be scaled up to estimate total catch weights in water. This method could also assess whether there was an individual size related effect on body density and hence catch weight in water.
11 - Summary and Recommendations
In summary, this cruise has demonstrated that the catch limitation system can successfully limit catches in the blue whiting pelagic trawl fishery, with negligible loss during the fishing operation while effectively releasing excessive fish when the codend is full (sections 3 & 6),. This solution can significantly reduce the risk of burst codends and discarding of excess fish, thereby making the blue whiting fishery more sustainable and potentially profitable, through appropriate certification. However, further work is needed on an effective fish lock design (section 4) and a bycatch release system that does not release excessive target catch (section 6). The depth triggered releasers for reliable release of the codend choker also require further development and testing, which should include defining the optimal release depth (sections 5 & 9). In addition to catch limitation, this cruise also investigated the potential risk to the safety of the vessel and crew, during haul-back and pumping, by estimating the weight in water of the catch with total loss of swimbladder gas buoyancy (section 10). Also tested was a prototype method to mitigate this risk during pumping, by automating the release of the pump by a depth triggered releaser (section 7).
Fish Release Section (FRS) (Objective 1, Section 3): this cruise confirmed that there was a consistent behaviour pattern in blue whiting as they passed through the FRS; where they generally congregated in the upper part of the FRS at all observed fished densities. It was also demonstrated that the fish release section (FRS) used in this cruise functioned as per design. It permitted free passage of the catch into the cod-end during the normal fishing operation, while releasing any excess catch ahead of the cod-end through the purposely designed openings, once the codend was full.
Fish Lock (Objective 2, Section 4): the fish lock design tested on this cruise (type 2) allowed unrestricted passage of target catch into the cod-end during fishing. However, this design was unsuccessful in retaining the catch when the codend was full, with the fish lock spilling forward and extruding through the bottom escape opening in the Fish Release Section (FRS). It is suspected that the ropes connecting the constrictor ropes to the selvedges of the FRS were incorrectly attached and it is recommended that this worked should be repeated using modified rigging.
Codend Choking Unit (CCU) (Objective 3, Section 5): there was a clear and predictable relationship between the position of the CCU on the codend and the resultant catch, when the haul went to completion (Objective 3a). However, the resultant catch volumes only represented a small proportion of the corresponding theoretical cod-end volume. Moreover, larger catch volumes generally occupied a higher proportion of the corresponding theoretical cod-end volume, suggesting catch density increased with increasing catch size. It is recommended that this phenomenon is further investigated to better understand the underlying mechanisms, because if it is density related it could influence the likelihood of excessively rapid cod-end ascent rates during haul-back. The CCU release at the correct target depth in some hauls (Objective 3b), however there were several releases at incorrect depths for both the electronic and mechanical prototype CCU units. An investigation by FossTech, after the research cruise, revealed that the premature release during haul B02 was caused by a mechanical failure inside the releaser, while the late release of both version 1 units was due to lack of maintenance. Subsequent servicing and testing demonstrated that these units are now fully functional. Due to the uncertainty in release depth during the cruise no attempt was made to investigate the effect of release depth (120m vs 200m) on ascent rate and dynamics (Objective 3c).
Catch monitoring technologies (Objective 4, Section 6): the catch monitoring technologies were effective at determining when the codend was full, particularly when used in combination. Individually, each system had its limitations, for example the catch sensors failing to trigger and difficulty in interpreting some output from the CE-ES units. When combined, these multiple sources of information worked synergistically to give a less ambiguous signal that the codend was full. Based on the potentially hazardous pre-mature release of the CCU in haul B02 (see section 5), it is strongly recommended to have at least one correctly fitted and maintained CS unit positioned aft of the CCU to monitor for leakage and avoid excessively large catches.
Codend Pump Release Mechanism (Objective 5, Section 7): these trials have demonstrated that, in principle, it is possible to automatically release a trawl cod-end from the pump-head in less than 1 second (see test C1). This would be of great benefit to the fishing industry in situations where large catches rapidly lose buoyancy and present a hazard to the safety of the vessel and its crew. However, observations during this cruise have shown it will be necessary to further develop the technologies incorporated in this release mechanism to ensure fail-safe reliability (see section 7 for detailed recommendations).
Bycatch Release Section (BRS) (Objective 6, Section 8): the Bycatch Reduction Section (BRS) has the potential to release large bycatch species before they enter the cod-end, but none were observed escaping via the BRS during these observations. However, the BRS was observed releasing substantial proportions of the target catch, blue whiting, which would not be acceptable in commercial fishing operations. Attempts improve the passage of fish in the upper part of the BRS by cutting a hole in the leading panel did work, but did not reduce the release of target catch through the escape openings to an acceptable level. Furthermore, the inclusion of the BRS reduced the vertical opening of the Catch Limitation System, which may have affected its functionality. It is recommended that work continue with the development of the BRS for use in the blue whiting fishery (see section 8 for detailed recommendations).
Trawl and Codend Geometry (Objective 7, Section 9): to improve our understanding of the causes of rapid and explosive cod-end ascents, and develop methods to avoid them, the geometry of used in this cruise was monitored using various instrumentation fitted to the trawl, including depth sensors. Analysis of this data is ongoing and will be reported later.
Weight in seawater of decompressed blue whiting (Objective 8, section 10): this study has provided coarse estimates of the possible weight in water of blue whiting catches, if there was a complete loss of buoyancy from swim-bladder gases. In the worst case, weights in water could be as much as 10.3% of the catch weight in air. This additional weight could be hazardous to the vessel and its crew during haul-back and pumping phases of the fishing, if the safe-working load of winches, cranes and other lifting equipment is exceeded. However, the methods used to establish these estimates were imprecise and prone to error, so it is recommended that this work should be repeated to improve estimate accuracy and precision.
Camera and Light Systems (Appendix A): underwater observations using the various camera systems deployed on this cruise have been essential. In particular, the introduction of the prototype “DarkVision” showed great potential and versatility as an observation tool. It is recommended that this system is further developed and that several unts are manufactured and available for the next research cruise. As noted after cruise 1, having multiple perspectives at the same time can be very informative and synergistic when interpreting complex operations, like the catch control processes described in this report. It is recommended that this methodology is further developed, with pre-determined fixed positions for replicated observation. This should be facilitated by ensuring sufficient numbers of reliable camera systems are available for deployment on every haul.
12 - Acknowledgments
This cruise was jointly funded by the Norwegian Fisheries Directorate (Fiskeridirektoratet), the Norwegian Seafood Research Fund [Fiskeri- og havbruksnæringens forskningsfinansiering; FHF] and the Institute of Marine Research (IMR) as part of the Catch Control in the Blue Whiting Fishery [Fangstkontroll i fisket etter kolmule] FHF project number 901542. The project and authors are also grateful to the governments and authorities of Ireland and the United Kingdom for granting permission to conduct this research in their territorial waters.
The authors are very grateful to the skipper (Anders Klovning), the Chief Engineers (Mats Mikkelsen and Hans Inger Osthus) and crew of MF Vikingbank, who were very supportive and resourceful throughout the cruise. The catch control rigs were designed in collaboration with industry representatives and manufactured by Åkrehamn Trålbøteri AS (rigs 1 and 3) and Egesund Trål AS (rig 2).
We also thank our colleagues Shale Rosen, Manu Sistiaga and Terje Jørgensen for their advice and input in preparation for the cruise.
13 - References
Breen, M., Saltskår, J., Hannaas, S., Kvalvik, L., Ingólfsson, I.O. and Dagfinn Lilleng, D. 2021. Catch Control in the Blue Whiting Pelagic Trawl Fishery. Havforskningsinstituttet Toktrapport nr 13-2021 (English Version). ISSN 1503-6294.
Ingólfsson, Ó.A., Totland, B., Humborstad, O.-B., Kvalvik, L., Myroldhaug, J. and Foss, B. 2018. Utvikling og erfaringer med sekkeåpner (Development and testing of an automatic codend releaser). Rapport fra Havforskningen 2-2018. In Norwegian. ISSN 1893-4536
Ingólfsson, Ó.A., Humborstad, O.-B., Ferter, K., and Rosen, S. 2021a. Development and evaluation of dynamic catch control devices in the demersal seine fisheries for cod (Gadus morhua). J. Ocean Techn. 16 (2), 93–106.
Ingólfsson, Ó .A., Jørgensen, T., Sistiaga, M., and Kvalvik, L. 2021c. Artificial light improves size selection for northern shrimp (Pandalus borealis) in trawls. Can. J. Fish. Aquat. Sci. 78 (12), 1910–1917. doi: 10.1139/cjfas-2020-0458
Ingólfsson, Ó .A., Breen M, Rosen S, Sistiaga M, Jørgensen T, Lilleng D, Saltskår J, Kvalvik L, Hannaas S and Pettersen H. 2022. A catch limitation device to avoid excessive catches in the blue whiting (Micromesistius poutassou) Northeast Atlantic pelagic trawl fishery. Front. Mar. Sci. 9:1011862. doi: 10.3389/fmars.2022.1011862
Kvalvik, L. & Lilleng, D. 2019. Fangstregulerende tiltak i fiske etter kolmule. Toktrapport fra MS Vikingbank. 11-19 mars 2019. Havforskningsinstituttet og Fiskeridirektoratet.
14 - Appendix A – Notes on underwater camera and light operation and positioning
For filming the catch limitation system, and other systems being tested, up to five cameras were mounted in various locations (Table A1 and Figures A1 & A2). The cameras were deployed to provide information on fish behaviour and the functioning and geometry of the various components of the catch limitation system (fish release section, fish lock, choking unit) but the study was not designed to collect camera data for quantitative analyses (repeated deployment in the same positions for replicate measurements across hauls). Different camera systems were used: GoPro Hero and an in-house, bespoke, low-light sensitive programmable camera, “DarkVision”. The cameras were encased in “B-group” 1500 m rated water-proof housings and fitted into bespoke protective steel “dome frames”.
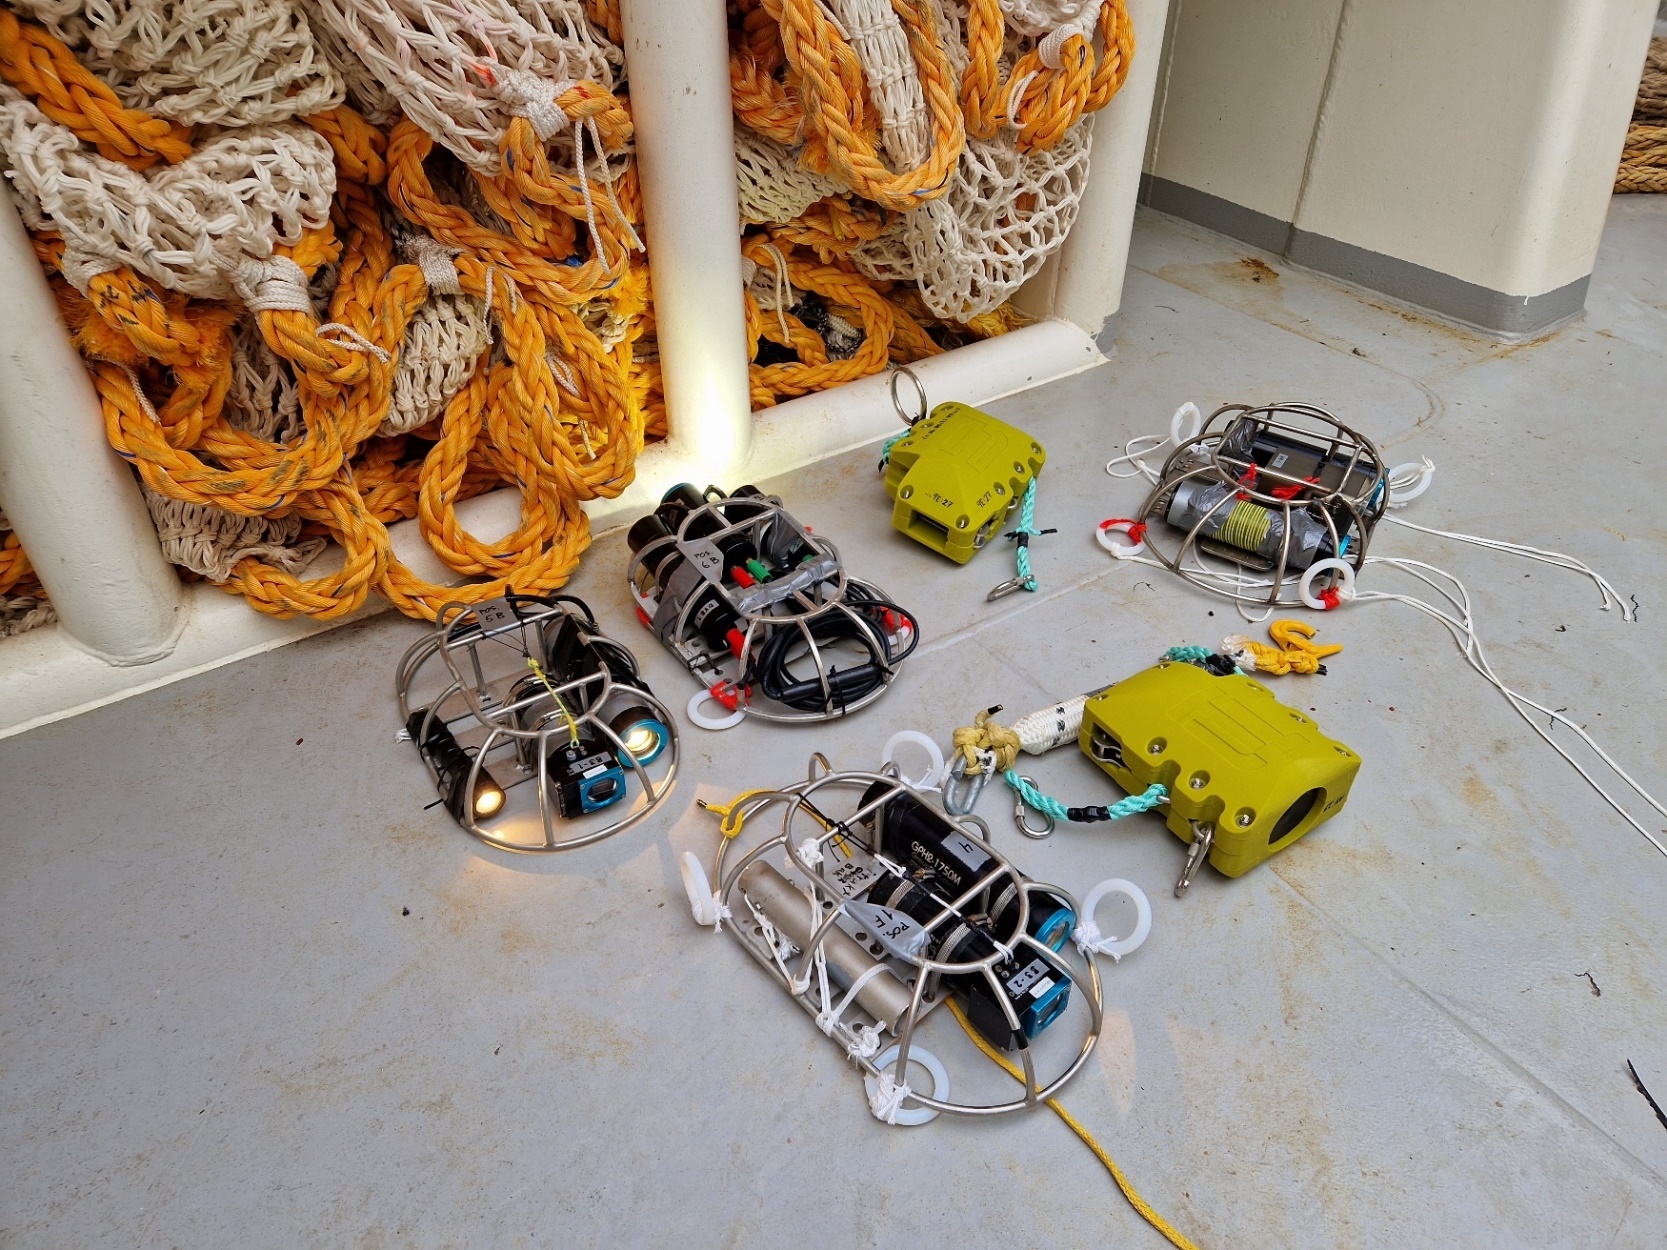
There was a total of 49 underwater camera deployments during 13 hauls (2 test & 11 fishing hauls), of which there were 42 (86%) successful and complete observations, 5 (10%) partial/incomplete observations and 2 (4%) failed deployments (see table A1 for details). In addition, there were two minor leaks of the B-group housings (hauls 7 & 8), but this did not damage the cameras or recordings. This is substantial improvement over the 2021 cruise were there were 21 (55%) successful and complete observations, 7 (18%) partial/incomplete observations and 10 (26%) failed deployments. The single most common failure (4 out of 7) was premature shutdown or failure to record in the DarkVision cameras. The cause of this failure is unknown and should be resolved as this camera system is further developed. Otherwise, the “DarkVision” camera proved to be very versatile and robust, and it is recommended that this system should be further developed and more units manufactured for deployment in future research cruises. During Haul 04, which was particularly long (>11 hours), the GoPro cameras stopped recording due to full memory cards. This was resolved in future hauls by reducing the recording resolution in the GoPro cameras to reduce storage requirements. It should be noted, however, that the DarkVision system deployed at the same was still recording at the end of the haul. The minor housing leaks in Hauls 7 & 8 were resolved by replacing the O-rings in the leaking housing.
During Haul 02, a dome frame was badly crushed as it was brought on deck over the stern of the boat. Despite this the camera, batteries, lights and housings were undamaged, apart from minor scratches. These frames enable the deployment of a very robust and versatile camera/light rig, which is ideally suited for the challenging conditions encountered in this fishery. Although, because of the necessarily low-profile of the frame, the camera has a limited perspective (only approximately half-view) when attached to a closed/small mesh netting panel (see below for further discussion). It is recommended future research cruise have at least six “dome-frames” to maximise camera placements and/or optimise turn-around times.
Having multiple perspectives at the same time can be very informative and synergistic when interpreting complex operations, like the catch control processes described in this report. For example, a sudden increase escape rates at position 2F, may be explained by an increase in fish density at position 5iB; which in turn could be explained by either an increase in density at 3iB, as the cod-end fills, or because of a failure in the fish lock during hauling. It is recommended that future work in this project should utilise multiple and synergistic camera positions in each haul to answer specific pre-determined research questions. This will require a substantial increase in the camera and light equipment required for each cruise (see comments above) to ensure coverage and redundancy. However, caution should be used not to overload one area of the net with too many cameras because this could distort the net.
The underwater lights used on this cruise were Brinyte DIV01V LED diving lights, which have 120° beam angles and were deployed inside aluminium housings, with a depth rating of >500 m. “Red” lights were used for filming in 20 of the 22 hauls primarily for behavioural observations (Table A1). The rational for this was that blue whiting are monochromatic (i.e. have only one visual pigment) with a peak spectral sensitivity at 491 nm and none for wavelengths above ~600 nm (Douglas et al., 1995) and are therefore unlikely to detect “red” light (i.e. ~620 to 750 nm). The “red” lights we used had ~635 nm mean wavelength, ranging from approximately 590 to 660 nm (see Ingólfsson et al., 2021c for specifications). It appears that blue whiting were blind to the red light used here, or at least did not respond adversely. That is, there was no evidence of phototaxis; i.e. no rapid or well-define changes in behaviour/swimming direction when fish enter the light field. Furthermore, on several occasions fish were observed inadvertently swimming into the camera/light assembly, apparently unable to see/avoid it. However, red light is rapidly attenuated in water so is a poor illumination source at ranges greater than 2m. The use of cameras more sensitive to “red” light (i.e. DarkVision) and/or additional red lights on subject area did improve recorded images. In particular, localised, oblique illumination of a subject area reduces loses due to attenuation (i.e. reduces the distances the photons travel from source, to subject to camera). However, backlighting with red light did not work, because the receiving camera was effectively blinded by the high contrast.
“ White” lights (wavelengths from 420 to 750 nm) were used during test-hauls 1 & 2 and haul 07. Although white lights are more likely to influence fish behaviour, they provide wavelengths that have less attenuation, increasing visual range, and are therefore better suited for visual observations of the fishing gear.
Figure A2 – Camera positions on the Catch Control Rigs and Cod-end. Post-script F means the camera was forward facing (toward the mouth of the trawl) and post-script B means the camera was backwards facing (towards the cod-end). The red shaded triangles provide an approximate indication of the illuminating light field in some example positions. See sections 3, 4, 5 and 8 for further explanation of the fishing gear components.
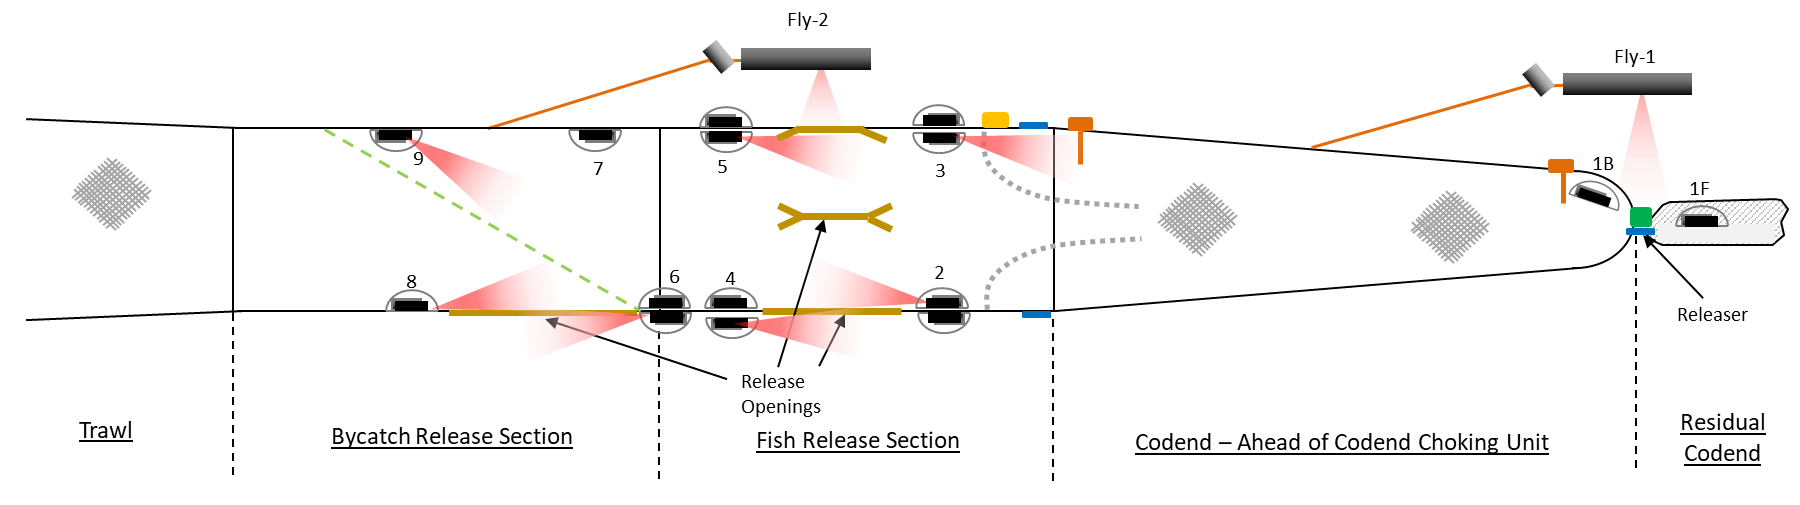
Table A1 – Overview of camera deployments and observations by haul. Partially successful deployments are highlighted in light grey; and failed deployments highlighted in dark grey. Camera types included GoPro Hero 3+ (H3#), Hero 5 (H5#), Hero 7 (H7#), Hero 9 (H9# and the in-house bespoke “DarkVision” (DV#).
| Haul | Objectives | Position | Position | Camera | Lights | Notes |
|---|---|---|---|---|---|---|
| Test_01 | 3 | 1oF | 1F | H71 | white | Release observed |
| 6 | 8iB | 9B | DV1 | white | - too heavy, needs float. Could see mostly net | |
| 2 | 2iB | 11B | H91 | white | looking back towards fish lock | |
| Test_02 | 3 | 1oF | 1F | H52 | white | Release observed |
| 6 | 9iB | 12B | H91 | white | Looking back and down guiding panel | |
| 1, 2, (4) | 5iB | 5B | H51 | white | Looking back onto top opening and fish lock | |
| 1, 2, 4 | 4iB | 6B | DV1 | white | NO DATA RECORDED | |
| Haul_01 | 3 | 1oF | 1F | H52 | red | Release observed |
| 1, (2), 4 | 2oF | 4F | H51 | red | Fish lock emerges during haulback. Associated with some escapes | |
| 6 | 9iB | 12B | H91 | red | Power bank disconnected, only 1,5 hours recording. | |
| 6 | 6oF | 7F | DV1 | red | - No bycatch observed escaping | |
| Haul_02 | 3 | 1oF | 1F | H51 | red | Release observed |
| 1, 2, (4) | 5iB | 5B | H92 | red | Video downloaded | |
| 1, (2), 4 | 2iF | 11F | DV1 | red | Frame badly crushed. Battery canister scratched. Camera OK, but recording ends before hauling. | |
| Haul_03 | 3 | 1oF | 1F | H51 | red | Release observed |
| 1, 2, (4) | 5iB | 5B | DV1 | red | - mostly low to medium density - occasional high densityperiods | |
| 1, (2), 4 | 2iF | 11F | H92 | red | - no mass escapes during fishing - No signs of the CE being full or losing excess catch during haulback | |
| Haul_04 | 3 | 1oF | 1F | H51 | red | Memory full before end of haul => did not capture release time/depth |
| 1, 2, (4) | 5iB | 5B | DV1 | red | Video downloaded | |
| 1, (2), 4 | 2oF | 4F | H92 | red | Memory full before end of haul => incomplete observations | |
| Haul_05 | 3 | 1oF | 1F | H51 | red | Release observed |
| 1, 2, (4) | 5iB | 5B | DV1 | red | - Very high density observed - slot fully open during haulback, with massed escape | |
| 1, (2), 4 | 2oF | 4F | H92 | red | - no mass escapes during fishing - FishLock emerges from opening | |
| Haul_06 | 3 | 1oF | 1F | H51 | red | - Release observed - too close, view obscured |
| (3), 4 | CS1 | FS1 | H33 | red | View catch sensor #1 to assess functionality | |
| 1, 2, (4) | 5iB | 5B | DV1 | red | - shut down before end of haul => Incomplete observations | |
| 1, (2), 4 | 2oF | 4F | H92 | red | - no mass escapes during fishing - No evidence of Fisklock reversing, but fish escapes during haul-back when flow reverses | |
| Haul_07 | 3 | 1oF | 1F | H51 | white | Release observed |
| (3), 4 | CS1 | FS1 | H33 | white | - SMALL LEAK => video successfully downloaded | |
| 6 | 7iF | 12F | H92 | red | - Blue whiting observed passing through hole in panel - video downloaded | |
| 6 | 6iF | 6F | DV1 | red | - No bycatch observed escaping | |
| Haul_08 | 3 | 1oF | 1F | H51 | red | - Release observed - Small leak => Camera was still recording. |
| (3), 4 | CS1 | FS1 | H34 | red | Observe catch arrive at releaser close to surface | |
| 1, 2, (4) | 5iB | 5B | DV1 | red | - camera stopped before haul back => Incomplete observations | |
| 1, (2), 4 | 2iF | 11F | H92 | red | SD Card corrupted - all video data lost | |
| Haul 09 | 3 | 1oF | 1F | H52 | red | Release observed |
| (3), 4 | CS1 | FS1 | H34 | red | video downloaded | |
| 1, 2, (4) | 5iB | 5B | DV1 | red | video downloaded | |
| 1, (2), 4 | 2iF | 11F | H91 | red | - no mass escapes during fishing - Dense periods with increased escape rates - Fish lock reverses & emerges from FRS opening as taken on deck | |
| Haul 10 | 3 | 1oF | 1F | H52 | red | Release observed |
| (3), 4 | CS1 | FS1 | H34 | red | video downloaded | |
| 1,2,3,4 | 5iB | 5B | DV1 | red | video downloaded | |
| 1, (2), 4 | 2iF | 11F | H91 | red | - no mass escapes during fishing - Dense periods with increased escape rates - Fish lock reverses & oscillates back and forth when near/on surface - Fish lock emerges from FRS opening when taken on deck | |
| Haul 11 | 3 | 1oF | 1F | H52 | red | - Release observed - releaser rope broke at depth |
| (3), 4 | CS1 | FS1 | H34 | red | video downloaded | |
| 1, 2, (4) | 5iB | 5B | DV1 | red | - high density observed ~30 min before haulback. - observe slot in top panel opening as fish-lock pushes forward. | |
| 1, 2, 4 | 4iB | 6B | H91 | red | - no mass escapes during fishing - Fish lock reverses & oscillates back and forth when near/on surface |
15 - Appendix B – Trawl Drawings
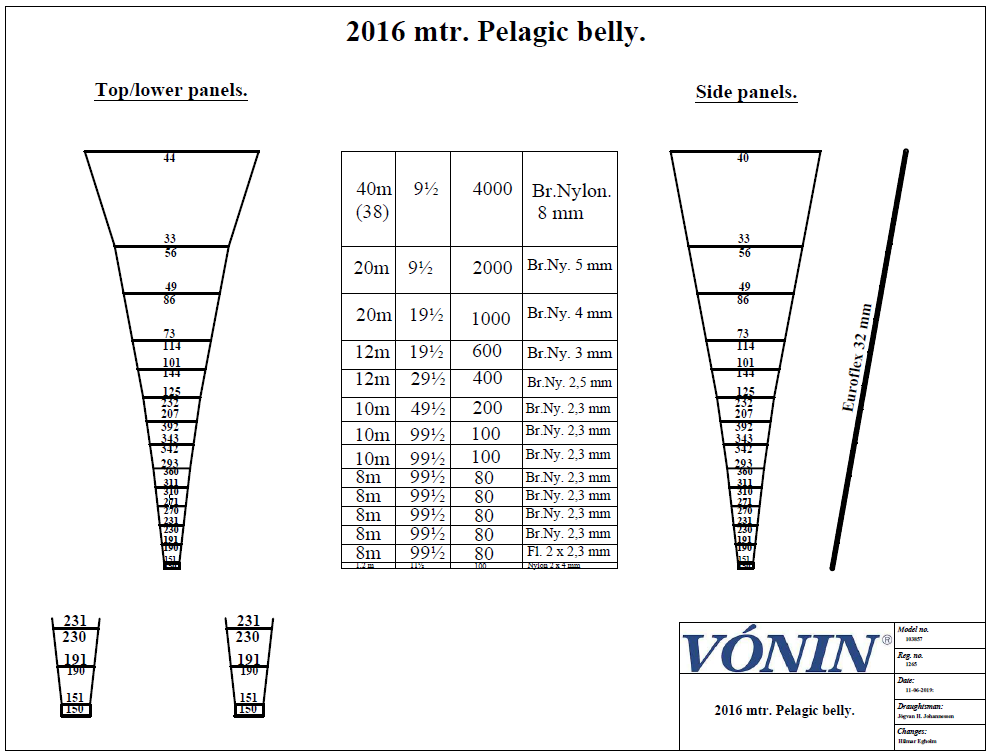
16 - Appendix C – Fish Release Section – Net drawing
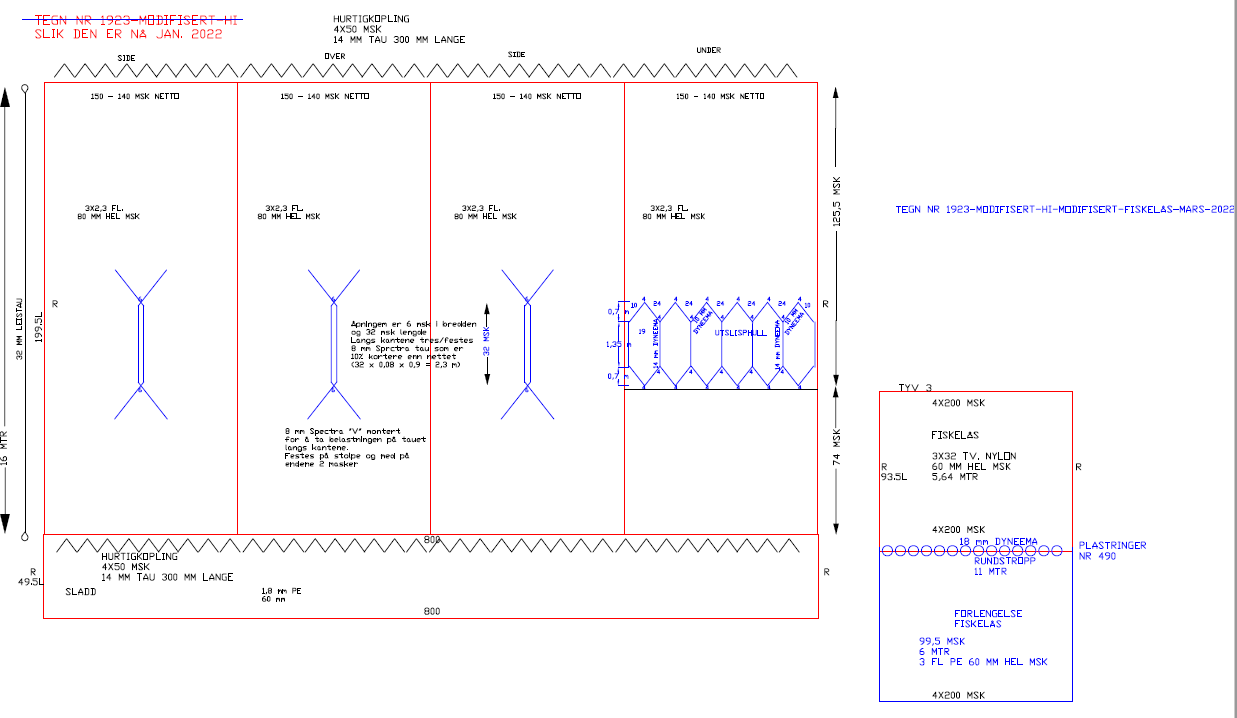
17 - Appendix D – Bycatch Release Section – Net drawing