Stock Name: Northeast Arctic Greenland halibut (ICES areas 1 and 2)
Advice on fishing opportunities
The Joint Russian-Norwegian Working Group on Arctic Fisheries (JRN-AFWG) advises that when the MSY approach is applied, catches in 2025 should be no more than 12 431 tonnes, and catches in 2026 should be no more than 14 891 tonnes.
Stock development over time
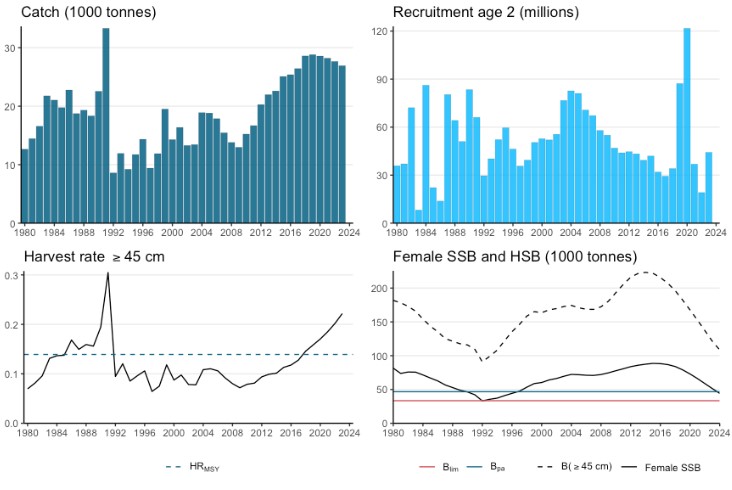
The female spawning stock biomass (SSB) is below Bpa, above Blim, and declining. Total harvestable biomass (≥45 cm, HSB) is in a rapid decline. Harvest rate is increasing and is now well above the HRMSY. Since the female SSB is below Bpa, advised fishing mortality is reduced consistent with the MSY approach.
Catch scenarios
The advice for 2025 and 2026 is lower than the advice for 2024 due to high fishing pressure resulting in decreasing stock size and the female SSB stock being under Bpa.
| Variable | Value | Notes |
|---|---|---|
| Harvest rate ≥ 45 cm (2024) | 0.2 12 | Based on expected catch in 2024. |
| Biomass ≥ 45 cm (2025) | 106 039 | Beginning of 202 5. |
| Female SSB (2025) | 39 462 | Beginning of 202 5. |
| Recruitment age 1 (2024 -2026) | 50 972 | Average 1990-2017 recruitment. Does not influence short-term forecast . |
| Assumed catch (2024) | 23 050 | TAC for 2024 plus mean catch above TAC 2018-2023 (1800 t). |
| Basis | Total catch (2025) | HR (2025) | SSB (2026) | % SSB change* | % TAC change** | % Advice change*** |
|---|---|---|---|---|---|---|
| Advice basis | ||||||
| MSY approach: HRMSY x SSB 2025 /Bpa | 12 431 | 0.117 | 41 231 | 4.5 | -42 | - 20 |
| Other scenarios | ||||||
| HRMSY | 14 726 | 0.139 | 40 214 | 1.9 | -31 | -5.4 |
| HR=0 | 0 | 0 | 46 739 | 18 | -100 | -100 |
| Assumed catch in 2024 | 23 050 | 0.217 | 35 756 | -9.4 | 8.5 | 48 |
* SSB start of 2026 relative to end of 2024.
** Advice value for 2025 relative to the TAC value in 2024 (21 250 tonnes).
*** Advice value for 202 5 relative to the advice value for 202 4 (15 560 tonnes) .
| Basis | Total catch (2026) | HR (2026) | SSB (2027) | % SSB change* | % TAC change** | % Advice change*** |
|---|---|---|---|---|---|---|
| Advice basis | ||||||
| MSY approach: HR MSY x SSB 2026 /B pa | 14 891 | 0.123 | 43 042 | 9.1 | -30 | -4.3 |
| Other scenarios | ||||||
| HR MSY | 16 538 | 0.139 | 41 278 | 4.6 | -22 | 6.3 |
| HR=0 | 0 | 0 | 55 330 | 40 | -100 | -100 |
| Assumed catch in 2024 | 23 050 | 0.209 | 33 330 | -16 | 8.5 | 48 |
* SSB start of 2027 relative to end of 2024, i.e the cumulative change over the 2-year advice period.
** Advice value for 2026 relative to the TAC value in 2024 (21 250 tonnes).
*** Advice value for 202 6 relative to the advice value for 202 4 (15 560 tonnes) .
Basis of the advice
| Advice basis | MSY |
|---|---|
| Management plan | There is no agreed precautionary management plan for Greenland halibut in this area. |
Quality of the assessment
There was an ICES benchmark between the 2021 and 2023 assessment. The new assessment (including age data) results in considerably lower biomass levels and higher harvest rate, but the trends and catch advice are similar. This revision suggests that the stock is more impacted by the current level of catch above advice than was previously believed. In the 2021 assessment the biomass trends were considered reliable, but the absolute level of biomass was considered highly uncertain. Although the inclusion of age data is likely to have improved the estimation of absolute biomass, this should still be considered uncertain.
Peaks in recruitment were most likely exaggerated in the previous assessment model. There is evidence for a good recruitment event in 2019, although the magnitude of this is still uncertain.
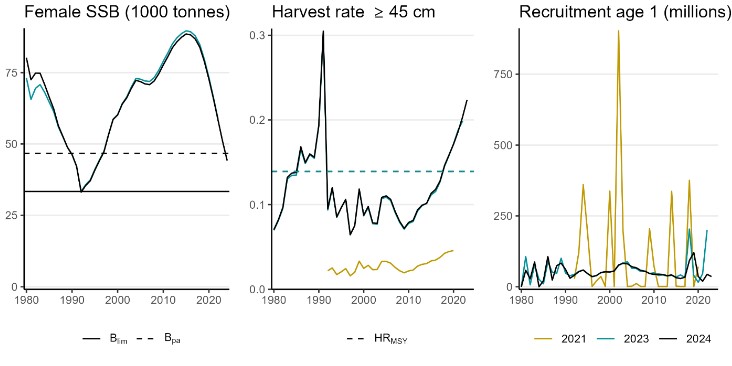
The 2024 assessment is consistent with the 2023 assessment and continues along the expected trends (Figure 2).
Issues relevant for the advice
Due to the temporary suspension of Russian scientists from ICES, this assessment was conducted by a Joint Russian-Norwegian Arctic Fisheries Working Group (JRN-AFWG) consisting of scientists from VNIRO (Russia) and IMR (Norway) (Howell et al., 2024). This advice has been conducted outside ICES and should not be considered as ICES advice. However, the assessment has been produced following the methodology agreed at the ICES benchmark in 2023 (ICES, 2023).
Higher bycatch rates of Greenland halibut recently observed in the Norwegian cod and haddock fisheries may be partly to do with shifting distribution of those fisheries rather than Greenland halibut stock trends. Catch per unit of effort of the Russian target Greenland halibut fishery along the continental slope and bycatches in the Barents Sea do not show obvious downward trends during the last decade.
Greenland halibut is a long-lived species which requires low fishing pressure – the stock is currently declining and has dropped below Bpa. Due to the long lifespan and the key survey being run every second year, the advice is given on a two-year basis.
The Greenland halibut population extends past the Joint Norwegian Russian Fisheries Commission (JNRFC) domain and surveys considered in the assessment do not cover the entire distribution.
Note that the advice presented here covers the JNRFC managed area as well as international waters in the Barents Sea and British waters in ICES area 2. Therefore, the advice presented here covers all those catches.
Reference points
| Framework | Reference point | Value | Technical basis | Source |
|---|---|---|---|---|
| MSY approach | MSY | 19 142 tonnes | Maximum sustainable yield (long term) | (ICES, 2023; Howell et al. 2023) |
| HRMSY | 0.139 | HR ( ≥ 45cm) leading to MSY | (ICES, 2023); Howell et al. 2023) | |
| Precautionary approach | Blim | 33 391 tonnes | Lowest modelled mature female sub-stock biomass | (ICES, 2023; Howell et al. 2023) |
| Bpa | 46 747 tonnes | B lim x 1.4 (female SSB) | (ICES, 2023; Howell et al. 2023) | |
| Btrigger | 46 747 tonnes | B pa (female SSB) | (ICES, 2023; Howell et al. 2023) | |
| HRlim | 0.165 | HR ( ≥ 45cm) leading to P(SSB<B lim )=0.5 | (ICES, 2023; Howell et al. 2023) | |
| HRpa | 0.145 | HR( ≥ 45cm), when the ICES Advice Rule is applied, leading to P(SSB < Blim) = 0.05 | (ICES, 2023; Howell et al. 2023) |
Basis of the assessment
| ICES stock data category | 1 |
|---|---|
| Assessment type | Age–length-structured (Gadget model). |
| Input data | Trends in biomass for five survey indices from three surveys: the Norwegian slope survey (G1165), the Russian autumn bottom trawl survey at the slope (G5348), and three survey indices from the Ecosystem survey (10-17 cm, 18-27 cm and 28-65 cm). Length distributions from these three surveys and from the Joint winter survey (A6996) and the Norwegian slope survey in spring (G5678); catch-in-tonnes from five aggregated commercial fleets (Russian, trawl and minor gears; Russian, gillnet and longline; Norwegian, trawl and minor gears; Norwegian, gillnet and longline; 3rd countries); age and maturity-at-length data from the Norwegian slope survey (G1165). |
| Discards and bycatch | Not included, considered negligible. |
| Other information | Last assessment update from ICES benchmark in February 2023 (ICES, 2023) used by JRN-AFWG 2023. |
| Working group | Joint Russian-Norwegian working group on Arctic Fisheries (JRN-AFWG). |
History of the advice, catch, and management
| Year | ICES advice | Predicted catch corresponding to advice | Agreed TAC – Norway/JNRFC | TAC to Norway–UK/EU zone^ in ICES subareas 2 and 6 combined ^^ | ICES catches |
|---|---|---|---|---|---|
| 1987 | Precautionary TAC | - | - | 18 744 | |
| 1988 | No decrease in SSB | 19 000 | - | 19 322 | |
| 1989 | F = F(87); TAC | 21 000 | - | 18 353 | |
| 1990 | F = F(8 9 ); TAC | 15 000 | - | 22 555 | |
| 1991 | F at Fmed; TAC; improved expl. pattern | 9 000 | - | 33 318 | |
| 1992 | 2 Rebuild SSB(1991) | 6 000 | 7 000* | 8 603 | |
| 1993 | TAC | 7 000 | 7 000* | 11 932 | |
| 1994 | F<0.1 | <12 000 | 11 000* | 9 226 | |
| 1995 | No fishing | 0 | 2 500** | 11 734 | |
| 1996 | No fishing | 0 | 2 500** | 14 347 | |
| 1997 | No fishing | 0 | 2 500** | 9 410 | |
| 1998 | No fishing | 0 | 2 500** | 11 893 | |
| 1999 | No fishing | 0 | 2 500** | 19 517 | |
| 2000 | No fishing | 0 | 2 500** | 14 297 | |
| 2001 | Reduce catch to rebuild stock | <11 000 | 2 500** | 16 374 | |
| 2002 | Reduce F substantially | <11 000 | 2 500** | 13 293 | |
| 2003 | Reduce catch to increase stock | <13 000 | 2 500** | 13 446 | |
| 2004 | Do not exceed recent low catches | <13 000 | 2 500** | 18 900 | |
| 2005 | Do not exceed recent low catches | <13 000 | 2 500** | 18 834 | |
| 2006 | Do not exceed recent low catches | <13 000 | 2 500** | 17 876 | |
| 2007 | Reduce catch to increase stock | <13 000 | 2 500** | 15 458 | |
| 2008 | Reduce catch to increase stock | <13 000 | 2 500** | 13 809 | |
| 2009 | Same advice as previous year | <13 000 | 2 500** | 12 982 | |
| 2010 | Same advice as previous year | <13 000 | 15 000*** | 350 | 15 235 |
| 2011 | Same advice as previous year | <13 000 | 15 000*** | 350 | 16 684 |
| 2012 | No increase in catches | <15 000 | 18 000*** | 350 | 20 284 |
| 2013 | No increase in catches | <15 000 | 18 000*** | 824 | 21 980 |
| 2014 | No new advice, same as for 2013 | <15 000 | 18 000*** | 1000 | 22 611 |
| 2015 | Same as for 2014 | <15 000 | 18 000*** | 1000 | 25 081 |
| 2016 | Precautionary approach | <19 800 | 22 000*** | 1100 | 25 385 |
| 2017 | Same advice as previous year | <19 800 | 24 000*** | 1100 | 26 437 |
| 2018 | Precautionary approach | <23 000 | 27 000*** | 1100 | 28 600 |
| 2019 | Same advice as previous year | <23 000 | 27 000*** | 1250 | 28 823 |
| 2020 | Precautionary approach | <23 000 | 27 000*** | 1250 | 28 572 |
| 2021 | Same advice as previous year | <23 000 | 27 000*** | 0 | 28 216 |
| 2022 | Precautionary approach | ≤ 19 094 | 25 000*** | 600 | 27 655 |
| 2023 | Precautionary approach | ≤ 18 494 | 25 000*** | 700 | 26 931 |
| 2024 | MSY approach^^^ | ≤ 15 560 | 21 250*** | 600 | |
| 2025 | MSY approach^^^ | ≤ 12 431 | |||
| 2026 | MSY approach^^^ | ≤ 14 891 |
* Set by Norwegian authorities.
** Set by Norwegian authorities for the non-trawl fishery; allowable bycatch in the trawl fishery is additional to this.
*** Set by the Joint Norwegian-Russian Fisheries Commission (JNRFC).
^ UK after 2020.
^^ Part of this TAC is taken in the assessment area.
^^^ In 2023 and 2024 the assessment and the advice were carried out by the Joint Russian-Norwegian working group on Arctic fisheries (JRN-AFWG) which compiled catches for 2021-2023 and gave advice for 2023-2026.
History of catch and landings
| Year | Denmark | Estonia | Faroe Islands | Germany | France | Greenland | Iceland | Ireland | Latvia | Lithuania | Norway | Poland | Portugal | Russia | Spain | United Kingdom | Total |
|---|---|---|---|---|---|---|---|---|---|---|---|---|---|---|---|---|---|
| 1984 | 0 | 0 | 0 | 2 165 | 138 | 0 | 0 | 0 | 0 | 0 | 3 540 | 0 | 0 | 15 181 | 0 | 23 | 21 047 |
| 1985 | 0 | 0 | 0 | 4 000 | 239 | 0 | 0 | 0 | 0 | 0 | 5 287 | 0 | 0 | 10 237 | 0 | 5 | 19 768 |
| 1986 | 0 | 0 | 42 | 2 718 | 13 | 0 | 0 | 0 | 0 | 0 | 7 783 | 0 | 0 | 12 200 | 0 | 12 | 22 768 |
| 1987 | 0 | 0 | 0 | 2 024 | 13 | 0 | 0 | 0 | 0 | 0 | 6 893 | 0 | 0 | 9 733 | 0 | 81 | 18 744 |
| 1988 | 0 | 0 | 186 | 744 | 67 | 0 | 0 | 0 | 0 | 0 | 8 811 | 0 | 0 | 9 430 | 0 | 84 | 19 322 |
| 1989 | 0 | 0 | 67 | 600 | 31 | 0 | 0 | 0 | 0 | 0 | 8 837 | 0 | 0 | 8 812 | 0 | 6 | 18 353 |
| 1990 | 0 | 0 | 163 | 954 | 49 | 0 | 0 | 0 | 0 | 0 | 11 615 | 0 | 0 | 4 764 | 0 | 10 | 22 555 |
| 1991 | 11 | 2 564 | 314 | 101 | 119 | 0 | 0 | 0 | 0 | 0 | 27 585 | 0 | 0 | 2 490 | 132 | 2 | 33 318 |
| 1992 | 0 | 0 | 16 | 13 | 111 | 13 | 0 | 0 | 0 | 0 | 7 668 | 0 | 31 | 718 | 23 | 10 | 8 603 |
| 1993 | 2 | 0 | 61 | 22 | 80 | 8 | 56 | 0 | 0 | 30 | 10 379 | 0 | 43 | 1 235 | 0 | 16 | 11 932 |
| 1994 | 4 | 0 | 18 | 296 | 55 | 3 | 15 | 5 | 0 | 4 | 8 428 | 0 | 36 | 283 | 1 | 78 | 9 226 |
| 1995 | 0 | 0 | 12 | 35 | 174 | 12 | 25 | 2 | 0 | 0 | 9 368 | 0 | 84 | 794 | 1 106 | 122 | 11 734 |
| 1996 | 0 | 0 | 2 | 81 | 219 | 123 | 70 | 0 | 0 | 0 | 11 623 | 0 | 79 | 1 576 | 200 | 374 | 14 347 |
| 1997 | 0 | 0 | 27 | 56 | 253 | 0 | 62 | 2 | 0 | 0 | 7 661 | 12 | 50 | 1 038 | 157 | 92 | 9 410 |
| 1998 | 0 | 0 | 57 | 34 | 67 | 0 | 23 | 2 | 0 | 0 | 8 435 | 31 | 99 | 2 659 | 259 | 227 | 11 893 |
| 1999 | 0 | 0 | 94 | 34 | 0 | 38 | 7 | 2 | 0 | 0 | 15 004 | 8 | 49 | 3 823 | 319 | 139 | 19 517 |
| 2000 | 0 | 0 | 0 | 15 | 45 | 0 | 16 | 1 | 0 | 0 | 9 083 | 3 | 37 | 4 568 | 375 | 154 | 14 297 |
| 2001 | 0 | 0 | 0 | 58 | 122 | 0 | 18 | 1 | 0 | 0 | 10 896 | 2 | 35 | 4 694 | 418 | 130 | 16 374 |
| 2002 | 0 | 219 | 0 | 42 | 7 | 22 | 4 | 6 | 0 | 0 | 7 143 | 5 | 14 | 5 584 | 178 | 69 | 13 293 |
| 2003 | 0 | 0 | 459 | 18 | 2 | 14 | 0 | 1 | 0 | 0 | 8 215 | 5 | 19 | 4 384 | 230 | 99 | 13 446 |
| 2004 | 0 | 0 | 0 | 9 | 0 | 0 | 10 | 0 | 0 | 0 | 13 939 | 1 | 50 | 4 662 | 186 | 43 | 18 900 |
| 2005 | 0 | 170 | 0 | 8 | 32 | 0 | 0 | 0 | 0 | 0 | 13 011 | 0 | 23 | 4 883 | 660 | 47 | 18 834 |
| 2006 | 0 | 0 | 204 | 8 | 46 | 0 | 8 | 0 | 0 | 196 | 11 118 | 201 | 26 | 6 055 | 2 | 12 | 17 876 |
| 2007 | 0 | 0 | 203 | 8 | 40 | 198 | 15 | 0 | 0 | 0 | 8 230 | 200 | 50 | 6 484 | 11 | 19 | 15 458 |
| 2008 | 0 | 0 | 663 | 5 | 41 | 0 | 28 | 0 | 0 | 0 | 7 393 | 201 | 46 | 5 294 | 112 | 26 | 13 809 |
| 2009 | 0 | 0 | 422 | 19 | 16 | 16 | 15 | 2 | 0 | 0 | 8 446 | 204 | 237 | 3 335 | 202 | 68 | 12 982 |
| 2010 | 0 | 0 | 272 | 14 | 102 | 15 | 16 | 0 | 0 | 0 | 7 700 | 3 | 11 | 6 888 | 188 | 26 | 15 235 |
| 2011 | 0 | 0 | 538 | 80 | 46 | 4 | 7 | 0 | 0 | 234 | 8 348 | 169 | 21 | 7 053 | 144 | 40 | 16 684 |
| 2012 | 0 | 0 | 563 | 40 | 40 | 12 | 13 | 0 | 0 | 0 | 9 331 | 22 | 1 | 10 041 | 186 | 35 | 20 284 |
| 2013 | 0 | 0 | 783 | 49 | 168 | 22 | 106 | 1 | 0 | 0 | 10 404 | 30 | 7 | 10 306 | 12 | 92 | 21 980 |
| 2014 | 0 | 0 | 887 | 33 | 269 | 24 | 86 | 0 | 0 | 0 | 10 997 | 19 | 0 | 10 061 | 23 | 212 | 22 611 |
| 2015 | 0 | 0 | 724 | 33 | 230 | 16 | 98 | 0 | 0 | 0 | 10 874 | 13 | 1 | 12 953 | 25 | 114 | 25 081 |
| 2016 | 2 | 353 | 1 078 | 9 | 229 | 18 | 75 | 0 | 0 | 0 | 12 932 | 26 | 19 | 10 561 | 27 | 56 | 25 385 |
| 2017 | 0 | 523 | 993 | 21 | 177 | 26 | 10 | 0 | 3 | 72 | 13 741 | 26 | 13 | 10 713 | 36 | 83 | 26 437 |
| 2018 | 2 | 574 | 401 | 50 | 150 | 20 | 24 | 0 | 0 | 206 | 14 875 | 27 | 6 | 12 071 | 60 | 134 | 28 600 |
| 2019 | 0 | 588 | 350 | 44 | 105 | 23 | 10 | 0 | 0 | 348 | 14 867 | 122 | 8 | 12 196 | 87 | 75 | 28 823 |
| 2020 | 1 | 579 | 514 | 73 | 39 | 48 | 19 | 0 | 0 | 261 | 14 526 | 97 | 9 | 12 265 | 96 | 45 | 28 572 |
| 2021 | 1 | 382 | 749 | 88 | 137 | 14 | 0 | 0 | 0 | 125 | 14 008 | 14 | 0 | 12 396 | 125 | 177 | 28 216 |
| 2022* | 0 | 253 | 1 055 | 94 | 85 | 47 | 27 | 0 | 75 | 136 | 13 800 | 0 | 60 | 11 746 | 163 | 114 | 27 655 |
| 2023* | 1 | 98 | 1 017 | 82 | 60 | 14 | 32 | 0 | 84 | 75 | 13 919 | 0 | 97 | 11 317 | 72 | 63 | 26 931 |
*Provisional figures.
Summary of the assessment
| Year | Recruitment (age 2) | Female SSB | Total Biomass | Biomass ( ≥45 cm ) | Catches | Harvest rate |
|---|---|---|---|---|---|---|
| Thousands | Tonnes | |||||
| 1980 | 35 895 | 81 586 | 219 238 | 181 791 | 12 655 | 0.070 |
| 1981 | 37 050 | 73 723 | 216 067 | 178 241 | 14 466 | 0.081 |
| 1982 | 72 173 | 75 875 | 211 915 | 172 986 | 16 580 | 0.096 |
| 1983 | 8 242 | 75 664 | 205 884 | 165 889 | 21 773 | 0.131 |
| 1984 | 86 207 | 71 523 | 196 057 | 154 148 | 21 047 | 0.137 |
| 1985 | 22 201 | 66 968 | 187 790 | 143 719 | 19 768 | 0.138 |
| 1986 | 13 843 | 62 647 | 181 060 | 135 284 | 22 768 | 0.168 |
| 1987 | 80 378 | 56 705 | 172 248 | 125 386 | 18 744 | 0.149 |
| 1988 | 64 201 | 52 835 | 168 599 | 121 332 | 19 322 | 0.159 |
| 1989 | 51 049 | 48 931 | 165 604 | 117 639 | 18 353 | 0.156 |
| 1990 | 83 448 | 46 368 | 165 254 | 115 893 | 22 555 | 0.195 |
| 1991 | 66 130 | 42 146 | 162 459 | 109 314 | 33 318 | 0.305 |
| 1992 | 29 620 | 33 151 | 150 007 | 90 883 | 8 603 | 0.095 |
| 1993 | 40 229 | 35 514 | 162 728 | 99 101 | 11 932 | 0.120 |
| 1994 | 52 212 | 37 202 | 172 115 | 108 087 | 9 226 | 0.085 |
| 1995 | 59 613 | 40 936 | 184 117 | 122 102 | 11 734 | 0.096 |
| 1996 | 46 329 | 44 273 | 193 299 | 135 438 | 14 347 | 0.106 |
| 1997 | 35 737 | 47 425 | 199 176 | 146 155 | 9 410 | 0.064 |
| 1998 | 39 419 | 53 390 | 209 089 | 158 541 | 11 893 | 0.075 |
| 1999 | 50 467 | 58 752 | 215 645 | 165 171 | 19 517 | 0.118 |
| 2000 | 52 797 | 60 320 | 213 986 | 163 561 | 14 297 | 0.087 |
| 2001 | 52 051 | 64 079 | 217 178 | 167 825 | 16 374 | 0.098 |
| 2002 | 55 564 | 66 286 | 218 223 | 169 678 | 13 293 | 0.078 |
| 2003 | 76 701 | 69 571 | 222 851 | 172 790 | 13 446 | 0.078 |
| 2004 | 82 649 | 72 330 | 228 419 | 174 390 | 18 900 | 0.108 |
| 2005 | 81 080 | 71 875 | 230 121 | 170 894 | 18 834 | 0.110 |
| 2006 | 70 707 | 71 076 | 233 482 | 168 643 | 17 876 | 0.106 |
| 2007 | 67 231 | 70 827 | 239 157 | 168 522 | 15 458 | 0.092 |
| 2008 | 57 954 | 72 109 | 247 942 | 172 319 | 13 809 | 0.080 |
| 2009 | 54 996 | 74 628 | 258 557 | 180 665 | 12 982 | 0.072 |
| 2010 | 46 952 | 77 749 | 269 562 | 193 176 | 15 235 | 0.079 |
| 2011 | 43 941 | 80 638 | 277 260 | 205 398 | 16 684 | 0.081 |
| 2012 | 44 675 | 83 774 | 282 165 | 216 095 | 20 284 | 0.094 |
| 2013 | 43 353 | 85 867 | 281 969 | 221 658 | 21 980 | 0.099 |
| 2014 | 39 358 | 87 434 | 278 503 | 223 275 | 22 611 | 0.101 |
| 2015 | 41 993 | 88 581 | 273 014 | 221 870 | 25 081 | 0.113 |
| 2016 | 31 983 | 88 260 | 263 672 | 215 643 | 25 385 | 0.118 |
| 2017 | 29 363 | 86 822 | 252 705 | 207 095 | 26 437 | 0.128 |
| 2018 | 34 120 | 83 989 | 239 555 | 196 170 | 28 600 | 0.146 |
| 2019 | 87 254 | 79 042 | 224 418 | 182 286 | 28 823 | 0.158 |
| 2020 | 121 739 | 72 934 | 211 093 | 167 595 | 28 572 | 0.170 |
| 2021 | 36 906 | 66 116 | 199 934 | 152 589 | 28 216 | 0.185 |
| 2022 | 19 152 | 58 729 | 190 316 | 137 055 | 27 655 | 0.202 |
| 2023 | 44 241 | 51 351 | 182 706 | 121 421 | 26 931 | 0.222 |
| 2024 | 44 188 | 175 847 | 108 473 | |||
References
Howell, D., Bogstad, B., Chetyrkin, A., Fall, J., Filin, A., Hallfredsson, E. H., et al. (2023). Report of the Joint Russian-Norwegian Working Group on Arctic Fisheries (JRN-AFWG) 2023. IMR-PINRO 2023-7 Available at: https://www.hi.no/hi/nettrapporter/imr-pinro-en-2023-7.
Howell et al. 2024. Report of the Joint Russian-Norwegian Working Group on Arctic Fisheries (JRN-AFWG). IMR PINRO 2024-7. https://www.hi.no/hi/nettrapporter/imr-pinro-en-2024-7
ICES (2023). Benchmark workshop on Greenland halibut and redfish stocks (WKBNORTH). ICES Scientific Reports doi:10.17895/ICES.PUB.22304638.V1.